

Abstract
Lyme disease and other tick-borne diseases are a major public health threat in the Upper Midwestern United States, including Michigan, Minnesota, and Wisconsin. To prevent tick bites and tick-borne diseases, public health officials commonly recommend personal protective measures and property management techniques. Adoption of tick-borne disease prevention behaviors and practices by individuals are, however, highly variable. We aimed to characterize current tick-borne disease knowledge, attitudes, and prevention behaviors (KAB) practiced by the public in these states, as well as their willingness to use specific tick control methods. We conducted a population-based survey in summer 2019 in 48 high-risk counties (those having a five-year average (2013–2017) Lyme disease incidence of ≥ 10 cases per 100,000 persons per year), in Michigan, Minnesota, and Wisconsin. A total of 2713 surveys were analyzed; survey weights were used to account for household selection probability and post-stratified to match county-level joint age and sex population distributions in population-level inference. An estimated 98% of the population had heard of Lyme disease, with most perceiving it as very or extremely serious (91%); however, only an estimated 25% perceived tick-borne diseases as very or extremely common in their community. Among those who spent time in places with ticks from April through October, an estimated 68% check themselves thoroughly for ticks most of the time or always and 43% use bug repellent on skin or clothing most of the time or always. An estimated 13% of the population had ever treated their property with a pesticide to kill ticks, and 3% had ever used devices that apply pesticide to rodents to kill ticks on their property. Willingness to practice tick bite prevention behaviors, however, was estimated to be much higher; with 82% being willing to perform tick checks at least once a day, and more than 60% willing to use bug repellent, tick control products on pets, or to bathe within two hours of being outdoors. We found that residents would likely be willing to support a county-wide tick control program to reduce the risk of tick-borne disease in their community (81%) or to apply tick control products to their property to reduce the risk of tickborne disease in their household (79%). Tick checks were more likely to be practiced among participants who perceived tick-borne diseases to be highly prevalent in their community, if they or a household member had been previously diagnosed with a tick-borne disease?, or if they perceived tick exposure to be likely around their home, cabin, or vacation home. In addition, property-based tick control methods were associated with perceived risk of encountering ticks around the home, cabin, or vacation home. Participants who had seen information from state health departments were also more likely to practice preventive measures. The most common reported barriers to using any of these methods were forgetfulness, safety concerns, and lack of awareness. Our survey findings shed light on how residents from these Upper Midwest states may adopt tick control and tick bite prevention measures and how public health outreach may be most effective for this population.
Keywords: Lyme disease, Ticks, Tick-borne diseases, Prevention, Behaviors, Upper Midwest
1. Introduction
Lyme disease and other tick-borne diseases are a major public health problem in select areas of the United States, including in the Upper Midwest states of Michigan, Minnesota, and Wisconsin (Fleshman et al., 2021; Kugeler et al., 2021; Rosenberg et al., 2018). Lyme disease, caused by Borrelia burgdorferi sensu stricto or Borrelia mayonii, is transmitted through the bite of Ixodes scapularis (blacklegged) ticks in the eastern and upper midwestern United States and represents the overwhelming majority of national tick-borne disease cases (Rosenberg et al., 2018). Pathogens that cause anaplasmosis, babesiosis, hard tick relapsing fever (a.k.a. Borrelia miyamotoi disease), Powassan virus disease, and ehrlichiosis associated with Ehrlichia muris eauclairensis are also transmitted by blacklegged ticks (Eisen and Eisen, 2018; Rosenberg et al., 2018). In addition, while diseases spread by other tick species are rare in this region, Dermacentor variabilis can transmit pathogens that cause tularemia and Rocky Mountain spotted fever, and Amblyomma americanum can transmit pathogens that cause tularemia and ehrlichiosis (Minnesota Department of Health, 2019; University of Wisconsin-Madison, 2021).
Prevention of tick bites and tick-borne disease relies primarily on personal protection measures. The most common public health recommendations include daily tick checks, showering or bathing as soon as possible after being in or around tick habitat, and using tick repellent products registered by the United States Environmental Protection Agency (EPA) (Eisen and Dolan, 2016; Eisen and Stafford, 2021). Although these methods can be highly effective for preventing tick attachment and removing ticks in a timely fashion, adoption of these behaviors is variable (Butler et al., 2016; Corapi et al., 2007; Hook et al., 2015; Niesobecki et al., 2019). In addition, a vaccine to prevent Lyme disease was available beginning in 1998 but has not been used since 2002, when the manufacturer voluntarily withdrew it from the market (Hanson and Edelman, 2003; Shen et al., 2011). Currently, no vaccine is available for people in the United States to prevent Lyme disease, although research is ongoing for a new Lyme disease vaccine (Gomes--Solecki et al., 2020). Property management techniques are recommended by public health officials to reduce tick densities and include landscaping to reduce tick habitat, applying acaricidal treatments directly to vegetation or small mammal hosts, and maintaining trails (Eisen and Dolan, 2016). Unfortunately, large-scale tick-borne disease prevention efforts using these methods are often not feasible due to financial, environmental, or logistical concerns (Eisen, 2021; Eisen and Eisen, 2018). Further research is needed to quantify the rates of adoption of personal and residential property-based protective behaviors, identify factors that drive these decisions and barriers to their implementation, and develop public health messaging that is the most effective at motivating behavioral change (Bron et al., 2020; Butler et al., 2016; Hornbostel et al., 2021). Information regarding tick bite prevention behaviors is especially needed to inform public health outreach efforts in high-incidence and emerging Lyme disease areas of the Upper Midwest.
Although the Upper Midwest accounts for some of the earliest documented cases of disease caused by B. burgdorferi sensu lato (Scrimenti, 1970) and B. mayonii (Pritt et al., 2016), as well as other tick-borne pathogens such as Anaplasma phagocytophilum (Bakken and Dumler, 2006) and E. muris eauclairensis (Pritt et al., 2017), to date very few studies regarding tick-borne disease prevention in this area have been published (Bron et al., 2020; Hook et al., 2015; Kianersi et al., 2020; Schotthoefer et al., 2020). Most available information on knowledge, attitudes, and behaviors regarding tick bite prevention and tick-borne diseases is from the Northeast and Mid-Atlantic states (Gupta et al., 2018; Niesobecki et al., 2019). However, many factors make the Upper Midwest unique and findings across other geographic regions may or may not be comparable. For example, “cabin culture” is common in the Upper Midwest, with residents frequently visiting vacation and secondary properties throughout the summer, which can result in high but sporadic risk for tick exposure (Minnesota Department of Health unpublished). In addition, I. scapularis is still emerging across the landscape in parts of the Upper Midwest (Eisen et al., 2016), creating pockets of unfamiliarity and misinformation about ticks and tick-borne diseases. As a result, knowledge of tick bite prevention methods and tick control products may be very different from state to state and even from town to town. These factors have made it difficult for public health officials and health care professionals to communicate tick-borne disease risk within and across the region adequately, while instilling the appropriate level of awareness and education among residents and visitors (Nesgos et al., 2021).
Bridging from work previously done in the Northeast and Mid-Atlantic (Niesobecki et al., 2019), the overall objective of this study was to characterize current tick-borne disease knowledge, attitudes, and prevention behaviors (KAB) practiced by the public in three states of the Upper Midwest, including their willingness to use specific tick control methods. Collection of baseline KAB data will aid in assessing what methods are most feasible and acceptable by the public in the Upper Midwest.
2. Materials and methods
2.1. Survey design
Using a cross-sectional design, a population-based survey was conducted in the summer of 2019 in select counties of Michigan, Minnesota, and Wisconsin. In each of the three states, recruitment efforts targeted “high risk” counties, defined as those having a five-year average (2013–2017) Lyme disease incidence of ≥ 10 cases per 100,000 persons per year. In 2018, Minnesota and Wisconsin were two of 16 states with “high incidence” of confirmed Lyme disease cases reporting 17 and 19 confirmed cases per 100,000 persons, respectively (Centers for Disease Control and Prevention, 2019). Michigan is currently classified as a “low incidence” state with two confirmed cases per 100,000 persons reported in 2018, although high incidence counties exist in focal areas of the western Lower and Upper Peninsulas, and geographic expansion of I. scapularis and Lyme disease in this state has raised concern about increases in tick-borne diseases (Lantos et al., 2017). The number of counties targeted per state totaled 59 of 72 (82%) counties in Wisconsin, 49 of 87 (56%) counties in Minnesota, and 8 of 83 (10%) counties in Michigan (Appendix A). A total of 13,300 addresses per state were mailed invitations to undertake the survey to achieve a minimum sample size of 659 participants per state, or 1977 participants total. Sample size was calculated based on an expected 50% of participants that would be willing to regularly use any method to prevent tick bites and tick-borne diseases, with a 99% confidence interval, an acceptable error rate of +/− 5%, and a conservatively estimated 5% response rate. A random sample of addresses proportional to the number of residential addresses in each county was obtained from a marketing service company that used permanent registered postal addresses on record with the United States Postal Service (Marketing Systems Group, Horsham, PA, USA). Addresses categorized as seasonal residences, educational residences, drop sites, vacant properties, and Post Office (PO) Boxes were excluded from the sampling frame.
Invitations to take the survey were mailed in early July 2019, coinciding with the peak of tick-borne disease cases known to occur in the Upper Midwest (Hamer et al., 2012; Michigan Department of Health and Human Services, 2015; Minnesota Department of Health, 2020; Schwartz et al., 2017; Wisconsin Department of Health Services, 2019). Participants were required to be at least 18 years of age and the adult in the household with the most recent birthday, with the latter criterion used to approximate random sampling. Participants were asked to complete a web-based survey of approximately five to 10 min duration that was available in English only. They could request to take the survey by phone, administered by study investigators. Data were collected using Research Electronic Data Capture (REDCap) software (Vanderbilt University, Nashville, TN, USA) hosted at the Minnesota Department of Health. Access to the survey was available for one month or until a quota of 1000 survey participants per state was reached. A reminder postcard invitation was mailed two weeks after the initial survey invitation to Wisconsin residents only. After completion of the survey, participants were sent a thank-you letter with a $10 gift card to a retail store either by mail or e-mail, according to participant preference.
The survey consisted of five sections and included questions on the following: actual and perceived risk of tick bites and knowledge of tickborne diseases (Section 1); current use of tick-borne disease prevention behaviors and barriers to performing them (Section 2); willingness to perform tick-borne disease prevention behaviors, to use environmental tick control methods, and to support and pay for a community-based tick control program (Section 3); educational outreach preferences (Section 4); and demographic characteristics about the participant and their household (Section 5). Questions consisted of a mixture of binary, multiple choice, check-all-that-apply, open-ended, and 5-category Likert scale formats (Appendix B). The study protocol was reviewed and approved by Institutional Review Boards and ethics committees at the Centers for Disease Control and Prevention, Michigan Department of Health and Human Services, Michigan State University, Minnesota Department of Health, and the University of Wisconsin-Madison.
2.2. Data analysis
Survey weights were created to account for household selection probability and were calculated by multiplying the inverse of the number of households surveyed per county by the total number of households in the county according to American Community Survey 2018 five-year estimates (United States Census Bureau, 2021). The survey weights were calibrated using post-stratification to match county-level joint age and sex population distributions. Survey responses lacking a Federal Information Processing Standards (FIPS) code, age, or sex were removed to allow for post-stratification. Any county-level joint age and sex categories that did not contain any survey participants were also removed in the post-stratification calibration. All analyses incorporated the weights; unweighted frequencies pertaining to the survey sample are reported in the text while inferential statements to the population of interest (weighted percentages) are reported parenthetically.
Statistical analyses of survey responses were conducted using SAS v. 9.4 (SAS Inc., Cary, NC, USA), and all analyses incorporated the survey design (stratum option for FIPS code) and weighting. Ordinal survey responses were condensed to two variables (e.g., five categories from “not at all likely” to “extremely likely” became “not at all/slightly/somewhat likely” and “very/extremely likely”). In the results section, to improve readability, the combined categories are described using the more conservative measures (e.g., very likely is used for very/extremely), unless stated otherwise. These recategorizations were chosen based on previous literature (Niesobecki et al., 2019) as well as on natural breaks and low frequencies in the data. Similarly, for comparability to previous literature (Niesobecki et al., 2019), age was categorized to 18–49 years and ≥50 years while annual household income was categorized to ≤$100,000 or >$100,000. Risk differences with corresponding confidence intervals were used to compare proportions. Chi-square tests without survey weights were used to analyze differences in demographic variables (age, sex, education, and annual income) among survey participants by state. Univariate logistic regression was used to identify variables associated with the outcomes of interest. Any variables significant at p < 0.20 were retained for multivariable regression. Missing responses for covariates of interest (i.e., age, sex, education, income, perceived prevalence of tick-borne diseases, perceived seriousness of Lyme disease, likelihood of contracting tick-borne disease, likelihood of encountering ticks on property, previous tick-borne disease diagnosis, and state) as well as missing responses for outcome variables (i.e., participant tick checks, bug repellent use, property pesticide use, and rodent device use) were excluded for completeness of data for each regression model. All regression models included an effect for state to recognize and adjust for differences in urbanicity and other factors (e.g., socioeconomic variables) across the three states. Self-reported occupation was described based on the United States Bureau of Labor Statistics 2018 Standard Occupational Classification System (U.S. Bureau of Labor Statistics, 2020).
3. Results
3.1. Survey sample
From the 116 “high risk” counties targeted, a total of 2878 participants from 111 counties submitted responses to the survey (7% response rate; range 0–17%) (Appendix A). Nine surveys were excluded due to ineligibility and 33 were excluded due to incomplete surveys that only answered eligibility questions, leaving 2836 completed survey submissions (n = 1000 in Wisconsin, n = 947 in Minnesota, and n = 889 in Michigan). Another 123 surveys (4%) were removed due to missing variables required for post-stratification, resulting in 2713 surveys included in the analyses (n = 925 in Minnesota, n = 922 in Wisconsin, and n = 866 in Michigan). There were no statistically significant differences with respect to age, sex, or outcomes of interest between Wisconsin participants who received a survey reminder (n = 216) as compared to participants from Wisconsin who did not (n = 784). Participants who took the survey by phone (n = 158) were significantly older, less likely to have a college degree or higher, and less likely to have an annual household income >$100,000 compared to participants who took the web-based survey (n = 2555). Given the small sample size, phone participants were pooled with online participants for analyses. No significant differences were found among states by study participant sex, although participants from Michigan were more likely to be >50 years of age (p < 0.001) and participants from Minnesota were more likely to have received some college education (p < 0.001) and earn an annual income >$100,000 (p < 0.0001).
3.2. Participant characteristics
There were 1635 female participants in the survey population (54%) and 1009 participants were 18–49 years of age (52%). Participants identified predominately as non-Hispanic (99%) and white (91%). The majority had received some education at a college level or higher (89%) and reported an annual household income ≤$100,000 (67%). Compared to census estimates for the counties surveyed, KAB participants had generally higher levels of education. There were slightly more female survey participants than represented by census data, and Hispanic participants as well as Asian and Black or African American participants were underrepresented (Table 1).
Table 1. Participant Demographics.
Demographic characteristics of the Upper Midwest Knowledge, Attitudes, and Prevention Behaviors (KAB) survey participants, by state of residence (Michigan (MI), Minnesota (MN), or Wisconsin (WI); United States), compared to 2018 American Community Survey (ACS) 5-year census estimates (2014–2018) of recruited counties. Post-stratified weights were calculated based on age and sex by county using 2018 ACS 5-year estimates. Note that post-stratified KAB percentages do not match age and sex census percentages due to lack of survey participants for every joint age and sex stratum for the population.
| MI KAB (%) | MI post- stratified KAB (%) | MI census (%) | MN KAB (%) | MN post- stratified KAB (%) | MN census (%) | WI KAB (%) | WI post- stratified KAB (%) | WI census (%) | Total KAB (%) | Total post- stratified KAB (%) | Total census (%) | |
|---|---|---|---|---|---|---|---|---|---|---|---|---|
|
| ||||||||||||
| Age (n = 2,713) | ||||||||||||
| 18–54 | 40.5 | 52.1 | 55.4 | 48.2 | 63.8 | 63.5 | 48.3 | 59.7 | 60.0 | 45.8 | 61.8 | 61.8 |
| ≥55 | 59.5 | 47.9 | 44.6 | 51.8 | 36.2 | 36.5 | 51.7 | 40.3 | 40.0 | 54.2 | 38.2 | 38.2 |
| Education (n = 2,683) * | ||||||||||||
| Some college or higher | 81.3 | 81.0 | 58.6 | 89.7 | 91.7 | 69.6 | 82.9 | 85.1 | 62.0 | 84.7 | 88.9 | 66.2 |
| High school diploma or less | 18.7 | 19.0 | 41.4 | 10.3 | 8.3 | 30.4 | 17.1 | 14.9 | 38.0 | 15.3 | 11.1 | 33.8 |
| Income (n = 2,194) | ||||||||||||
| ≤$100,000** | 83.4 | 82.0 | 82.4 | 67.3 | 62.5 | 67.0 | 77.0 | 73.1 | 74.4 | 75.7 | 67.0 | 70.6 |
| >$100,000 | 16.6 | 18.0 | 17.6 | 32.7 | 37.5 | 33.0 | 23.0 | 26.9 | 25.6 | 24.3 | 33.0 | 29.4 |
| Sex (n = 2,713) | ||||||||||||
| Female | 59.5 | 51.7 | 49.6 | 61.0 | 53.5 | 50.3 | 60.3 | 54.0 | 49.9 | 60.3 | 53.6 | 50.1 |
| Male | 40.5 | 48.3 | 50.4 | 39.0 | 46.5 | 49.7 | 39.7 | 46.0 | 50.1 | 39.7 | 46.4 | 49.9 |
| Ethnicity (n = 2,545) | ||||||||||||
| Hispanic | 1.0 | 1.1 | 3.7 | 1.0 | 1.0 | 5.1 | 1.0 | 0.9 | 4.3 | 1.0 | 1.0 | 4.7 |
| Non-Hispanic | 99.0 | 98.9 | 96.3 | 99.0 | 99.0 | 94.9 | 99.0 | 99.1 | 95.7 | 99.0 | 99.0 | 95.3 |
| Race (n = 2,577) *** | ||||||||||||
| White | 96.2 | 95.3 | 88.0 | 95.4 | 93.6 | 84.7 | 97.7 | 97.5 | 93.2 | 96.5 | 95.0 | 88.2 |
| Black or African American | 2.8 | 3.7 | 9.8 | 2.1 | 2.5 | 8.2 | 0.6 | 0.8 | 2.6 | 1.8 | 2.0 | 6.0 |
| Asian | 1.0 | 1.1 | 2.1 | 2.7 | 4.5 | 6.2 | 1.6 | 2.0 | 3.1 | 1.8 | 3.5 | 4.8 |
| American Indian and Alaska Native | 1.6 | 1.4 | 1.9 | 1.1 | 0.6 | 2.1 | 1.7 | 1.3 | 1.8 | 1.5 | 0.9 | 2.0 |
| Native Hawaiian and Other Pacific Islander | 0.4 | 0.3 | 0.1 | 0.1 | 0.2 | 0.1 | 0.0 | 0.0 | 0.1 | 0.2 | 0.1 | 0.1 |
Education corresponds to those 25 years of age or older; trade schools included in the “some college or higher” category.
Income category was ≤ $100,000 for KAB data and < $99,000 for census data.
Participants could select multiple categories on the KAB survey; census data include the percentage of total population in a single category or in combination with one or more other races.
Among 2698 participants who reported self-defined type of residence, the most common type was suburban or urban, followed by rural and town (Table 2). The majority of participants from Michigan reported rural, while participants from Minnesota and Wisconsin reported more suburban residences. Of 2656 participants who spent any time between April through October in places with ticks (98%; 95% CI 97–99), 2411 participants (91%; 95% CI 89–92) reported being likely to encounter ticks in recreational areas around their community; 2215 participants (75%; 95% CI 72–78) reported being likely to encounter ticks around their home; 1065 participants (42%; 95% CI 39–45) being likely to encounter ticks around their cabin or vacation home; and 465 participants (16%; 95% CI 14–18) reported being likely to encounter ticks while at work (Table 3). Of those who reported likely tick exposure at work, reported occupations varied greatly, with the most common categories including “Building and Grounds Cleaning and Maintenance” and “Educational Instruction and Library.” While potential exposure to ticks at cabins and vacation homes were only applicable to 49% of 2656 survey participants who spent time from April through October in places with ticks, a higher proportion of these participants reported their likelihood of encountering ticks as very likely compared to tick encounters around home (57% vs 17%), demonstrating a higher perceived risk of tick bites for cabin-goers. On average, 1032 participants (37%; 95% CI 35–39) spent time weekly in places where they perceived ticks to be present between the months of April through October, and 858 spent time in these places daily (27%; 95% CI 26–29).
Table 2.
Responses from survey participants regarding their self-reported urbanicity of residence (among those who reported residence; n = 15 missing).
| State | Urban |
Suburban |
Town |
Rural |
||||||||||||
|---|---|---|---|---|---|---|---|---|---|---|---|---|---|---|---|---|
| n | (%) | 95% CI | n | (%) | 95% CI | n | (%) | 95% CI | n | (%) | 95% CI | |||||
|
| ||||||||||||||||
| Michigan (n = 859) | 40 | 5.1 | 3.3 | 7.0 | 112 | 15.9 | 12.6 | 19.1 | 274 | 33.3 | 29.0 | 37.6 | 433 | 45.7 | 41.5 | 49.8 |
| Minnesota (n = 922) | 194 | 27.5 | 23.7 | 31.3 | 405 | 51.6 | 47.5 | 55.6 | 119 | 9.9 | 7.6 | 12.2 | 204 | 11.0 | 9.3 | 12.7 |
| Wisconsin (n = 917) | 141 | 20.0 | 16.4 | 23.7 | 225 | 32.8 | 28.8 | 36.9 | 208 | 21.1 | 17.8 | 24.5 | 343 | 26.0 | 22.7 | 29.3 |
| Total (n = 2,698) | 375 | 23.8 | 21.2 | 26.5 | 742 | 43.4 | 40.5 | 46.2 | 601 | 14.9 | 13.1 | 16.8 | 980 | 17.9 | 16.3 | 19.5 |
Table 3.
Responses from survey participants regarding their likelihood of getting ticks on themselves at various locations.
| Around home |
Around cabin or vacation home |
While at work |
Around recreational areas in community |
|||||||||||||
|---|---|---|---|---|---|---|---|---|---|---|---|---|---|---|---|---|
| n | (%) | 95% CI | n | (%) | 95% CI | n | (%) | 95% CI | n | (%) | 95% CI | |||||
|
| ||||||||||||||||
| Very/extremely likely | 683 | 17.3 | 15.3 | 19.2 | 712 | 27.7 | 25.0 | 30.5 | 114 | 2.6 | 1.8 | 3.4 | 848 | 24.9 | 22.4 | 27.4 |
| Slightly/somewhat likely | 1532 | 57.5 | 54.5 | 60.5 | 353 | 13.9 | 11.9 | 15.9 | 351 | 13.5 | 11.4 | 15.7 | 1563 | 65.5 | 62.7 | 68.4 |
| Not at all likely | 428 | 24.9 | 22.1 | 27.8 | 178 | 7.0 | 5.3 | 8.7 | 1329 | 60.4 | 57.6 | 63.3 | 145 | 7.3 | 5.4 | 9.2 |
| Not applicable | 8 | 0.2 | 0.03 | 0.4 | 1374 | 50.3 | 47.3 | 53.4 | 828 | 22.5 | 20.3 | 24.8 | 71 | 1.5 | 0.9 | 2.1 |
| Missing | 5 | 0.04 | 0.0 | 0.1 | 39 | 1.0 | 0.5 | 1.5 | 34 | 0.9 | 0.5 | 1.4 | 29 | 0.8 | 0.3 | 1.2 |
Almost all participants had heard of Lyme disease (n = 2657; 98%; 95% CI 97–99), and of these participants, most perceived Lyme disease as very serious (n = 2435, 91%; 95% CI 89–93) (Table 4). Only 852 participants perceived tick-borne diseases as very common in their community (25%, 95% CI 22–27). Residents from Minnesota were significantly less likely than residents of Michigan or Wisconsin to report that tick-borne diseases were very common in their community (p < 0.0001). When participants were asked how likely it was that they or another person in their household would get a tick-borne disease in the coming year, 1939 reported either slightly or somewhat likely (67%; 95% CI 64–70), and 161 (5%; 95% CI 3–6) reported very or extremely likely. Overall, 505 participants reported ever having been diagnosed by a health care provider with a tick-borne disease for either themselves or members of their households (18%; 95% CI 15–20). A total of 114 participants reported an individual or household diagnosis in the past year (4%, 95% CI 3–5), 230 reported a diagnosis in the previous one to five years (8%, 95% CI 6–10), and 281 reported a diagnosis more than five years ago (9%, 95% CI 8–11). A majority (n = 2355) had removed a tick from their skin or clothing at least once in their life (84%; 95% CI 81–86), with 1566 of these participants having done so within the previous year (n = 58%, 95% CI 55–61).
Table 4. Participant tick-borne disease experiences, attitudes, and use of preventative practices.
Survey population characteristics by state: Michigan (MI), Minnesota (MN), and Wisconsin (WI), United States, 2019*. Rao-Scott chi-squared tests were used to assess associations across states for each variable, p-values are reported.
| MI |
MN |
WI |
Total |
p-values | |||||
|---|---|---|---|---|---|---|---|---|---|
| (n = 866) | (%) | (n = 925) | (%) | (n = 922) | (%) | (n = 2,713) | (%) | ||
|
| |||||||||
| Tick-borne disease experiences and attitudes Perceived prevalence of tick-borne diseases | |||||||||
| Very/Extremely common | 248 | 27.2 | 244 | 20.2 | 360 | 32.4 | 852 | 24.7 | |
| Slightly/Somewhat common | 570 | 67.2 | 615 | 69.5 | 525 | 63.3 | 1710 | 67.2 | |
| Not at all common | 44 | 5.6 | 62 | 10.3 | 32 | 4.3 | 138 | 8.0 | <0.0001 |
| Perceived seriousness of Lyme disease | |||||||||
| Very/Extremely serious | 766 | 90.9 | 836 | 90.8 | 833 | 91.6 | 2435 | 91.1 | |
| Not at all/Slightly/Somewhat serious | 64 | 7.0 | 64 | 8.5 | 66 | 7.9 | 194 | 8.2 | |
| Don’t know | 12 | 2.1 | 6 | 0.7 | 6 | 0.5 | 24 | 0.7 | 0.4957 |
| Perceived likelihood of contracting a tick-borne disease in the next year | |||||||||
| Very/Extremely likely | 46 | 5.1 | 44 | 4.4 | 71 | 4.9 | 161 | 4.6 | |
| Slightly/Somewhat likely | 616 | 69.3 | 655 | 65.4 | 668 | 71.3 | 1939 | 67.6 | |
| Not at all likely | 200 | 25.6 | 223 | 30.2 | 179 | 23.8 | 602 | 27.8 | 0.0618 |
| Ever diagnosed with a tick-borne disease (self or household member) | |||||||||
| Yes | 102 | 11.6 | 180 | 17.0 | 223 | 19.4 | 505 | 17.5 | |
| No/Unknown | 764 | 88.4 | 745 | 83.0 | 699 | 80.6 | 2208 | 82.5 | 0.1015 |
| Use of preventative practices | |||||||||
| Performing a tick check on oneself ** | |||||||||
| Most of the time/Always | 634 | 72.0 | 642 | 66.5 | 650 | 70.4 | 1926 | 68.1 | |
| Never/Rarely/Sometimes | 208 | 28.0 | 263 | 33.5 | 255 | 29.6 | 726 | 31.9 | 0.1552 |
| Applying bug repellent to oneself ** | |||||||||
| Most of the time/Always | 386 | 43.6 | 371 | 41.1 | 417 | 46.5 | 1174 | 43.1 | |
| Never/Rarely/Sometimes | 456 | 56.4 | 533 | 58.9 | 487 | 53.5 | 1476 | 56.9 | 0.0784 |
| Treating property with pesticide to kill ticks | |||||||||
| Yes | 147 | 17.6 | 124 | 12.7 | 134 | 14.2 | 405 | 13.5 | |
| No/Unknown | 719 | 82.4 | 800 | 87.3 | 787 | 85.8 | 2306 | 86.5 | 0.2917 |
| Treating property with devices that kill ticks on rodents *** | |||||||||
| Yes | 23 | 2.7 | 28 | 2.7 | 39 | 4.0 | 90 | 3.1 | |
| No/Unknown | 842 | 97.3 | 893 | 97.3 | 878 | 96.0 | 2613 | 96.9 | 0.2254 |
Values are unweighted frequencies and weighted percentages, unless otherwise indicated. Totals exclude participants who preferred not to answer or those who skipped the question.
Only among participants who spent time in places with ticks from April through October.
Devices that apply pesticides to rodents to kill ticks (e.g., Damminix or Thermacell tick tubes).
Most (n = 2119) participants had heard of Rocky Mountain spotted fever (73%; 95% CI 70–75), with 1575 of those participants indicating it was very serious (74%; 95% CI 71–77). Fewer had heard of the other tick-borne diseases, with 532 participants having heard of anaplasmosis (20%; 95% CI 18–23), of whom 384 indicated that it was very serious (68%; 95% CI 62–74). A total of 388 participants had heard of babesiosis (15%; 95% CI 13–17), with 277 (66%) indicating it was very serious. Similarly, 395 participants had heard of ehrlichiosis (15%; 95% CI 12–17), with 288 of those participants indicating it was very serious (71%; 95% CI 63–78). Only 202 participants had heard of Powassan virus disease (8%, 95% CI 6–10), with 152 indicating it was very serious (74%, 95% CI 64–83). Ninety-two participants had heard of all the tickborne diseases listed (4%; 95% CI 2–5).
3.3. Frequency of current personal tick bite prevention behaviors and reported barriers
Among participants who spent time in places with ticks from April through October (n = 2656), 1926 reported that they check themselves thoroughly for ticks most of the time after being outdoors in tick habitat (68%, 95% CI 65–71, Table 4). Among those who did not report always checking for ticks thoroughly (n = 1636), the most commonly reported barriers were forgetting to check (65%, 95% CI 62–69) and checking for ticks but not thoroughly (42%, 95% CI 38–46). A total of 1174 participants reported bug repellent use on skin or clothing most of the time when outdoors in areas with ticks (43%, 95% CI 40–46). Among those who did not report always using bug repellent while outdoors in places with ticks (n = 2273), commonly reported barriers were forgetting to use or bring bug repellent (58%, 95% CI 55–61), concern about the safety of bug repellent for themselves or family (36%, 95% CI 33–39), and general dislike of bug repellent (32%, 95% CI 29–34) (participants could select all that apply for barriers).
Participants who said they were very likely to get ticks were significantly more likely to check for ticks most of the time or always compared to participants with a lower or unknown perceived likelihood of encountering ticks (p < 0.0001). In other words, of 1622 participants who reported they were very likely to get ticks on themselves, 1302 (79%; 95% CI 75–82) reported tick check behavior most of the time; meanwhile of 1034 participants with a lower or unknown perceived likelihood for encountering ticks, 624 reported tick check behavior most of the time (55%; 95% CI 50–60) (risk difference of −0.24; 95% CI −0.29 to −0.18).
Survey participants who reported that tick-borne diseases were very common in their community were more likely to check for ticks most of the time as compared to those who reported tick-borne diseases were less common or unknown in their community (p < 0.0001). In other words, 704 of 844 participants (83%; 95% CI 79–87) with a higher perceived prevalence of tick-borne disease checked for ticks most of the time, while 1222 of 1812 participants (63%; 95% CI 60–67) of those with a lower perceived prevalence of tick-borne disease checked for ticks most of the time (risk difference of 0.20; 95% CI 0.15 to 0.25). Of 819 participants who reported that tick-borne diseases were very common in their community and who also perceived Lyme disease as very serious, 684 (83%; 95% CI 80–87) were more likely to check for ticks most of the time. Meanwhile, 1242 of 1837 participants (63%; 95% CI 60–67) checked for ticks but reported that tick-borne diseases were not common and/or Lyme disease was not very serious (risk difference of −0.21 95% CI −0.25 to −0.15). There were no significant differences for bug repellent use based solely on perceived prevalence of tick-borne diseases (risk difference of 0.06; 95% CI −0.005 to 0.13); however, those who perceived tick-borne diseases as very common in their community and also perceived Lyme disease as very serious were more likely to use bug repellent most of the time (49%; 95% CI 43–55), compared to those who thought tick-borne diseases were not common and/or Lyme disease was not very serious (41%; 95% CI 38–45) (risk difference of −0.08; 95% CI −0.14 to −0.01).
In addition, survey participants who thought it was very likely that they would get a tick-borne disease in the coming year were more likely to check for ticks compared to those with a lower or unknown perceived likelihood of getting a tick-borne disease (p = 0.02). In other words, 135 of 158 participants (82%; 95% CI 72–92) who thought it was very likely that they would get a tick-borne disease in the coming year reported tick checks most of the time, while 1791 of 2498 participants (68%; 95% 65–70) with a lower or unknown perceived likelihood for getting a tickborne disease reported tick checks most of the time (risk difference of 0.14; 95% CI 0.04 to 0.25).
3.4. Frequency of current property-based tick control behaviors and reported barriers
A smaller proportion of participants practiced tick control on their residential properties compared to personal protection measures against tick bites; with 405 participants reporting that they had ever treated their property, including either their home, cabin, or vacation home, with a pesticide to kill ticks (13%, 95% CI 11–15) (Table 4). Of those who had treated their property, 296 (65%; 95% CI 57–73) had exclusively done so themselves while 95 (31%; 95% CI 23–38) exclusively hired a professional, with 10 participants reporting both types of treatment (4%; 95% CI 0.4–8) (n = 2 said ‘don’t know’ and n = 2 missing). Among those who had never treated their property with a pesticide to kill ticks (n = 2172), the most commonly reported reasons for not doing so included concern about the health or safety of themselves, family, or the environment (41%, 95% CI 38–44), lack of awareness regarding the availability of pesticides to kill ticks on their properties (33%, 95% CI 30–36), lack of concern about ticks on their property (29%, 95% CI 25–32), or that participants did not own the property (19%, 95% CI 16–22). Of 1184 participants who thought it was very likely to encounter ticks on their property (either home, cabin, or vacation home), 232 (17%; 95% CI 14–21) reported treating their property with a pesticide to kill ticks; conversely, of 1472 participants who did not think it was very likely to encounter ticks on their property, 169 (11%; 95% CI 8–13) reported treating their property with a pesticide to kill ticks (risk difference of −0.06; 95% CI −0.11 to −0.02).
Use of devices that apply pesticide to rodents to kill ticks (e.g., Damminix Tick Tubes (Ecohealth Inc., Brookline, MA, USA) or Thermacell Tick Control Tubes (Thermacell Repellents, Inc., Bedford, MA, USA)) on residential property was only reported by 90 participants (3%, 95% CI 2–4) (Table 4). Of these 90 participants, 64 (74%, 95% CI 62–87) exclusively had done so themselves while 19 (19%, 95% CI 7–30) hired a professional to do so, with six participants selecting both methods (7%; 95% CI 1–13). Among those who had never treated their property with devices that apply pesticide to rodents to kill ticks (n = 2470), the most common reasons for not doing so included a lack of awareness (59%, 95% CI 56–63), concern about health or safety of family or the environment (24%, 95% CI 22–27), lack of concern about ticks on their property (20%, 95% CI 17–22), or that participants did not own the property (16%, 95% CI 13–18). Few participants reported concerns about cost for property-based pesticides to kill ticks (14%, 95% CI 12–16) or devices that kill ticks on rodents (10%, 95% CI 8–12), and even fewer reported that treating their property with such pesticides (6%, 95% CI 4–7) or rodent devices (4%, 95% CI 2–5) seemed like too much work.
3.5. Willingness to practice personal tick bite prevention behaviors
Participants rated their willingness, before or after spending time in places with ticks, to practice various personal tick bite prevention methods. A majority of participants were willing to perform tick checks at least once a day (82%, 95% CI 80–85), to treat pet(s) with a product to prevent tick bites (64%, 95% CI 61–66), or to shower or bathe within two hours of being outdoors (62%, 95% CI 59–65), while fewer were willing to tumble-dry clothing or gear on high heat for at least 10 min (43%; 95% CI 40–46) or wear clothing that has been pretreated with a long-lasting bug repellent, like permethrin (36%; 95% CI 33–39) (Fig. 1). A total of 1084 participants were willing to use either natural bug repellent, such as oil of lemon eucalyptus, on skin or clothing or synthetic bug repellent, such as DEET (42%; 95% CI 39–45). There was a slight preference for natural over synthetic bug repellent products, with 658 (24%; 95% CI 21–26) of participants preferring only natural bug repellent and 584 (19%; 95% CI 17–21) preferring only synthetic bug repellent. Overall, 387 participants were not willing to use either natural or synthetic bug repellent (16%; 95% CI 13–18).
Fig. 1.
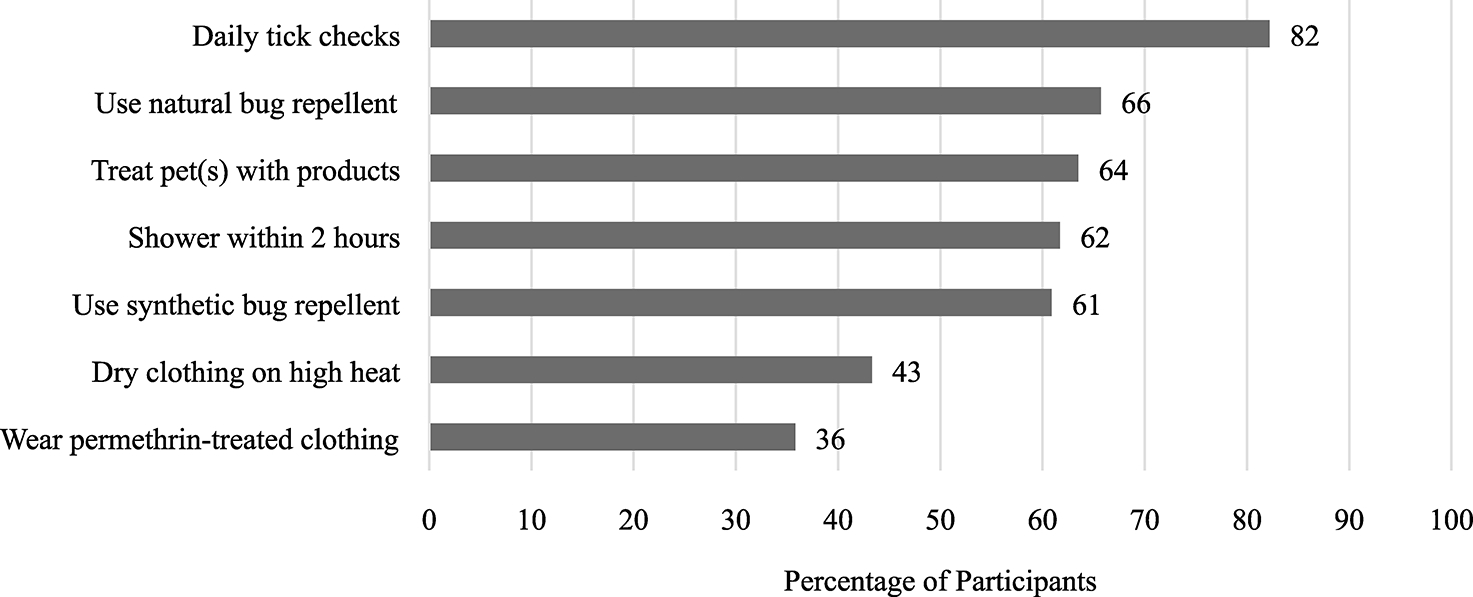
Percent willing to participate in personal tick bite prevention methods before or after spending time in places with ticks, for combined surveys from Michigan, Minnesota, and Wisconsin, United States (n = 2,713).
3.6. Willingness to practice property-based tick control behaviors
A majority (n = 2160) of survey participants were willing to apply tick control products to their property based on a hypothetical scenario that would reduce the risk of a tick-borne disease in their household by half and the products would be safe and pose minimal risk to the environment (79%; 95% CI 76–81). Of the 2160 participants who were willing to use such products, 1719 (78%; 95% CI 75–80) preferred to apply over-the-counter tick control products to the property themselves while 441 (23%; 95% CI 20–25) preferred to hire a pest control company to do the work. In addition, when a similar scenario was presented and participants were asked if they were willing to support a county-wide tick control program to halve the risk of tick-borne diseases in the county, 2095 participants (81%; 95% CI 78–83) would support the program with a $10 increase in household taxes per year.
3.7. Preferences for educational outreach
When participants were asked if they had seen any information about ticks or the prevention of tick-borne diseases from their respective state health department (e.g., website, brochures, posters, or speakers) prior to taking part in the survey, 1315 reported “No” (48%; 95% CI 45–51), 1080 reported “Yes” (39%; 95% CI 36–42), and 303 reported “Don’t know” (12%; 95% CI 10–14) (n = 15 did not respond). Among the 1063 participants who had seen prevention messages from their state health department and spent time in places with ticks from April through October, 521 (49%; 95% CI 44–54) reported using bug repellent most of the time; as compared to 653 participants who reported using bug repellent most of the time of 1593 who had not seen prevention messages (39%; 95% CI 35–43) (risk difference of −0.10; 95% CI −0.16 to −0.04). This finding was similar for tick checks, as 843 of 1063 (75%; 95% CI 71–79) participants who had seen prevention messages reported currently checking for ticks most of the time compared to 1083 of 1593 (64%; 95% CI 60–67) participants who had not seen prevention messages (risk difference of −0.11; 95% CI −0.17 to −0.06). Those who had seen prevention messages were also more willing to shower or bathe within two hours of being outdoors to prevent tick bites (66% vs. 59%; risk difference of −0.07; 95% CI −0.13 to −0.006) and wear clothing that has been pretreated with long-lasting bug repellent, like permethrin (41% vs. 33%; risk difference of −0.08; 95% CI −0.14 to −0.02) as compared to those who had not seen prevention messages. Printable resources such as fact sheets, tick identification cards, or brochures were reported to be very helpful by 1222 participants (40%; 95% CI 37–43). Meanwhile, online resources such as websites, archived webinars, podcasts, or YouTube videos were reported to be very helpful by 1017 participants (39%; 95% CI 36–42). Fewer participants (n = 893) found community resources such as billboards, posters, or signs to be very helpful (33%; 95% CI 30–35). Lastly, 607 participants (22%; 95% CI 19–24) found a smartphone app to be very helpful.
3.8. Correlating characteristics and behaviors
Survey participants who perceived tick-borne diseases as very common in their community were more likely to perform tick checks most of the time as compared to participants who perceived tick-borne diseases as not at all, slightly, or somewhat common in their community (adjusted odds ratio [aOR]=2.5, 95% CI 1.7–3.7). Similarly, those who perceived Lyme disease as very serious were more likely to perform tick checks as compared to those who perceived Lyme disease as not at all, slightly, or somewhat serious (aOR=2.5, 95% CI 1.5–4.3) (Table 5). In addition, participants who reported a household member with a previous tick-borne disease diagnosis, including themselves, were more likely to report tick checks than participants who had responded “no” or left the response blank (aOR=2.4, 95% CI 1.6–3.8). Lastly, participants who reported that they were very likely to encounter ticks around their home, cabin, or vacation home were more likely to report tick checks most of the time, compared to participants with a lower or unknown likelihood for encountering ticks in these places (aOR=1.9, 95% CI 1.4–2.7).
Table 5. Correlation between individual characteristics and personal tick bite prevention methods.
Reported personal tick bite prevention methods and their associations with other demographic variables and key characteristics. State and significant covariates (p < 0.20) based on univariate analyses were adjusted for in all multivariable models.
| Performing a tick check on oneself (n = 2,068) |
Applying bug repellent to oneself (n = 2,068) |
|||||
|---|---|---|---|---|---|---|
| % | uOR (95% CI) | aOR (95% CI) | % | uOR (95% CI) | aOR (95% CI) | |
|
| ||||||
| Age | ||||||
| ≥50 | 45.3 | 1.16 (0.87–1.54) | 45.3 | 0.78 (0.59–1.02)* | 0.76 | |
| 18–49 (ref) | 54.7 | 54.7 | (0.58–0.99)** | |||
| Education | ||||||
| College/Grad School# (ref) | 90.0 | 1.12 (0.72–1.74) | 90.0 | 0.91 (0.61–1.35) | ||
| Elementary/Middle/High School | 10.0 | 10.0 | ||||
| Income | ||||||
| >$100,000 | 33.5 | 1.13 (0.82–1.54) | 33.6 | 1.01 (0.76–1.36) | ||
| ≤$100,000 (ref) | 66.5 | 66.4 | ||||
| Sex | ||||||
| Female (ref) | 53.4 | 0.90 (0.67–1.21) | 53.4 | 0.85 (0.64–1.13) | ||
| Male | 46.6 | 46.6 | ||||
| Perceived prevalence of tick-borne diseases | ||||||
| Very/Extremely common | 24.9 | 3.41 | 2.52 | 24.9 | 1.23 (0.91–1.66)* | |
| Not at all/Slightly/Somewhat common (ref) | 75.1 | (2.36–4.92)*** | (1.71–3.72)*** | 75.1 | ||
| Perceived seriousness of Lyme disease | ||||||
| Very/Extremely serious | 91.6 | 2.69 | 2.52 | 91.5 | 1.77 | 1.82 |
| Not at all/Slightly/Somewhat serious (ref) | 8.4 | (1.63–4.47)*** | (1.47–4.32)*** | 8.5 | (1.05–2.99)** | (1.07–3.10)** |
| Perceived likelihood of contracting a tick-borne disease in the next year | ||||||
| Very/Extremely likely | 4.2 | 2.63 (1.15–6.04)** | 4.3 | 0.63 (0.34–1.16)* | ||
| Not at all/Slightly/Somewhat likely (ref) | 95.8 | 95.8 | ||||
| Perceived risk of encountering ticks around home, cabin, or vacation home | ||||||
| Very/Extremely likely | 38.9 | 2.31 | 1.94 | 38.9 | 1.28 (0.97–1.69)* | |
| Not at all likely/Slightly/Somewhat likely (ref) | 61.1 | (1.69–3.16)*** | (1.40–2.67)*** | 61.1 | ||
| Ever diagnosed with a tick-borne disease (self or household) | ||||||
| Yes | 17.2 | 3.16 | 2.43 | 17.2 | 1.24 (0.88–1.76) | |
| No/Unknown (ref) | 82.8 | (2.03–4.90)*** | (1.55–3.80)*** | 82.8 | ||
| State | ||||||
| Michigan | 4.7 | 1.37 (1.00–1.89)* | 4.7 | 1.06 (0.81 –1.40) | ||
| Minnesota (ref) | 61.8 | 61.8 | ||||
| Wisconsin | 33.5 | 1.24 (0.92–1.67)* | 33.4 | 1.10 (0.83–1.46) | ||
Responses for “some college” and trade schools were included as College/Grad school.
p < 0.2.
p value<0.05.
p value<0.01.
Participants who perceived Lyme disease as very serious were more likely to report using bug repellent most of the time than those who perceived Lyme disease as not at all, slightly, or somewhat serious (aOR=1.8, 95% CI 1.1–3.1). Participants ≥50 years of age were less likely to report using bug repellent most of the time or always, compared to participants from 18 to 49 years of age (aOR 0.8; 95% CI 0.6–0.99).
Participants who earned an annual household income >$100,000 were more likely to report having ever treated their property (either home, cabin, or vacation home) with a pesticide to kill ticks, compared to participants with a household income ≤$100,000 (aOR=1.6, 95% CI 1.1–2.5) (Table 6). Those who perceived tick-borne diseases as very common in their community were also more likely to report having ever treated their property compared to participants who perceived tick-borne diseases as not at all, slightly, or somewhat common (aOR=1.9, 95% CI 1.2–2.9). Residents in Michigan were more likely to have treated their property with a pesticide to kill ticks than residents from Minnesota or Wisconsin (aOR=1.6, 95% CI 1.1–2.3). In addition, participants who reported that they were very likely to encounter ticks around their home, cabin, or vacation home were more likely to report ever having treated their property with a pesticide to kill ticks, compared to participants with a lower or unknown likelihood for encountering ticks in these places (aOR=1.6, 95% CI 1.0–2.4).
Table 6. Correlation between individual characteristics and property-based tick control methods.
Reported property-based tick control methods and their associations with other demographic variables and key characteristics. State and significant covariates (p < 0.20) based on univariate analyses were adjusted for in all multivariable models.
| Treated property with pesticide (n = 2,013) |
Treated property with rodent devices (n = 1,992) |
|||||
|---|---|---|---|---|---|---|
| % | uOR (95% CI) | aOR (95% CI) | % | uOR (95% CI) | aOR (95% CI) | |
|
| ||||||
| Age | ||||||
| ≥50 | 46.3 | 0.82 (0.55–1.21) | 46.9 | 0.52 (0.28–0.96)** | 0.51 (0.27–0.95)** | |
| 18–49 (ref) | 53.7 | 53.1 | ||||
| Education | ||||||
| College/Grad School# (ref) | 89.8 | 0.86 (0.47–1.56) | 89.9 | 1.33 (0.50–3.56) | ||
| Elementary/Middle/High School | 10.2 | 10.1 | ||||
| Income | ||||||
| >$100,000 | 33.9 | 1.68 (1.11–2.53)** | 1.62 (1.05–2.49)** | 34.1 | 1.34 (0.65–2.75) | |
| ≤$100,000 (ref) | 66.1 | 65.9 | ||||
| Sex | ||||||
| Female (ref) | 53.6 | 1.25 (0.84–1.86) | 53.4 | 1.18 (0.61–2.28) | ||
| Male | 46.4 | 46.6 | ||||
| Perceived prevalence of tick-borne diseases | ||||||
| Very/Extremely common | 24.9 | 2.09 | 1.85 | 24.4 | 2.08 (1.10–3.96)** | |
| Not at all/Slightly/Somewhat common (ref) | 75.1 | (1.39–3.16)*** | (1.18–2.89)*** | 75.6 | ||
| Perceived seriousness of Lyme disease | ||||||
| Very/Extremely serious | 91.5 | 1.54 (0.67–3.54) | 91.4 | 1.22 (0.31–4.79) | ||
| Not at all/Slightly/Somewhat serious (ref) | 8.5 | 8.6 | ||||
| Perceived likelihood of contracting a tick-borne disease in the next year | ||||||
| Very/Extremely likely | 4.5 | 2.62 (1.14–6.03)** | 4.4 | 4.01 (1.56–10.30)*** | 3.15 (1.20–8.28)** | |
| Not at all/Slightly/Somewhat likely (ref) | 95.5 | 95.6 | ||||
| Perceived risk of encountering ticks around home, cabin, or vacation home | ||||||
| Very/Extremely likely | 38.9 | 1.83 (1.22–2.73)*** | 1.55 (1.02–2.38)** | 38.9 | 3.74 (1.90–7.36)*** | 3.28 (1.65–6.52)*** |
| Not at all likely/Slightly/Somewhat likely (ref) | 61.1 | 61.1 | ||||
| Ever been diagnosed with a tick-borne disease (self or household) | ||||||
| Yes | 17.7 | 1.04 (0.65–1.64) | 17.4 | 1.40 (0.67–2.93) | ||
| No/Unknown (ref) | 82.3 | 82.6 | ||||
| State | ||||||
| Michigan | 4.7 | 1.52 (1.04–2.20)** | 1.58 (1.07–2.32)** | 4.7 | 0.97 (0.46–2.04) | |
| Minnesota (ref) | 62.0 | 62.3 | ||||
| Wisconsin | 33.3 | 1.07 (0.72–1.61) | 1.02 (0.67–1.55) | 32.9 | 1.39 (0.72–2.70) | |
Responses for ’some college’ and trade schools were included as College/Grad school.
p < 0.2.
p value<0.05.
p value<0.01.
Participants who were ≥50 years of age were less likely to report having ever treated their property with devices that apply pesticide to rodents to kill ticks, compared to those 18 to 49 years of age (aOR= 0.5, 95% CI 0.3–0.95) (Table 6). Participants who reported that they or someone in their household were very likely to get a tick-borne disease in the coming year were more likely to report having ever treated their property with such rodent devices, compared to those who responded not at all, slightly, or somewhat likely for getting a tick-borne disease (aOR=3.2, 95% CI 1.2–8.3). Lastly, participants who reported that they were very likely to encounter ticks around their home, cabin, or vacation home were more likely to report having ever treated their property with a pesticide to kill ticks, compared to participants with a lower or unknown likelihood for encountering ticks in these places (aOR=3.3, 95% CI 1.7–6.5).
4. Discussion
The results from this KAB survey provide new insights regarding awareness and perceived risk of tick-borne diseases as well as practices for tick bite prevention and tick control in high-incidence counties within the Upper Midwest. We collected information in all three targeted states and used weighting to improve the likelihood that summarized findings were representative of the population sampled. Lyme disease awareness was high and most perceived it as a serious illness. Familiarity with other tick-borne diseases was somewhat lower, though perceived severity of those diseases among those who did recognize them was still relatively high. An estimated nearly three out of four persons perceived some risk of contracting a tick-borne disease in the coming year. Not surprisingly, our results show an overall high rate of adoption of tick bite prevention measures with an even higher willingness to practice and support various behaviors. Perceived risk of tick exposure among participants was high, particularly around cabins or vacation homes, with over three quarters of the estimated population regularly practicing tick checks. Furthermore, tick checks were more likely to be practiced among those who perceived tick-borne diseases to be common in their area, to be serious, or when tick exposure was considered to be likely around their home, cabin, or vacation home. Less than half of the estimated population used bug repellent to prevent tick bites. Most participants did not report using any property-based methods of tick control. Among those who did, most indicated a preference for self-application with over-the-counter products versus commercial application by pest control firms. Overall, willingness to practice prevention behaviors was high, with an estimated 80% of the population willing to perform tick checks and over 60% willing to treat pet(s) with a tick control product or to shower or bathe within two hours of being outdoors. Our results also show an overall willingness for residents in these Upper Midwest states to support county-wide tick control programs. Reported barriers to practicing prevention behaviors most commonly included lack of awareness, concerns about health and safety, and forgetfulness. Opportunities to minimize the gaps between actual use and willingness to do so include public health outreach targeting these barriers and research for more widely acceptable and practical tick bite prevention methods or products.
Some unexpected results are worth highlighting. First, participants from Minnesota perceived tick-borne diseases to be less common within their community compared to participants from Michigan and Wisconsin. One possible explanation for this finding is that participants from Minnesota were more likely to report living in urban and suburban areas, where risk may be lower than in rural areas. Second, participants from Michigan were significantly more likely to treat their property with a pesticide to kill ticks compared to participants from Minnesota and Wisconsin. One possible explanation is that the counties that were recruited for study in Michigan were much fewer in number and more rural compared to the recruited counties in Minnesota and Wisconsin. Agricultural use of pesticides is common in rural communities, so participants from these areas may be more comfortable with and knowledgeable about property-based pesticide treatments. Given that this was a self-assigned geographic designation, it is also possible that there may be different interpretations of urban, suburban, town and rural in different communities or states.
Our survey tool and methods were largely developed based on a previous KAB study conducted during 2016 and 2017 in the highest Lyme disease incidence counties in Connecticut and Maryland (Niesobecki et al., 2019). That study revealed that perceived prevalence and severity of Lyme disease, and perceived likelihood of contracting a tick-borne disease, were significantly associated with performing tick checks, while only perceived prevalence of Lyme disease was significantly associated with bug repellent use. In our study, perceived prevalence and severity of Lyme disease were also associated with propensity of doing tick checks. Compared to the Connecticut/Maryland survey, we found higher estimated percentages of the population checking for ticks thoroughly (70% versus 58%) or using bug repellent (43% versus 31%) after being outdoors in areas with ticks. Yet, of the Upper Midwest KAB population, only an estimated 13% ever treated their property with a pesticide to kill ticks. This percentage is lower than Connecticut/Maryland survey participants, where 23% reported using a chemical pesticide and 15% reported using a natural pesticide on their yards. Similarly, devices that apply pesticide to rodents to kill ticks were used by estimated 3% of the Upper Midwest population, which was much lower than 17% of Connecticut/Maryland survey participants who reported using such devices for tick control (Niesobecki et al., 2019). This echoes findings from Bron et al. (2020) who found that more participants from the Northeast reported application of environmental pesticides than participants from the Midwest. Bron et al. (2020) also found that the use of personal protective behaviors was generally higher for Midwest participants than Northeast participants, with a slightly higher proportion of Midwest participants reporting checking themselves for ticks and bug repellent use than in this study (Bron et al., 2020). While difficult to directly compare survey results due to differences in wording, survey weighting, or response options, several other studies have been performed within Lyme disease endemic states in the New England and Mid-Atlantic regions to assess use of tick-borne disease prevention practices. Overall, these studies have typically found relatively low but highly variable adoption of personal prevention behaviors such as performing tick checks (22–80%), showering/bathing within two hours of being outside (12–59%), and applying bug repellent (11–47%) in surveyed populations (Bayles et al., 2013; Butler et al., 2016; Gould et al., 2008; Gupta et al., 2018; Hook et al., 2015; Nawrocki and Hinckley, 2021; Phillips et al., 2001). In a nationwide survey of the public conducted in 2011, Hook et al. (2015) found that 38% of participants in the East North Central and West North Central regions, encompassing Minnesota, Wisconsin, and Michigan, practiced tick checks and 27% used bug repellent to prevent tick bites when the weather was warm (Hook et al., 2015). A similar national survey repeated in 2013 and 2014 found that 29% of the public in states with a high incidence of Lyme disease performed tick checks daily and 25% routinely used bug repellent (Nawrocki and Hinckley, 2021). Therefore, our study generally showed a similar or higher rate of adoption of these particular tick bite prevention measures.
Public health outreach with the goal of increasing tick bite prevention may benefit greatly from the information gathered with this survey. First, as with other published studies, these results indicate potential for educational efforts to be associated with tick-borne disease prevention behaviors. Given the cross-sectional study design, we cannot be sure if the educational efforts are positively influencing behaviors or if participants with higher perceived risk are more likely to seek out the information. A greater estimated percentage of the population who had previously seen tick-borne disease information from their respective health department used bug repellent and did tick checks than those who had not. Those who had seen information from their health department were also more willing to use permethrin-treated clothing and to shower or bathe after being outdoors to prevent tick bites. Our observations of participant willingness to use permethrin-treated clothing and shower after being outdoors were consistent with findings from Bron et al. (2020) and are encouraging, given the low usage rates in previous literature from the Northeast (Niesobecki et al., 2019), and this may indicate the potential for wider uptake through outreach and education. Educational efforts may also be more effective when combined with messaging to increase knowledge of the perceived severity and prevalence of Lyme disease in high incidence communities. Second, while most participants indicated a preference for online or printable resources, only an estimated 39% of the population saw any information about ticks or the prevention of tick-borne diseases from their respective state department of health. Partnerships between public health agencies, universities, health care providers, and vector control associations may offer an opportunity to broadcast a unified and trustworthy message across a variety of platforms, thereby maximizing its uptake by the community. Third, results from our survey indicate a need for broader tick-borne disease education that covers illnesses in addition to Lyme disease. While an estimated 98% of the population had heard of Lyme disease and 74% had heard of Rocky Mountain spotted fever, only an estimated 20% had heard of anaplasmosis and 8% had heard of Powassan virus disease. In addition, an estimated 91% thought that Lyme disease was very serious while a much lower proportion thought that Rocky Mountain spotted fever or Powassan virus disease were very serious (74% each). Yet, the latter two diseases are some of the deadliest tick-borne diseases in North America. Raising awareness for less common but equally important tick-borne diseases may not only help reduce misconceptions but also help increase perceived risks associated with tick bites. And fourth, health communication efforts should be strategic by taking into account the barriers that participants reported in our survey. For instance, the most commonly reported reason for not checking for ticks thoroughly after being outdoors or using bug repellent was forgetting to do so while an estimated one third of the population was concerned about the safety of bug repellent. Regarding tick control methods for residential properties, concern about health or safety as well as a lack of awareness regarding their availability was expressed. Thus, education targeting the availability and safety of EPA-registered tick repellents, including both natural and synthetic products, as well as permethrin-treated clothing should be emphasized and reiterated to consumers (Banks et al., 2014; Diaz, 2016). Additional barriers to the use of property-based treatments mentioned in participants’ open-ended replies included the perceived impracticality of treating large properties, skepticism of their effectiveness, and a reported inability to directly make property-based decisions. While these factors are difficult to overcome with education and outreach alone, they are important to consider. Research is also needed for the development of safe, effective, and cost-effective tick control products, both for use on residential properties and for large-scale community use, that can become widely available across geographic regions, universally accepted by communities, and broadly recommended as best practices by public health officials (Eisen and Eisen, 2018).
There are some limitations inherent to the study design and analysis that may affect interpretation and generalizability of results. First, there were some demographic differences between survey participants and census demographic data for the counties sampled (Table 1). Survey participants were generally older, with a larger proportion aged ≥55 years, which may have impacted certain variables such as proportion of property owners or those previously diagnosed with a tick-borne disease. Females were slightly overrepresented, and minorities were vastly underrepresented in the survey, and the survey population also had higher levels of education as compared to census data for each state. Because the survey was only available in English, we did not capture participants in these regions who spoke other languages. This includes an estimated 5–7% of residents in these three states who speak Spanish or an Asian and Pacific Islander or Indo-European language (ACS, 2021). Although we used post-stratification by age and sex to provide correction for these differential sampling rates, there were a few joint age and sex strata that did not have survey participants. As with any survey with non-response and self-selected participation, even after statistical correction, responses may not be broadly generalizable to the populations sampled. In addition, a large proportion of survey participants reported their type of residence as suburban (43%); however, this finding varied greatly by state of residence. Regression analyses included participant state of residence to account for this, yet overall results may be skewed to reflect KAB of suburban homeowners. Second, because the participants removed during post-stratification were likely to be missing other demographic data, it was not possible to determine if this group was different compared to participants included for analyses. However, the number of survey responses removed because of this was small and thus unlikely to significantly bias results. Third, while the sample size for each state was capped at 1000 responses, the overall low response rate (though typical for these types of studies) may have impacted the generalizability of results. Fourth, there were slight differences in the wording for select questions and response options between this survey and the (Niesobecki et al., 2019) survey in Connecticut/Maryland, as well as other literature cited, that may account for some of the differences reported between our study and others. Fifth, as with all cross-sectional study designs, reverse causality may be an issue with respect to interpretation of results. For example, survey participants who previously treated their property with a pesticide might, in turn, perceive a lower likelihood for encountering ticks on their property, as opposed to perception of encountering ticks influencing pesticide-use behaviors. Lastly, number of household members was not asked about in the survey, so we were unable to include an individual selection probability in the creation of the survey weights and only household selection probability was used.
Overall, results from this KAB survey provide critical information regarding risk perceptions, current use of personal and property-based tick-borne disease prevention methods, willingness to participate in prevention behaviors, and barriers to implementation in high-incidence areas of the Upper Midwest. Future analyses are needed to examine these data further and in relation to other socioeconomic or ecologic factors as well as population density and Lyme disease incidence. Taken together, these results can be used to optimize public health resources and outreach as well as inform future prevention research in this hard-hit region.
Supplementary Material
Acknowledgments
This study was made possible due to a unique partnership between TickNET and the Midwest Center of Excellence for Vector-Borne Disease, including representatives from state public health agencies in Michigan, Minnesota, and Wisconsin, and academic institutions in Michigan and Wisconsin. The authors would like to especially acknowledge the contributions of David Neitzel and Kirk Smith (Minnesota Department of Health); Sarah Hook and Melanie Spillane (Centers for Disease Control and Prevention); Emily Dinh, Stephanie McCracken, Rachel Potter, Rebecca Reik, Jennifer Sidge, and Mary Grace Stobierski (Michigan Department of Health and Human Services); Kimberly Fake (Michigan State University); and the University of Wisconsin Survey Center.
Funding
This work was supported by the Centers for Disease Control and Prevention via Cooperative Agreements U50CK000490 and U01CK000505.
Project support was provided in part by an appointment to the CDC Fellowship Program, administered by the Oak Ridge Institute for Science and Education through an interagency agreement between the US Department of Energy and CDC.
Footnotes
Declaration of Competing Interest
None.
Disclaimer
The findings and conclusions of this study are by the authors and do not necessarily represent the views of the Centers for Disease Control and Prevention. The mention of commercial products does not represent an endorsement by the authors or the Centers for Disease Control and Prevention.
CRediT authorship contribution statement
Alyssa Beck: Methodology, Software, Formal analysis, Data curation, Writing – original draft, Writing – review & editing. Jenna Bjork: Conceptualization, Methodology, Data curation, Writing – original draft, Writing – review & editing, Project administration. Brad J. Biggerstaff: Methodology, Formal analysis, Validation, Writing – review & editing. Lars Eisen: Conceptualization, Methodology, Writing – review & editing. Rebecca Eisen: Conceptualization, Methodology, Writing – review & editing. Erik Foster: Conceptualization, Methodology, Writing – review & editing. Kimberly Signs: Conceptualization, Investigation, Writing – review & editing. Jean I. Tsao: Conceptualization, Methodology, Resources, Writing – review & editing. Erin Kough: Conceptualization, Investigation, Writing – review & editing. Molly Peterson: Conceptualization, Investigation, Writing – review & editing. Elizabeth Schiffman: Conceptualization, Methodology, Writing – review & editing. Christine P. Muganda: Conceptualization, Investigation, Writing – review & editing. Rebecca Osborn: Conceptualization, Investigation, Writing – review & editing. Ryan Wozniak: Conceptualization, Writing – review & editing. Gebbiena M. Bron: Conceptualization, Methodology, Writing – review & editing. Daniel Phaneuf: Conceptualization, Methodology, Writing – review & editing. Danielle Smith: Investigation, Methodology, Resources, Writing – review & editing. Lyric Bartholomay: Conceptualization, Methodology, Investigation, Writing – review & editing, Funding acquisition. Susan Paskewitz: Conceptualization, Methodology, Investigation, Writing – review & editing, Funding acquisition. Alison F. Hinckley: Conceptualization, Methodology, Writing – original draft, Writing – review & editing, Supervision.
Supplementary materials
Supplementary material associated with this article can be found, in the online version, at doi:10.1016/j.ttbdis.2022.101925.
References
- Bakken JS, Dumler JS, 2006. Clinical diagnosis and treatment of human granulocytotropic anaplasmosis. Ann. N. Y. Acad. Sci. 1078, 236–247. 10.1196/annals.1374.042. [DOI] [PubMed] [Google Scholar]
- Banks SD, Murray N, Wilder-Smith A, Logan JG, 2014. Insecticide-treated clothes for the control of vector-borne diseases: a review on effectiveness and safety. Med. Vet. Entomol. 28 (Suppl 1), 14–25. 10.1111/mve.12068. [DOI] [PubMed] [Google Scholar]
- Bayles BR, Evans G, Allan BF, 2013. Knowledge and prevention of tick-borne diseases vary across an urban-to-rural human land-use gradient. Ticks Tick Borne Dis. 4, 352–358. 10.1016/j.ttbdis.2013.01.001. [DOI] [PubMed] [Google Scholar]
- Bron GM, Fernandez MDP, Larson SR, Maus A, Gustafson D, Tsao JI, Diuk-Wasser MA, Bartholomay LC, Paskewitz SM, 2020. Context matters: contrasting behavioral and residential risk factors for Lyme disease between high-incidence states in the northeastern and midwestern United States. Ticks Tick Borne Dis. 11, 101515 10.1016/j.ttbdis.2020.101515. [DOI] [PubMed] [Google Scholar]
- Butler AD, Sedghi T, Petrini JR, Ahmadi R, 2016. Tick-borne disease preventive practices and perceptions in an endemic area. Ticks Tick Borne Dis. 7, 331–337. 10.1016/j.ttbdis.2015.12.003. [DOI] [PubMed] [Google Scholar]
- Centers for Disease Control and Prevention, 2019. Lyme disease data tables: historical data. https://www.cdc.gov/lyme/stats/tables.html/ (accessed 23 April 2021).
- Corapi KM, White MI, Phillips CB, Daltroy LH, Shadick NA, Liang MH, 2007. Strategies for primary and secondary prevention of Lyme disease. Nat. Clin. Pract. Rheumatol. 3, 20–25. 10.1038/ncprheum0374. [DOI] [PubMed] [Google Scholar]
- Diaz JH, 2016. Chemical and plant-based insect repellents: efficacy, safety, and toxicity. Wilderness Environ. Med. 27, 153–163. 10.1016/j.wem.2015.11.007. [DOI] [PubMed] [Google Scholar]
- Eisen L, 2021. Control of ixodid ticks and prevention of tick-borne diseases in the United States: the prospect of a new Lyme disease vaccine and the continuing problem with tick exposure on residential properties. Ticks Tick Borne Dis. 12, 101649 10.1016/j.ttbdis.2021.101649. [DOI] [PMC free article] [PubMed] [Google Scholar]
- Eisen L, Dolan MC, 2016. Evidence for personal protective measures to reduce human contact with blacklegged ticks and for environmentally-based control methods to suppress host-seeking blacklegged ticks and reduce infection with Lyme disease spirochetes in tick vectors and rodent reservoirs. J. Med. Entomol. 53, 1063–1092. 10.1093/jme/tjw103. [DOI] [PMC free article] [PubMed] [Google Scholar]
- Eisen L, Stafford KC, 2021. Barriers to effective tick management and tick-bite prevention in the United States (Acari: ixodidae). J. Med. Entomol. 58, 1588–1600. 10.1093/jme/tjaa079. [DOI] [PMC free article] [PubMed] [Google Scholar]
- Eisen RJ, Eisen L, 2018. The blacklegged tick, Ixodes scapularis: an increasing public health concern. Trends Parasitol. 34, 295–309. 10.1016/j.pt.2017.12.006. [DOI] [PMC free article] [PubMed] [Google Scholar]
- Eisen RJ, Eisen L, Beard CB, 2016. County-scale distribution of Ixodes scapularis and Ixodes pacificus (Acari: ixodidae) in the continental United States. J. Med. Entomol. 53, 349–386. 10.1093/jme/tjv237. [DOI] [PMC free article] [PubMed] [Google Scholar]
- Fleshman AC, Graham CB, Maes SE, Foster E, Eisen RJ, 2021. Reported county-level distribution of Lyme disease spirochetes, Borrelia burgdorferi sensu stricto and Borrelia mayonii (Spirochaetales: spirochaetaceae), in host-seeking Ixodes scapularis and Ixodes pacificus ticks (Acari: ixodidae) in the contiguous United States. J. Med. Entomol. 58, 1219–1233. 10.1093/jme/tjaa283. [DOI] [PMC free article] [PubMed] [Google Scholar]
- Gomes-Solecki M, Arnaboldi PM, Backenson PB, Benach JL, Cooper CL, Dattwyler RJ, Diuk-Wasser M, Fikrig E, Hovius JW, Laegreid W, Lundberg U, Marconi RT, Marques AR, Molloy P, Narasimhan S, Pal U, Pedra JHF, Plotkin S, Rock DL, Rosa P, Telford SR, Tsao J, Yang XF, Schutzer SE, 2020. Protective immunity and new vaccines for Lyme disease. Clin. Infect. Dis. 70, 1768–1773. 10.1093/cid/ciz872. [DOI] [PMC free article] [PubMed] [Google Scholar]
- Gould LH, Nelson RS, Griffith KS, Hayes EB, Piesman J, Mead PS, Cartter ML, 2008. Knowledge, attitudes, and behaviors regarding Lyme disease prevention among connecticut residents, 1999–2004. Vector Borne Zoonotic Dis. 8, 769–776. 10.1089/vbz.2007.0221. [DOI] [PubMed] [Google Scholar]
- Gupta S, Eggers P, Arana A, Kresse B, Rios K, Brown L, Sampson L, Kploanyi M, 2018. Knowledge and preventive behaviors towards tick-borne diseases in delaware. Ticks Tick Borne Dis. 9, 615–622. 10.1016/j.ttbdis.2018.01.006. [DOI] [PubMed] [Google Scholar]
- Hamer SA, Hickling GJ, Sidge JL, Walker ED, Tsao JI, 2012. Synchronous phenology of juvenile Ixodes scapularis, vertebrate host relationships, and associated patterns of Borrelia burgdorferi ribotypes in the midwestern United States. Ticks Tick Borne Dis. 3, 65–74. 10.1016/j.ttbdis.2011.11.004. [DOI] [PubMed] [Google Scholar]
- Hanson MS, Edelman R, 2003. Progress and controversy surrounding vaccines against Lyme disease. Expert Rev. Vaccines 2, 683–703. 10.1586/14760584.2.5.683. [DOI] [PubMed] [Google Scholar]
- Hook SA, Nelson CA, Mead PS, 2015. U.S. public’s experience with ticks and tickborne diseases: results from national healthstyles surveys. Ticks Tick Borne Dis. 6, 483–488. 10.1016/j.ttbdis.2015.03.017. [DOI] [PMC free article] [PubMed] [Google Scholar]
- Hornbostel VL, Krell RK, Reid JJ, Schappach BL, Volpe S, Connally NP, 2021. Spray safe, play safe: story-based films increase homeowner confidence about backyard tick management. J. Med. Entomol. 58, 857–865. 10.1093/jme/tjaa230. [DOI] [PubMed] [Google Scholar]
- Kianersi S, Luetke M, Wolfe CG, Clark WA, Omodior O, 2020. Associations between personal protective measures and self-reported tickborne disease diagnosis in Indiana residents. J. Commun. Health 45, 739–750. 10.1007/s10900-020-00789-w. [DOI] [PubMed] [Google Scholar]
- Kugeler KJ, Schwartz AM, Delorey MJ, Mead PS, Hinckley AF, 2021. Estimating the frequency of Lyme disease diagnoses, United States, 2010–2018. Emerg. Infect. Dis. 27, 616–619. 10.3201/eid2702.202731. [DOI] [PMC free article] [PubMed] [Google Scholar]
- Lantos PM, Tsao J, Nigrovic LE, Auwaerter PG, Fowler VG, Ruffin F, Foster E, Hickling G, 2017. Geographic expansion of Lyme disease in Michigan, 2000–2014. Open Forum Infect. Dis. 4, ofw269. 10.1093/ofid/ofw269. [DOI] [PMC free article] [PubMed] [Google Scholar]
- Michigan Department of Health & Human Services, 2015. Michigan Zoonotic and Vectorborne Disease Surveillance Summary 2014. https://www.michigan.gov/documents/emergingdiseases/Lyme_Disease_Summary_2014_496325_7.pdf/(accessed 28 May 2021).
- Minnesota Department of Health, 2019. Lone star tick reports by county in Minnesota. https://www.health.state.mn.us/diseases/tickborne/longstarstickreportsmap.pdf/ (accessed 28 May 2021).
- Minnesota Department of Health, 2020. Lyme disease statistics. https://www.health.state.mn.us/diseases/lyme/statistics.html/ (accessed 23 April 2021).
- Nawrocki CC, Hinckley AF, 2021. Experiences with tick exposure, Lyme disease, and use of personal prevention methods for tick bites among members of the U.S. population, 2013–2015. Ticks Tick Borne Dis. 12, 101605 10.1016/j.ttbdis.2020.101605. [DOI] [PMC free article] [PubMed] [Google Scholar]
- Nesgos AT, Harrington LC, Mader EM, 2021. Experience and knowledge of Lyme disease: a scoping review of patient-provider communication. Ticks Tick Borne Dis. 12, 101714 10.1016/j.ttbdis.2021.101714. [DOI] [PMC free article] [PubMed] [Google Scholar]
- Niesobecki S, Hansen A, Rutz H, Mehta S, Feldman K, Meek J, Niccolai L, Hook S, Hinckley A, 2019. Knowledge, attitudes, and behaviors regarding tickborne disease prevention in endemic areas. Ticks Tick Borne Dis. 10, 101264 10.1016/j.ttbdis.2019.07.008. [DOI] [PMC free article] [PubMed] [Google Scholar]
- Phillips CB, Liang MH, Sangha O, Wright EA, Fossel AH, Lew RA, Fossel KK, Shadick NA, 2001. Lyme disease and preventive behaviors in residents of Nantucket Island, Massachusetts. Am. J. Prev. Med. 20, 219–224. 10.1016/s0749-3797(00)00315-9. [DOI] [PubMed] [Google Scholar]
- Pritt BS, Allerdice MEJ, Sloan LM, Paddock CD, Munderloh UG, Rikihisa Y, Tajima T, Paskewitz SM, Neitzel DF, Hoang Johnson DK, Schiffman E, Davis JP, Goldsmith CS, Nelson CM, Karpathy SE, 2017. Proposal to reclassify Ehrlichia muris as Ehrlichia muris subsp. muris subsp. nov. and description of Ehrlichia muris subsp. eauclairensis subsp. nov., a newly recognized tick-borne pathogen of humans. Int. J. Syst. Evol. Microbiol. 67, 2121–2126. 10.1099/ijsem.0.001896. [DOI] [PMC free article] [PubMed] [Google Scholar]
- Pritt BS, Respicio-Kingry LB, Sloan LM, Schriefer ME, Replogle AJ, Bjork J, Liu G, Kingry LC, Mead PS, Neitzel DF, Schiffman E, Hoang Johnson DK, Davis JP, Paskewitz SM, Boxrud D, Deedon A, Lee X, Miller TK, Feist MA, Steward CR, Theel ES, Patel R, Irish CL, Petersen JM, 2016. Borrelia mayonii sp. nov., a member of the Borrelia burgdorferi sensu lato complex, detected in patients and ticks in the Upper Midwestern United States. Int. J. Syst. Evol. Microbiol. 66, 4878–4880. 10.1099/ijsem.0.001445. [DOI] [PMC free article] [PubMed] [Google Scholar]
- Rosenberg R, Lindsey NP, Fischer M, Gregory CJ, Hinckley AF, Mead PS, Paz-Bailey G, Waterman SH, Drexler NA, Kersh GJ, Hooks H, Partridge SK, Visser SN, Beard CB, Petersen LR, 2018. Vital signs: trends in reported vectorborne disease cases - United States and territories, 2004–2016. MMWR Morb. Mortal. Wkly. Rep. 67, 496–501. 10.15585/mmwr.mm6717e1. [DOI] [PMC free article] [PubMed] [Google Scholar]
- Schotthoefer A, Stinebaugh K, Martin M, Munoz-Zanzi C, 2020. Tickborne disease awareness and protective practices among U.S. forest service employees from the Upper Midwest, USA. BMC Public Health 20, 1575. 10.1186/s12889-020-09629-x. [DOI] [PMC free article] [PubMed] [Google Scholar]
- Schwartz AM, Hinckley AF, Mead PS, Hook SA, Kugeler KJ, 2017. Surveillance for Lyme disease - United States, 2008–2015. MMWR Surveill. Summ. 66, 1–12. 10.15585/mmwr.ss6622a1. [DOI] [PMC free article] [PubMed] [Google Scholar]
- Scrimenti RJ, 1970. Erythema chronicum migrans. Arch. Dermatol. 102, 104–105. [PubMed] [Google Scholar]
- Shen AK, Mead PS, Beard CB, 2011. The Lyme disease vaccine–a public health perspective. Clin. Infect. Dis. 52 (Suppl 3), s247–s252. 10.1093/cid/ciq115. [DOI] [PubMed] [Google Scholar]
- U.S. Bureau of Labor Statistics, 2020. 2018 Standard occupational classification system. https://www.bls.gov/soc/2018/major_groups.htm/ (accessed 23 April 2021).
- United States Census Bureau, 2021. Selected social characteristics in the United States. https://www.census.gov/acs/www/data/data-tables-and-tools/data-profiles// (accessed 10 June 2021).
- University of Wisconsin-Madison, 2021. Amblyomma americanum (lone star tick) https://wisconsin-ticks.russell.wisc.edu/wisconsin-ticks/amblyomma-americanum-lone-star-tick// (accessed 28 May 2021). [Google Scholar]
- Wisconsin Department of Health Services, 2019. Lyme disease: wisconsin data https://www.dhs.wisconsin.gov/tick/lyme-data.htm/ (accessed 23 April 2021).
Associated Data
This section collects any data citations, data availability statements, or supplementary materials included in this article.