

Abstract
We sequenced and assembled using multiple long-read sequencing technologies the genomes of chimpanzee, bonobo, gorilla, orangutan, gibbon, macaque, owl monkey, and marmoset. We identified 1,338,997 lineage-specific fixed structural variants (SVs) disrupting 1,561 protein-coding genes and 136,932 regulatory elements, including the most complete set of human-specific fixed differences. We estimate that 819.47 Mbp or ~27% of the genome has been affected by SVs across primate evolution. We identify 1,607 structurally divergent regions wherein recurrent structural variation contributes to creating SV hotspots where genes are recurrently lost (e.g., CARD, C4, ABCD7, OLAH gene families) and additional lineage-specific genes are generated (e.g., CKAP2, VPS36, NEK5 paralogs) becoming targets of rapid chromosomal diversification and positive selection (e.g., RGPD gene family). High-fidelity long-read sequencing has made these dynamic regions of the genome accessible for sequence-level analyses within and between primate species.
Brief statement
Analysis of high-quality, haplotype-resolved primate genomes provides a more complete understanding of lineage-specific, recurrent mutations and structurally divergent regions associated with primate adaptive evolution and human diseases.
INTRODUCTION
An early and still unmet grand challenge of the Human Genome Project has been to reconstruct the evolutionary history of every base pair of the human reference sequence1–5. To do so requires both a diverse sampling of nonhuman primate (NHP) genomes as well as a more complete assembly of those genomes so that all forms of variation can be assessed without bias introduced from a superior quality reference6–13. Early attempts to sequence closely related ape species focused primarily on characterizing simpler forms of variation (e.g., single-nucleotide variants, (SNVs)) from portions of the genome that could be readily aligned to human or smaller forms of structural variants (SVs)7–10,13. As long-read sequence assemblies emerged, our ability to catalog larger forms of structural variation significantly improved resulting in a series of more contiguous NHP genomes. These updated references, however, represented “squashed” assemblies where allelic variation was collapsed and the most complex forms of gene-rich SVs were still not fully resolved, especially among recently duplicated sequence14–20. Advances in long-read sequencing (LRS) technology over the last three years now allow for most of these regions to be accurately sequenced and assembled to a degree where both paralogous and allelic variation can be readily distinguished21–26. Numerous studies focused on the human lineage have shown that such regions are incubators for the emergence of new genes, adaptive evolution while also contributing to disease, and disease susceptibility27–29.
To better characterize SVs and these complex genic SV regions, we generated genome assemblies for eight NHP genomes using two LRS platforms. Owing to the greater contiguity of these primate genomes, larger, more complex regions now become more apparent. We developed an approach to identify structurally divergent regions (similarity ≤85% and length ≥10 kbp) that were unequivocally anchored to unique sequence at their flanks but could not simply be reconstructed by a simple SV event30. We refer to these as structurally divergent regions or SDRs because they are both divergent at the sequence level and often characterized by multiple or recurrent rearrangements between species.
Our plan for the development of this primate LRS resource was twofold. First, we wanted to broaden the characterization of primate phylogenetic diversity by sequencing additional NHP genomes using the same sequencing platform (in this case continuous LRS or PacBio CLR [continuous long read]) that had been initially applied to the other ape references to minimize sequencing technology biases. This included sequence and assembly of primate genomes representing gibbon (Nomascus leucogenys), marmoset (Callithrix jacchus), and owl monkey (Aotus nancymaae) (Table 1). Second, we wanted to leverage the higher accuracy and assembly contiguity of HiFi (high-fidelity) sequencing data to investigate more complex SVs that had been poorly characterized or missed by previous analyses. This higher resolution technology served as a means to validate all fixed SV events as well as provide complete haplotype-resolved access to any particular regions of interest without the need to construct and annotate these different NHP genomes for yet a third time.
Table 1.
Primate genome sequence and assembly
| Common name | Scientific name | Individual ID | Sex | CLR raw data and assembly | HiFi raw data and assembly | Iso-Seq (Gbp) | ONT (Gbp) | ||||
|---|---|---|---|---|---|---|---|---|---|---|---|
| reads (coverage) | assembly (contig N50, Mbp) | QV | reads (coverage) | assembly (contig N50, Mbp) | QV hap1/hap2 | ||||||
| Chimpanzee | Pan troglodytes (common chimpanzee) | Clint_PTR | M | 117 | 12.27 | 39.19 | 37 | 66.89/49.98* | 45/44 | 1.94 | 294 (178*) |
| Bonobo | Pan paniscus (pygmy chimpanzee) | Mhudiblu_PPA | F | 74 | 15.06 | 39.25 | 39 | 50.45/36.22* | 47/47 | 1.38 | 124* |
| Gorilla | Gorilla gorilla gorilla (western lowland gorilla) | Kamilah_GGO | F | 84.3 | 9.52 | 38.72 | 31 | 38.19/37.87* | 46/46 | 1.84 | 264* |
| Orangutan | Pongo abelii (Sumatran orangutan) | Susie_PAB | F | 94.9 | 11.07 | 34.83 | 43 | 62.38/58.39* | 42/42 | 1.09 | 272 (126*) |
| Gibbon | Nomascus leucogenys (northern white-cheeked gibbon) | Asia_NLE | F | 92.5* | 12.78* | 38.65 | 31* | 44.67/34.99* | 43/43 | 15.25* | 97* |
| Macaque | Macaca mulatta (Rhesus monkey) | AG07107_MMU | F | 66 | 46.61 | 36.18 | 29 | 18.81/19.01* | 51/52 | 104.58 | 329 (231*) |
| Marmoset | Callithrix jacchus (white-tufted-ear marmoset) | CJ1700_CJA | F | 66* | 25.23* | 42.95* | 39* | 103.97/87.06* | 58/58 | 18.43* | NA |
| Owl monkey | Aotus nancymaae | 86718_ANA | F | 56.3* | 9.85* | 37.4* | 31* | 55.92/44.99* | 57/57 | NA | 91* |
New data in this study.
RESULTS
Genome assembly of NHP genomes
Building on previous analyses of African great ape genomes14,15,19, we first sequenced and assembled three additional female NHP genomes using CLR sequencing, namely, white-cheeked gibbon, the common marmoset, and owl monkey. Each genome was sequenced to high depth (>56-fold coverage), assembled, and error corrected as described previously14,15,17,19 (Data S1 and Data S2). We generated highly contiguous (contig N50=9.9 to 25 Mbp) squashed assemblies of ~2.84–2.9 Gbp with an overall sequence accuracy of >99.98% (Table 1 and Data S2). Next, to further reduce sequencing error and increase our ability to investigate more complex regions, we sequenced the same eight NHP samples using PacBio HiFi sequencing19,22 (Table 1, Data S1, and Data S2). We used hifiasm to produce haplotype-resolved genomes that were consistently smaller among monkeys (5.84 to 6.23 Gbp, diploid) when compared to nonhuman apes21 (6.12 to 6.98 Gbp). These HiFi assemblies are estimated to be more accurate (QV=42 to 58 or 99.9937% to 99.9998% accuracy) and significantly more contiguous (contig N50=19 to 104 Mbp) when compared to previous CLR draft genome assemblies (Table 1 and Data S1).
NHP sequence divergence and incomplete lineage sorting (ILS)
As a baseline for sequence divergence among the lineages, we mapped the HiFi sequence data from each NHP back to human and computed single-nucleotide divergence. The mean autosomal sequence divergence ranged from 1.3% to 9.83%, consistent with the expected phylogeny, and was predictably higher than that of the X chromosome (0.99% to 8.24%; Figure 1a and 1b, and Data S2). We note that these estimates are also slightly higher than earlier reports, likely because we are accessing a greater fraction of repetitive DNA and are using a different aligner (minimap2 versus BLASR)7,15 (Data S2). An assembly-based comparison yields similar results but involves a smaller fraction of the genome due to extensive and more complex forms of structural variation (Data S1 and Data S2).
Figure 1. Primate phylogeny and single-nucleotide variant (SNV) divergence between nonhuman primates (NHPs) and humans.

(a) A primate time-calibrated phylogeny was constructed from a multiple sequence alignment (MSA) of 81.63 Mbp of autosomal sequence from nine genomes. The estimated species divergence time (above node) with 95% confidence interval (CI, horizontal blue bar) was calculated using BEAST2. All nodes have 100% posterior possibility support, and the gene tree concordance factor is indicated (below node). The inset (gray) depicts a maximum likelihood phylogram, which reveals a significantly shorter branch length in owl monkey, with respect to marmoset. (b) SNV divergence calculated by mapping HiFi sequence reads to human GRC38 separately for autosomes and the X chromosome (excluding pseudoautosomal regions). Owl monkey shows significantly less divergence compared to human than the marmoset (Wilcoxon rank sum test). (c) The percent of trees showing an alternate tree topology are indicated (percentages are drawn from a total of 302,575 gene trees): 159,546 (52.7%) support the primate topology depicted in panel a.
We used these data to generate a time-calibrated phylogeny for the nine primate species, including human (Figure 1a and 1b, Data S2). While the majority of trees (52.7%) are consistent with the generally accepted phylogeny, the fraction of alternate topologies is, once again, greater than previous estimates8,9,19,31 (Figure 1c, Data S2). Most of the difference can be attributed to potential ILS during African ape or great ape speciation as gene tree concordance factors show the lowest values in these two nodes32. Lineage-specific branch lengths are generally balanced with one notable exception: the owl monkey branch length is significantly shorter and divergence to human significantly lower when compared to marmoset (Figure 1a). An analysis of 16,244 gene trees using human as an outgroup to both owl monkey and marmoset shows that the owl monkey evolves significantly slower (p=0 autosome, p=6.85 × 10−185 for the X chromosome) (Data S1). Excluding potential sites of ILS, we estimated split times of the species and find that mean split times of the apes better match the lower bounds of previous estimates33–38 (Data S2).
Primate lineage-specific versus shared SVs
We applied a three-pronged approach to discover and validate SVs (≥50 bp) mapping to the euchromatic portion of the primate lineages18,39. We first compared the eight NHP genomes against the human reference genome, including three additional human genomes (CHM13, HG00733, and NA19240) to mitigate the effect of human polymorphism and missing variants in a particular reference (Data S2). In total, we identified 2.23 million putative insertions and 1.89 million deletions in these nine lineages. Using both HiFi sequence data and genome assemblies, we validated 1.85 million insertions and 1.63 million deletions (mean validation rate: 86.79% and 89.37%, respectively) (Data S2). We note that genome-based HiFi and CLR SV calling are highly congruent (>95%) although HiFi tended to recover larger insertions, including the breakpoints of more complex events (Data S1). Finally, we generated Oxford Nanopore Technologies (ONT) sequence data from the same primate DNA samples and manually inspected a subset (900 SV events) estimating a false positive rate of ~2.6% and a false negative rate of ~11.4% for our initial SV discovery approach (Data S1 and Data S2; here the false positive and negative rates refer to the initial SV discovery callset).
To distinguish fixed from polymorphic events, we further genotyped the validated SVs against Illumina whole-genome sequence (WGS) data from a panel of 120 primate genomes40–44 (Data S2). We projected the 1,338,997 fixed events (441,453 deletions and 897,544 insertions) onto the primate phylogeny (Figure 2a and Data S2) classifying events as shared or lineage specific. The number of SV events correlates strongly with evolutionary genetic distances separating species (Figure 2b) with characteristic insertion peaks at ~6 kbp and 300 bp—full-length L1 and Alu mobile element insertions (Data S1 and Data S2). Remarkably, we estimate that 27.2% of the genome (819.47 Mbp) has been subjected to structural variation across these nine lineages with fixed insertions outnumbering deletions approximately two to one (the total length of shared and lineage-specific insertions is ~524.8 Mbp versus ~294.68 Mbp of deletions) (Figure 2a). The excess of insertions is greatest for the ancestral ape and African great ape lineages (~2- to 3-fold) (Figure 2a and Data S2) and this twofold excess is still observed when calibrating for the number of fixed SNV differences45,46 (Figure 2b and Data S1).
Figure 2. Primate genome structural variation.

(a) The number of fixed structural variants (SVs) including deletions (red) and insertions (blue) are shown for each branch of the primate tree (number of events above the line and number of Mbp below). The number of “disrupted” protein-coding genes based on human RefSeq models are also indicated (black oval) with the total number of events (first number) and the subset specific to each lineage (second number). The numbers assigned to the ancestral branches refer to the ancestral lineage-specific SVs (e.g., Pan lineage (bonobo and chimpanzee ancestry shared)). (b) The number of fixed SVs correlates with the accumulation of SNVs in each lineage (comparison to GRCh38) for both deletions (red) and insertions (blue). (c) An ape-specific fixed L1 insertion (a red dashed line box) in the human genome but not in the macaque genome serves as an exapted exon of the short isoform of astrotactin 2, ASTN2, in human. (d) A 42.7 kbp lineage-specific deletion in the gibbon genome (red dashed line) deletes TAAR2 and seven enhancers (shown in orange) compared to the human (GRCh38). (e) A 90 bp deletion (30 amino acids) human-specific deletion of NAT16 (NM_001369694) removes 30 amino acids in humans compared to all other NHPs.
A small fraction of fixed primate SVs affect genes (~18.78 Mbp of deletions and ~1.31 Mbp insertions). Using human gene annotation as a guide, we annotated the fixed SVs against the human gene models (GRCh38, RefSeq) and the regulatory element database (ENCODE)47,48. The fixed SVs independently intersect 136,455 regulatory elements and 6,067 genes, including 1,561 protein-coding genes (Data S2). Of these, 244 genes and 1,759 regulatory elements are reported for the first time in this study (Data S1). Such is the case for the 3,741 bp L1PA5 insertion shared in apes mapping to the last exon of the neuronal-function gene, astrotactin 2 (ASTN2), which encodes a glycoprotein that guides neuronal migration during the development of the central nervous system49,50. The insertion creates a transcript isoform resulting in an exon in human (NM_1884735) and this innovation is accompanied by a 1 bp deletion in this exon, which in gibbon, orangutan, and gorilla is incapable of read-through due to a frameshift from the reciprocal 1 bp insertion (Figure 2c and Data S1). In gibbon, we identify a large ~42.7 kbp deletion of the neurogenesis-associated gene, trace-amine associated receptor 2 (TAAR2), along with seven of its enhancers (Figure 2d and Data S1). Loss of this brain-expressed gene in knockout mice has been shown to result in higher levels of dopamine and lower levels of norepinephrine in the striatum and hippocampus respectively51. A complete list of these gene and gene-regulatory fixed SVs is provided along with additional discussion (e.g., ACAN, AR, SPATA1, ELN, and MAGEB16) (Data S1).
We also reassessed and reclassified 7,169 human-specific changes because of the inclusion of more outgroup species in addition to the use of a more accurate sequence aligner (minimap2 versus BLASR) that improves alignment within repetitive regions such as subtelomeres52,53 (Data S1). The human-specific changes include 13 additional genes and 252 additional regulatory elements as potentially disrupted compared to our previous report15 (Data S1). For example, a 90 bp deletion within the third exon of N-acetyltransferase 16 (NAT16) results in a 30 amino acid loss in the human lineage with respect to all other NHPs (Figure 2e and Data S1). NAT16 is highly expressed in the brain and pituitary and is responsible for Nα-acetylhistidine synthesis, but its biological function remains unknown.
To illustrate the potential functional impact of these lineage-specific fixed SVs, we first examined the interaction between lineage-specific SVs and differentially expressed genes (DEGs) identified by available single-cell RNA-seq data from 57 cell types available from adult human and chimpanzee cortex54. Next, we integrated recently generated neuron progenitor ATAC-seq from human and chimpanzee neuroepithelial cells to investigate the association of fixed SVs with regulatory elements in neuronal development and gene expression at single-cell resolution from primary tissue (mature neurons in chimpanzee and human). As expected from previous studies15, we find that lineage-specific SVs significantly intersect with DEGs though this signal is more pronounced for some cell types when compared to others (Data S2). For example, human-specific SVs associate with downregulated genes in L6IT1 (intra-telencephalic-projecting excitatory neurons in cortical layer 6) cell type (Figure S1). We identify 30 previously unpublished genes where a lineage-specific SV both disrupts an ATAC-seq signal in neuronal progenitor cells and is associated with a DEG in mature cortical neurons. Of these, 9 are human-specific, 15 are specific to the Pan lineage (chimpanzee and bonobo), and 6 are specific to chimpanzee (Data S2).
Structurally divergent regions (SDRs)
During our comparison of monkey and ape chromosomes, we identified much larger SDRs that had been missed or incompletely assayed by previous standard SV analyses (Data S1). These regions were often gene-rich but had eluded complete characterization due to their sequence divergence and/or structural complexity55 and now could be assessed by our HiFi-based assemblies (Table 1). We, therefore, developed a graph-based approach to more systematically identify such regions (≥10 kbp in length) in apes and macaques that could not be readily mapped to the complete human genome (T2T-CHM13) with ≥85% sequence identity30. We identified 1,704 SDRs and validated 1,607 SDRs using assembly-based approaches56 (validation rate: 94.3%) (Data S2). SDRs were large (average 127.4 kbp, Data S1) and enriched 3.6-fold for large segmental duplications (SDs) (Data S1; p=0). Specifically, 423 SDRs (26.3%) contain at least 10 kbp of annotated SDs while 1,184 appeared to map to relatively unique regions of the genome (Data S2), although subsequent sequence analysis identified 2.2% of these (1.07 Mbp) as lineage-specific SDs not present in human SD annotations.
Similar to the SVs, we genotyped all SDRs using Illumina WGS from primate population samples and successfully assigned 1,050 of the SDRs to lineage-specific branches on the primate phylogeny (Data S1). However, 557 SDRs show evidence of recurrent or serial SVs among multiple NHP lineages and the majority (62.3% or 347/557) associate with SD sequences (Data S2). We identified 184 distinct hotspot regions where we predict significant large-scale and recurrent structural variation among different primate lineages (331 recurrent SDRs) (Figure 3a and Data S2). Of these, 88% (162/184) harbor SDs and 56% (103/184) of these hotspots correspond to 631 genes, including many known medically relevant regions such as CFHR, RHD, LPA, APOL, AMY1, and the major histocompatibility complex (MHC) locus (such as MICA/MICB and the complement C4)57–60 (Figure 3a and Data S1). Others are discovered in this study or have been partially described based on analyses of specific primate genomes57–60. A gene ontology analysis predicts an expected enrichment for the known widespread loss of olfactory receptors in primates (p=3 × 10−85) as well as genes associated with thiol-dependent ubiquitinyl hydrolase activity (p=1.9 × 10⁻²⁴), antimicrobial activity (p=2.2 × 10⁻⁵), innate immune response (p=5 × 10⁻⁵), neurotransmitter receptor activity (p=2.5 × 10⁻⁴), etc. (Data S2). Notably, many of these enrichments are associated with core duplicons, including DEFBs, NPIPs, RGPDs, CYPs, NBPFs, GOLGAs, UGTs, RHDs, and USPs60,61 (Data S2).
Figure 3. Structurally divergent regions (SDRs) of the primate genome.
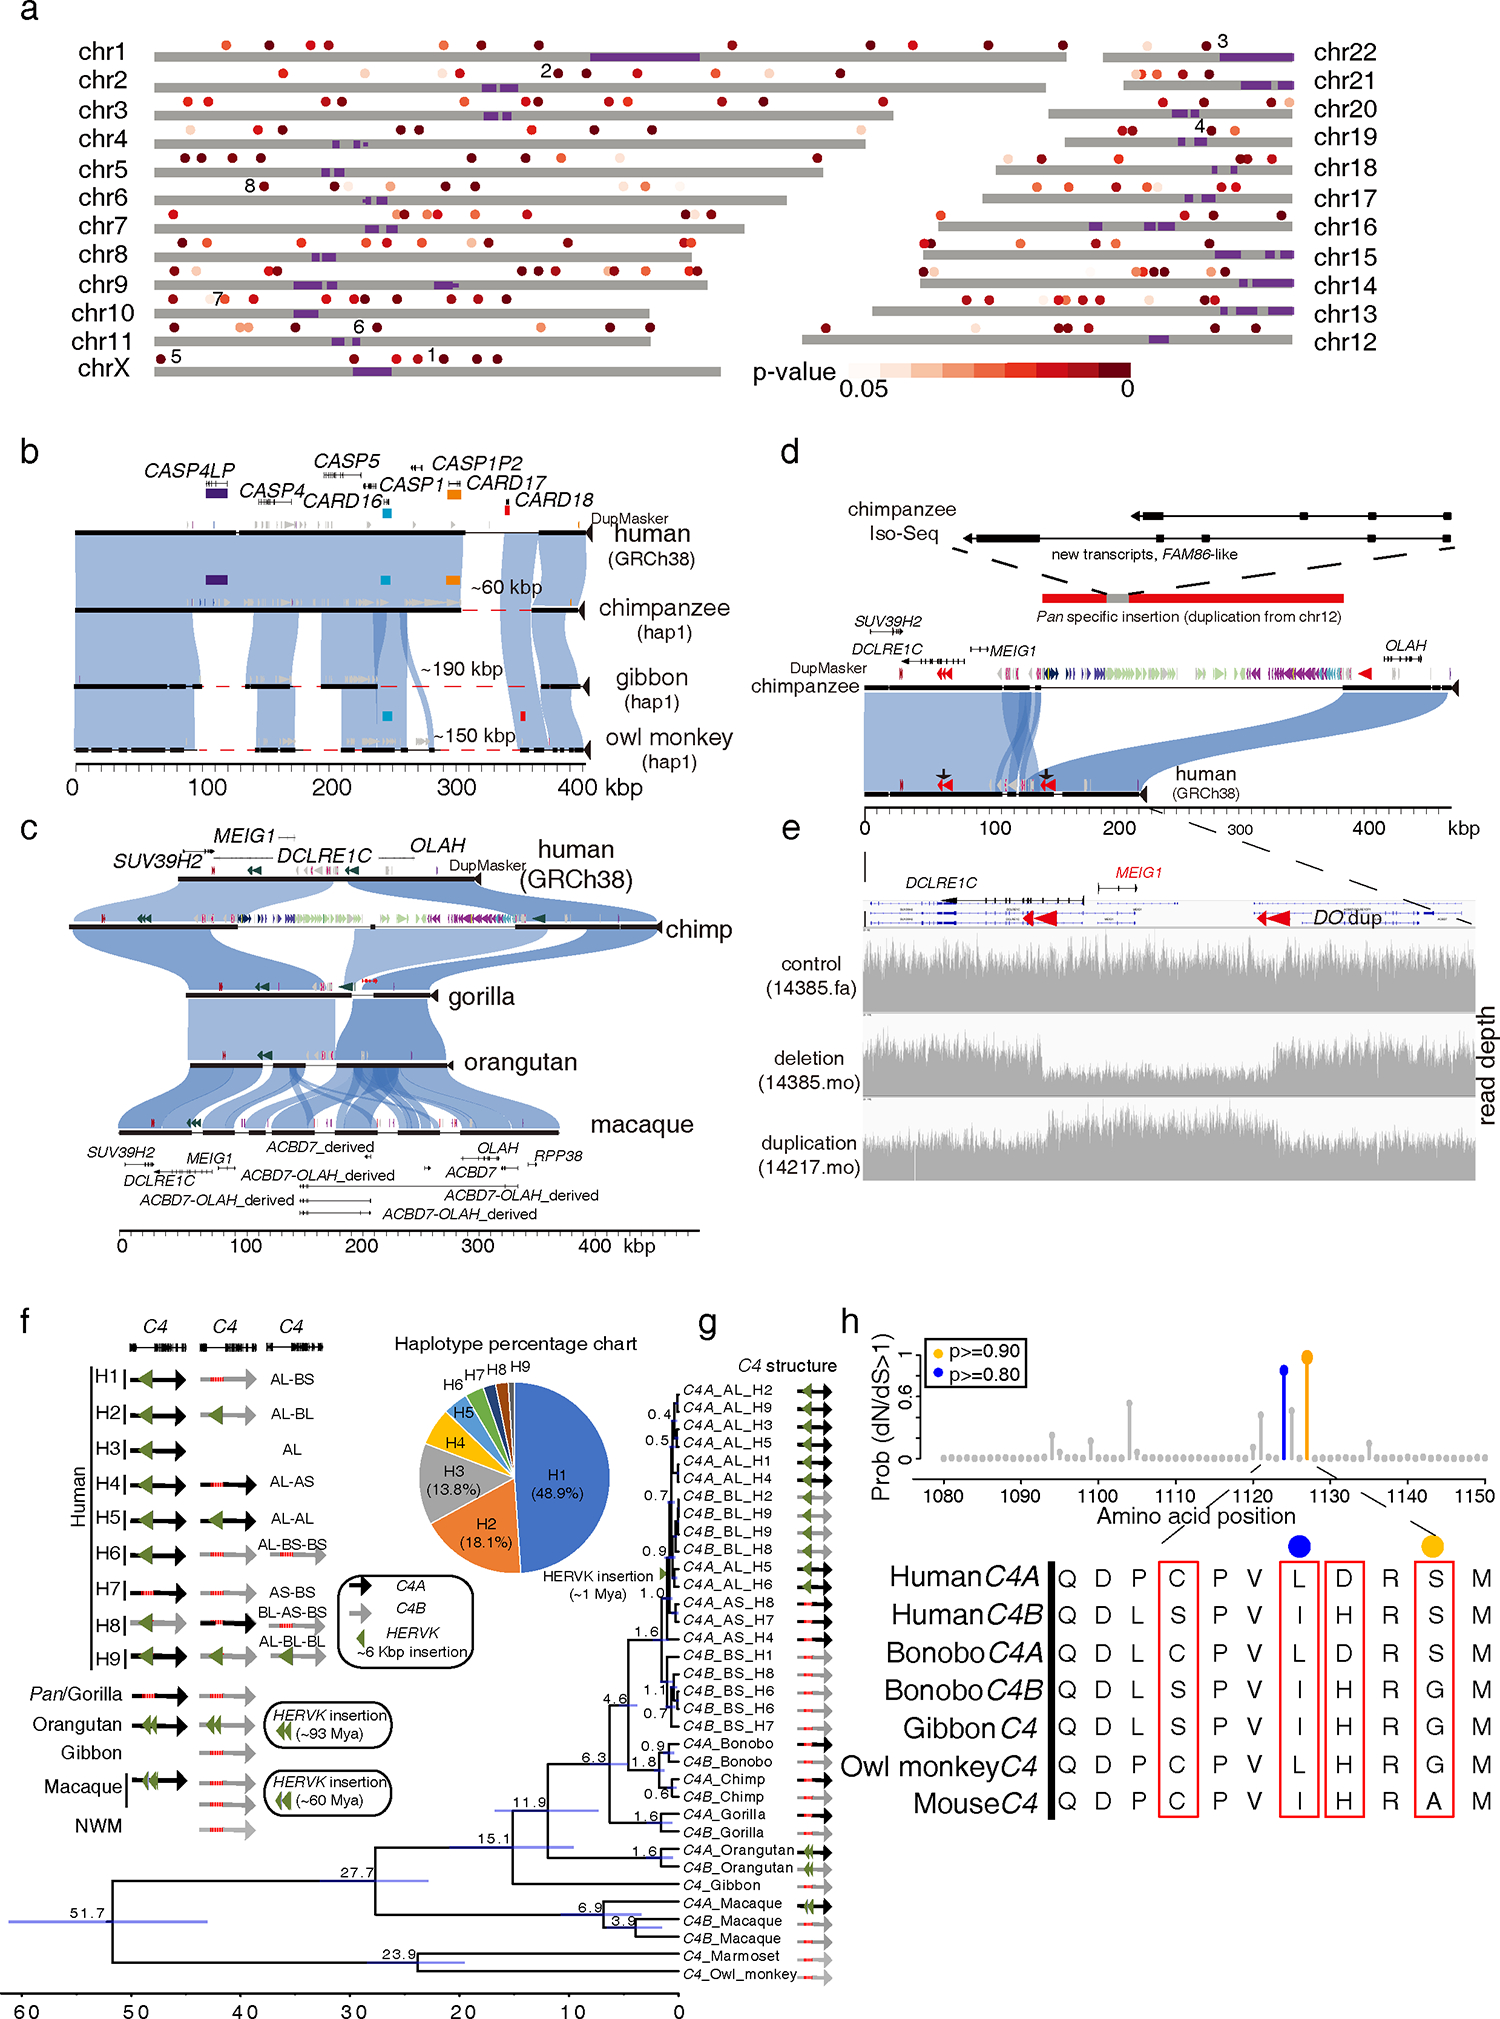
(a) A schematic of human chromosomes (T2T-CHM13) depicts SDR hotspots where recurrent rearrangements occur in excess. Heatmap indicates significance based on simulation model (dark (p=0) to light red (p=0.05)). Centromeres are depicted in purple. Enumerated regions identify specific gene families or regions of biomedical interest (1: UPRT, 2: RGPDs, 3: USP41, 4: ZNFs, 5. IL3RA_2, 6: CARDs, 7: OLAH, and 8: MHC). (b) Recurrent deletion of the caspase recruitment domain (CARD) gene family. (c) SafFire plot of SDRs mapping to genes OLAH, MEIG1, and ABCD7 in human shows a large ~250 kbp insertion of segmental duplications (SDs; colored arrowheads) in chimpanzee within the intergenic region between MEIG1 and OLAH. Full-length transcript sequencing of macaque using Iso-Seq supports the formation of five alternate transcripts, including four OLAH-ABCD fusion events and a derived ABCD7 (macaque gene models below). (d) The chimpanzee-specific 250 kbp SD from chromosome 12 creates a multi-exonic gene model supported by Iso-Seq transcript sequencing in chimpanzee (upper panel) with an unmethylated promoter (Data S1). (e) In humans, the directly oriented (DO) repeats associate with the breakpoints of recurrent deletions and duplications of the spermiogenesis gene MEIG1. Two females carrying a deletion and a duplication are depicted from a population sample of 19,584 genomes (CCDG, https://ccdg.rutgers.edu/). (f) C4 haplotypes in primates. Nine human haplotypes from 94 HPRC haplotypes and other NHP haplotypes from this study are shown in the left panel. The percentage of nine human haplotypes is shown in the right panel. The mean ages of nodes are shown, and the horizontal bars represent 95% CI of node ages. (h) Human gene C4 under positive selection. The probability of sites under positive selection is shown on top based on the PAML branch-site model: >90% probability (orange) and >80% probability (blue). The corresponding amino acid alignment in primates is shown in the bottom panel. The amino acids under positive selection with at least 50% probability are indicated (colored dots and red boxes).
We confirmed, for example, that CARD18 (caspase recruitment domain family member 18) was lost in the ancestral Pan lineage by a ~60 kbp deletion event13. We identified, however, a larger and independent deletion of ~190 kbp in the gibbon lineage that completely removes the entire gene cluster—CARD16 (pLI=0.04), CARD17 (pLI=0), and CARD18 (pLI=0.05). A third independent deletion of ~150 kbp removed yet another member, CARD17, in the owl monkey suggesting that this entire gene family has been under relaxed selection during primate evolution (Figure 3b and Data S1). Other hotspots are more complex, such as the OLAH-ACBD7 region showing evidence of both gain and loss of genes (Figure 3c). In gorilla, OLAH (pLI=0) is deleted by a ~32 kbp deletion (Data S1) whereas in macaque the locus has been the target of a ~190 kbp duplication that truncates OLAH in that lineage but also creates a paralogous copy of ACBD7, which is actively transcribed as a fusion gene (Figure 3c). In Pan, the same region has been the target of a ~250 kbp SD that originated from chromosome 12 and produces a Pan-specific transcript with an open-reading frame (ORF) of 97 amino acids whose promoter region is hypomethylated (Figure 3d and Data S1). This large insertion of an SD in the Pan lineage also had the benefit of removing one of two directly orientated duplications flanking MEIG (meiosis/spermiogenesis associated 1), theoretically eliminating recurrent microdeletion/microduplication of MEIG1 in the Pan lineage (Figure 3d and 3e). A 28 kbp genomic duplication region has been depleted in orangutans, but this has not resulted in any alteration of gene content (Data S1). MEIG1 (pLI=0.05) is a spermiogenesis-related gene and MEIG1 deficiency severely disrupts mouse spermatogenesis and is potentially associated in human infertility62–64.
One of the regions classified as an SDR was the D4Z4 repeat locus—a region associated with the double homeobox 4 gene (DUX4) and facioscapulohumeral muscular dystrophy when misexpressed in humans65,66. Comparing the assemblies of this region among the primate species reveals a remarkably complex pattern of lineage-specific variation, including changes in the underlying repeat structure (LSAU repeat family), dramatic changes in size, and characteristic repeat patterns associated that distinguish each species (Figure S2 and Data S2). A phylogenetic reconstruction of the region indicates independent, recurrent, and rapid restructuring of the D4Z4 region independently in the different primate lineages (Figure S2). Despite such extensive evolutionary turnover, analysis of DUX4 shows that the ORF is retained (Figure S2).
Another SDR hotspot is the MHC, where we observe extensive copy number polymorphisms of the duplicated gene C4 among primates. We find a single copy of C4 in New World monkeys (marmoset and owl monkey) and gibbon, in contrast to macaque and great ape genomes whose genomes harbor at least two copies of C4 (Figure 3f). Using 94 human reference genomes from the Human Pangenome Reference Consortium (HPRC), we identify nine distinct structural haplotypes67 (Figure 3f). The C4 phylogeny shows independent clustering of C4A and C4B in each primate lineage indicating recurrent duplication or/and gene conversion of the locus (Figure 3g). All C4 genes associated with the HERVK insertions are monophyletic with an estimated age of ~1 million years ago (mya) consistent with the age based on divergence from repeat consensus (Figure 3g). Among other NHPs, the HERVK insertions are estimated as much older. Positive selection tests indicate that two amino acids (L1124 and S117) are under selection between hC4A and hC4B (p<0.001) (Figure 3h). These residues are exposed on the thioester domain of the hC4 protein and associate with catalytic functions suggesting that the two hC4 proteins have different binding affinities to amino and hydroxyl groups68. In addition, a recent study has shown that hC4A is more efficient than hC4B in synaptic pruning and higher expression of hC4A has been associated with schizophrenia69.
Marmoset SDRs
To assess the potential for SDRs to serve as cradles for gene innovation, we repeated our SDR analysis in a more distantly related primate. Using our graph-based approach, we compared human and marmoset and identified 697 SDRs (~38.45 Mbp) that could not be orthologously aligned to the complete human reference genome. Next, we manually clustered them into 270 distinct SDRs (Data S2). To facilitate gene discovery in marmoset, we generated ~5.13 million full-length cDNA transcripts from 10 distinct primary tissues (Table 1 and Data S2). We identified five regions with evidence of structurally divergent transcripts that lacked orthologous counterparts in the human genome (Data S1 and Data S2). Of particular interest was a gene-rich region of human chromosome 13 that had been subject to a series of inversions and duplications increasing by ~350 kbp in size and adding nine putative marmoset-specific genes (Figure 4a). We searched for gene expression using the marmoset Iso-Seq transcript resource and confirmed expression for five of these—VPS36, UTP14C, NEK5, THSD1, and CKAP2 broadly in the brain as well as other tissues (Figure 4b, Data S1 and Data S2). In addition, our phylogenetic analysis estimates that the marmoset-specific duplication of the THSD-NEK region occurred ~11.9 mya and these duplicated genes maintain a protein-encoding ORF with numerous amino acid replacements as well as changes in gene structure when compared to progenitor copies (Data S2).
Figure 4. Marmoset-specific genes in an SDR.

(a) SafFire plot comparing the organization of a gene-rich region of ~1.1 Mbp in human (middle), owl monkey (top), and marmoset (bottom) genomes. (b) Iso-Seq full-length non-chimeric transcript sequencing from 10 marmoset primary tissues confirms transcription of 8/10 of the paralogous copies and the maintenance of an open-reading frame in at least six of these marmoset-specific gene candidates. Cell types identified from human (c) and marmoset (d) cortex single-nuclei RNA-seq. The tSNE plots show the cell type identified by specific markers (Ex: excitatory, In: inhibitory, Oligo: oligodendrocytes, Astro: astrocytes, Micro: microglia, OPC: Oligodendrocyte precursor cells). The tSNE plots for human VPS36 (e) and marmoset VPS36_ori (f) show the increased proportion of neuroglial cells expressing VPS36 paralogs in marmosets compared to humans. (g) The proportion of neuroglial cells expressing VPS36 in human and expressing VPS36, VPS36_L1, VPS36_L2 in marmoset.
To gain further insight into the expression patterns of the duplicated genes at a single-cell resolution within a marmoset SDR, we generated an RNA-sequencing dataset of 11,797 single-nuclei from the prefrontal cortex of a female marmoset. This dataset included 5,245 excitatory neurons, 2,529 inhibitory neurons, 848 oligodendrocytes, 773 astrocytes, 507 microglia cells, and 432 oligodendrocyte precursor cells (Data S1). Using the singly unique nucleotide k-mer (SUNK) mapping approach22,70, which allowed us to distinguish between the different copies of the duplicated genes, we observed the increased proportion of neurons expressing THSD1_L2 compared to a proportion of neurons expressing THSD1_ori (expression proportion of neurons to neuroglia, THSD1_ori:51%, THSD1_L1:67%, THSD1_L2:123%; chi-square test, THSD1_ori vs. THSD1_L1: p=0.21 and THSD1_ori vs. THSD1_L2: p<0.001) (Data S2). Interestingly, when comparing the proportion of these genes expressed in different cell types (neurons to neuroglial cells) between humans and marmosets, we found the increased proportion of neuroglial cells expressing VPS36 paralogs in marmosets compared to humans (chi-square test: p<0.001) (Figure 4c–f and Data S1 and Data S2). These findings highlight potential species-specific differences in the expression patterns of newly minted duplicated genes in marmosets when compared to humans warranting further investigations into their neurobiological function in the species.
Recurrent RGPD duplications and restructuring of ape chromosome 2
Our SDR analysis of apes identified five SDRs on human chromosome 2 associated with a single core duplicon: RGPD (chr2:105859737–114023252, p=0) (Figure 5a). RGPD is a fusion gene/transcript formed by the duplication and juxtaposition of the two ancestral genes, RANBP2 and GCC2, less than 15 mya71. Given the contiguity of the HiFi genome assemblies, we focused on a detailed reconstruction of the evolutionary history of this gene family across a ~7 Mbp region of chromosome 2 relating its expansion to large-scale structural changes and potential gene innovation associated with the SDRs in humans (Data S1). No evidence of RGPD genes exist in macaques, marmosets, or owl monkeys where only the ancestral RANBP2 and GCC2 genes are found syntenically among all primates (Data S1). Phylogenetic analyses confirm its formation and general expansion in copy number in the ancestral ape lineage (Data S1). Both the phylogeny and the sites of integration, however, reveal that most interspersed duplications are independent—the result of recurrent SDs or gene conversion events (Figure 5a and 5b, Data S1). For example, none of the gibbon or orangutan duplicate copies map syntenically to each other or other African great apes—while orangutan has multiple RGPDs, all originated independently, and none have orthologs among the other apes and group as distinct clade within the tree (Figure 5b and Data S1). We identify only one paralogous gene, hRGPD2, that is syntenic and orthologous among the African great apes. Within the five different ape lineages, we estimate ~20 independent mutation events (total length: ~1.2 Mbp) representing one of the most extreme examples of homoplasy (Figure 5a and Data S1).
Figure 5. Evolution, selection, and disease susceptibility of the RGPD gene family.

(a) Schematic depicting RGPD genes (red dots) compared to its progenitor gene RANBP2 (orange dot) in apes. Shared ancestral copies among the lineages are indicated (vertical arrows) in contrast to lineage-specific duplications (black) or gene conversion events (blue dashed arced arrow). (b) A maximum likelihood tree based on a 58.98 kbp MSA of 40 RGPD great ape copies outgrouped with a sole gibbon copy. The mean ages of divergence are shown above the node (95% CI blue bar) for human (H), bonobo (B), chimpanzee (C), gorilla (G), orangutan (O), and gibbon (Gib) copies. (c) A comparison of ~7 Mbp on chromosome 2 among ape genomes showing that large breakpoints in synteny (colored rectangles) often correspond to sites of RGPD SD insertions (blue arrows). (d) Human genetic diversity (pi) calculated from 94 haplotype-resolved human genomes (HPRC) for a 700 kbp region of chromosome 2. A segment mapping to the human-specific gene RGPD1 shows the lowest genetic diversity on chromosome 2 (top panel, red arrow) in haplotypes of both African (red) and non-African (blue) descent. (e) AlphaFold predictions of the protein N-terminus structure RANBP2 (blue), hRGPD1 (pink), and hRGPD2 (green) predict that differences in amino acid composition alter the secondary structure of two alpha helices (α1 and α2) in the human-specific RGPD1 copy. (f) SafFire plot (top panel) comparing the chimpanzee and human genomes highlights the formation of a 350 kbp human-specific duplication creating RGPD6 (red shading). (g) Analysis of 102 human haplotypes shows that the RGPD6 locus is largely fixed among all humans but that the organization of the flanking SDs differs significantly. We identify 11 distinct structural haplotypes in the human population predicting both disease susceptibility as well as protective haplotypes for nonallelic homologous recombination (NAHR).
Most of the RGPD interspersed SDs were accompanied by both local restructuring of the duplication blocks as well as larger-scale structural rearrangements of the chromosome 2 flanking sequence, especially in association with large-scale inversions in different NHP lineages (Figure 5c and Data S1). Haplotype-resolved sequence assemblies allowed the origin and spread of lineage-specific copies to be distinguished phylogenetically (Figure 5b). Human RGPD3 and RGPD4 are not phylogenetically, for example, orthologs of chimpanzee RGDP3 and RGPD4 even though they appear syntenic (Figure 5b and Data S1) suggesting potential gene conversion. In addition, the emergence of many RGPDs in apes appears to have been driven by recurrent large-scale inversions, duplicative transpositions, and deletions within a ~7 Mbp genomic region over the last 15 million years of evolution creating specific configurations and distinct copies in each ape lineage (Figure S3).
RGPD1 is a human-specific paralog predicted to have arisen ~570 thousand years ago (kya) within the Homo lineage (Figure 5b). This specific copy has several amino acid replacements at the protein N-terminus with respect to all other human RGPDs—this change is predicted to alter the protein structure between hRGPD1 and its antecedent hRGPD272 (Figure 5d). In this regard, it is interesting that the hRGPD1 genomic region shows a dearth of genetic diversity based on the analysis of HPRC haplotype-resolved assemblies (pi value=4.65 × 10⁻⁵, p<0.05, Tajima’s D= −1.98) (Figure 5e and Data S1) consistent with the region potentially being subjected to a recent selective sweep specifically in the human lineage.
In comparison to human, most of the copies mapping to bonobo and chimpanzee chromosome 2 represent independent expansions from ancestral RANBP2 that also gave rise to human RGPD5, RGPD6, and RGPD8 (Data S1). Of note, RGDP6 is a human-specific gene copy that arose via segmental duplication or gene conversion from human RGPD5 most recently (~5.2 kya, 95% CI [0.002,16.08]) (Figure 5b and 5f). The interval between these human-specific copies, which includes NPHP1, is subjected to both inversion toggling and microdeletion associated with Joubert syndrome and juvenile nephronophthisis as a result of nonallelic homologous recombination between inverted and directly orientated duplications25,73,74, respectively (Figure 5g and Data S1). We examined 94 human phased haplotypes from the HPRC and Human Genome Structural Variation Consortium18,25,67,75 and identified 11 distinct structural configurations—four predisposing to microdeletion (Figure 5g, Figure S4 and Figure S5). We also identified a single pathogenic allele deleting NPHP1 (HG00733) and confirmed maternal transmission (Data S1). A maximum likelihood phylogenetic analysis identified the most closely related (non-deleted) haplotype and breakpoint analysis confirms that the deleted allele arose from one of the haplotypes predisposing to microdeletion (Figure 5g and Data S1). Given the recent evolutionary restructuring of this region of chromosome 2, it follows that this predisposition to microdeletion is specific to the human lineage.
DISCUSSION
Using three LRS platforms across multiple primate genera, we present a comprehensive analysis of SVs within euchromatic DNA of the primate order. The use of HiFi data and inclusion of additional NHP species as well as genotyping in population samples significantly improves earlier surveys of fixed SV events40–44 and extends the analysis deeper within the primate phylogeny. Among the great apes for example, we identify 244 genes and 1,759 regulatory elements affected by SVs not previously reported15 (Data S1). Similarly, while we identify all 16 previously identified ape-specific genic SVs, 13/16 are no longer classified as (great) ape-specific SVs (Data S2) due to the inclusion of other NHP lineages16. Among the 6,067 genes (both coding and noncoding) and 136,932 regulatory DNA associated with fixed SVs, we find a significant enrichment in transcription regulation (p=1. 1 × 10⁻⁹), sensory transduction (p=6.3 × 10⁻³), cell division (p=2.3 × 10⁻²), and vocal learning (3.4 × 10⁻³) (Data S2).
The overall topology of the primate phylogenetic tree is consistent with previous expectations with the proportion of ILS generally increasing as more of the repetitive content is accessed by LRS technology19 (Figure 1). Our comparison of two New World monkey lineages, however, reveals significant acceleration of the marmoset SNV branch length when compared to that of the owl monkey (branch length: 0.024 vs. 0.017). This finding is also consistent with the shorter blocks of synteny in the marmoset lineage when compared to the human genome and the significant increase in the number of recent SDs (only 102 regions >500 kbp compared to 169 regions >500 kbp in the owl monkey, 165.7 Mbp in marmoset vs. 125.7 Mbp in owl monkey) (Data S2). The slower evolution of the owl monkey lineage compared to marmoset may simply be a consequence of differences in reproductive longevity as has been proposed41 or changes in the generation time of the two lineages during evolution. The three major clades of New World monkeys, however, are thought to have diverged over a short time frame (19–24 mya)37,38,76,77 (Figure 1a). Studying multi-generational pedigrees, Thomas and colleagues showed a 32.5% reduction in the rate of de novo mutation in owl monkey when compared to that of apes with an overall mutation rate of 0.81 × 10⁻⁸ per site per generation41. Our results suggest that this reduced mutation rate may be a longstanding property of the Aotinae with the net consequence that the owl monkey genome is less derived when compared to marmoset. These findings have some practical considerations regarding the use of these different New World monkeys as models for human disease78–80.
A major advantage of HiFi sequence and assembly is access to more complex regions of genetic variation that had been excluded or incompletely characterized as part of previous CLR-based primate genome assemblies. For example, using a graph-based approach we identified 1,604 SDRs among apes and macaque (Figure 3) of which a third (n=557) showed evidence of recurrent structural variation and were enriched for SDs. We hypothesize that these hotspots of recurrent structural variation and their associated 631 genes demarcate either regions of the ape genome no longer under selection (mean pLI=0.133) (e.g., CARD18, OLAH, etc.) or, more interestingly, regions where rapid structural diversification has facilitated the emergence of genes showing signatures of positive selection (e.g., C4, RGPDs, NPIPs, NPFs)81–83 (Figures 3 and 5) and/or important for adaptive specializations in different primate lineages27,84,85. Ironically, the innovations often come at a cost with respect to fitness as the SDRs are associated with human disease susceptibility regions (e.g., 1q22.3, 2q13, 16p11.2, 10p13), such as the human-specific duplication of RGPD6 and Joubert syndrome deletion alleles (Figure 5).
Our analysis also suggests that SDRs are common in the primate genome though with few exceptions these regions have not been considered as part of previous large-scale sequencing efforts because of 1) difficulties in their assembly and 2) challenges they pose in alignment even among closely related species when fully resolved. We identified, for example, SDRs in marmoset compared to owl monkey giving rise to marmoset-specific duplicate genes (Figure 4). Using our resource of ~5.13 million full-length transcripts, we show that these duplicate genes are expressed in the brain, maintain an ORF, and emerged specifically since marmoset diverged from owl monkey ~20 mya (Data S1). The ancestral genes have critical functions: NEK5, for example, is member of NimA family of serine/threonine protein kinases involved in cell differentiation while CKAP2 (cytoskeleton associated protein 2) is involved in cell division86,87. These findings caution against simply using human gene models to annotate NHP genomes or to assess NHP gene expression differences from single-cell RNA-seq experiments.
Limitations of the Study
In summary, we generated an LRS resource of eight NHP species representing six distinct phylogenetic branchpoints with respect to the human lineage. We generated data from the same sequencing platform to construct de novo genome assemblies without guidance from a human reference genome and validated all complex events using HiFi and ONT data from the same source. The greater contiguity afforded by long reads provides access to larger, more complex, lineage-specific SDRs (e.g., RGPDs, C4, and D4Z4). A common theme is that these particular genomic regions are enriched in recurrent SV changes in different lineages due to changes in selective pressure resulting in the emergence of lineage-specific genes. Notwithstanding, there are several limitations. First, our study does not provide detailed functional analyses that could elucidate the precise roles of these lineage-specific SVs or genes but rather the sequence framework to begin to do so. Second, while these genomes are more contiguous, they are not complete. Highly repetitive heterochromatic regions (e.g., centromeres and subterminal heterochromatin) and acrocentric regions are not yet resolved and will require a dedicated effort to generate validated telomere-to-telomere (T2T) genomes. Finally, the use of a human reference genome in mapping all NHP genomes introduces potential reference biases. Although constructing a cross-species pangenome graph is a promising approach to resolve such remaining reference biases20,24,88, considerable resources are required to create T2T genomes that are also comparably annotated in order to provide balanced functional insights into the role of lineage-specific SVs.
STAR*Methods
Resource availability
Lead contact
Further information and requests for resources should be directed to and will be fulfilled by Lead Contact Evan E. Eichler (eee@gs.washington.edu).
Materials availability
This study did not generate any new reagents or materials. All cell lines in this study are available from the lead contact upon request.
Data and code availability
The raw PacBio CLR, HiFi, and ONT data are deposited in NCBI under BioProject accession number PRJNA877605. The CLR and HiFi NHP assemblies are deposited in NCBI under BioProject accession numbers PRJNA941350- PRJNA941365. The marmoset Iso-Seq data and single-cell RNA-seq data are deposited under NCBI BioProject accession number PRJNA566173. Accession numbers are also included in the Key Resources Table.
All pipelines and scripts used in this study are publicly available in GitHub or public domain (https://github.com/MaoYafei/NHP_Genomes_scripts and https://eichlerlab.gs.washington.edu/help/yafmao/NHP_Genomes_scripts). All original code has been deposited at Zenodo and DOI included in the Key Resources Table.
Any additional information required to reanalyze the data reported in this work paper is available from the lead contact upon request.
KEY RESOURCES TABLE.
| REAGENT or RESOURCE | SOURCE | IDENTIFIER |
|---|---|---|
| Biological Samples | ||
| Owl monkey | This study | 86718_ANA |
| Deposited Data | ||
| PacBio CLR reads for owl monkey | This study | NCBI:PRJNA877605 |
| PacBio CLR reads for gibbon | This study | NCBI:PRJNA369439 |
| PacBio HiFi reads and assemblies for owl monkey | This study | NCBI:PRJNA941350, PRJNA941350, and SRR21642072 |
| PacBio HiFi reads and assemblies for macaques | This study | NCBI:PRJNA941358, PRJNA941359, SRR21803674 SRR21803673, and SRR21642077 |
| PacBio HiFi reads and assemblies for gibbon | This study | NCBI: PRJNA941361, PRJNA941360, SRR21803681, SRR21642080, SRR21642079, and SRR21642081 |
| PacBio HiFi reads and assemblies for marmoset | This study | NCBI: PRJNA941356, PRJNA941357, and SRR21642074 |
| PacBio HiFi reads and assemblies for chimpanzee | This study, Mao et al.,19 and Logsdon et al.,22 | NCBI: PRJNA941354, PRJNA941355, SRR21803678, SRR21803677, SRR21755677, SRR21755680, SRR21755678, SRR21755679, SRR21755676, SRR21642086, and SRR21642075 |
| PacBio HiFi reads and assemblies for gorilla | This study, Mao et al.,19 and Logsdon et al.,22 | NCBI: PRJNA941352, PRJNA941353, SRR21803675, SRR21642084, SRR21642066, and SRR21642067 |
| PacBio HiFi reads and assemblies for bonobo | This study, Mao et al.,19 and Logsdon et al.,22 | NCBI: PRJNA941363, PRJNA941362, SRR21803679, and SRR21642068 |
| PacBio HiFi reads and assemblies for orangutan | This study, Mao et al.,19 and Logsdon et al.,22 | NCBI: PRJNA941365, PRJNA941364, SRR21803672, SRR21803680, and SRR21642082 |
| HPRC genome assemblies | Public HPRC data | https://humanpangenome.org/ https://github.com/human-pangenomics/HPP_Year1_Assemblies |
| WGS Illumina data for 1KG panel | Byrska-Bishop et al.,44 | NCBI: PRJEB37677 |
| WGS Illumina data for NHP panel | Prado-Martinez et al.,40, Thomas et al.,41, Rogers et al.,42 Okhovat et al.,43 | NCBI: PRJNA189439, PRJNA451475, and PRJNA54005 |
| Experimental Models: Cell Lines | ||
| Marmoset cell line | Eichler Lab | CJ1700_CJA |
| Gibbon cell line | Carbone Lab | Asia_NLE |
| Macaque cell line | Eichler Lab | AG07107_MMU |
| Chimpanzee cell line | Eichler Lab | Clint_PTR |
| Gorilla cell line | Eichler Lab | Kamilah_GGO |
| Bonobo cell line | Carbone Lab | Mhudiblu_PPA |
| Orangutan cell line | Eichler Lab | Susie_PAB |
| Experimental Models: Organisms/Strains | ||
| Owl monkey | Sawyer Lab | 86718_ANA |
| Marmoset | Feng Lab | CJ-16-183 |
| Software and Algorithms | ||
| PAV | Ebert et al.,18 | https://github.com/EichlerLab/pav |
| pbsv | PacBio | https://github.com/PacificBiosciences/pbsv |
| Sniffles | Sedlazeck et al.,39 | https://github.com/fritzsedlazeck/Sniffles |
| minimap2 | Li et al.,53 | https://github.com/lh3/minimap2 |
| hifiasm | Cheng et al.,21 | https://github.com/chhylp123/hifiasm |
| SV-Pop | Ebert et al.,18 | https://github.com/EichlerLab/svpop |
| TREEasy | Mao et al.,89 | https://github.com/MaoYafei/TREEasy |
| IQ-TREE | Minh et al.,32 | http://www.iqtree.org/ |
| BWA | Li,90 | http://bio-bwa.sourceforge.net/ |
| SAMtools | Li et al.,91 | http://samtools.sourceforge.net/ |
| BEDTools | Quinlan and Hall,92 | https://bedtools.readthedocs.io/ |
| paragraph | Chen et al.,93 | https://github.com/Illumina/paragraph |
| MashMap | Jain et al.,30 | https://github.com/marbl/MashMap |
| VEP | Ensembl | https://github.com/Ensembl/ensembl-vep |
| Guppy | ONT | https://github.com/nanoporetech |
| BEAST2 | Bouckaert et al.,94 | https://www.beast2.org/ |
| Cell Ranger | 10X Genomics | https://www.10xgenomics.com/support/software/cell-ranger |
| Seurat | Satija lab | https://github.com/satijalab/seurat |
| Rhodonite | Eichler Lab | https://doi.org/10.5281/zenodo.6036498 |
| Deposited Data | ||
| Original code | This study | https://doi.org/10.5281/zenodo.10570381 |
Experimental model and study participant details
Cell culture
A marmoset cell line (CJ1700_CJA, BioSample: SAMN30617511) cultured in DMEM F12 media, a macaque cell line (AG07107_MMU, BioSample: SAMN30617510) cultured in MEM Alpha media, a chimpanzee cell line (Clint_PTR, BioSample: SAMN30617505) cultured in DMEM media, a gorilla cell line (Kamilah_GGO, BioSample: SAMN30617507) cultured in MEM Alpha, and an orangutan cell line (Susie_PAB, BioSample: SAMN30617508) cultured in MEM media were grown in the Eichler lab. A bonobo cell line (Mhudiblu_PPA, BioSample: SAMN30617506) and a gibbon cell line (Asia_NLE, BioSample: SAMN30617509) from the Carbone lab were cultured in RPMI 1640 medium.
Animal procedures
All animal experiments were performed in accordance with the guidelines of Massachusetts Institute of Technology, The University of Texas MD Anderson Cancer Center, University of Colorado, North Carolina State University, and Shanghai Jiaotong University’s Institutional Animal Care and Use Committee. An adult female owl monkey (86718_ANA) from the Sawyer lab and an adult marmoset from the Feng lab (CJ-16–183) were used for DNA and RNA sequencing.
Method details
Genome sequencing and assembly
CLR library preparation and sequencing
Immortalized lymphoblast cell lines (Asia_NLE) were obtained from Dr. Lucia Carbone and cultured and harvested for nucleic acid extraction using a modified Gentra Puregene protocol15. Genomic DNA was fragmented using Megaruptor (Diagenode) on 45–70 kbp settings and prepared with Template Prep Kit (PacBio) according to standard protocols. The resulting libraries were size-selected on a BluePippin instrument (Sage Science) at 15, 20, or 30 kbp high-pass cutoffs and sequenced at the University of Washington or Ontario Institute for Cancer Research (OICR) on PacBio RSII instruments using P6/C4v2 chemistry and 6-hour movies.
Blood samples (86718_ANA) were harvested from a female individual housed at The University of Texas MD Anderson Center and graciously provided courtesy of Dr. Sara Sawyer, University of Colorado, Boulder. Fresh blood was processed to isolate white blood cells and then frozen. High-molecular-weight (HMW) DNA was extracted from the frozen leukocytes using a modified Gentra Puregene protocol15 and sheared using Megaruptor (Diagenode) at the 60 kbp setting. SMRTbell libraries were generated using the Express Prep kit V2 (PacBio) and standard protocols. Libraries were size-selected on a BluePippin instrument (Sage Science) using a 40 kbp high-pass cutoff and sequenced on a Sequel II instrument at the University of Washington using P1/C1 chemistry and a 15-hour movie time.
Gibbon and owl monkey CLR genome assembly
We applied Falcon (version available on 7/7/2017 git hash 647e3726 and FALCON-integrate git hash 53444482, https://github.com/PacificBiosciences/FALCON-integrate) to assemble the gibbon genome using Falcon parameters length_cutoff = 15000 and length_cutoff_pr = 15000. We then quivered with the version of Falcon available on 5/1/2017 git hash 3a3e5817 and FALCON-integrate git hash de859006. We used Pilon version 1.17 along with our in-house FreeBayes-based indel-correction pipeline using FreeBayes v1.0.2–6-g3ce827d15. We scaffolded using Bionano Genomics software and then we used clone-end mapping and alignments to the previous gibbon reference UCSC version nomLeu3 to scaffold into chromosomes10,15,19.
HiFi library preparation and sequencing
HMW DNA was extracted from blood (86718_ANA) or cultured cells (all others) using the Gentra Puregene kit (Qiagen) or Monarch HMW DNA Extraction Kit for Cells and Blood (New England Biolabs). DNA quantity was assessed at each subsequent step using the Qubit High Sensitivity DNA kit (ThermoFisher) read on a DS-11 FX instrument (DeNovix) and DNA fragment length distributions evaluated on a FEMTO Pulse capillary electrophoresis instrument (Agilent).
DNA was sheared using gTUBE (Covaris) (Asia_NLE), Megaruptor (86718_ANA) or Megaruptor 3 (Diagenode) (Clint_PTR, Susie_PAB, AG07107_MMU, CJ1700_CJA) using settings to target 20 kbp mode insert length. SMRTbell libraries were generated with the SMRTbell Prep Kit v3 (PacBio) (AG07107_MMU) or Express Template Prep Kit v2 (all others) according to standard protocols. Size selection was performed with one of the following methods: SageELF (Sage Science) fractionation and re-pooling (Asia_NLE); BluePippin high-pass size selection (86718_ANA, 12 kbp cutoff); or PippinHT (Sage Science) high-pass size selection (Clint_PTR, Susie_PAB, AG07107_MMU, CJ1700_CJA, cutoff values from 10 to 15 kbp)19,22.
All HiFi libraries were sequenced at the University of Washington on a Sequel II instrument using 30-hour movie times and 0–4 hour pre-extension. Datasets were generated with P2/C2 chemistry (Asia_NLE, CJ1700_CJA, 86718_ANA), P2.2/C2 chemistry (Clint_PTR, Susie_PAB, AG07107_MMU), or P3.2/C2 chemistry (AG07107_MMU). Some data used in this analysis were previously described in our earlier studies19,22,60.
Nonhuman primate (NHP) HiFi genome assembly
Haplotype-resolved genome assemblies were generated using hifiasm version 0.15.2 and 0.16.1 with default parameters21. To evaluate assembly errors, we employed an in-house pipeline called NucFreq (https://github.com/mrvollger/NucFreq). Additionally, for complex regions, we used GAVISUNK with ONT reads to further evaluate genome assembly errors95.
Genome assembly quality assessment with Merqury
To estimate the quality value (QV), we utilized Merqury version 1.196. Merqury uses a high depth of coverage set of Illumina reads and looks for k-mers that are found in the assembly but not in the set of Illumina reads. It assumes such k-mers contain an error. It uses a specifical model to calculate the error rate of the assembly and thus a QV.
Iso-Seq full-length cDNA sequencing
The immortalized lymphoblast line (Asia_NLE) was expanded, harvested, and total RNA extracted with the RNeasy Mini kit (Qiagen). Full-length cDNA were generated using the TeloPrime Full-Length cDNA Amplification Kit V2 (Lexogen) and SMRTbell templates created with the Template Prep Kit (PacBio). The same material was used for full-length cDNA generation with the NEBNext Single Cell cDNA Synthesis kit (New England Biolabs) and SMRTbell libraries created with the Express Template Prep Kit v2 according to the Iso-Seq Express protocol (PacBio). Libraries were barcoded during adapter ligation and pooled for sequencing on a Sequel II instrument at the University of Washington. Sequencing proceeded with P2EA/C2 chemistry with 30-hour movies and 2-hour pre-extension on two SMRT Cell 8Ms.
Full-length cDNA was prepared and sequenced from total RNA isolated from various tissues of both a 2-year-old male and a 2-year-old female Callithrix jacchus (marmoset), provided by Ricardo del Rosario, Anna Neumann, and Katelyn Flowers at the Broad Institute. Iso-Seq library production was performed as per the Iso-Seq Express protocol and barcoded using barcoded adapters. One library was generated for each tissue. Libraries were pooled in an equimolar fashion and sequenced on three SMRT Cells 8M on the Sequel II platform at the University of Washington using P2EA/C2 chemistry, 30-hour movies, and 2-hour pre-extension.
Phylogenetic and single-nucleotide variant (SNV) diversity analysis
Multiple sequence alignment (MSA) generation
We chunked the human reference genome (GRCh38) into 500 bp segments without overlap and mapped these segments to a human telomere-to-telomere (T2T) genome (T2T-CHM13) as well as other NHP HiFi genomes. A total of 974,287 and 63,549 segments of autosome and chromosome X, respectively, were successfully mapped to the orthologous regions of all sample genomes. The mapped coordinates of each genome were extracted using SAMtools (v1.9)91, and we utilized MAFFT (v7.453)97 with parameters (--maxiterate 1000 --localpair) to generate 1,037,836 MSAs, which represents 518.9 Mbp.
Gene tree and species tree reconstruction
We used IQTREE (v1.6.11) to reconstruct maximum likelihood (ML) gene trees for each MSA with parameters (-bb 1000 -m MFP+MERGE -redo -nt 1)89,98. To reduce biases from gene tree uncertainty and lower gene tree discordance of the sex chromosome, we focused only on gene trees with bootstraps greater than 50 and reconstructed by autosome loci. Then, we used the ete3 module package in Python to count the number of different gene tree topologies among the 302,575 gene trees. The scripts were modified from our previous pipeline89.
To reconstruct the species tree, we concatenated the 302,575 MSAs and then we used IQTREE (v1.6.11) to reconstruct the ML species tree with parameters (-bb 1000 -redo -nt 8 -m MFP)89,98. In addition, we used the multi-species coalescent model with ASTRAL (v5.7.1)99 to generate the coalescent species tree and found the topologies of ML species tree and coalescent species tree were identical: ((marmoset,owl_monkey),(macaque,(gibbon,(orangutan,(gorilla,((chimp,bonobo),human)))))).
We found 900 different gene tree topologies among 302,575 gene trees: 159,546 gene trees (52.7%) show the same topology of the species tree, and the rest (143,029, 47.3%) are inconsistent with the species tree, including 28,439 gene trees with topology ((marmoset,owl_monkey),(macaque,((gibbon,orangutan),(gorilla,(human,(bonobo,chimp)))))), 25,502 gene trees with topology ((marmoset,owl_monkey),(macaque,(orangutan,(gibbon,(gorilla,(human,(bonobo,chimp))))))), 8,642 gene trees with topology ((marmoset,owl_monkey),(macaque,((gibbon,orangutan),((human,gorilla),(bonobo,chimp))))), 8,434 gene trees with topology ((marmoset,owl_monkey),(macaque,((gibbon,orangutan),(human,(gorilla,(bonobo,chimp)))))), and other. We then used IQTREE2 (v2.1.2) to calculate the gene tree concordance factor with species tree and the gene tree distribution100.
To reconstruct the time-calibrated phylogeny of primates, we used 159,546 MSAs with gene trees whose topology is consistent with the species tree as input to run a Bayesian phylogenetic analysis with BEAST294. We employed an HKY model with gamma site, calibrated yule, and relaxed clock log normal models. Fossil information from previous studies was used as prior parameters to estimate the node ages with log normal models. We performed 20 independent runs, and 19 runs were convergent with ESS values greater than 200. For each node, we estimated the mean and 95% confidence interval based on the 19 means from the successful independent runs. Additionally, we reconstructed the time-calibrated phylogeny of primates with all sites, including ILS and non-ILS sites, using the same parameter setting. We performed 20 independent runs, and 17 runs were convergent with ESS values greater than 200.
SNV diversity analysis with read mapping approach
We first divided the human reference genome (GRCh38) into two parts: autosome and chromosome X, and we removed the homologous regions between chromosome X and chromosome Y on the chromosome X part. Then, we used minimap2 (v2.16)53 with strict parameters (-s 10000 -t 12 --eqx -ax asm20 --secondary=no -z 10000,50 -r 50000 --end-bonus=100 -O 5,56 -E 4,1 -B 5) to map NHP HiFi reads to the human genome and then calculated SNV diversity between each read and the human genome to generate the distribution of SNV diversity for each NHP.
SNV diversity analysis with 20 kbp segment alignment approach
As described above, we divided the human genome into two parts, and we chunked the two parts into 20 kbp segments without overlapping13. Next, we mapped the 20 kbp segments to the NHP HiFi genomes with minimap2 (v2.16)53 with relaxed parameters (-t 12 --eqx -ax asm20 --secondary=no). We calculated SNV diversity between each read and the human genome and generated the distribution of SNV diversity for each NHP. The SNV diversity between human and NHP from the two approaches are coincident.
Structural variant (SV) calling, validation, and annotation
SV calling with three independent methods
We applied three independent tools—PAV, pbsv (https://github.com/PacificBiosciences/pbsv), and Sniffles—to discover insertions and deletions (≥50 bp) in three human genomes (CHM13, NA19240, HG00733) and eight CLR NHP genomes against the human genome (GRCh38)18,39. While pbsv and Sniffles rely on read mapping, PAV utilizes a whole-genome alignment-based approach. The mapping and alignment coverage between the human reference genome and the other genomes ranged from 84% to 99.5% on autosomes and 71.39% to 99.9% on chromosome X. Subsequently, we merged the detected insertions and deletions for each sample using the SV-Pop tool18 (https://github.com/EichlerLab/svpop). In total, we identified 2,231,760 insertions and 1,887,877 deletions, which were based on comparisons to the human reference genome. The observed number of insertions and deletions increases with the phylogenetic distance between humans and NHPs.
Raw SV validation manually and with in-house pipeline
To reduce the false positive rate in the SV discovery set, we employed our in-house pipeline (SubSeq and SubAsm) to validate the initial discovery set using HiFi reads and HiFi genomes18. We identified 1,847,464 insertions and 1,629,659 deletions validated by our pipeline and considered them as the validated SV set. The validation rate for insertions ranged from 77.74% to 90.46%, while for deletions, it ranged from 80.68% to 94.06%. To further validate the initial discovery set, we randomly selected 50 insertions and 50 deletions for each sample from the initial discovery set, totaling 900 SVs. We manually validated these 900 SVs using ONT data and Integrative Genomics Viewer (IGV, v2.9.4)101.
SV genotyping with graph-based approach
To distinguish polymorphic and fixed SVs, we obtained high-coverage whole-genome short-read Illumina data for 30 humans, 10 bonobos, 10 chimpanzees, 7 gorillas, 9 orangutans, 11 gibbons, 10 macaques, 10 baboons, 7 marmosets, and 16 owl monkeys from previous studies and mapped them to the human genome (GRCh38) using BWA (v0.7.15)90. SAMtools (v1.9) was used to sort and fixmate the reads, and Picard was used to mark the duplicated reads. GATK (v3.7–0) was used to realign indels, and 120 high-quality BAM files with high coverage were generated91,102. We then used a graph-based tool, Paragraph, to genotype all SVs with these 120 high-quality BAM files93. The genetic difference index (Fst) between pairwise groups was calculated using VCFtools (v0.1.17)103, and SVs with an absolute Fst value greater than or equal to 0.8 were considered fixed SVs. For example, bonobo-specific fixed SVs needed to meet two criteria: (1) the SVs were exclusively discovered in the bonobo CLR genome and validated by HiFi reads/genome, and (2) the absolute Fst value of the SVs between the 10 bonobo Illumina genomes and the other 110 Illumina genomes was greater than or equal to 0.819. Here, we present the length distribution of fixed SVs, which reveals an enrichment of SVs at 300 bp and 6,000 bp lengths, corresponding to mobile element Alu and L1 elements, respectively. This observation indicates the high quality of our fixed SV sets.
SV annotation with VEP and ENCODE database
First, we converted the fixed SVs into VCF format and used Ensembl Variant Effect Predictor (VEP) to annotate the SVs with sequence ontology based on the RefSeq database of the human genome47 (GRCh38). We also used BEDTools (v2.30.0)92 to intersect the human coordinates of SVs and the regulatory elements of ENCODE (V3).
Comparative analysis of SVs
We projected the set of fixed SVs onto the primate phylogeny to identify lineage-specific and ancestral lineage-shared events. We observed a consistent trend where the number of insertions exceeded the number of deletions by at least 1.5-fold on each branch of the tree, except for the Pan lineage, which was consistent with our previous findings.
To identify mobile element insertions (MEIs) among the fixed SVs, we extracted the sequences affected by the SVs and ran RepeatMasker (v4.1.0)104 on them. If the number of types of annotated repeats within a sequence was less than or equal to 3 and the ratio of the maximum length of each type of annotated repeat to the total length of the sequence was greater than or equal to 0.98, we considered the insertion or deletion as an MEI. We then projected the MEIs onto the primate phylogeny, distinguishing between Alu and L1 insertions based on RepeatMasker104 annotation. Finally, we calculated the total length of altered sequences due to MEIs.
We projected the number of affected genes and regulatory elements onto the primate phylogeny. Our analysis revealed that a total of 6,067 genes, including 1,561 protein-coding genes and 136,932 regulatory elements, including 2,389 likely promoter elements, are disrupted by the fixed SVs across the primate lineage. We performed Gene Ontology (GO) enrichment analysis of the genes affected by the fixed SVs using the Database for Annotation, Visualization, and Integrated Discovery (DAVID)105.
Whole-genome shotgun sequence detection (WSSD) validation with lineage-specific/shared SVs
We utilized the Illumina genomes of 120 primates to run the read-depth-based WSSD and FastCN pipelines using GRCh38 and T2T-CHM13 genome assemblies106, respectively. To validate the detected deletions and insertions, we used minimiro (available at https://github.com/mrvollger/minimiro) to generate miropeat synteny comparison plots. Additionally, we plotted the read depth of the corresponding regions altered by the SVs in each primate sample to confirm the accuracy of the WSSD results.
To validate the expansion of STRs, we used ExpansionHunter (v4.0.2)107 to genotype the number of STRs in each sample. We then used ggplot2108 in R (v3.6.1) to plot the distribution of the number of STRs. Additionally, we generated dot plots of STR expansions between the human genome and other human samples and the gibbon sample using EMBOSS (v6.6.0)22.
Comparison of human-specific SVs
To ensure a fair comparison of human-specific SVs to the previous study15, we restricted our analysis to calls from the human, chimpanzee, gorilla, and orangutan genomes. We used two tools, VEP and BEDTools47,92, to annotate SVs that disrupted genes and regulatory elements, respectively. Next, we compared the disrupted genes and regulatory elements identified in our study to those from the previous study15.
Interaction among lineage-specific SVs, single cell/nuclei RNA-seq, and ATAC-seq
We first downloaded the single-cell/nuclei RNA-seq from Jorstad’s study54 and we used BEDTools92 to intersect the lineage-specific SVs and the DEGs identified from the previous study54. Next, we integrated the single-cell ATAC-seq (markers of regulatory DNA) of neuroepithelial cells of chimpanzee and human to examine the intersection between the lineage-specific SVs overlapping with the ATAC-seq peaks and DEGs. An intersection is defined as a lineage-specific SV overlapping an ATAC-seq peak and mapping within 10 kbp upstream or downstream of a gene.
Structurally divergent region (SDR) discovery and reconstruction
SDR (complex region) discovery with graph-based methods
We used Mashmap (v2.0)30, a graph-based aligner, to generate large contig pairwise comparisons between the T2T-CHM13 and other HiFi NHP genomes with the following parameters: -s 10000 -f one-to-one --pi 85 -t 12. We then focused on the regions that could not be mapped onto the T2T-CHM13 genome (SDRs). Next, we merged the SDRs identified from each lineage with BEDTools92. To validate the SDRs, we extracted the flanking regions from the T2T-CHM13 genome and remapped the unique flanking regions to the NHP HiFi genomes. We counted the length of the sequences between the uniquely mapped flanking regions in each lineage. If a deletion occurred in the SDRs on a lineage, the length would be less than that of other lineages. If an insertion/duplication/inversion occurred in the SDRs on a lineage, the length would be greater than that of other lineages56. In total, we identified 1,704 SDRs. We then used dot plots and synteny comparisons to manually validate the 1,704 SDRs, and we found that 1,607 SDRs were validated.
SDR annotation with segmental duplications (SDs) and gene information
To analyze the impact of SDRs on genes and SDs, the T2T-CHM13 CAT gene annotation and SD annotation were downloaded from the UCSC T2T-CHM13 Genome Browser109. Using BEDTools92, we intersected the SDRs with these annotations. SDRs with a proportion of SDs greater than or equal to 0.2 were classified as SD-SDRs60, while the remaining SDRs were classified as NonSD-SDRs. This allowed us to identify the SDRs that overlapped with SD regions and those that did not, which may have different functional and evolutionary consequences.
We tested whether SDs are enriched in SDRs by randomly selecting 1,607 regions corresponding to the length distribution of the 1,607 SDRs. We then calculated the number of regions containing at least 20% sequences belonging to SDs and repeated this process 1,000 times. The highest number of SD-SDRs observed among the 1,000 simulations was 102, while the observed empirical number of SD-SDRs was 423. The p-value was calculated to be 0, showing a significant enrichment of SDs in SDRs.
WSSD validation and genotype of SDRs
We focused on the genetic SDRs and used the WSSD pipeline results to calculate the read depth of the SDRs from the Illumina genomes106. We used the read depth to genotype insertions and deletions for these SDRs. In the case of gene losses in SDRs, the read depth on the genetic SDRs of a population should be significantly reduced compared to the read depth of other populations. Conversely, for gene gains in SDRs, the read depth on the genetic SDRs of a population should be significantly higher compared to other populations.
SDR hotspot analysis
The 1,607 SDRs were used to find the SDR hotspot regions with kernel density estimation25 (https://github.com/daewoooo/primatR/blob/master/R/hotspotter.R). A p-value was calculated by comparing the density profile of the genomic events with the density profile of a randomly subsampled set of genomic events. We also provided the centromere position information and, thus, the p-value is the chromosome-specific arm p-value for p arm or q arm. In total, we identified 184 hotspot regions (p<0.05). Then, we used BEDTools92 to intersect the hotspot region with gene models in T2T-CHM13 and found that 629 genes are located in the hotspot regions.
Comparative analysis of APOL
We reconstructed the deletion and insertion events of the APOL gene family in apes on a single base-pair level. The APOL gene family is involved in the immune response110. We observed only one APOL copy in New World monkeys, such as marmosets and owl monkeys. In apes, APOL1 is independently lost in Pan and orangutan, while APOL2 is independently lost in orangutan. APOL3 is a great ape–specific gene, and APOL4 is deleted in the Pan and gibbon lineages.
Comparative analysis of D4Z4 and C4
We used minimap2 to map human D4Z4 unit and DUX4 to NHP genomes to estimate their CN53. The sequence similarity within a contig of D4Z4 is estimated with StainedGlass (https://github.com/mrvollger/StainedGlass). The phylogeny of D4Z4 is reconstructed with IQTREE98.
We also extracted the C4 in the MHC class III genomic regions from NHP HiFi genomes with SAMtools (v1.20)91. Then, we used MAFFT (v7.4.3)97 to algin the genomic regions and the aligned MSA file was used to reconstruct the ML phylogeny with IQ-TREE (v1.9)98. To better reconstruct the time-calibrate tree of C4, we used C4 regions in apes and monkeys to generate MSA file and reconstructed the tree with BEAST2 with three independent runs94. In addition, minimiro was used to plot the syntenic relationship of C4 in primates.
We downloaded the human and NHP coding sequences (CDS) and protein sequences of C4 from the UCSC Genome Browser. Based on the TREEasy protocol, we used MAFFT (v7.4.3)97 to align the protein sequences and used translatorx_vLocal.pl to align the CDS based on the aligned protein sequences. Then, we ran a preliminary selection test on aBSREL (https://www.datamonkey.org/analyses) and the aBSREL tool suggests the selection signals on the C4A clade. We also ran the branch-site model in PAML (v4.9)111 and the model shows four amino acids under selection with a probability greater than 0.9 in the clade of C4A in the Bayes Empirical Bayes (BEB) analysis (p<0.001). The p-value was calculated by the likelihood ratio test in R.
RGPD analysis in primates
RGPD genome structure validation with NucFreq and GAVISUNK approaches
We mapped HiFi and ONT reads to each NHP HiFi genome. Next, we analyzed the RGPD region with the NucFreq (https://github.com/mrvollger/NucFreq) and GAVISUNK95 (https://github.com/pdishuck/GAVISUNK) pipelines. We did not observe any collapses in the RGPD regions.
Gene annotation of RGPDs and open-reading frame (ORF) discovery
We extracted full-length cDNA Iso-Seq reads from NHP induced pluripotent stem cells (iPSCs) and downloaded the protein-coding sequences of human RGPDs (GRCh38 RefSeq). We then mapped the Iso-Seq reads of each NHP and the human protein-coding sequences of RGPDs to each NHP HiFi genome and filtered out reads with mapping quality lower than 30 (Li, 2018). We used StringTie (v2.1.7)112 to predict gene models and manually validated the gene models using IGV101. If there were no Iso-Seq reads to support the RGPD gene models, we used the mapped human protein-coding sequences as a guide to predict the gene models. We used SAMtools (v1.9)91 to extract the protein-coding sequences of the gene models and predicted the ORF of the gene models using ORFfinder (https://ftp.ncbi.nlm.nih.gov/genomes/TOOLS/ORFfinder/linux-i64/, v2021-05-04) with the parameters -s 0.
Comparative and phylogenetic analysis of RGPDs
We began by extracting the RGPD and RANBP2 genomic regions from the NHP HiFi genomes and the latest mouse genome (mm39) using SAMtools (v1.9)91. Next, we aligned the genomic regions using MAFFT (v7.4.3)97, and the resulting MSA file was used to reconstruct the ML phylogeny with IQ-TREE (v1.9)98. To generate a time-calibrated tree of RGPDs, we used RGPD regions from apes and monkeys to create an MSA file, which was then used to reconstruct the tree using BEAST294 with three independent runs. Finally, we used minimiro to plot the syntenic relationship of RGPDs in primates.
Protein structure analysis of RGPDs
The sequences of RGPDs and RANBP2 were aligned with MAFFT (v7.4.3) and PSIPRED (v4.0). The structures of the hRGPD proteins were predicted by the AlphaFold Protein Structure Database (v2)72, and the protein structure analysis were performed on PyMol (v 2.4.1)113.
Extraction of FASTA sequence from a region of interest (ROI)
To extract FASTA sequence from an ROI (chr2:110000000–111300000) in T2T-CHM13 coordinates, we aligned available human assemblies from the HPRC dataset (94 haplotypes), HGSVC dataset18,67 (28 haplotypes), and select NHPs (12 haplotypes) to the T2T-CHM13 (v2) reference using minimap2 (v2.24)53 with the following parameters: ‘-x asm20 --secondary=no -s 25000’. Next, we used rustybam (version 0.1.27, 10.5281/zenodo.5875012) and its functionality called ‘liftover’ in order to subset alignments in PAF format to a desired ROI. Then we used such subsetted PAF file(s) in order to extract the query FASTA sequence using R package SaaRclust114 and its function ‘regions2FASTA’. For subsequent analysis we selected only those haplotypes that span the ROI in a single continuous contig and ends of this contig map no further than 100 kbp from desired ROI boundaries. To synchronize orientation among all FASTA files, we reverse complement those FASTA sequences whose first and last contig alignments of at least 50 kbp are in minus orientation with respect to the reference. With this we selected 102 haplotypes with a complete span of our ROI. This includes 82 haplotypes from HPRC, 11 from HGSVC, 8 NHPs, and, lastly, the T2T-CHM13 v2 haplotype. Due to large structural rearrangements between human and orangutan over the desired ROI, we selected orangutan haplotypes using the position of NPHP1 as a center and extended this region left and right to reach 1.3 Mbp in size. Thus, we come to the total of 102 haplotypes.
Assigning haplotype duplicon structures to unique haplogroups
In order to annotate each extracted FASTA (n=100) from the ROI, we used rhodonite pipeline (Zenodo DOI: 10.5281/zenodo.6036498) that implements DupMasker115 and RepeatMasker (v4.1.2-p1)104 to annotated duplicons within each FASTA file one per haplotype. We used this annotation in order to group haplotypes based on their shared duplicon structure. In each haplotype we encode duplicons by a unique number that is either positive or negative for duplicons reported in direct or reverse orientation, respectively. Next, we compared such numeric code of all possible pairwise haplotype combinations and calculated their distance using ‘Optimal String Alignment’ implemented in R package StringDist116. With this we created a distance matrix of haplotype distances that are then clustered using the UPGMA method. Lastly, we cut the resultant tree of clustered duplicon structures into 14 groups using the ‘cuttree’ function implemented in R package stats.
Analysis of self-alignments
To assess if the SD-flanked region at 2q13 is likely prone to copy number variation, we align each selected FASTA file (n=102) to itself using minimap2 (v2.24)53 (parameters: ‘-DP -k19 -w19 -m200 -c --eqx’). We record a relative orientation (reverse or direct) of self-alignments within each FASTA file and select only self-alignments that are at least 20 kbp long and at least 50 kbp apart to make sure they flank inversion polymorphisms reported in this region116. Relative orientation of self-alignment is used as a proxy to predict if an intervening region (between flanking self-alignments) is likely predisposed to an inversion or a multiallelic copy number variation (mCNV). To further investigate sequence identity of these self-alignments, we binned them into 5 kbp long bins and report sequence identity (matched bases/total alignment length) for each bin.
MHC region analysis in primates
MHC (MICA/MICB) genome structure validation with NucFreq and GAVISUNK approaches
We mapped HiFi and ONT reads to each NHP HiFi genome. Next, we used the NucFreq (https://github.com/mrvollger/NucFreq) and GAVISUNK95 (https://github.com/pdishuck/GAVISUNK) pipelines on the MHC region to analyze it. We did not observe any collapses in the MHC regions.
Gene annotation of MHC (MICA/MICB) and ORF discovery
We extracted full-length cDNA Iso-Seq reads from NHP iPSC and downloaded the protein-coding sequences of human MHC region (GRCh38 RefSeq). We then mapped the Iso-Seq reads of each NHP and the human protein-coding sequences in MICA/MICB region to each NHP HiFi genome and filtered out reads with mapping quality lower than 30. We used StringTie (v2.1.7)112 to predict gene models and manually validated the gene models using IGV. If there were no Iso-Seq reads to support the gene models in the MICA/MICB region, we used the mapped human protein-coding sequences as a guide to predict the gene models. We used SAMtools (v1.9)91 to extract the protein-coding sequences of the gene models and predicted the ORF of the gene models using ORFfinder (https://ftp.ncbi.nlm.nih.gov/genomes/TOOLS/ORFfinder/linux-i64/, v2021–05-04) with the parameters -s 0.
Comparative and phylogenetic analysis of MICA/B
We extracted the MICA/B genomic regions from NHP HiFi genomes using SAMtools (v1.19)91 and used MAFFT (v7.0.3)97 to align the genomic regions. The resulting aligned MSA file was used to reconstruct the ML phylogeny with IQ-TREE (v1.9)98. To better reconstruct the time-calibrated tree of MICA/B, we generated an MSA file using MICA/B regions in apes and monkeys and reconstructed the tree with BEAST294, running three independent runs. Additionally, we used minimiro to plot the syntenic relationship of MICA/B in primates.
Our study revealed that MICA-MICB deletion and fusion events have been reported in Pan, but in our analysis, we found that the fusion event only occurred in the Pan lineage. The MICA deletion is an independent event in gorillas, resulting from a 100 kbp deletion rather than the MICA-B fusion observed in Pan, which resulted from a ~90 kbp deletion. Furthermore, we observed a large 130 kbp insertion in the MICA/B region in gibbon, marmoset, and owl monkey, leading to the absence of MICA in these species. These results indicate that recurrent insertion/deletion events have occurred in primate lineages in the MICA-B cluster region.
Genes disrupted by fixed SVs
The great ape–specific fixed SVs include a 51 bp insertion on the first exon of the androgen receptor (AR) (Data S1). This insertion consists of a short tandem repeat (STR) of CAG repeats, and we used ExpansionHunter107 to determine the number of CAG motifs in great apes and non-great apes (Data S1). Great apes have a greater number of CAG motifs in the AR compared to non-great apes. The CAG repetitive motifs encode the polyglutamine (polyQ) chain of the AR and the elongation of the polyQ chain of the AR is associated with several diseases, such as spinal and bulbar muscular atrophy (SBMA) or Kennedy’s disease117, prostate cancer118, and COVID-19 severity119. In particular, shorter polyQ chains of the AR have been linked to increased susceptibility to SARS-CoV-2 infection and more severe COVID-19 symptoms119.
The seventh exon of human gene spermatogenesis associated 1 (SPATA1) (NM_001310156) is specifically deleted in gorillas by a ~4.1 kbp deletion and SPATA1 is associated with spermatogenesis in mice models120 (Data S1). In addition, MAGE family member B16 (MAGEB16) is independently depleted in macaques by a ~7.7 kbp deletion, and depletion of MAGEB16 alters murine embryonic stem cells differentiation121 (Data S1). The fifth exon (12 amino acid) of human ELN (NM_000501.4) is deleted in orangutans by a 634 bp deletion, and pathogenic mutations on exon5 of the ELN are associated with supravalvular aortic stenosis (SVAS)122 (Data S1).
Recurrent gene disruption by fixed SVs
Aside from the lineage-specific disrupted genes, we also identified 165 protein-coding genes that were recurrently disrupted in primate lineages (Data S2). Moreover, we observed that these recurrently disrupted genes were significantly enriched in several functional domains, such as DNA-binding (p=2.1•10−6), repeats (p=1.5•10−5), motor proteins (p=5.5•10−5), and ABC transporters involved in immune defense (p=4.9•10−4) (Data S2). We were also curious whether the recurrently disrupted genes are randomly distributed in the SV phylogeny of primates. By simulating the occurrence of the recurrently disrupted genes in the SV phylogeny of primates, we found that their distribution in our SV phylogeny was indeed random (p=0).
Quantification and statistical analyses
The statistical tests, including chi-square test, Wilcoxon rank sum test, likelihood ratio test, and permutation tests, in this study used for cell type difference, branch length difference, selection test, and SD enriched analyses are indicated in method details, figures, and figure legends. All statistical analyses are performed in R and Python.
Supplementary Material
Highlights.
Long-read sequence assembly of eight primate genomes
Atlas of lineage-specific and recurrent structural variation
Structurally divergent regions (SDRs) associate with lineage-specific genes
Recurrent duplications diversify primate genes and predispose to human disease
Acknowledgments
We thank T. Brown for manuscript proofreading and editing. We thank Zev N. Kronenberg for critical comments in the preparation of this manuscript. We thank X. Wang for preparing the graphic abstract. This work was supported, in part, by National Institutes of Health (NIH) grants HG002385 and HG010169 to E.E.E.; GM147352 to G.A.L.; R01HG010485, U41HG010972 and U01HG010961 to B.P.; R01-AI-137011 and DP1-DA-046108 to S.L.S.; by National Natural Science Foundation of China grants (32370658), Shanghai Pujiang Program (22PJ1407300), and Shanghai Jiao Tong University 2030 Initiative (WH510363001-7) to Y.M.; by National Natural Science Foundation of China grants 82001372 to X.Y. L.C. is supported by the P51 OD011092 (to the Oregon National Primate Research Center). The partial computations in this study were run on the Siyuan-1 supported by the Center for High Performance Computing at Shanghai Jiao Tong University. E.E.E. is an investigator of the Howard Hughes Medical Institute.
Footnotes
Declaration of interests
E.E.E. is a scientific advisory board (SAB) member of Variant Bio, Inc. The other authors declare no competing interests.
Publisher's Disclaimer: This is a PDF file of an unedited manuscript that has been accepted for publication. As a service to our customers we are providing this early version of the manuscript. The manuscript will undergo copyediting, typesetting, and review of the resulting proof before it is published in its final form. Please note that during the production process errors may be discovered which could affect the content, and all legal disclaimers that apply to the journal pertain.
Publisher's Disclaimer: This article is subject to HHMI’s Open Access to Publications policy. HHMI lab heads have previously granted a nonexclusive CC BY 4.0 license to the public and a sublicensable license to HHMI in their research articles. Pursuant to those licenses, the author-accepted manuscript of this article can be made freely available under a CC BY 4.0 license immediately upon publication.
References
- 1.Gibbs RA (2020). The Human Genome Project changed everything. Nature reviews Genetics 21, 575–576. [DOI] [PMC free article] [PubMed] [Google Scholar]
- 2.Lander ES, Linton LM, Birren B, Nusbaum C, Zody MC, Baldwin J, Devon K, Dewar K, Doyle M, FitzHugh W, et al. (2001). Initial sequencing and analysis of the human genome. Nature 409, 860–921. [DOI] [PubMed] [Google Scholar]
- 3.Nurk S, Koren S, Rhie A, Rautiainen M, Bzikadze AV, Mikheenko A, Vollger MR, Altemose N, Uralsky L, Gershman A, et al. (2022). The complete sequence of a human genome. Science 376, 44–53. [DOI] [PMC free article] [PubMed] [Google Scholar]
- 4.Venter JC, Adams MD, Myers EW, Li PW, Mural RJ, Sutton GG, Smith HO, Yandell M, Evans CA, Holt RA et al. (2001). The sequence of the human genome. Science 291, 1304–1351. [DOI] [PubMed] [Google Scholar]
- 5.Watson JD (1990). The human genome project: past, present, and future. Science 248, 44–49. [DOI] [PubMed] [Google Scholar]
- 6.McConkey EH, Varki A, Allman J, Benirschke K, Crick F, Deacon TW, de Waal F, Dugaiczyk A, Gagneux P, Goodman M et al. (2000). A primate genome project deserves high priority. Science 289, 1295–1296. [DOI] [PubMed] [Google Scholar]
- 7.Locke DP, Hillier LW, Warren WC, Worley KC, Nazareth LV, Muzny DM, Yang S-P, Wang Z, Chinwalla AT, Minx P et al. (2011). Comparative and demographic analysis of orang-utan genomes. Nature 469, 529–533. [DOI] [PMC free article] [PubMed] [Google Scholar]
- 8.Prüfer K, Munch K, Hellmann I, Akagi K, Miller JR, Walenz B, Koren S, Sutton G, Kodira C, Winer R et al. (2012). The bonobo genome compared with the chimpanzee and human genomes. Nature 486, 527–531. [DOI] [PMC free article] [PubMed] [Google Scholar]
- 9.Scally A, Dutheil JY, Hillier LW, Jordan GE, Goodhead I, Herrero J, Hobolth A, Lappalainen T, Mailund T, Marques-Bonet T et al. (2012). Insights into hominid evolution from the gorilla genome sequence. Nature 483, 169–175. [DOI] [PMC free article] [PubMed] [Google Scholar]
- 10.Carbone L, Harris RA, Gnerre S, Veeramah KR, Lorente-Galdos B, Huddleston J, Meyer TJ, Herrero J, Roos C, Aken B, et al. (2014). Gibbon genome and the fast karyotype evolution of small apes. Nature 513, 195–201. [DOI] [PMC free article] [PubMed] [Google Scholar]
- 11.Rogers J, and Gibbs RA (2014). Comparative primate genomics: emerging patterns of genome content and dynamics. Nature Reviews Genetics 15, 347–359. [DOI] [PMC free article] [PubMed] [Google Scholar]
- 12.Juan D, Santpere G, Kelley JL, Cornejo OE, and Marques-Bonet T (2023). Current advances in primate genomics: novel approaches for understanding evolution and disease. Nature Reviews Genetics, 1–18. [DOI] [PubMed] [Google Scholar]
- 13.The Chimpanzee Sequencing and Analysis Consortium. (2005). Initial sequence of the chimpanzee genome and comparison with the human genome. Nature 437, 69–87. [DOI] [PubMed] [Google Scholar]
- 14.Gordon D, Huddleston J, Chaisson MJ, Hill CM, Kronenberg ZN, Munson KM, Malig M, Raja A, Fiddes I, Hillier LW et al. (2016). Long-read sequence assembly of the gorilla genome. Science 352, aae0344. [DOI] [PMC free article] [PubMed] [Google Scholar]
- 15.Kronenberg ZN, Fiddes IT, Gordon D, Murali S, Cantsilieris S, Meyerson OS, Underwood JG, Nelson BJ, Chaisson MJ, Dougherty ML et al. (2018). High-resolution comparative analysis of great ape genomes. Science 360, eaar6343. [DOI] [PMC free article] [PubMed] [Google Scholar]
- 16.He Y, Luo X, Zhou B, Hu T, Meng X, Audano PA, Kronenberg ZN, Eichler EE, Jin J, Guo Y et al. (2019). Long-read assembly of the Chinese rhesus macaque genome and identification of ape-specific structural variants. Nature communications 10, 4233. [DOI] [PMC free article] [PubMed] [Google Scholar]
- 17.Warren WC, Harris RA, Haukness M, Fiddes IT, Murali SC, Fernandes J, Dishuck PC, Storer JM, Raveendran M, Hillier LW et al. (2020). Sequence diversity analyses of an improved rhesus macaque genome enhance its biomedical utility. Science 370, eabc6617. [DOI] [PMC free article] [PubMed] [Google Scholar]
- 18.Ebert P, Audano PA, Zhu Q, Rodriguez-Martin B, Porubsky D, Bonder MJ, Sulovari A, Ebler J, Zhou W, Serra Mari R et al. (2021). Haplotype-resolved diverse human genomes and integrated analysis of structural variation. Science 372, eabf7117. [DOI] [PMC free article] [PubMed] [Google Scholar]
- 19.Mao Y, Catacchio CR, Hillier LW, Porubsky D, Li R, Sulovari A, Fernandes JD, Montinaro F, Gordon DS, Storer JM et al. (2021). A high-quality bonobo genome refines the analysis of hominid evolution. Nature 594, 77–81. [DOI] [PMC free article] [PubMed] [Google Scholar]
- 20.He Y, and Mao Y (2023). Exploring the primate genome: Unraveling the mysteries of evolution and human disease. The Innovation 4, 100467. [DOI] [PMC free article] [PubMed] [Google Scholar]
- 21.Cheng H, Concepcion GT, Feng X, Zhang H, and Li H (2021). Haplotype-resolved de novo assembly using phased assembly graphs with hifiasm. Nature methods 18, 170–175. [DOI] [PMC free article] [PubMed] [Google Scholar]
- 22.Logsdon GA, Vollger MR, Hsieh P, Mao Y, Liskovykh MA, Koren S, Nurk S, Mercuri L, Dishuck PC, Rhie A et al. (2021). The structure, function and evolution of a complete human chromosome 8. Nature 593, 101–107. [DOI] [PMC free article] [PubMed] [Google Scholar]
- 23.Yang C, Zhou Y, Marcus S, Formenti G, Bergeron LA, Song Z, Bi X, Bergman J, Rousselle MMC, Zhou C et al. (2021). Evolutionary and biomedical insights from a marmoset diploid genome assembly. Nature 594, 227–233. [DOI] [PMC free article] [PubMed] [Google Scholar]
- 24.Mao Y, and Zhang G (2022). A complete, telomere-to-telomere human genome sequence presents new opportunities for evolutionary genomics. Nature methods 19, 635–638. [DOI] [PubMed] [Google Scholar]
- 25.Porubsky D, Höps W, Ashraf H, Hsieh P, Rodriguez-Martin B, Yilmaz F, Ebler J, Hallast P, Maggiolini FAM, Harvey WT et al. (2022). Recurrent inversion polymorphisms in humans associate with genetic instability and genomic disorders. Cell 185, 1986–2005. e1926. [DOI] [PMC free article] [PubMed] [Google Scholar]
- 26.Rautiainen M, Nurk S, Walenz BP, Logsdon GA, Porubsky D, Rhie A, Eichler EE, Phillippy AM, Koren S et al. (2023). Telomere-to-telomere assembly of diploid chromosomes with Verkko. Nature Biotechnology, 1–9. [DOI] [PMC free article] [PubMed] [Google Scholar]
- 27.Dennis MY, Nuttle X, Sudmant PH, Antonacci F, Graves TA, Nefedov M, Rosenfeld JA, Sajjadian S, Malig M, Kotkiewicz H et al. (2012). Evolution of human-specific neural SRGAP2 genes by incomplete segmental duplication. Cell 149, 912–922. [DOI] [PMC free article] [PubMed] [Google Scholar]
- 28.Fiddes IT, Lodewijk GA, Mooring M, Bosworth CM, Ewing AD, Mantalas GL, Novak AM, van den Bout A, Bishara A, Rosenkrantz JL et al. (2018). Human-specific NOTCH2NL genes affect notch signaling and cortical neurogenesis. Cell 173, 1356–1369. e1322. [DOI] [PMC free article] [PubMed] [Google Scholar]
- 29.Kawanishi K, Dhar C, Do R, Varki N, Gordts PL, and Varki A (2019). Human species-specific loss of CMP-N-acetylneuraminic acid hydroxylase enhances atherosclerosis via intrinsic and extrinsic mechanisms. Proceedings of the National Academy of Sciences 116, 16036–16045. [DOI] [PMC free article] [PubMed] [Google Scholar]
- 30.Jain C, Koren S, Dilthey A, Phillippy AM, and Aluru S (2018). A fast adaptive algorithm for computing whole-genome homology maps. Bioinformatics 34, i748–i756. [DOI] [PMC free article] [PubMed] [Google Scholar]
- 31.Mailund T, Munch K, and Schierup MH (2014). Lineage sorting in apes. Annual review of genetics 48, 519–535. [DOI] [PubMed] [Google Scholar]
- 32.Minh BQ, Hahn MW, and Lanfear R (2020). New methods to calculate concordance factors for phylogenomic datasets. Molecular biology and evolution 37, 2727–2733. [DOI] [PMC free article] [PubMed] [Google Scholar]
- 33.Steiper ME, and Young NM (2006). Primate molecular divergence dates. Mol Phylogenet Evol 41, 384–394. [DOI] [PubMed] [Google Scholar]
- 34.Wilkinson RD, Steiper ME, Soligo C, Martin RD, Yang Z, and Tavaré S (2011). Dating primate divergences through an integrated analysis of palaeontological and molecular data. Systematic biology 60, 16–31. [DOI] [PMC free article] [PubMed] [Google Scholar]
- 35.Pozzi L, Hodgson JA, Burrell AS, Sterner KN, Raaum RL, and Disotell TR (2014). Primate phylogenetic relationships and divergence dates inferred from complete mitochondrial genomes. Mol Phylogenet Evol 75, 165–183. [DOI] [PMC free article] [PubMed] [Google Scholar]
- 36.de Manuel M, Kuhlwilm M, Frandsen P, Sousa VC, Desai T, Prado-Martinez J, Hernandez-Rodriguez J, Dupanloup I, Lao O, Hallast P, et al. (2016). Chimpanzee genomic diversity reveals ancient admixture with bonobos. Science 354, 477–481. [DOI] [PMC free article] [PubMed] [Google Scholar]
- 37.Vanderpool D, Minh BQ, Lanfear R, Hughes D, Murali S, Harris RA, Raveendran M, Muzny DM, Hibbins MS, Williamson RJ, et al. (2020). Primate phylogenomics uncovers multiple rapid radiations and ancient interspecific introgression. PLoS biology 18, e3000954. [DOI] [PMC free article] [PubMed] [Google Scholar]
- 38.Álvarez-Carretero S, Tamuri AU, Battini M, Nascimento FF, Carlisle E, Asher RJ, Yang Z, Donoghue PCJ, Dos Reis M et al. (2022). A species-level timeline of mammal evolution integrating phylogenomic data. Nature 602, 263–267. [DOI] [PubMed] [Google Scholar]
- 39.Sedlazeck FJ, Rescheneder P, Smolka M, Fang H, Nattestad M, Von Haeseler A, and Schatz MC (2018). Accurate detection of complex structural variations using single-molecule sequencing. Nature methods 15, 461–468. [DOI] [PMC free article] [PubMed] [Google Scholar]
- 40.Prado-Martinez J, Sudmant PH, Kidd JM, Li H, Kelley JL, Lorente-Galdos B, Veeramah KR, Woerner AE, O’Connor TD, Santpere G, et al. (2013). Great ape genetic diversity and population history. Nature 499, 471–475. [DOI] [PMC free article] [PubMed] [Google Scholar]
- 41.Thomas GW, Wang RJ, Puri A, Harris RA, Raveendran M, Hughes DS, Murali SC, Williams LE, Doddapaneni H, Muzny DM et al. (2018). Reproductive longevity predicts mutation rates in primates. Current Biology 28, 3193–3197. e3195. [DOI] [PMC free article] [PubMed] [Google Scholar]
- 42.Rogers J, Raveendran M, Harris RA, Mailund T, Leppälä K, Athanasiadis G, Schierup MH, Cheng J, Munch K, Walker JA et al. (2019). The comparative genomics and complex population history of Papio baboons. Science Advances 5, eaau6947. [DOI] [PMC free article] [PubMed] [Google Scholar]
- 43.Okhovat M, Nevonen KA, Davis BA, Michener P, Ward S, Milhaven M, Harshman L, Sohota A, Fernandes JD, Salama SR et al. (2020). Co-option of the lineage-specific LAVA retrotransposon in the gibbon genome. Proceedings of the National Academy of Sciences 117, 19328–19338. [DOI] [PMC free article] [PubMed] [Google Scholar]
- 44.Byrska-Bishop M, Evani US, Zhao X, Basile AO, Abel HJ, Regier AA, Corvelo A, Clarke WE, Musunuri R, Nagulapalli K et al. (2022). High-coverage whole-genome sequencing of the expanded 1000 Genomes Project cohort including 602 trios. Cell 185, 3426–3440. e3419. [DOI] [PMC free article] [PubMed] [Google Scholar]
- 45.Marques-Bonet T, Kidd JM, Ventura M, Graves TA, Cheng Z, Hillier LW, Jiang Z, Baker C, Malfavon-Borja R, Fulton LA et al. (2009). A burst of segmental duplications in the genome of the African great ape ancestor. Nature 457, 877–881. [DOI] [PMC free article] [PubMed] [Google Scholar]
- 46.Sudmant PH, Huddleston J, Catacchio CR, Malig M, Hillier LW, Baker C, Mohajeri K, Kondova I, Bontrop RE, Persengiev S et al. (2013). Evolution and diversity of copy number variation in the great ape lineage. Genome research 23, 1373–1382. [DOI] [PMC free article] [PubMed] [Google Scholar]
- 47.McLaren W, Gil L, Hunt SE, Riat HS, Ritchie GR, Thormann A, Flicek P, and Cunningham F (2016). The ensembl variant effect predictor. Genome biology 17, 1–14. [DOI] [PMC free article] [PubMed] [Google Scholar]
- 48.Moore JE, Purcaro MJ, Pratt HE, Epstein CB, Shoresh N, Adrian J, Kawli T, Davis CA, Dobin A et al. (2020). Expanded encyclopaedias of DNA elements in the human and mouse genomes. Nature 583, 699–710. [DOI] [PMC free article] [PubMed] [Google Scholar]
- 49.Behesti H, Fore TR, Wu P, Horn Z, Leppert M, Hull C, and Hatten ME (2018). ASTN2 modulates synaptic strength by trafficking and degradation of surface proteins. Proceedings of the National Academy of Sciences 115, E9717–E9726. [DOI] [PMC free article] [PubMed] [Google Scholar]
- 50.Bauleo A, Montesanto A, Pace V, Brando R, De Stefano L, Puntorieri D, Cento L, Loddo S, Calacci C, Novelli A et al. (2021). Rare copy number variants in ASTN2 gene in patients with neurodevelopmental disorders. Psychiatric Genetics 31, 239–245. [DOI] [PubMed] [Google Scholar]
- 51.Efimova EV, Kuvarzin SR, Mor MS, Katolikova NV, Shemiakova TS, Razenkova V, Ptukha M, Kozlova AA, Murtazina RZ, Smirnova D et al. (2022). Trace amine-associated receptor 2 is expressed in the limbic brain areas and is involved in dopamine regulation and adult neurogenesis. Frontiers in Behavioral Neuroscience 16. [DOI] [PMC free article] [PubMed] [Google Scholar]
- 52.Chaisson MJ, and Tesler G (2012). Mapping single molecule sequencing reads using basic local alignment with successive refinement (BLASR): application and theory. BMC bioinformatics 13, 1–18. [DOI] [PMC free article] [PubMed] [Google Scholar]
- 53.Li H (2018). Minimap2: pairwise alignment for nucleotide sequences. Bioinformatics 34, 3094–3100. [DOI] [PMC free article] [PubMed] [Google Scholar]
- 54.Jorstad NL, Song JH, Exposito-Alonso D, Suresh H, Castro-Pacheco N, Krienen FM, Yanny AM, Close J, Gelfand E, Long B et al. (2023). Comparative transcriptomics reveals human-specific cortical features. Science 382, eade9516. [DOI] [PMC free article] [PubMed] [Google Scholar]
- 55.Porubsky D, Vollger MR, Harvey WT, Rozanski AN, Ebert P, Hickey G, Hasenfeld P, Sanders AD, Stober C, Korbel JO et al. (2023). Gaps and complex structurally variant loci in phased genome assemblies. Genome research 33, 496–510. [DOI] [PMC free article] [PubMed] [Google Scholar]
- 56.Yang X, Wang X, Zou Y, Zhang S, Xia M, Fu L, Vollger MR, Chen N-C, Taylor DJ, Harvey WT et al. (2023). Characterization of large-scale genomic differences in the first complete human genome. Genome biology 24, 157. [DOI] [PMC free article] [PubMed] [Google Scholar]
- 57.Sekar A, Bialas AR, De Rivera H, Davis A, Hammond TR, Kamitaki N, Tooley K, Presumey J, Baum M, Van Doren V et al. (2016). Schizophrenia risk from complex variation of complement component 4. Nature 530, 177–183. [DOI] [PMC free article] [PubMed] [Google Scholar]
- 58.Cantsilieris S, Nelson BJ, Huddleston J, Baker C, Harshman L, Penewit K, Munson KM, Sorensen M, Welch AE, Dang V et al. (2018). Recurrent structural variation, clustered sites of selection, and disease risk for the complement factor H (CFH) gene family. Proceedings of the National Academy of Sciences 115, E4433–E4442. [DOI] [PMC free article] [PubMed] [Google Scholar]
- 59.Thamadilok S, Choi K-S, Ruhl L, Schulte F, Kazim AL, Hardt M, Gokcumen O, Ruhl S et al. (2020). Human and nonhuman primate lineage-specific footprints in the salivary proteome. Molecular biology and evolution 37, 395–405. [DOI] [PMC free article] [PubMed] [Google Scholar]
- 60.Vollger MR, Guitart X, Dishuck PC, Mercuri L, Harvey WT, Gershman A, Diekhans M, Sulovari A, Munson KM, Lewis AP et al. (2022). Segmental duplications and their variation in a complete human genome. Science 376, eabj6965. [DOI] [PMC free article] [PubMed] [Google Scholar]
- 61.Jiang Z, Tang H, Ventura M, Cardone MF, Marques-Bonet T, She X, Pevzner PA, and Eichler EE (2007). Ancestral reconstruction of segmental duplications reveals punctuated cores of human genome evolution. Nature genetics 39, 1361–1368. [DOI] [PubMed] [Google Scholar]
- 62.Zhang Z, Shen X, Gude DR, Wilkinson BM, Justice MJ, Flickinger CJ, Herr JC, Eddy EM, and Strauss III JF (2009). MEIG1 is essential for spermiogenesis in mice. Proceedings of the National Academy of Sciences 106, 17055–17060. [DOI] [PMC free article] [PubMed] [Google Scholar]
- 63.Du R, Lu C, Jiang Z, Li S, Ma R, An H, Xu M, An Y, Xia Y, and Jin L (2012). Efficient typing of copy number variations in a segmental duplication-mediated rearrangement hotspot using multiplex competitive amplification. Journal of human genetics 57, 545–551. [DOI] [PubMed] [Google Scholar]
- 64.Khan N, Pelletier D, McAlear TS, Croteau N, Veyron S, Bayne AN, Black C, Ichikawa M, Khalifa AAZ, Chaaban S et al. (2021). Crystal structure of human PACRG in complex with MEIG1 reveals roles in axoneme formation and tubulin binding. Structure 29, 572–586. e576. [DOI] [PMC free article] [PubMed] [Google Scholar]
- 65.Lemmers RJ, Van der Vliet PJ, Klooster R, Sacconi S, Camaño P, Dauwerse JG, Snider L, Straasheijm KR, Jan van Ommen G, Padberg GW et al. (2010). A unifying genetic model for facioscapulohumeral muscular dystrophy. Science 329, 1650–1653. [DOI] [PMC free article] [PubMed] [Google Scholar]
- 66.van der Maarel SM, Tawil R, and Tapscott SJ (2011). Facioscapulohumeral muscular dystrophy and DUX4: breaking the silence. Trends in molecular medicine 17, 252–258. [DOI] [PMC free article] [PubMed] [Google Scholar]
- 67.Liao W-W, Asri M, Ebler J, Doerr D, Haukness M, Hickey G, Lu S, Lucas JK, Monlong J, Abel HJ et al. (2023). A draft human pangenome reference. Nature 617, 312–324. [DOI] [PMC free article] [PubMed] [Google Scholar]
- 68.Law SA, and Dodds AW (1997). The internal thioester and the covalent binding properties of the complement proteins C3 and C4. Protein Science 6, 263–274. [DOI] [PMC free article] [PubMed] [Google Scholar]
- 69.Yilmaz M, Yalcin E, Presumey J, Aw E, Ma M, Whelan CW, Stevens B, McCarroll SA, and Carroll MC (2021). Overexpression of schizophrenia susceptibility factor human complement C4A promotes excessive synaptic loss and behavioral changes in mice. Nature neuroscience 24, 214–224. [DOI] [PMC free article] [PubMed] [Google Scholar]
- 70.Sudmant PH, Kitzman JO, Antonacci F, Alkan C, Malig M, Tsalenko A, Sampas N, Bruhn L, Shendure J, 1000 Genomes Project, et al. (2010). Diversity of human copy number variation and multicopy genes. Science 330, 641–646. [DOI] [PMC free article] [PubMed] [Google Scholar]
- 71.Ciccarelli FD, von Mering C, Suyama M, Harrington ED, Izaurralde E, and Bork P (2005). Complex genomic rearrangements lead to novel primate gene function. Genome research 15, 343–351. [DOI] [PMC free article] [PubMed] [Google Scholar]
- 72.Jumper J, Evans R, Pritzel A, Green T, Figurnov M, Ronneberger O, Tunyasuvunakool K, Bates R, Žídek A, Potapenko A et al. (2021). Highly accurate protein structure prediction with AlphaFold. Nature 596, 583–589. [DOI] [PMC free article] [PubMed] [Google Scholar]
- 73.Parisi MA, Bennett CL, Eckert ML, Dobyns WB, Gleeson JG, Shaw DW, McDonald R, Eddy A, Chance PF, Glass IA et al. (2004). The NPHP1 gene deletion associated with juvenile nephronophthisis is present in a subset of individuals with Joubert syndrome. American journal of human genetics 75, 82–91. [DOI] [PMC free article] [PubMed] [Google Scholar]
- 74.Gana S, Serpieri V, and Valente EM (2022). Genotype-phenotype correlates in Joubert syndrome: A review. Am J Med Genet C Semin Med Genet 190, 72–88. [DOI] [PMC free article] [PubMed] [Google Scholar]
- 75.Wang T, Antonacci-Fulton L, Howe K, Lawson HA, Lucas JK, Phillippy AM, Popejoy AB, Asri M, Carson C, Chaisson MJ et al. (2022). The Human Pangenome Project: a global resource to map genomic diversity. Nature 604, 437–446. [DOI] [PMC free article] [PubMed] [Google Scholar]
- 76.Schneider H (2000). The current status of the New World monkey phylogeny. Anais da Academia Brasileira de Ciências 72, 165–172. [DOI] [PubMed] [Google Scholar]
- 77.Perelman P, Johnson WE, Roos C, Seuánez HN, Horvath JE, Moreira MA, Kessing B, Pontius J, Roelke M, Rumpler Y et al. (2011). A molecular phylogeny of living primates. PLoS genetics 7, e1001342. [DOI] [PMC free article] [PubMed] [Google Scholar]
- 78.Baer JF, Weller RE, and Kakoma I (2012). Aotus: the owl monkey (Academic Press; ). [Google Scholar]
- 79.Okano H, Hikishima K, Iriki A, and Sasaki E (2012). The common marmoset as a novel animal model system for biomedical and neuroscience research applications. Paper presented at: Seminars in fetal and neonatal medicine (Seminars in fetal and neonatal medicine). [DOI] [PubMed] [Google Scholar]
- 80.Grillner S, Ip N, Koch C, Koroshetz W, Okano H, Polachek M, Poo M. m., and Sejnowski TJ (2016). Worldwide initiatives to advance brain research. Nature neuroscience 19, 1118–1122. [DOI] [PMC free article] [PubMed] [Google Scholar]
- 81.Nuttle X, Giannuzzi G, Duyzend MH, Schraiber JG, Narvaiza I, Sudmant PH, Penn O, Chiatante G, Malig M, Huddleston J et al. (2016). Emergence of a Homo sapiens-specific gene family and chromosome 16p11. 2 CNV susceptibility. Nature 536, 205–209. [DOI] [PMC free article] [PubMed] [Google Scholar]
- 82.Hsieh P, Vollger MR, Dang V, Porubsky D, Baker C, Cantsilieris S, Hoekzema K, Lewis AP, Munson KM, Sorensen M et al. (2019). Adaptive archaic introgression of copy number variants and the discovery of previously unknown human genes. Science 366, eaax2083. [DOI] [PMC free article] [PubMed] [Google Scholar]
- 83.Hsieh P, Dang V, Vollger MR, Mao Y, Huang T-H, Dishuck PC, Baker C, Cantsilieris S, Lewis AP, Munson KM et al. (2021). Evidence for opposing selective forces operating on human-specific duplicated TCAF genes in neanderthals and humans. Nature communications 12, 5118. [DOI] [PMC free article] [PubMed] [Google Scholar]
- 84.Ju X-C, Hou Q-Q, Sheng A-L, Wu K-Y, Zhou Y, Jin Y, Wen T, Yang Z, Wang X, and Luo Z-G (2016). The hominoid-specific gene TBC1D3 promotes generation of basal neural progenitors and induces cortical folding in mice. Elife 5, e18197. [DOI] [PMC free article] [PubMed] [Google Scholar]
- 85.Dennis MY, Harshman L, Nelson BJ, Penn O, Cantsilieris S, Huddleston J, Antonacci F, Penewit K, Denman L, Raja A et al. (2017). The evolution and population diversity of human-specific segmental duplications. Nature ecology & evolution 1, 0069. [DOI] [PMC free article] [PubMed] [Google Scholar]
- 86.Prosser SL, Sahota NK, Pelletier L, Morrison CG, and Fry AM (2015). Nek5 promotes centrosome integrity in interphase and loss of centrosome cohesion in mitosis. Journal of Cell Biology 209, 339–348. [DOI] [PMC free article] [PubMed] [Google Scholar]
- 87.McAlear TS, and Bechstedt S (2022). The mitotic spindle protein CKAP2 potently increases formation and stability of microtubules. Elife 11, e72202. [DOI] [PMC free article] [PubMed] [Google Scholar]
- 88.Logsdon GA, Vollger MR, and Eichler EE (2020). Long-read human genome sequencing and its applications. Nature Reviews Genetics 21, 597–614. [DOI] [PMC free article] [PubMed] [Google Scholar]
- 89.Mao Y, Hou S, Shi J, and Economo EP (2020). TREEasy: An automated workflow to infer gene trees, species trees, and phylogenetic networks from multilocus data. Mol Ecol Resour 20. [DOI] [PubMed] [Google Scholar]
- 90.Li H (2013). Aligning sequence reads, clone sequences and assembly contigs with BWA-MEM. arXiv preprint arXiv:13033997. [Google Scholar]
- 91.Li H, Handsaker B, Wysoker A, Fennell T, Ruan J, Homer N, Marth G, Abecasis G, Durbin R, and Subgroup GPDP (2009). The sequence alignment/map format and SAMtools. Bioinformatics 25, 2078–2079. [DOI] [PMC free article] [PubMed] [Google Scholar]
- 92.Quinlan AR, and Hall IM (2010). BEDTools: a flexible suite of utilities for comparing genomic features. Bioinformatics 26, 841–842. [DOI] [PMC free article] [PubMed] [Google Scholar]
- 93.Chen S, Krusche P, Dolzhenko E, Sherman RM, Petrovski R, Schlesinger F, Kirsche M, Bentley DR, Schatz MC, Sedlazeck FJ et al. (2019). Paragraph: a graph-based structural variant genotyper for short-read sequence data. Genome biology 20, 1–13. [DOI] [PMC free article] [PubMed] [Google Scholar]
- 94.Bouckaert R, Heled J, Kühnert D, Vaughan T, Wu C-H, Xie D, Suchard MA, Rambaut A, Drummond AJ et al. (2014). BEAST 2: a software platform for Bayesian evolutionary analysis. PLoS computational biology 10, e1003537. [DOI] [PMC free article] [PubMed] [Google Scholar]
- 95.Dishuck PC, Rozanski AN, Logsdon GA, Porubsky D, and Eichler EE (2023). GAVISUNK: genome assembly validation via inter-SUNK distances in Oxford Nanopore reads. Bioinformatics 39, btac714. [DOI] [PMC free article] [PubMed] [Google Scholar]
- 96.Rhie A, Walenz BP, Koren S, and Phillippy AM (2020). Merqury: reference-free quality, completeness, and phasing assessment for genome assemblies. Genome biology 21, 1–27. [DOI] [PMC free article] [PubMed] [Google Scholar]
- 97.Katoh K, and Standley DM (2013). MAFFT multiple sequence alignment software version 7: improvements in performance and usability. Molecular biology and evolution 30, 772–780. [DOI] [PMC free article] [PubMed] [Google Scholar]
- 98.Nguyen L-T, Schmidt HA, Von Haeseler A, and Minh BQ (2015). IQ-TREE: a fast and effective stochastic algorithm for estimating maximum-likelihood phylogenies. Molecular biology and evolution 32, 268–274. [DOI] [PMC free article] [PubMed] [Google Scholar]
- 99.Zhang C, Scornavacca C, Molloy EK, and Mirarab S (2020). ASTRAL-Pro: quartet-based species-tree inference despite paralogy. Molecular biology and evolution 37, 3292–3307. [DOI] [PMC free article] [PubMed] [Google Scholar]
- 100.Minh BQ, Schmidt HA, Chernomor O, Schrempf D, Woodhams MD, Von Haeseler A, and Lanfear R (2020). IQ-TREE 2: new models and efficient methods for phylogenetic inference in the genomic era. Molecular biology and evolution 37, 1530–1534. [DOI] [PMC free article] [PubMed] [Google Scholar]
- 101.Thorvaldsdóttir H, Robinson JT, and Mesirov JP (2013). Integrative Genomics Viewer (IGV): high-performance genomics data visualization and exploration. Briefings in bioinformatics 14, 178–192. [DOI] [PMC free article] [PubMed] [Google Scholar]
- 102.McKenna A, Hanna M, Banks E, Sivachenko A, Cibulskis K, Kernytsky A, Garimella K, Altshuler D, Gabriel S, and Daly M (2010). The Genome Analysis Toolkit: a MapReduce framework for analyzing next-generation DNA sequencing data. Genome research 20, 1297–1303. [DOI] [PMC free article] [PubMed] [Google Scholar]
- 103.Danecek P, Auton A, Abecasis G, Albers CA, Banks E, DePristo MA, Handsaker RE, Lunter G, Marth GT, Sherry ST et al. (2011). The variant call format and VCFtools. Bioinformatics 27, 2156–2158. [DOI] [PMC free article] [PubMed] [Google Scholar]
- 104.Smit AFA, Hubley R, and Green P (2021). RepeatMasker Open-4.0. 2013–2015. <http://www.repeatmasker.org>.
- 105.Huang DW, Sherman BT, Tan Q, Kir J, Liu D, Bryant D, Guo Y, Stephens R, Baseler MW, Lane HC et al. (2007). DAVID Bioinformatics Resources: expanded annotation database and novel algorithms to better extract biology from large gene lists. Nucleic acids research 35, W169–W175. [DOI] [PMC free article] [PubMed] [Google Scholar]
- 106.Campbell CD, Sampas N, Tsalenko A, Sudmant PH, Kidd JM, Malig M, Vu TH, Vives L, Tsang P, Bruhn L et al. (2011). Population-genetic properties of differentiated human copy-number polymorphisms. The American Journal of Human Genetics 88, 317–332. [DOI] [PMC free article] [PubMed] [Google Scholar]
- 107.Dolzhenko E, Deshpande V, Schlesinger F, Krusche P, Petrovski R, Chen S, Emig-Agius D, Gross A, Narzisi G, Bowman B et al. (2019). ExpansionHunter: a sequence-graph-based tool to analyze variation in short tandem repeat regions. Bioinformatics 35, 4754–4756. [DOI] [PMC free article] [PubMed] [Google Scholar]
- 108.Wickham H (2011). ggplot2. Wiley interdisciplinary reviews: computational statistics 3, 180–185. [Google Scholar]
- 109.Fiddes IT, Armstrong J, Diekhans M, Nachtweide S, Kronenberg ZN, Underwood JG, Gordon D, Earl D, Keane T, and Eichler EE (2018). Comparative Annotation Toolkit (CAT)—simultaneous clade and personal genome annotation. Genome research 28, 1029–1038. [DOI] [PMC free article] [PubMed] [Google Scholar]
- 110.Gaudet RG, Zhu S, Halder A, Kim BH, Bradfield CJ, Huang S, Xu D, Mamiñska A, Nguyen TN, Lazarou M, et al. (2021). A human apolipoprotein L with detergent-like activity kills intracellular pathogens. Science 373. [DOI] [PMC free article] [PubMed] [Google Scholar]
- 111.Yang Z (2007). PAML 4: phylogenetic analysis by maximum likelihood. Molecular biology and evolution 24, 1586–1591. [DOI] [PubMed] [Google Scholar]
- 112.Pertea M, Pertea GM, Antonescu CM, Chang T-C, Mendell JT, and Salzberg SL (2015). StringTie enables improved reconstruction of a transcriptome from RNA-seq reads. Nature biotechnology 33, 290–295. [DOI] [PMC free article] [PubMed] [Google Scholar]
- 113.Janson G, Zhang C, Prado MG, and Paiardini A (2017). PyMod 2.0: improvements in protein sequence-structure analysis and homology modeling within PyMOL. Bioinformatics 33, 444–446. [DOI] [PubMed] [Google Scholar]
- 114.Ghareghani M, Porubskỳ D, Sanders AD, Meiers S, Eichler EE, Korbel JO, and Marschall T (2018). Strand-seq enables reliable separation of long reads by chromosome via expectation maximization. Bioinformatics 34, i115–i123. [DOI] [PMC free article] [PubMed] [Google Scholar]
- 115.Jiang Z, Hubley R, Smit A, and Eichler EE (2008). DupMasker: a tool for annotating primate segmental duplications. Genome research 18, 1362–1368. [DOI] [PMC free article] [PubMed] [Google Scholar]
- 116.Van der Loo MP (2014). The stringdist package for approximate string matching. R J 6, 111. [Google Scholar]
- 117.Adachi H, Katsuno M, Minamiyama M, Waza M, Sang C, Nakagomi Y, Kobayashi Y, Tanaka F, Doyu M, Inukai A et al. (2005). Widespread nuclear and cytoplasmic accumulation of mutant androgen receptor in SBMA patients. Brain 128, 659–670. [DOI] [PubMed] [Google Scholar]
- 118.Heinlein CA, and Chang C (2004). Androgen receptor in prostate cancer. Endocrine reviews 25, 276–308. [DOI] [PubMed] [Google Scholar]
- 119.Wambier CG, Goren A, Vaño-Galván S, Ramos PM, Ossimetha A, Nau G, Herrera S, McCoy J et al. (2020). Androgen sensitivity gateway to COVID-19 disease severity. Drug development research 81, 771–776. [DOI] [PMC free article] [PubMed] [Google Scholar]
- 120.L’Hôte D, Serres C, Laissue P, Oulmouden A, Rogel-Gaillard C, Montagutelli X, and Vaiman D (2007). Centimorgan-range one-step mapping of fertility traits using interspecific recombinant congenic mice. Genetics 176, 1907–1921. [DOI] [PMC free article] [PubMed] [Google Scholar]
- 121.Gaspar JA, Srinivasan SP, Sureshkumar P, Doss MX, Hescheler J, Papadopoulos S, and Sachinidis A (2017). Depletion of Mageb16 induces differentiation of pluripotent stem cells predominantly into mesodermal derivatives. Scientific reports 7, 14285. [DOI] [PMC free article] [PubMed] [Google Scholar]
- 122.Hayano S, Okuno Y, Tsutsumi M, Inagaki H, Fukasawa Y, Kurahashi H, Kojima S, Takahashi Y, and Kato T (2019). Frequent intragenic microdeletions of elastin in familial supravalvular aortic stenosis. Int J Cardiol 274, 290–295. [DOI] [PubMed] [Google Scholar]
Associated Data
This section collects any data citations, data availability statements, or supplementary materials included in this article.
Supplementary Materials
Data Availability Statement
The raw PacBio CLR, HiFi, and ONT data are deposited in NCBI under BioProject accession number PRJNA877605. The CLR and HiFi NHP assemblies are deposited in NCBI under BioProject accession numbers PRJNA941350- PRJNA941365. The marmoset Iso-Seq data and single-cell RNA-seq data are deposited under NCBI BioProject accession number PRJNA566173. Accession numbers are also included in the Key Resources Table.
All pipelines and scripts used in this study are publicly available in GitHub or public domain (https://github.com/MaoYafei/NHP_Genomes_scripts and https://eichlerlab.gs.washington.edu/help/yafmao/NHP_Genomes_scripts). All original code has been deposited at Zenodo and DOI included in the Key Resources Table.
Any additional information required to reanalyze the data reported in this work paper is available from the lead contact upon request.
KEY RESOURCES TABLE.
| REAGENT or RESOURCE | SOURCE | IDENTIFIER |
|---|---|---|
| Biological Samples | ||
| Owl monkey | This study | 86718_ANA |
| Deposited Data | ||
| PacBio CLR reads for owl monkey | This study | NCBI:PRJNA877605 |
| PacBio CLR reads for gibbon | This study | NCBI:PRJNA369439 |
| PacBio HiFi reads and assemblies for owl monkey | This study | NCBI:PRJNA941350, PRJNA941350, and SRR21642072 |
| PacBio HiFi reads and assemblies for macaques | This study | NCBI:PRJNA941358, PRJNA941359, SRR21803674 SRR21803673, and SRR21642077 |
| PacBio HiFi reads and assemblies for gibbon | This study | NCBI: PRJNA941361, PRJNA941360, SRR21803681, SRR21642080, SRR21642079, and SRR21642081 |
| PacBio HiFi reads and assemblies for marmoset | This study | NCBI: PRJNA941356, PRJNA941357, and SRR21642074 |
| PacBio HiFi reads and assemblies for chimpanzee | This study, Mao et al.,19 and Logsdon et al.,22 | NCBI: PRJNA941354, PRJNA941355, SRR21803678, SRR21803677, SRR21755677, SRR21755680, SRR21755678, SRR21755679, SRR21755676, SRR21642086, and SRR21642075 |
| PacBio HiFi reads and assemblies for gorilla | This study, Mao et al.,19 and Logsdon et al.,22 | NCBI: PRJNA941352, PRJNA941353, SRR21803675, SRR21642084, SRR21642066, and SRR21642067 |
| PacBio HiFi reads and assemblies for bonobo | This study, Mao et al.,19 and Logsdon et al.,22 | NCBI: PRJNA941363, PRJNA941362, SRR21803679, and SRR21642068 |
| PacBio HiFi reads and assemblies for orangutan | This study, Mao et al.,19 and Logsdon et al.,22 | NCBI: PRJNA941365, PRJNA941364, SRR21803672, SRR21803680, and SRR21642082 |
| HPRC genome assemblies | Public HPRC data | https://humanpangenome.org/ https://github.com/human-pangenomics/HPP_Year1_Assemblies |
| WGS Illumina data for 1KG panel | Byrska-Bishop et al.,44 | NCBI: PRJEB37677 |
| WGS Illumina data for NHP panel | Prado-Martinez et al.,40, Thomas et al.,41, Rogers et al.,42 Okhovat et al.,43 | NCBI: PRJNA189439, PRJNA451475, and PRJNA54005 |
| Experimental Models: Cell Lines | ||
| Marmoset cell line | Eichler Lab | CJ1700_CJA |
| Gibbon cell line | Carbone Lab | Asia_NLE |
| Macaque cell line | Eichler Lab | AG07107_MMU |
| Chimpanzee cell line | Eichler Lab | Clint_PTR |
| Gorilla cell line | Eichler Lab | Kamilah_GGO |
| Bonobo cell line | Carbone Lab | Mhudiblu_PPA |
| Orangutan cell line | Eichler Lab | Susie_PAB |
| Experimental Models: Organisms/Strains | ||
| Owl monkey | Sawyer Lab | 86718_ANA |
| Marmoset | Feng Lab | CJ-16-183 |
| Software and Algorithms | ||
| PAV | Ebert et al.,18 | https://github.com/EichlerLab/pav |
| pbsv | PacBio | https://github.com/PacificBiosciences/pbsv |
| Sniffles | Sedlazeck et al.,39 | https://github.com/fritzsedlazeck/Sniffles |
| minimap2 | Li et al.,53 | https://github.com/lh3/minimap2 |
| hifiasm | Cheng et al.,21 | https://github.com/chhylp123/hifiasm |
| SV-Pop | Ebert et al.,18 | https://github.com/EichlerLab/svpop |
| TREEasy | Mao et al.,89 | https://github.com/MaoYafei/TREEasy |
| IQ-TREE | Minh et al.,32 | http://www.iqtree.org/ |
| BWA | Li,90 | http://bio-bwa.sourceforge.net/ |
| SAMtools | Li et al.,91 | http://samtools.sourceforge.net/ |
| BEDTools | Quinlan and Hall,92 | https://bedtools.readthedocs.io/ |
| paragraph | Chen et al.,93 | https://github.com/Illumina/paragraph |
| MashMap | Jain et al.,30 | https://github.com/marbl/MashMap |
| VEP | Ensembl | https://github.com/Ensembl/ensembl-vep |
| Guppy | ONT | https://github.com/nanoporetech |
| BEAST2 | Bouckaert et al.,94 | https://www.beast2.org/ |
| Cell Ranger | 10X Genomics | https://www.10xgenomics.com/support/software/cell-ranger |
| Seurat | Satija lab | https://github.com/satijalab/seurat |
| Rhodonite | Eichler Lab | https://doi.org/10.5281/zenodo.6036498 |
| Deposited Data | ||
| Original code | This study | https://doi.org/10.5281/zenodo.10570381 |