

SUMMARY
G protein-coupled receptors (GPCRs) are the largest family of druggable proteins encoded in the human genome, but progress in understanding and targeting them is hindered by the lack of tools to reliably measure their nuanced behavior in physiologically-relevant contexts. Here, we developed a collection of compact ONE vector G-protein Optical (ONE-GO) biosensor constructs as a scalable platform that can be conveniently deployed to measure G-protein activation by virtually any GPCR with high fidelity even when expressed endogenously in primary cells. By characterizing dozens of GPCRs across many cell types like primary cardiovascular cells or neurons, we revealed insights into the molecular basis for G-protein coupling selectivity of GPCRs, pharmacogenomic profiles of anti-psychotics on naturally-occurring GPCR variants, and G-protein subtype signaling bias by endogenous GPCRs depending on cell type or upon inducing disease-like states. In summary, this open-source platform makes the direct interrogation of context-dependent GPCR activity broadly accessible.
Graphical Abstract

In Brief
Development and implementation of a suite of G protein biosensors broadly applicable to detect GPCR activity in scalable assay formats and in physiologically-relevant systems like primary cells. By directly measuring endogenous GPCR activity, these biosensors, named ONE-GO, reveal that responses are frequently dependent on the cell context or state.
INTRODUCTION
G-protein-coupled receptors (GPCRs) mediate responses to many natural stimuli, including most neurotransmitters and two-thirds of hormones1–3, and are also the target for 30–40% of clinically-approved drugs4,5. While representing the largest family of druggable targets encoded in the human genome, there is still vast untapped potential because the majority of GPCRs remain understudied6. With the advent of wide-spread success in elucidating high resolution structures of many GPCRs7,8, current trends in GPCR research and drug development are focused on identifying mechanisms and compounds that fine tune signaling outcomes, including allosteric modulation or ligand-directed biased signaling9–12. However, progress in this area has been hampered by the overreliance on assays that measure GPCR activity indirectly (e.g., second messengers), and on a limited number of cells lines. As a consequence, pharmacological features of compounds characterized by in vitro GPCR assays may not accurately translate to the expected therapeutic benefit in vivo13, as illustrated by ongoing controversies on experimental opioid drugs with diminished side effects14–19. A critical factor for the discrepancy between in vitro and in vivo pharmacology is the existence of system biased GPCR signaling, i.e., how signaling pathways are hardwired in each specific cellular system to propagate the initial drug-receptor interaction to a cellular response13,20.
An approach to mitigate the impact of system bias in drug discovery is the use of assays that measure GPCR activity more directly to avoid potential crosstalk and amplification mechanisms specific to a given cellular system. In this regard, GPCRs propagate signaling primarily by directly activating heterotrimeric G proteins (Gαβγ), although some responses are mediated by β-arrestins1,2,21. GPCRs activate G proteins by promoting the exchange of GDP for GTP on Gα subunits. In turn, this leads to the dissociation of Gα-GTP and free Gβγ22,23. The latter event has been widely exploited to generate biosensors of G protein activity based on fluorescence or bioluminescence resonance energy transfer (FRET or BRET, respectively)24–28. While Gα/Gβγ dissociation is an event proximal to GPCR activation, these approaches are not broadly applicable to physiologically relevant systems and can significantly compromise the fidelity of the responses measured. For example, even in optimized versions of biosensors that measure Gα/Gβγ dissociation (e.g., TRUPATH29), overexpression of exogenous G protein subunits tagged with BRET donors and acceptors is required. This imposes several limitations. One is that multiple genetic components must be delivered simultaneously to cells in optimal proportions, making the approach only feasible in a few easily transfectable cell lines. Another major limitation is that exogenous G protein subunits can form non-BRET productive complexes with endogenous G proteins, so they must be expressed in large excess to yield robust BRET responses. This represents a significant perturbation of the system under investigation by the method of detection employed.
We recently developed alternative G protein biosensor designs to measure Gα-GTP in cells as a more proximal event to receptor activation than Gα/Gβγ dissociation, and converted them into single polypeptide chain biosensors named BERKY30. While this allowed the detection of endogenous GPCR activity in primary neurons and without interfering with downstream signaling30, the small dynamic range has remained a limitation for the broad applicability of this type of biosensor. Others have developed an effector membrane translocation assay (EMTA) that also measures Gα-GTP31. However, some EMTA biosensors are likely to interfere with G protein signaling, and the broad applicability of EMTA with endogenous GPCRs in primary cells has not been established, probably because of the need to deliver simultaneously multiple genetic components. A notable exception for both BERKY and EMTA biosensor systems is the lack of direct detection of Gα-GTP species for one of the four G protein families, Gs22.
In the work presented here, we generated a comprehensive collection of Gα-GTP biosensor constructs for different G protein types, including the evasive Gαs-GTP, that combines large dynamic range of detection with the ability to monitor endogenous GPCR activity across a wide range of physiologically-relevant systems (e.g., different primary cell types). By leveraging the advantages of this biosensor platform, we reveal that endogenous GPCRs in primary cells display unique signaling behaviors depending on the cellular context, raising the important point that system bias must be considered even when measuring direct readouts of GPCR signal transduction. To facilitate adoption and customization by others, all the biosensor constructs described here and their designs have been made publicly accessible through Addgene as an open-source platform.
RESULTS
Direct detection of active Gαs in cells with a BRET biosensor
We sought to identify a protein sequence that would bind specifically to active Gαs, anticipating that it would serve as a specific detector module for a genetically encoded live-cell biosensor. Initial efforts based on previously described Gαs interactors32–34 failed to identify a suitable detector module (not shown). We turned our attention to the patent literature and found a series of putative Gαs-GTP binding peptides from a phage display screen (Fig.1A35). We tested 12 of these peptides for binding to active Gαs (Fig.1A) and determined that sequences KB1691 and KB2123 bound strongly to active Gαs, but not active Gαo (Fig.1A). Then, we fused KB1691 or KB2123 to membrane-anchored nanoluciferase (Nluc, BRET donor) and co-expressed each one of them in HEK293T with Venus-tagged Gαs (BRET acceptor), along with Gβ1, Gγ2, and the β2 adrenergic receptor (β2AR) (Fig.1B, Fig.S1). We systematically tested three versions of Gαs (short isoform) in which Venus was inserted at different internal locations36, with and without co-expression of the Gαs chaperone Ric-8B37. Both KB1691- and KB2123-based sensors performed best with the Gαs constructs with Venus inserted at codon 99 (Gαs-99V) and in the presence of Ric-8B— i.e., these conditions led to larger BRET increases upon stimulation with the β-adrenergic agonist isoproterenol, which were reversed upon treatment with the antagonist alprenolol (Fig.1B, Fig.S1A–B). Similar results were obtained with a second GPCR, the dopamine D1 receptor (D1R) (Fig.S1C). Amino acid position 99 is in a loop of the helical domain of Gαs that tolerates insertion of bulky tags, as previously demonstrated by the functional validation of Gαs-99V and other constructs with insertions in the same loop25,38. While Ric-8B expression improved the magnitude of the responses detected, this was not due to a significant increase in Gαs-99V expression (Fig.S1A–B). This suggests that the improved responses are due to better folding and/or membrane targeting of tagged Gαs, as previously reported for Ric-8 proteins by others37. An alternative biosensor design relying on bystander BRET39,40 was also attempted (Fig.S1D), in part because no Gαs-GTP sensor has been designed based on this principle due to the lack of adequate detector modules for it31,41. Upon GPCR stimulation, cytosolic Nluc-fused KB1691 peptide was recruited to active, untagged Gαs at the plasma membrane, where it yielded BRET with a bystander YFP anchored in that location (Fig.S1D). However, the response was not as robust as with the system composed of the membrane-anchored, Nluc-fused peptide and Gαs-99V in the presence of Ric-8B, which became the biosensor design of choice for subsequent studies. These results indicate that GPCR-mediated activation of Gαs can be detected in cells with an optical biosensor based on peptides that bind Gαs-GTP.
Figure 1. Direct detection of active Gαs in cells with a BRET biosensor.
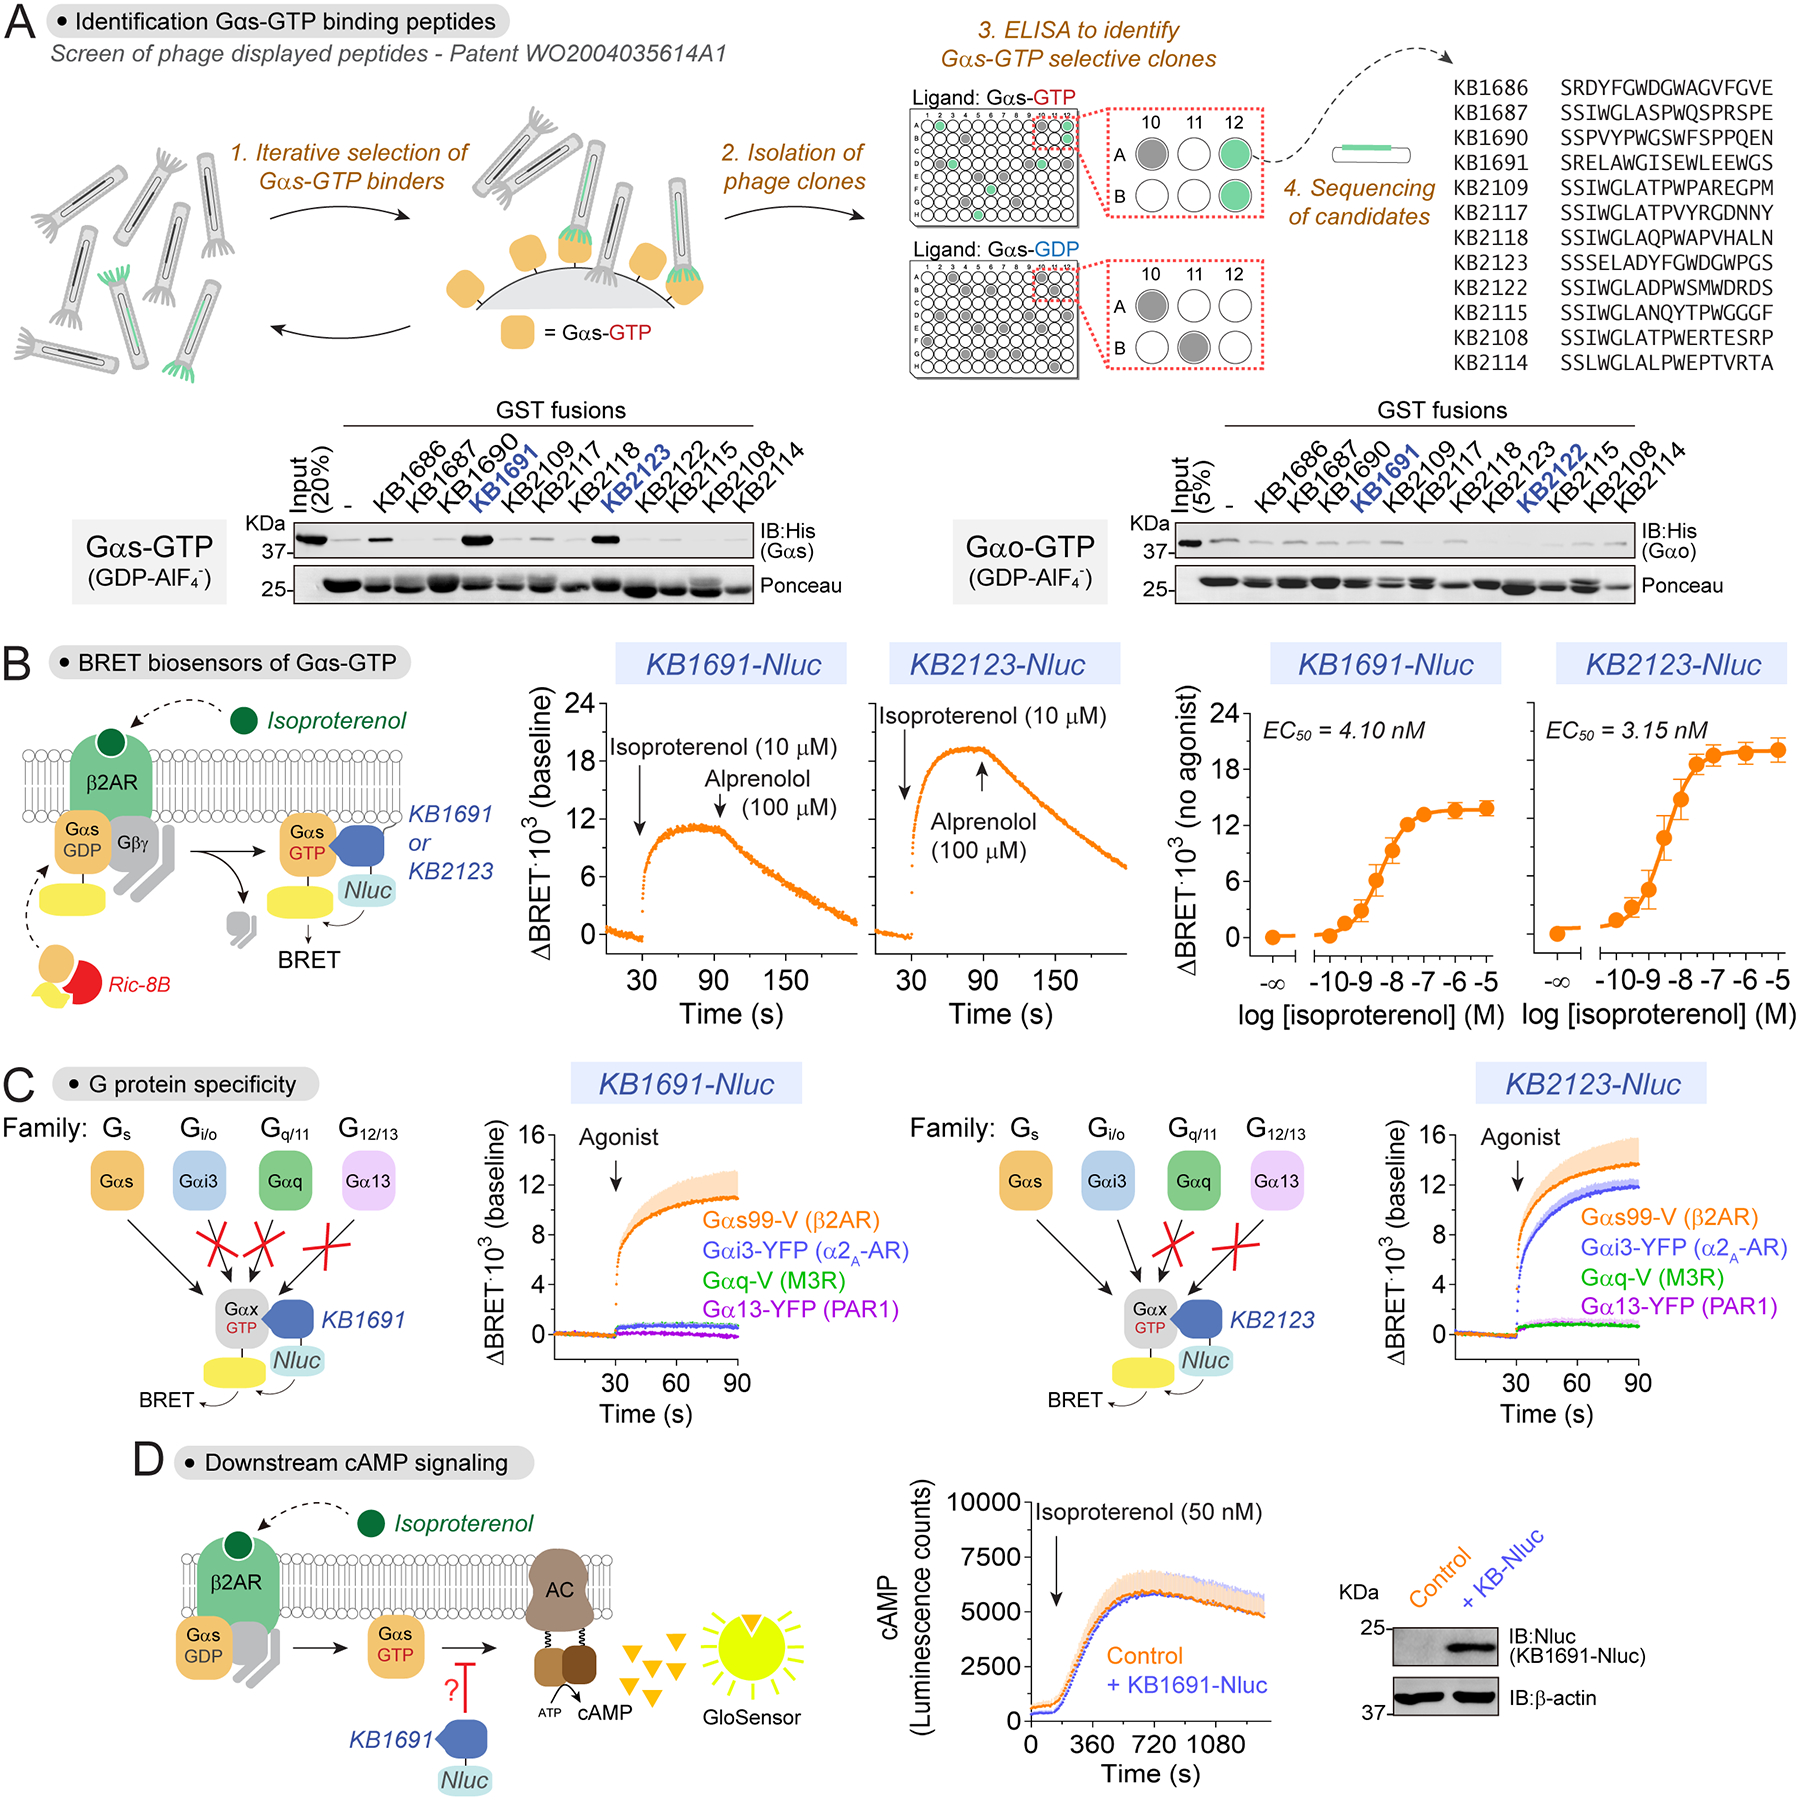
(A) Identification of Gαs-GTP peptide binders. Top, schematic of phage display screen. Bottom, pulldown of active, GDP-AlF4−-loaded Gαs or Gαo with GST-fused peptides. From n ≥ 2.
(B) Gαs-GTP biosensor using KB1691 and KB2123 peptides. Left, BRET assay principle. Center and left, BRET was measured in HEK293T cells expressing β2AR, Gαs-99V, Gβγ and either KB1691-Nluc or KB2123-Nluc. A representative kinetic trace is shown on the center panels, and the mean ± S.E.M. (n=4) for the concentration-dependent curves on the right.
(C) Sensors based on KB1691, but not on KB2123, specifically detect Gαs. BRET was measured in HEK293T cells expressing the indicated G protein / cognate GPCR pairs and either KB1691-Nluc or KB2123-Nluc. Cells were stimulated with either 10 μM isoproterenol (Gαs), 5 μM brimonidine (Gαi3), 100 μM carbachol (Gαq), or 30 μM TRAP-6 (Gα13). Mean ± S.E.M. (n=3–4).
(D) KB1691 does not interfere with Gαs-mediated cAMP production. Luminescence was measured in HEK293T cells expressing the cAMP probe Glosensor and exactly the same components as in panel B, except that KB1691-Nluc was omitted in the control. Mean ± S.E.M. (n=4).
Specific detection of active Gαs but no other G protein type
Next, we asked if the identified biosensors were specific for Gαs. To test this, we replaced Gαs-99V with YFP-tagged Gα subunits representative of the other three G protein families (i.e., Gαi3 for Gi/o, Gαq for Gq/11, and Gα13 for G12/13), and measured BRET responses upon stimulation of cognate GPCRs (Fig.1C). Activation of Gαi3, Gαq and Gα13 under these conditions was confirmed in parallel experiments with previously validated biosensors for each one of these G proteins30 (Fig.S1E). We found that KB1691-based sensors only detected activation of Gαs, whereas KB2123-based sensors detected activation of both Gαs and Gαi3 (Fig.1C). These results demonstrate that biosensors based on the KB1691 sequence, but not on the KB2123 sequence, specifically detect activation of Gαs. For this reason, we focused our subsequent efforts on KB1691-based biosensors.
Gαs-GTP biosensor does not interfere with downstream signaling
A potential concern of any biosensor is the potential interference with the process it measures. Because Nluc is a bright luciferase that can be expressed at low levels to obtain measurable luminescence signals42, we reasoned that expression of the biosensor with Nluc-fused KB1691 would not interfere significantly with Gs signaling in cells. To test this, we measured cAMP production upon β2AR stimulation in HEK293T under conditions identical to those used to detect Gαs activation with this sensor, except that a probe for cAMP43 was co-expressed. We found that the cAMP response detected was not affected by the expression of the Gαs BRET sensor (Fig.1D), indicating no overt effect on GPCR-stimulated Gs signaling to downstream effectors.
Gαs-GTP biosensor reveals specific activation properties of oncogenic Gαs mutants
Having established a biosensor for Gαs-GTP, we set out to leverage it in functional studies, starting with characterizing the activation properties of cancer-associated G protein mutants. GNAS, the gene encoding Gαs, is frequently mutated in cancer at two hotspots corresponding to R201 and Q227 in the protein44,45. These mutations lead to Gαs forms that are constitutively active in cells— i.e., they elevate cAMP levels under unstimulated conditions46. Both residues participate in GTP hydrolysis (Fig.2A), suggesting that the mechanism by which their mutation leads to constitutive signaling is by locking them in a GTP-bound state. However, in vitro results with purified proteins suggest that Q227 mutants are likely to be completely occupied by GTP, whereas R201 mutants might be only partially occupied with GTP47,48. Whether this is the case in cells is not known, so we leveraged the Gαs-GTP biosensor developed by us for this purpose. We found that, under unstimulated conditions, Gαs R201C gave a higher BRET signal than Gαs WT, yet it was much lower than the BRET signal for Gαs Q227L (Fig.2A). Moreover, isoproterenol stimulation did not lead to an increase of the BRET signal for Gαs Q227L (Fig.2A), consistent with the interpretation that this mutant is completely occupied with GTP in cells and cannot be further activated. In contrast, isoproterenol stimulation led to an increase of BRET for Gαs R201C, which was not reverted upon an addition of antagonist that fully reverted the isoproterenol response with Gαs WT (Fig.2A). While the latter indicates that Gαs R201C is indeed GTPase-deficient, the former suggests that Gαs R201C is susceptible to further GTP loading upon acute receptor stimulation. Taken together, these results indicate that, as opposed to Gαs Q227L, Gαs R201C is only partially occupied with GTP in cells.
Figure 2. Mechanism of Gαs activation by oncogenic mutations and of Gs coupling to GPCRs.
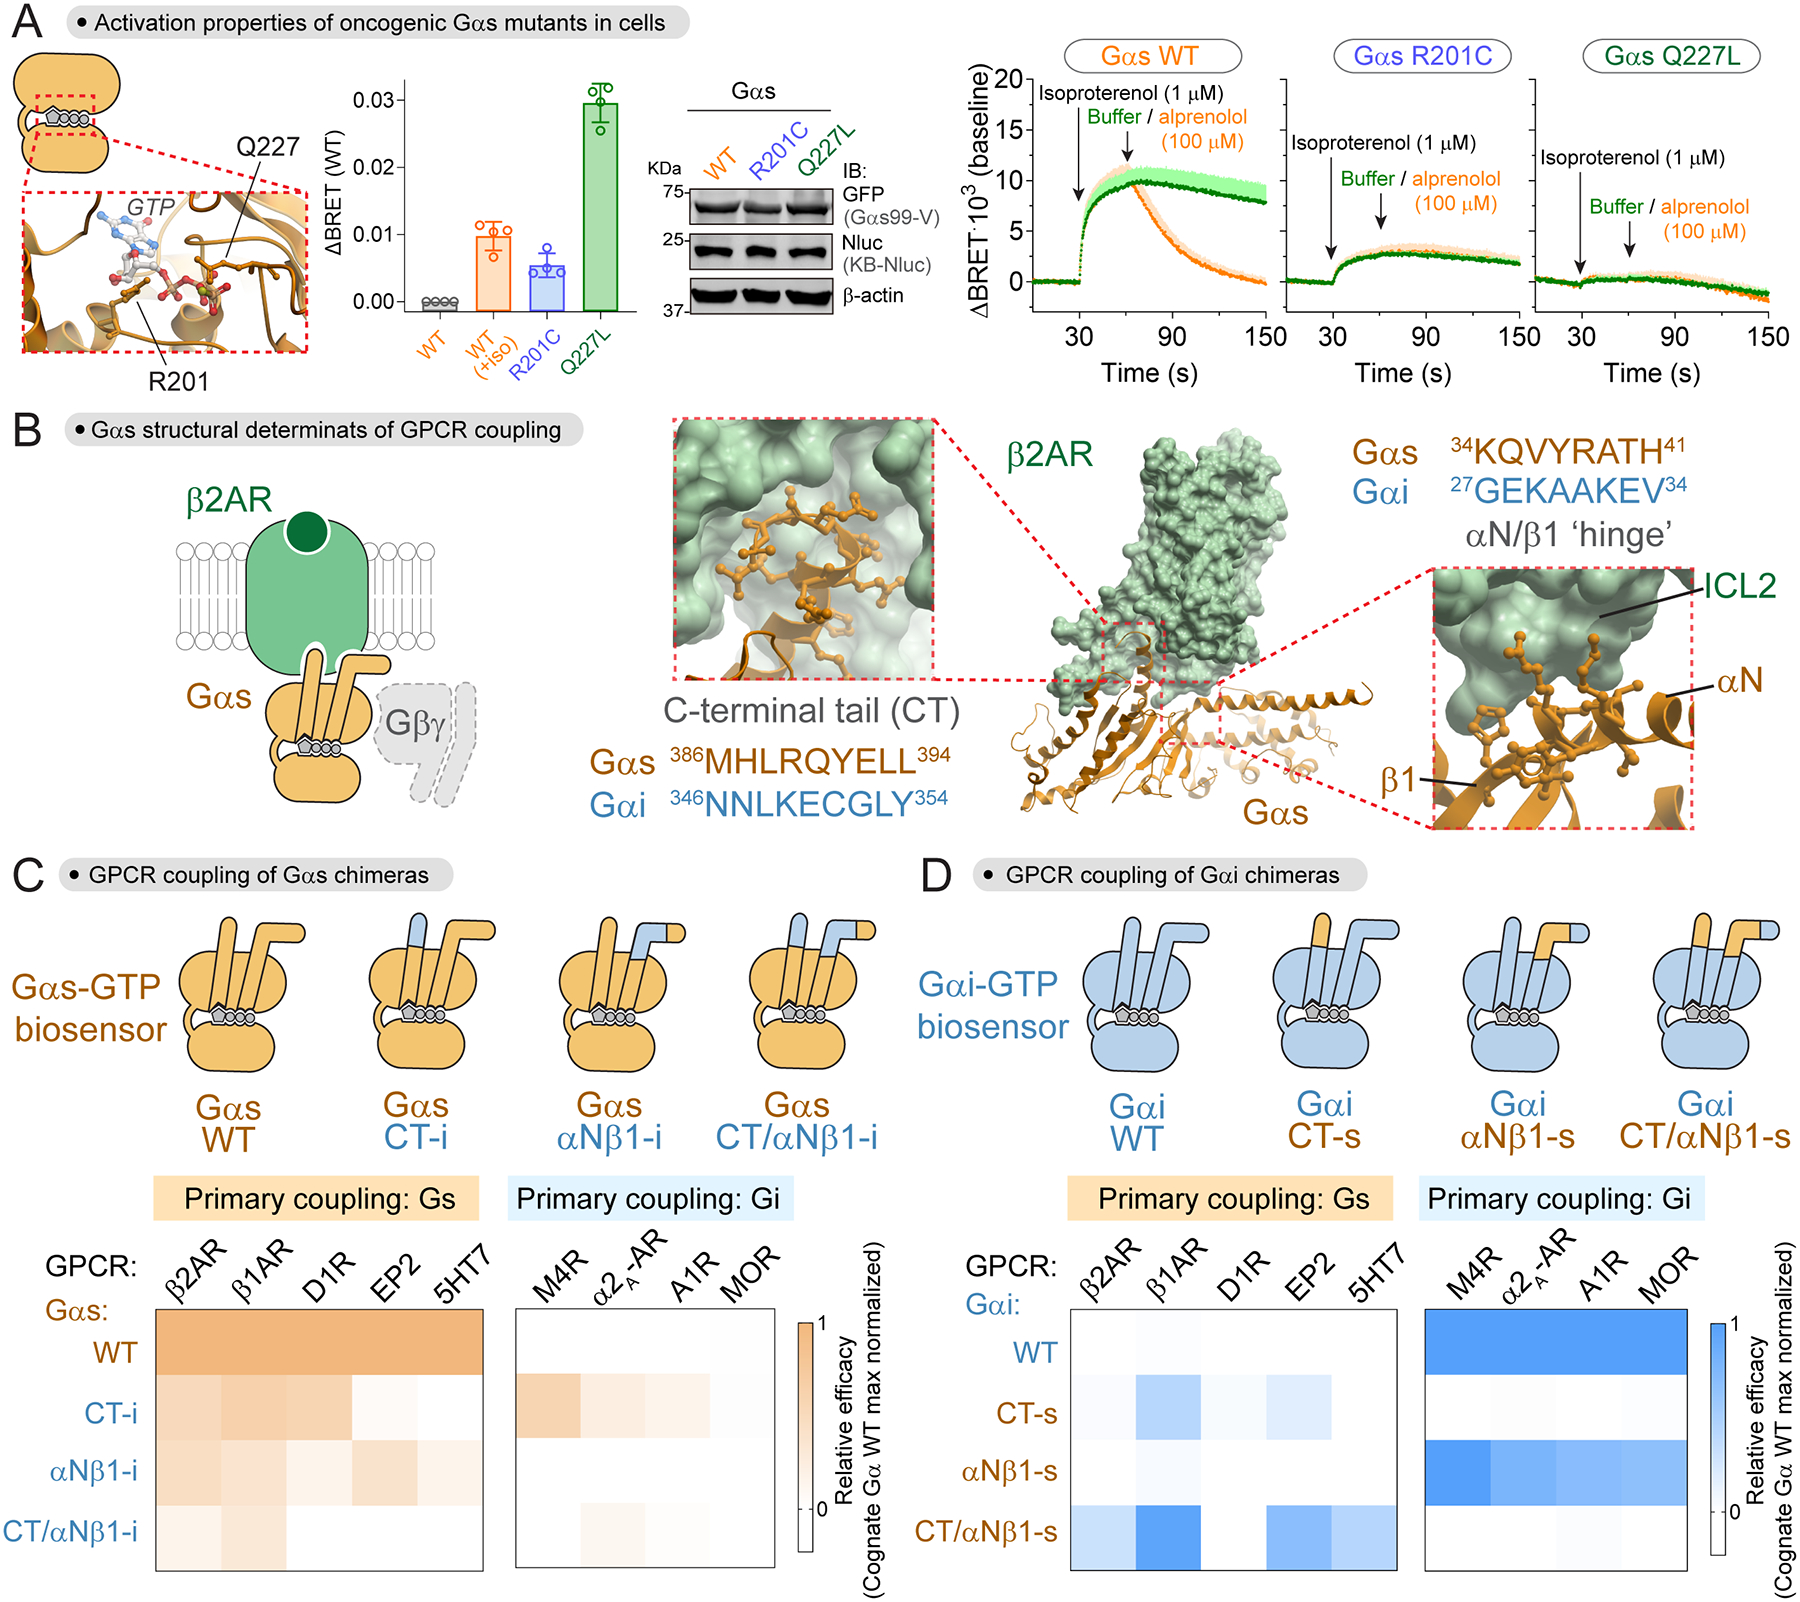
(A) Activation properties of oncogenic Gαs mutants. Left, view of Gαs nucleotide-binding pocket (PDB: 1AZT). Right, BRET was measured in HEK293T cells expressing the same components as in Fig.1B with KB1691-Nluc and the idnicated Gαs-99V constructs. Bar graph represents BRET signal relative to unstimulated Gαs-99V WT. Mean ± S.E.M. (n=4). Kinetic traces of cells expressing the same components are the difference in BRET from their corresponding unstimulated baselines. Mean ± S.E.M. (n=3).
(B) View of structural elements of Gαs involved in coupling to β2AR based on their complex structure (PDB: 3SN6).
(C, D) Contribution of the C-terminal tail (CT) and the αN/β1 ‘hinge’ of Gα subunits to their coupling to GPCRs. BRET was measured in HEK293T cells expressing the indicated YFP-tagged Gα chimeras, GPCRs, and Gβγ with either a Gαs-GTP biosensor (KB1691-Nluc, C) or a Gαi-GTP biosensor (KB1753-Nluc, D). Heat maps correspond to the mean (n=3–4) of efficacy of the BRET responses detected relative to the maximal response observed with the cognate WT G protein. Full concentration-dependence curves in Fig.S2.
Gαs-GTP biosensor reveals Gs structural determinants for productive GPCR coupling
Given that the Gs activity biosensor we developed measures the direct product of the catalytic GEF activity of GPCRs, i.e., Gαs-GTP, we set out to leverage it to characterize structural determinants of Gαs required for receptor-mediated activation. While it is well-established that the C-terminal tail of Gα is critical for GPCR coupling, it has become clear that this is not the sole determinant for coupling49–52. Based on the structure of the β2AR-Gs complex and other related GPCR-G protein structures, the αN/β1 hinge region of Gαs makes extensive contact with the receptor and may serve as an allosteric conduit between the receptors and the nucleotide binding pocket of G proteins53,54 (Fig.2B). To directly determine the relative contribution of the C-terminal tail (CT) and the αN/β1 hinge to the productive coupling of Gαs to GPCRs, we used the Gαs-GTP biosensor to measure β2AR-mediated activation of Gαs chimeras in which the CT and/or the αN/β1 hinge had been replaced by the corresponding sequences in Gαi3, which is not activated by this receptor (Fig.2C, FigS2). As expected, replacement of the CT led to a marked decrease in activation (~50%) compared to wild-type (Fig.2C, Fig.S2). Interestingly, replacement of αN/β1 hinge led to a similar decrease in activation (~50%), and the effects became additive when both CT and αN/β1 hinge were replaced (~95% decrease). These results indicate that not only the CT, but also the αN/β1 hinge, is necessary for efficient coupling of Gαs to β2AR (Fig.2C, FigS2). Moreover, replacement of the αN/β1 hinge region impaired activation by four other GPCRs known to couple primarily to Gs (Fig.2C, FigS2), indicating that the requirement for the αN/β1 hinge region is a general feature of Gs-GPCR coupling. Similar experiments were carried out with reciprocal Gαi3 chimeras to assess what elements of Gαs are sufficient to permit activation. Replacement of the CT of Gαi3 with the corresponding region of Gαs led to some activation upon stimulation of the β1AR and EP2 (Fig.2D, FigS2). When both the CT and αN/β1 hinge regions were replaced simultaneously, activation was enhanced for these two receptors compared to the CT chimera, and responses became detectable for two additional GPCRs (β2AR and 5HT7) (Fig.2D, FigS2). These results highlight the importance of the αN/β1 hinge region of Gα for activation by GPCRs that primarily couple to Gs. However, we found that this is not the case for GPCRs primarily coupled to Gi because replacement of the αN/β1 region of Gαi3 by the corresponding region of Gαs had little or no effect on its activation by four different receptors, while replacement of the CT completely ablated the responses (Fig.2D, FigS2). Moreover, grafting the αN/β1 hinge region of Gαi3 into Gαs was not sufficient to achieve activation of the non-cognate G protein by any of the four Gi-linked GPCRs, whereas replacement of the CT led to activation by three of them (Fig.2C, FigS2). These results indicate that the CT, but not αN/β1 hinge, of Gαi has a prominent role in achieving productive coupling to GPCRs. Taken together, our observations indicate that the αN/β1 hinge region is a structural determinant specifically important for Gαs productive coupling to cognate GPCRs, and that this feature might not be shared by other G proteins.
ONE vector G protein Optical (ONE-GO) biosensor designs display improved features
Next, we set out to condense all the components of the Gαs-GTP biosensor into a single vector. We reasoned that delivery of the biosensor as a single payload would provide several advantages. For example, it would facilitate implementation in high-throughput formats or when investigating endogenous GPCRs in poorly transfectable primary cells. Another advantage of delivering the biosensor components as a single payload is that every cell receiving the construct would express all components required for the BRET biosensor55,56, thereby increasing the magnitude of the responses detected while simultaneously reducing the total amount of exogenous G protein required (Fig.3A). As an initial step, we reduced the number of components required for detection of Gαs from five to three by removing exogenous expression of Gβ and Gγ, which do not directly participate in the BRET interaction between Gαs-99V and Nluc-fused KB1691 (Fig.3A, Fig.S3A). We found that expression of exogenous Gβγ was dispensable to obtain robust BRET responses (Fig.S3A). This not only indicates that we can reduce the number of components expressed without sacrificing quality of performance, but also that our biosensor detects responses of G protein heterotrimers assembled with endogenous Gβγ.
Figure 3. ONE vector G protein Optical (ONE-GO) biosensor designs display improved features.
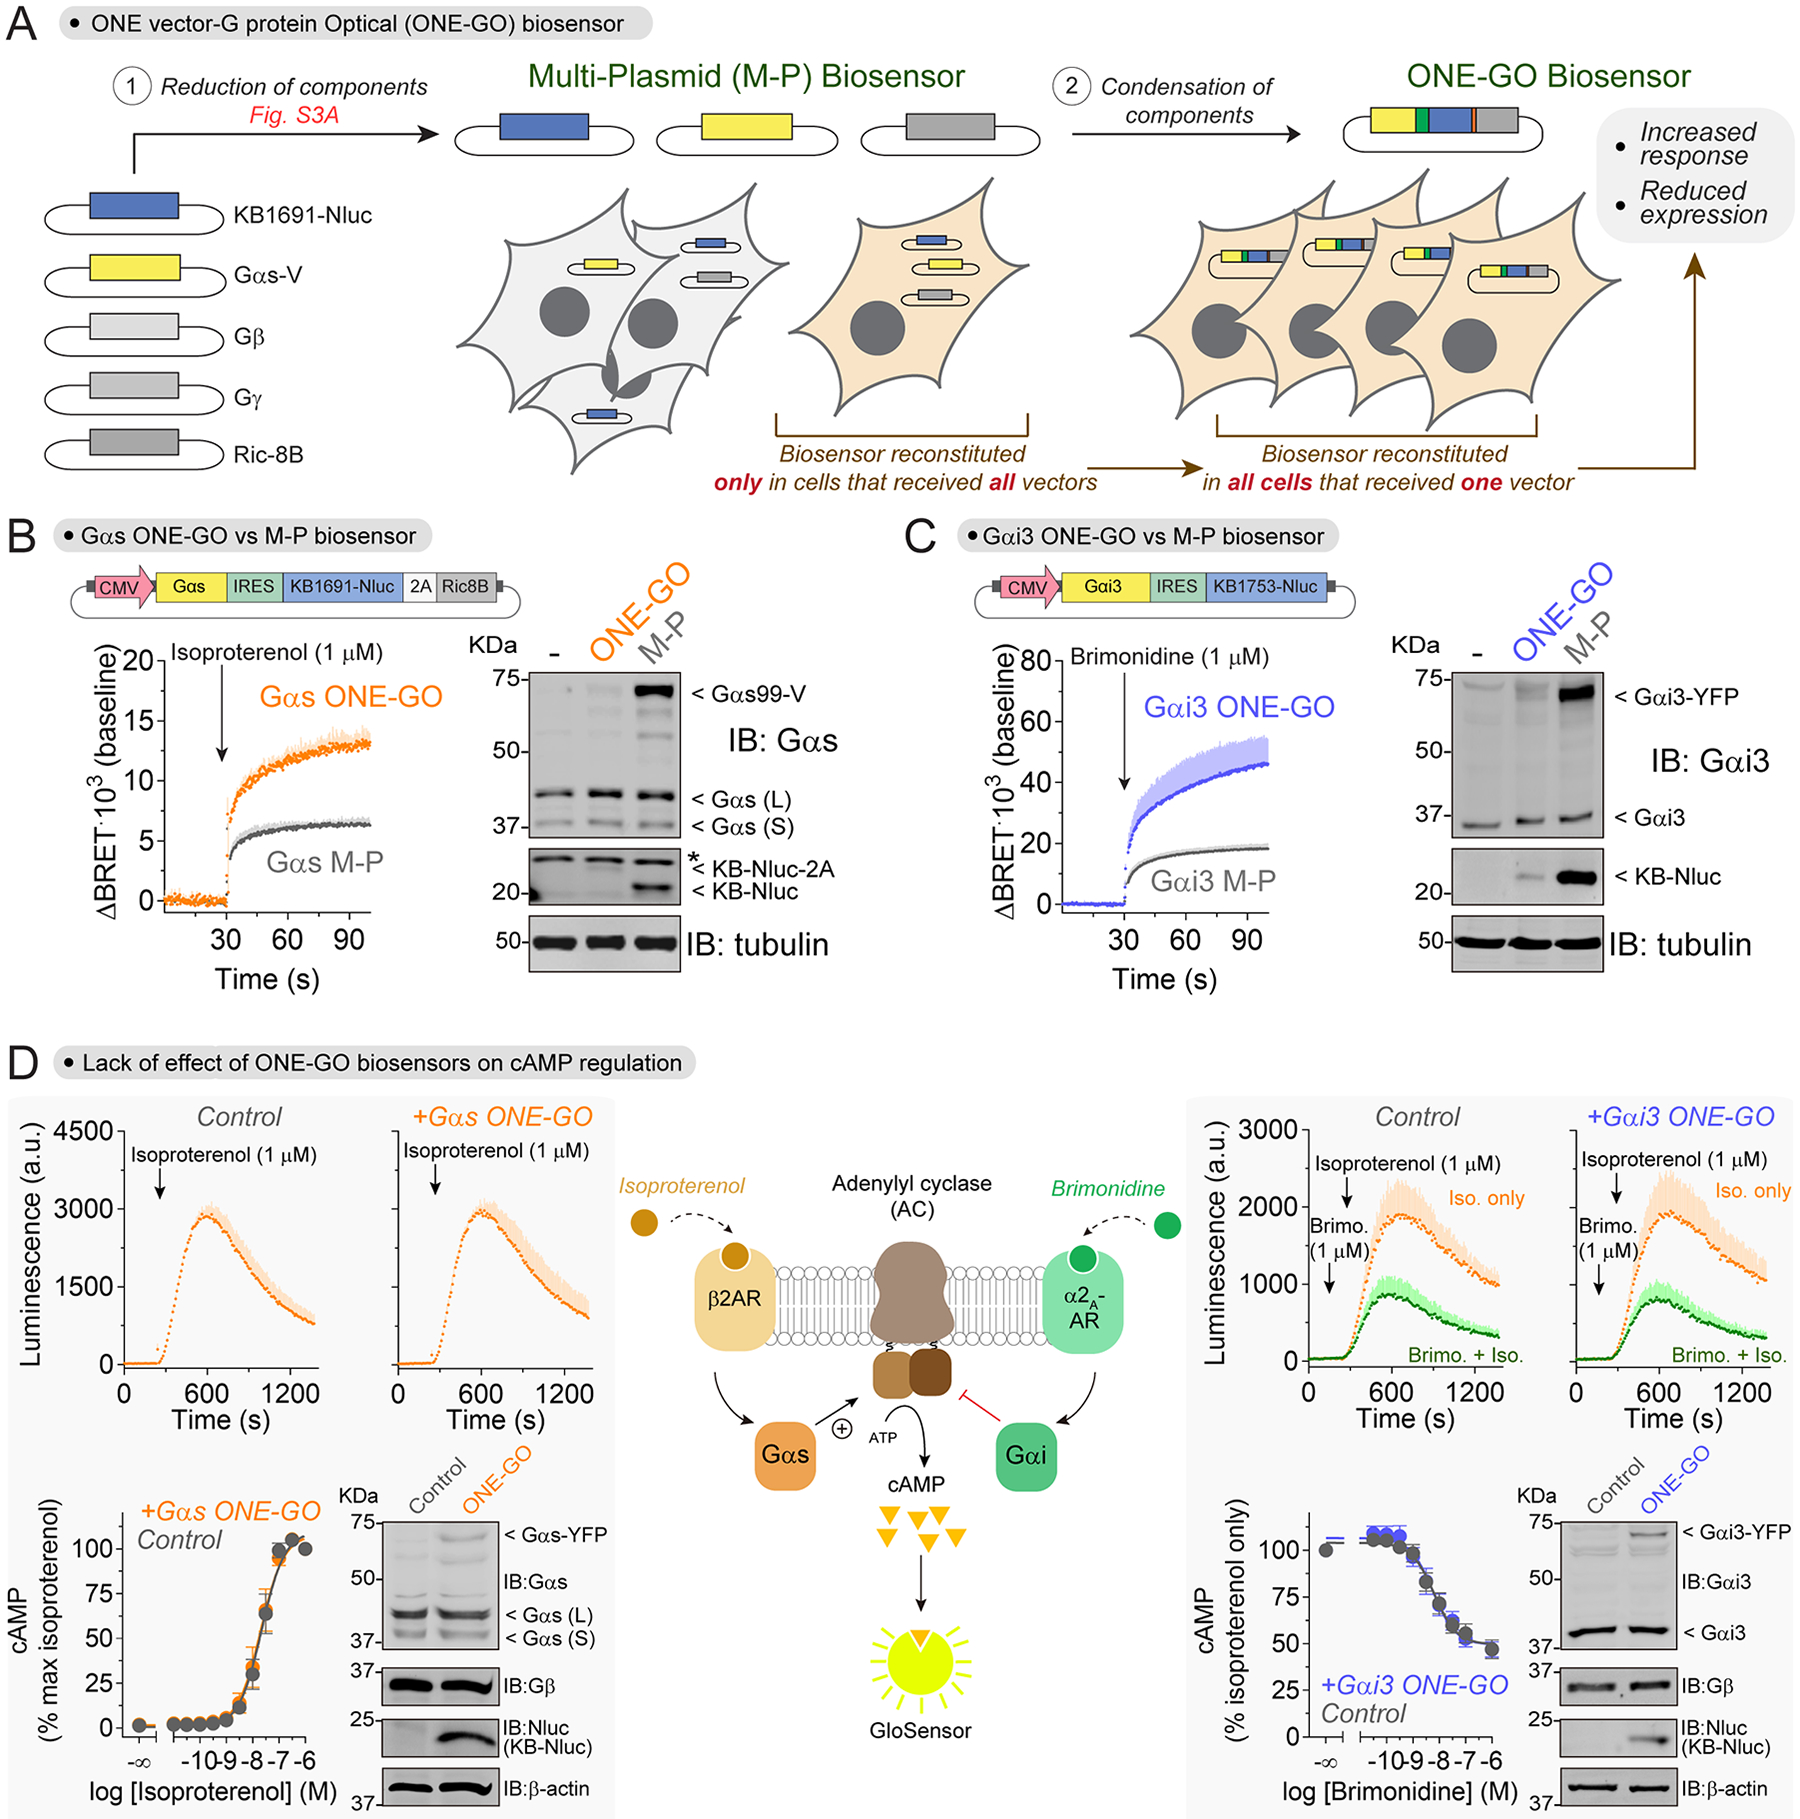
(A) Schematic of the process to develop ONE-GO biosensors.
(B-C) Gαs and Gαi3 ONE-GO biosensor designs provide increased responses and reduced component expression. BRET was measured in HEK293T cells transfected with the indicated single-plasmid ONE-GO biosensors or their multi-plasmid (M-P) counterparts. β2AR or α2A-AR were co-expressed for Gαs (B) or Gαi3 (C), respectively. Mean ± S.E.M. (n=3).
(D) ONE-GO biosensors do not interfere with GPCR-G protein signaling. Luminescence was measured in HEK293T cells expressing the cAMP probe Glosensor with or without the Gαs ONE-GO sensor (Left, endogenous β2AR) or Gαi3 ONE-GO sensor (Right, exogenous α2A-AR). Mean ± S.E.M. (n=3). Immunoblots show that ONE-GO sensors do not change the levels of endogenous G protein subunits.
We then set out to design and optimize a tricistronic Gα-GTP biosensor construct coding for Gαs-99V, a membrane-anchored KB1691-Nluc, and Ric-8B (Fig.3A), which we named Gαs ONE vector G protein Optical biosensor (Gαs ONE-GO biosensor). This construct and its derivatives described below were assembled in a lentiviral backbone ensuring that the size of the payload remained below the limit for lentiviral packaging. We explored designs with two promoters of different strength, SV40 and CMV, in which Gαs-99V was placed directly downstream of the promoter and KB1691-Nluc downstream of an IRES, followed by a self-cleaving T2A sequence and Ric-8B (Fig.S3B). We used a modified IRES with low efficiency (IRES*)57,58 to achieve a higher acceptor to donor expression ratio, which is expected to improve the dynamic range of BRET responses. Similar designs were also developed for another G protein (Gαi3) using a cognate Gα-GTP detector module (KB1753 peptide30,59), with the exception that no chaperone was included (Fig.S3B). To rigorously test the performance of the ONE-GO biosensors relative to their multi-plasmid (M-P) counterparts30, we compared them side by side under identical experimental conditions. We found that ONE-GO biosensors led to larger responses upon GPCR stimulation (Fig.3B–C, Fig.S3B), especially for the designs incorporating the CMV promoter. Moreover, this improvement in performance was accompanied with much lower levels of expression of G protein and Nluc-fusions with ONE-GO compared to M-P (Fig.3B–C). In particular, G protein expression was barely detectable by immunoblotting, and lower than expression of the corresponding endogenous G protein. Overall, these results indicate that ONE-GO biosensors detect robust responses under near-endogenous G protein expression conditions, in which low amounts of exogenous Gα subunits assemble into functional heterotrimers with endogenous Gβγ dimers.
ONE-GO biosensors do not interfere with GPCR-G protein signaling
To mitigate potential concerns of interference of ONE-GO biosensors with GPCR signaling, we tested their effect on a signaling readout downstream of G protein activation (i.e., cAMP). We found that neither Gαs ONE-GO nor Gαi3 ONE-GO changed the efficacy or potency of GPCR-mediated cAMP responses (Fig.3D). To further rule out the potential interference of the G protein-binding modules in the biosensor with normal G protein function, we determined if expression of these sequences interfered with Gα-Gβγ resting association or their dissociation upon GPCR stimulation (Fig.S4A). Using a biosensor that measures free Gβγ levels in cells, we found that neither the KB1691 nor the KB1753 sequence, used in Gαs ONE-GO and Gαi3 ONE-GO, respectively, altered the association of Gβγ with Gα before or after GPCR stimulation (Fig.S4A).
ONE-GO biosensors report activation across G protein families and for many GPCRs
Next, we extended the ONE-GO biosensor design to allow the detection of different Gα-GTP species across all four G protein families (Gs, Gi/o, Gq/11 and G12/13) (Fig.4A). We implemented the single plasmid design described above without co-expression of a chaperone by pairing Gα subunits tagged with YFP at the αb-αc loop of the all-helical domain, which tolerates insertions without affecting G protein function25,30,60, with membrane-anchored Nluc-fused detector modules30. We did not attempt to develop constructs for Gαt1, Gαt2, Gαgust, Gαolf, or Gα15 because we lacked validated or suitable detector modules. We generated ONE-GO constructs for Gα11 and Gα14 using GRK2RH as the detector module based on prior evidence61, but were not successful in detecting responses with them upon GPCR stimulation. In total, we validated ONE-GO biosensors for 10 different Gα subunits (Fig.4A; all ONE-GO sensor sequences are provided in [SI1]), including representative members of all four G protein families. Analogous to what was observed for other ONE-GO biosensors for G proteins that regulate AC/cAMP signaling (Fig.3), we found that that expression of Gαq ONE-GO did not affect ERK1/2 phosphorylation downstream of PLC/Ca2+/PKC signaling (Fig.S4B).
Figure 4. ONE-GO biosensors report activation across G protein families and for many GPCRs.
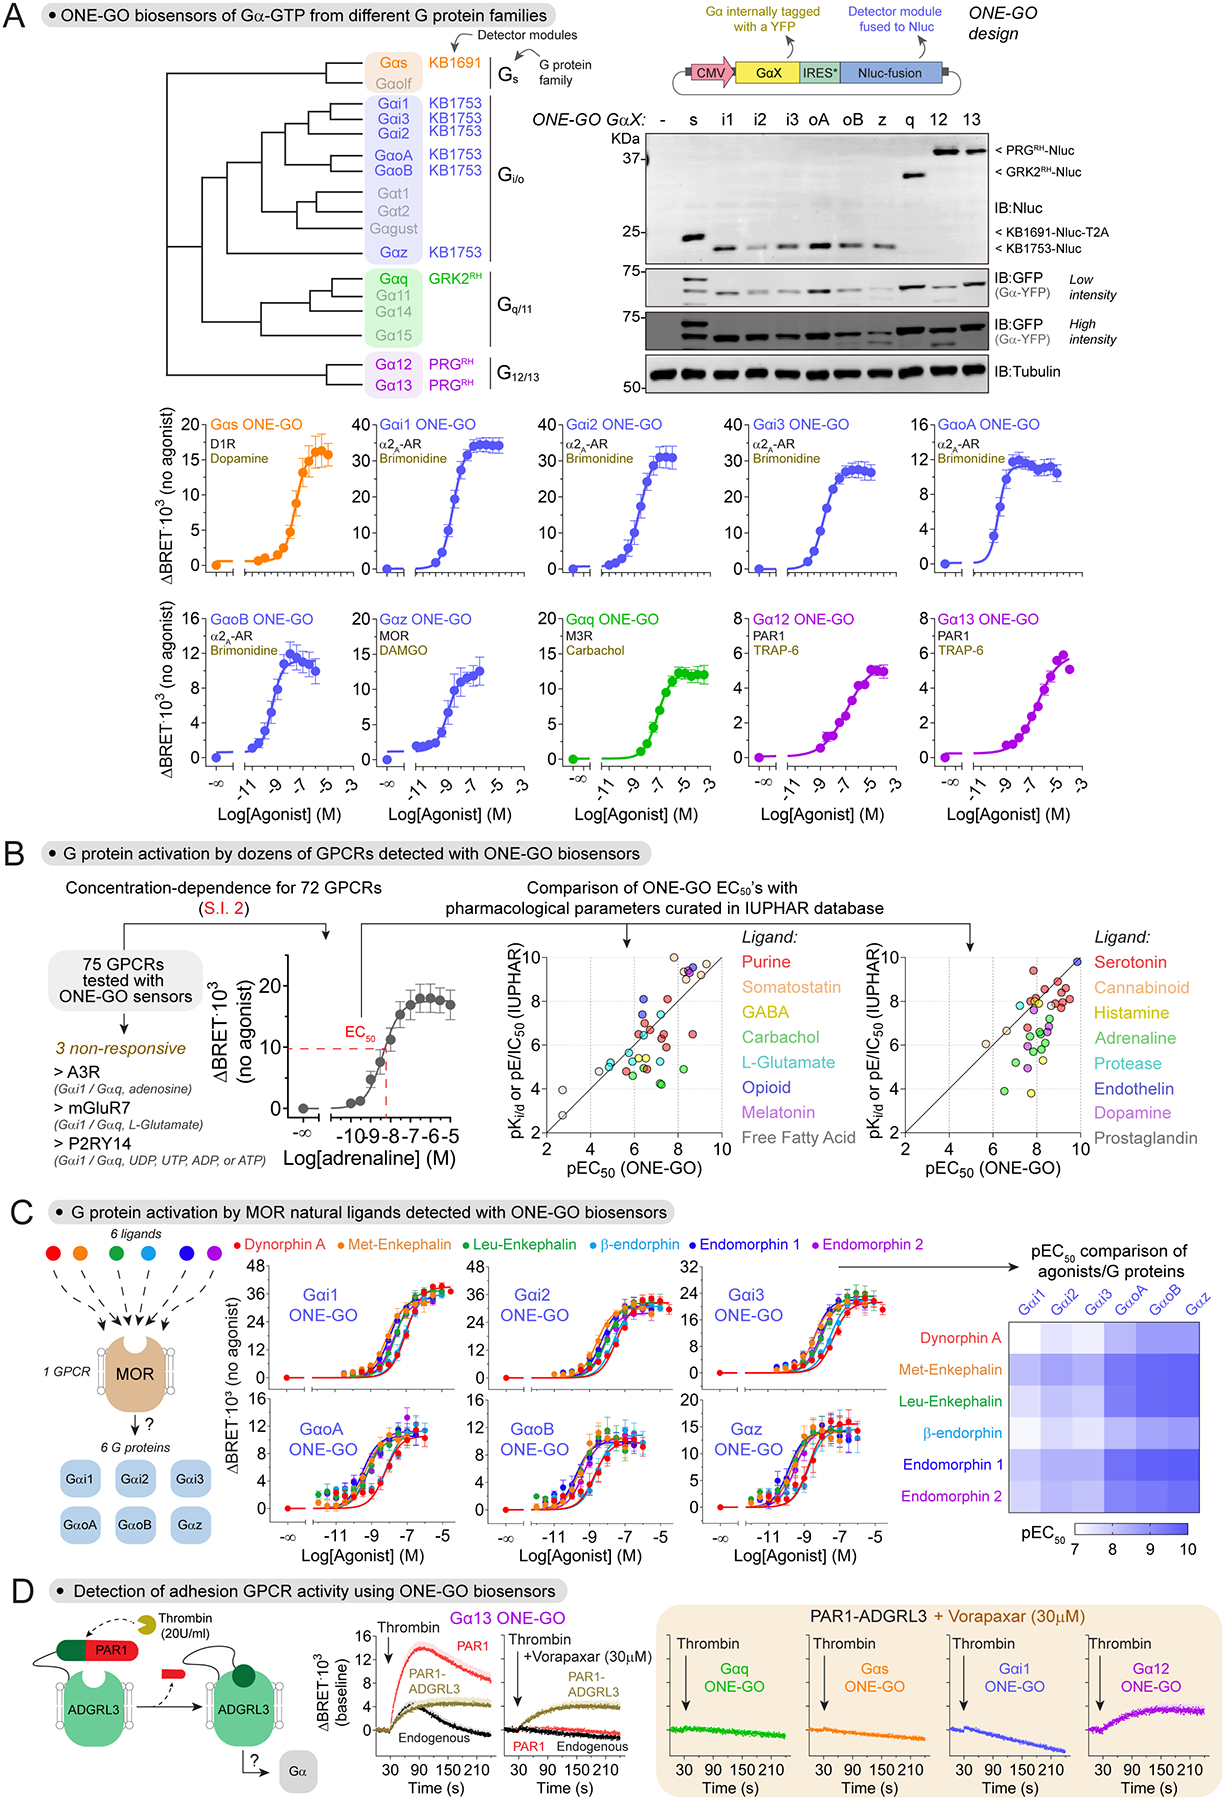
(A) Ten ONE-GO biosensors report activity across all G protein families. Top, dendrogram of Gα subunits with their corresponding detector modules used in ONE-GO designs, and expression of biosensor components in HEK293T cells (n ≥ 3). Bottom, BRET in HEK293T cells expressing the indicated ONE-GO biosensors and GPCRs. Mean ± S.E.M. (n=3–5).
(B) ONE-GO biosensors report the activity of dozens of GPCRs. Concentration-dependent BRET responses were measured in HEK293T cells for 75 GPCRs to determine EC50 values, which were plotted against curated pharmacological parameters (pKd, pKi, or pE/IC50) available in the IUPHAR database.
(C) Activation profile of G proteins of the Gi/o family with ONE-GO biosensors upon stimulation of the MOR with six natural neuropeptide ligands. BRET in HEK293T cells expressing the MOR and the indicated ONE-GO biosensors upon stimulation with dynorphin A, Met-Enkephalin, Leu-Enkephalin, β-endorphin, endomorphin 1, or endomorphin 2. Mean ± S.E.M. (n=5–6). The heatmap shows mean pEC50 values.
(D) Profiling the activation of different G proteins by the adhesion GPCR ADGRL3 using ONE-GO biosensors. Left, PAR1-ADGRL3 chimera activated by thrombin. Middle and Right, BRET in HEK293T cells expressing the indicated ONE-GO sensors and either the PAR1 receptor or the PAR1-ADGRL3 chimera upon stimulation with thrombin. The PAR1 antagonist vorapaxar was used to blunt G protein activation by endogenously expressed PAR1 receptors. Mean ± S.E.M. (n=3–4).
To assess the broad utility of ONE-GO biosensors, we implemented them with a large panel of GPCRs and compared results with curated pharmacological parameters (e.g., Ki values) available through the International Union of Basic and Clinical Pharmacology (IUPHAR62) (Fig.4B). In total, we tested 75 GPCRs with a cognate ONE-GO biosensor, and obtained concentration-dependent response curves for >95% of them (72 out of 75 receptors) (Fig.4B, [SI2]). Overall, there was a good correlation between EC50 values determined in our assays with ONE-GO biosensors and IUPHAR’s data (Fig.4B, [SI3]). Although comparing our EC50’s to the parameters from IUPHAR is limited by the contribution of differences in experimental conditions, these results indicate that detection of GPCR activation by ONE-GO biosensors is broadly reliable and sensitive.
We next asked if ONE-GO biosensors could distinguish the profiles of activation of multiple G proteins by the same GPCR when stimulated by more than one ligand. For this, we explored the activation of six different G proteins of the Gi/o family upon stimulation of the μ-opioid receptor (MOR) by six different neuropeptides. Concentration dependence curves were generated for the 36 combination of ligand/ G protein, which revealed an overall pattern of higher potencies on GαoA, GαoB, and Gαz compared to Gαi1, Gαi2, and Gαi3 for all ligands, and that Dynorphin A and β-endorphin had lower potency than the rest of the neuropeptides regardless of the G protein investigated (Fig.4C, [SI4]). These observations agree with recent evidence using an alternative biosensor system63. We also expanded the characterization of ONE-GO biosensors by applying them to adhesion GPCRs, an understudied class of GPCRs with a unique mechanism of activation64,65. For this, we used an engineered version of ADGRL3 (Latrophilin 3) that can be rapidly activated by thrombin by virtue of a fusion to a fragment of the PAR166. By blocking endogenous thrombin receptors in HEK293T cells with vorapaxar, we could determine that ADGRL3 activates G proteins of the G12/13 family, but not of any of the other 3 G protein families (Gs, Gi/o, Gq/11) using ONE-GO biosensors (Fig.4D). Taken together, these results indicate that ONE-GO biosensors can detect G protein activation by many GPCRs upon stimulation by diverse ligands and mechanisms.
Given the success with Gα-GTP ONE-GO biosensors, we also generated ONE-GO biosensors for the other active signaling species generated upon GPCR stimulation, free Gβγ (Fig.S3C). For this, we leveraged the individual components of a previously described Gβγ BRET biosensor26,27, which were assembled into a single plasmid (Fig.S3C). As a proof of principle, we showed that this design detected responses upon stimulation of Gs or Gi3 heterotrimers by a cognate GPCR (Fig.S3C).
In summary, our results demonstrate that the ONE-GO biosensor design is broadly applicable to detect GPCR-mediated activation across and within G protein families with high sensitivity.
Parallel profiling of atypical antipsychotics across a large set of receptors
Given the advantages of delivery as a single genetic cargo and improved dynamic range of ONE-GO biosensors, we set out to demonstrate their suitability for applications in two broad areas: (1) scaling up throughput in experiments with cell lines, and (2) allowing the interrogation of endogenous GPCR activity, even in difficult to transfect primary cells. To start addressing the implementation of ONE-GO biosensors in the first area, we focused our attention on three widely prescribed atypical antipsychotics: brexipiprazole, iloperidone, and cariprazine67. Although the exact mechanism of action of these drugs is unknown, the therapeutic benefit of atypical antipsychotics arises from their GPCR polypharmacology, i.e., engaging simultaneously multiple GPCRs, typically with partial agonism/antagonism. Nevertheless, the complex pharmacological profiles of atypical antipsychotics are also believed to underlie the wide range of side effects that vary from one specific drug to another. Although brexipiprazole68, iloperidone69,70, and cariprazine71 have been systematically characterized for binding to large panels of GPCRs, their functional effect as agonists and antagonists has been less systematic, mixing assay readouts and cell lines. We leveraged ONE-GO biosensors to expand and unify the functional characterization of the effect of these three drugs against a panel of 45 GPCRs regulated by neurotransmitters (Fig.5A, [SI5]). Each drug was assayed in the absence or presence of a canonical agonist for each GPCR to test agonist or antagonist activity, respectively. For each drug, all receptors were interrogated in parallel for a total of >500 simultaneous measurements (Fig.5A). As expected, the three drugs presented agonist and antagonist activities on numerous GPCRs. From a broad perspective, we found that brexipiprazole and cariprazine had similar profiles of agonism and antagonism, whereas iloperidone differed, as supported by principal component analysis (PCA) (Fig.5A). In broad strokes, iloperidone acts on similar targets as brexipiprazole and cariprazine, prominently serotonin, dopamine, and adrenergic receptors, but with more potent antagonist activity and poor agonist efficacy. At a more granular level, we recapitulated known features of these drugs, including their action on 5-HT1a, 5-HT2a or D2-like dopamine receptors68–71, but also unknown ones. For example, we identified inverse agonism for iloperidone on 5-HT1b or 5-HT1d, or the full agonist activity of brexipiprazole and cariprazine on 5-HT1b and 5-HT2c, or of cariprazine on 5-HT1d (Fig.5A). All three drugs also antagonized the α2C-AR. Overall, these findings demonstrate that the ONE-GO biosensor platform can be leveraged to rapidly illuminate GPCR pharmacological profiles through functional interrogation of hundreds of conditions in parallel.
Figure 5. Large-scale parallel interrogation of GPCR activity with ONE-GO biosensors.
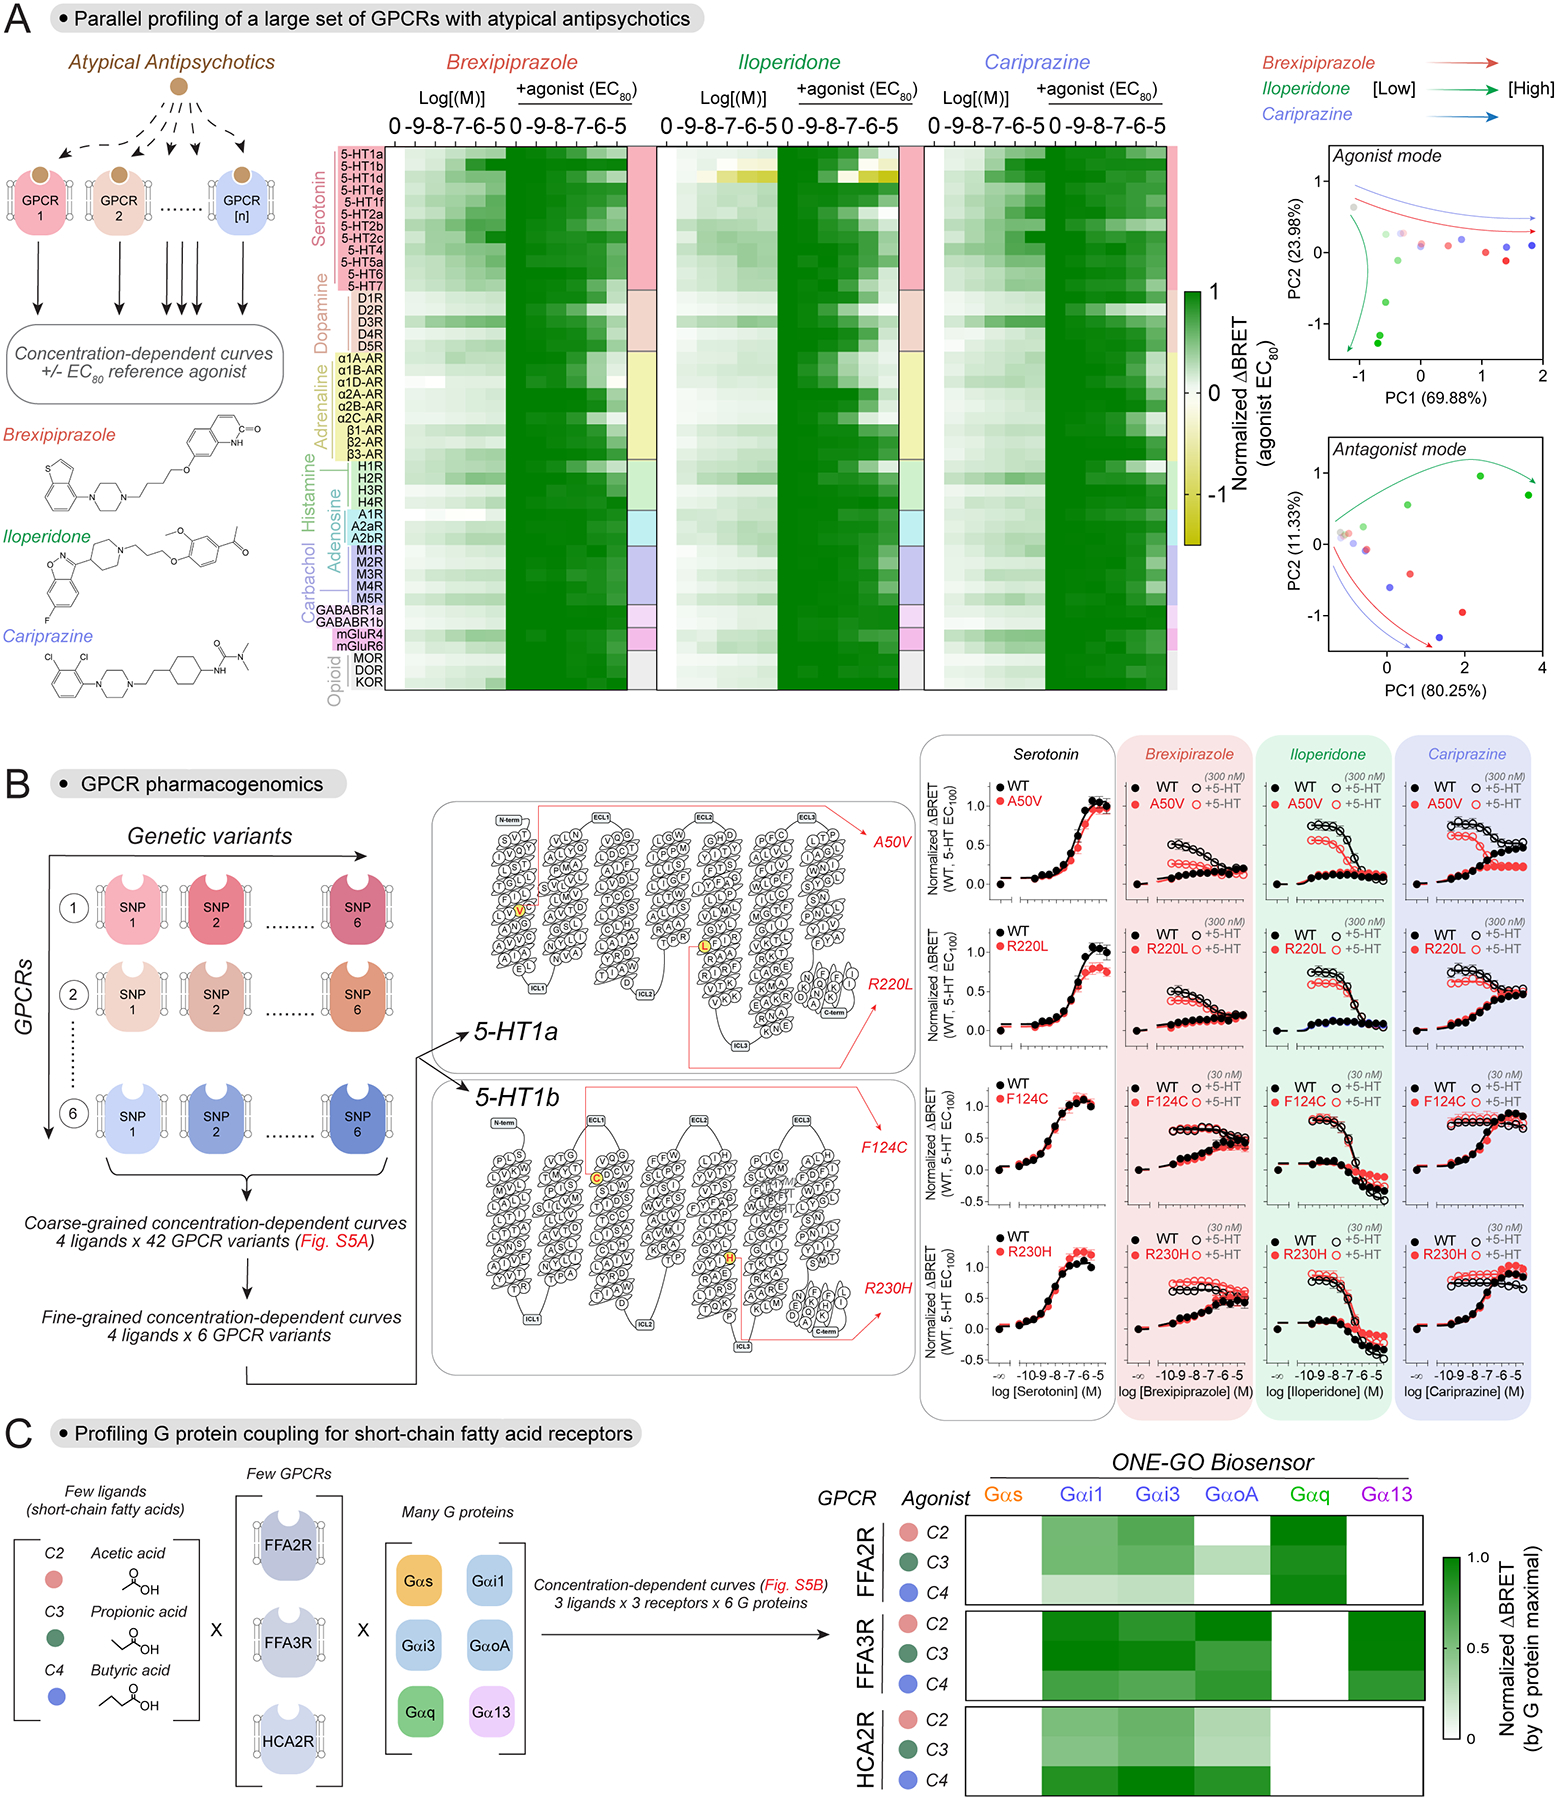
(A) Parallel profiling of atypical antipsychotics across a large set of receptors. Left, schematic of the assay and structure of the compounds investigated. Middle, BRET in HEK293T cells expressing the indicated GPCRs along with a cognate ONE-GO biosensor upon stimulation with the indicated concentrations of each antipshycotic alone or in presence of an agonist at its EC80 concentration (see [SI5] for details). Mean (n=3–7). Right, principal component analysis (PCA) of the data presented in the heatmaps.
(B) Pharmacogenomic profiles of atypical antipsychotics. Left, schematic of the assay (coarse-grained curves shown in Fig.S5A). Middle, Snake plots for 5-HT1a and 5-HT1b showing genetic variants investigated on the right. Right, BRET in HEK293T cells expressing the indicated GPCRs and the Gαi1 ONE-GO sensor. The indicated compounds were tested by themselves (filled circles) or in presence of 5-HT (open circles). Mean ± S.E.M. (n=3–4).
(C) Profiling of G protein selectivity across short-chain fatty acid receptors. Left, schematic of variables investigated. Right, BRET in HEK293T cells expressing the indicated GPCR / ONE-GO biosensor combinations upon stimulation with the indicated agonist. Results are maximal responses normalized by biosensor (mean, n=3–6). Full concentration-dependent curves in Fig.S5B.
Pharmacogenomics of atypical antipsychotics
Next, we expanded the characterization of atypical antipsychotics by assessing how naturally-occurring variants in GPCR sequences influence drug action, a phenomenon known as pharmacogenomics. Pharmacogenomics of GPCR drug targets might account for many adverse side effects or varying drug efficacy across patient populations, but progress in improving prescription precision or clinical trial design has been hampered by the lack of approaches to systematically interrogate the functional consequences of GPCR variants72–74. We leveraged ONE-GO biosensors to compare the pharmacological profiles of brexipiprazole, iloperidone, and cariprazine on GPCR variants bearing frequent single nucleotide polymorphisms (SNPs). We first carried out coarse-grained concentration-dependence studies to rapidly identify potential differences by assessing hundreds of experimental conditions in parallel (Fig.S5A, [SI6]). Although we recognized that these SNPs could affect total or surface expression of the GPCRs, our goal was to determine if the variant led to different functional outcomes regardless of the underlying cause. Most of the variants led to little or no differences (Fig.S5A), whereas four of them were selected for more granular concentration-dependence studies to define the putative differences: 5-HT1a A50V, 5-HT1a R220L, 5-HT1b F124C, 5-HT1b R230H (Fig.5B). While the A50V variant had no effect on the efficacy of serotonin, brexipiprazole or iloperidone on 5-HT1a, it made cariprazine a more efficacious antagonist, while reducing its agonist activity (Fig.5B). In contrast, 5-HT1a R220L reduced the efficacy of serotonin, but had no effect on any of the three antipsychotics (Fig.5B). As for, 5-HT1b variants, both F124C and R230H reduced the efficacy of iloperidone as an inverse agonist without changing the effects of brexipiprazole or cariprazine (Fig.5B). R230H but not F124C increased the efficacy of serotonin on 5-HT1b. Overall, these results reveal distinct functional interactions between widely prescribed antipsychotics and naturally-occurring GPCR genetic variants.
Profiling of G protein selectivity across short-chain fatty acid receptors
Many GPCRs, including those activated by short-chain fatty acids (SCFA), can promiscuously activate different classes of G proteins modulating distinct downstream pathways75,76. Extracellular SCFA generated by the gut microbiota or as byproducts of eukaryotic metabolism regulate numerous physiological functions via GPCR activation77–79. GPCR responses triggered by SCFA are shaped by the intersection of multiple variables, yet the relationship between these variables and the responses has not been systematically deconvoluted using a unified readout80,81. The variables consist of multiple ligands [variable 1] that act on multiple GPCRs [variable 2] to promiscuously activate G proteins of different families [variable 3] (Fig.5C, Fig.S5B, [SI7]). We set out to profile these variables in parallel with ONE-GO biosensors for representative members from each of the 4 G protein families (Gαs, Gαi1, Gαq, Gα13), as well as for different members of the Gi/o family (Gαi1, Gαi3, GαoA). None of the receptor-ligand combinations led to a response with Gαs ONE-GO, whereas Gαq activation was only detected for FFAR2 and Gα13 activation was only detected with FFAR3 (Fig.5C, Fig.S5B). Both FFAR2-Gαq and FFAR3-Gα13 responses were similar regardless of the SCFA ligand used. While all three receptors elicited activation of Gi/o proteins, they did so with different profiles. First, FFAR2 was a poor activator of GαoA compared to FFAR3 and HCAR2. The SCFA ligand used also led to different responses across receptors. For example, efficacy and potency of Gαi/o responses decreased with the chain length of the SCFA for FFAR2, whereas HCAR2 showed the opposite pattern (Fig.5C, Fig.S5B). For the Gαi/o responses with FFAR3, the efficacy was similar for the three ligands, but potency was increased for ligands with longer chains (Fig.5C, Fig.S5B). In summary, these results shed light onto the complex G protein responses elicited by SCFA depending on the combination of available receptors and relative abundance of ligands.
Time-resolved parallel interrogation of GPCR responses
Next, we tested the suitability of ONE-GO biosensors to record multiple kinetic responses to GPCR ligands in parallel, instead of the end-point measurements described above. Time-resolved measurements can be useful not only to evaluate changes in activation/deactivation kinetics, but also to probe multiple modes of pharmacology like agonism, antagonism, and allosteric modulation from a single well82,83. We measured time-resolved responses simultaneously across 48 wells with two different receptors (α2A-AR and GABABR), obtaining high reproducibility scores (Z’ > 0.9), and resolving an expected delay in G protein deactivation kinetics after disabling RGS GAP mediated regulation with mutation G183S in Gαi384,85 (Fig.S5C).
Detection of endogenous GPCR activity in cells lines
To start investigating the detection of responses elicited by endogenous GPCRs, we generated stable HeLa cells expressing Gαi3 ONE-GO or Gαi3/Gβγ ONE-GO biosensors by lentiviral transduction followed by fluorescence-activated cell sorting (Fig.S6A–B). We previously showed that endogenous α2-adrenergic receptors in these cells led to detectable Gαi-GTP or free Gβγ responses with a different biosensor design named BERKY30. We found that stimulation with an α2-adrenergic agonist gave rise to robust concentration-dependent responses in cells expressing different levels of Gαi3 ONE-GO or Gαi3/Gβγ ONE-GO biosensors, and that these responses were much larger than those observed previously in the same cells with Gαi*-BERKY3 or Gβγ-BERKY3 biosensors, respectively30 (Fig.S6A–B). Similarly, we compared side by side responses triggered by endogenously expressed opioid receptors in SH-SY5Y using Gαi3 ONE-GO or Gαi*-BERKY3 biosensor30 (Fig.S6C), finding found that the ONE-GO biosensor outperformed the BERKY biosensor by eliciting a response almost 10-fold larger. Overall, these results demonstrate that ONE-GO biosensors detect responses triggered by different endogenous GPCRs in two separate cell lines, and that these responses largely exceed those measured by previously described biosensors that also detect endogenous GPCR responses.
Endogenous GPCR activity across a wide palette of primary cells
Next, we evaluated ONE-GO biosensors to detect endogenous GPCR responses in primary cells, which should better recapitulate physiologically-relevant conditions compared to immortalized or transformed cell lines. First, we succeeded in detecting kinetic and concentration-dependent responses triggered by endogenous adenosine or protease activated receptors in primary human cardiac fibroblasts transduced with lentiviruses of ONE-GO biosensors for G proteins representative for each one of the four families (Fig.6). We expanded our studies to five other primary cell types representing different organs from both human and mouse origin: human bronchial smooth muscle cells, human umbilical vein endothelial cells, mouse lung fibroblasts, mouse astroglial cells, and mouse cortical neurons. To achieve neuron-specific expression, the CMV promoter was replaced by the synapsin I promoter in the lentiviral constructs. Figure 6 shows examples of responses detected in all these cell types, which account for all G protein families and at least 10 general types of receptors for diverse ligands. Figure S7 illustrates additional examples of ligand-biosensor pairs, including GαoA responses, and controls assessing the specificity of the responses observed. For example, Gαi/o responses were blocked by pertussis toxin86, and Gαq responses by YM-25489087, whereas none of these treatments affected Gα13 responses, as expected (Fig.S7). Given the lack of inhibitors for Gαs, the specificity of the responses was determined with selective antagonists for the presumed Gs-coupled GPCRs (Fig.S7). We also assessed potential differences in neurotransmitter responses depending on the subtype of neurons investigated (Fig.S7), finding that striatal neurons, compared to cortical neurons, gave larger responses to adenosine or the α2-adrenergic agonist brimonidine, whereas serotonin responses were smaller and baclofen and dopamine remained similar (Fig.S7). These results demonstrate the suitability and broad applicability of ONE-GO biosensors for the detection of endogenous GPCR responses mediated by any general type of G protein across an ample palette of distinct primary cell types.
Figure 6. Detection of endogenous GPCR activity across a wide palette of primary cells with ONE-GO biosensors.
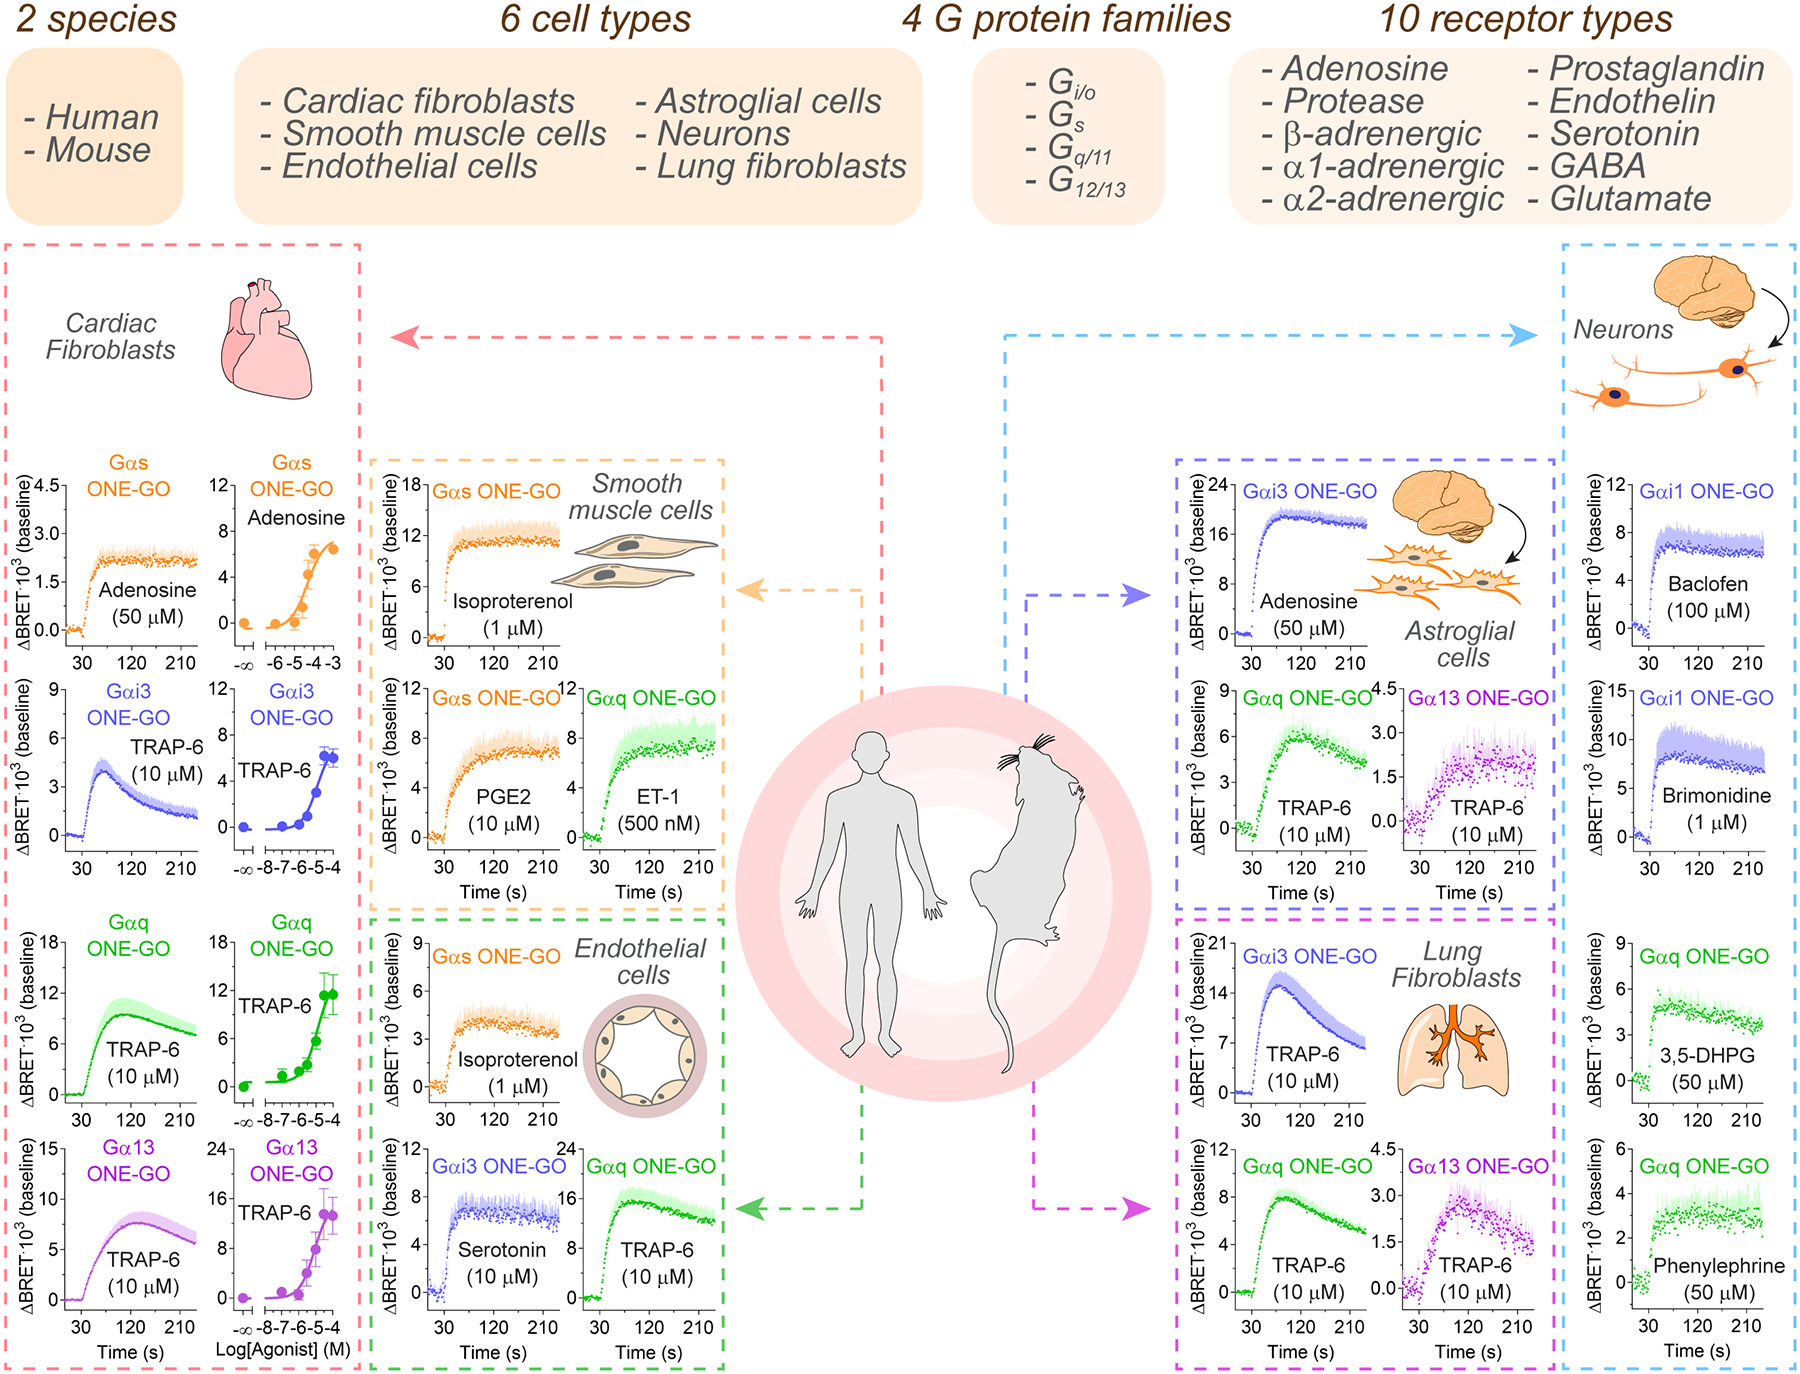
Top, summary of responses triggered by endogenous GPCRs detected with ONE-GO biosensors for all G protein families in multiple human and mouse primary cells of different origins. Bottom, BRET responses were measured in the indicated primary cells transduced with ONE-GO biosensors. Mean ± S.E.M. (n=3–6). Additional examples and controls in Fig.S7.
Cell type specific G protein selectivity profiles of protease-activated receptor 1
A poorly understood but critical aspect of GPCR regulation is its context dependence. In other words, how does GPCR behavior depend on the cell type or state in which it is expressed? In the next sections, we provide three examples of how measuring endogenous GPCR activity reveals context-specific behavior; from how a receptor changes its profile of activation of different G protein families depending on cell type, to discrimination of G protein subtypes within the same family for some receptors in neurons, to remodeling of G protein activation profiles upon induction of disease-mimicking cell transformation.
Protease activated receptor 1 (PAR1) is known to promiscuously couple to G proteins of the Gi/o, Gq/11 and G12/13 families75,76. Although G protein coupling specificity has been systematically addressed with unified readouts in cell lines expressing exogenous PAR175, this has not been done for endogenous PAR1. We stimulated endothelial cells, lung fibroblasts, cardiac fibroblasts and astroglial cells with a PAR1-specific agonist and measured activation of Gαq, Gαi3, or Gα13 with ONE-GO biosensors (Fig.7A). All cell types exhibited a robust Gαq response, but the relative strength of the Gαi3 and/or Gα13 responses varied across cell types giving rise to distinct profiles of G protein activation (Fig.7A, left). For example, Gαi3 responses were very weak or absent in endothelial cells and cardiac fibroblasts, whereas Gα13 responses were strong in cardiac fibroblast but only modest in the other three cell types (Fig.7A). The different response profiles could not be explained by differences in relative expression of the three biosensors, as determined by luminescence measurements (Fig.7A, right). These results reveal that the profile of PAR1 coupling to G proteins of different families depends on the cell type in which the receptor is expressed.
Figure 7. ONE-GO biosensors reveal context-dependent activity of endogenous GPCRs.
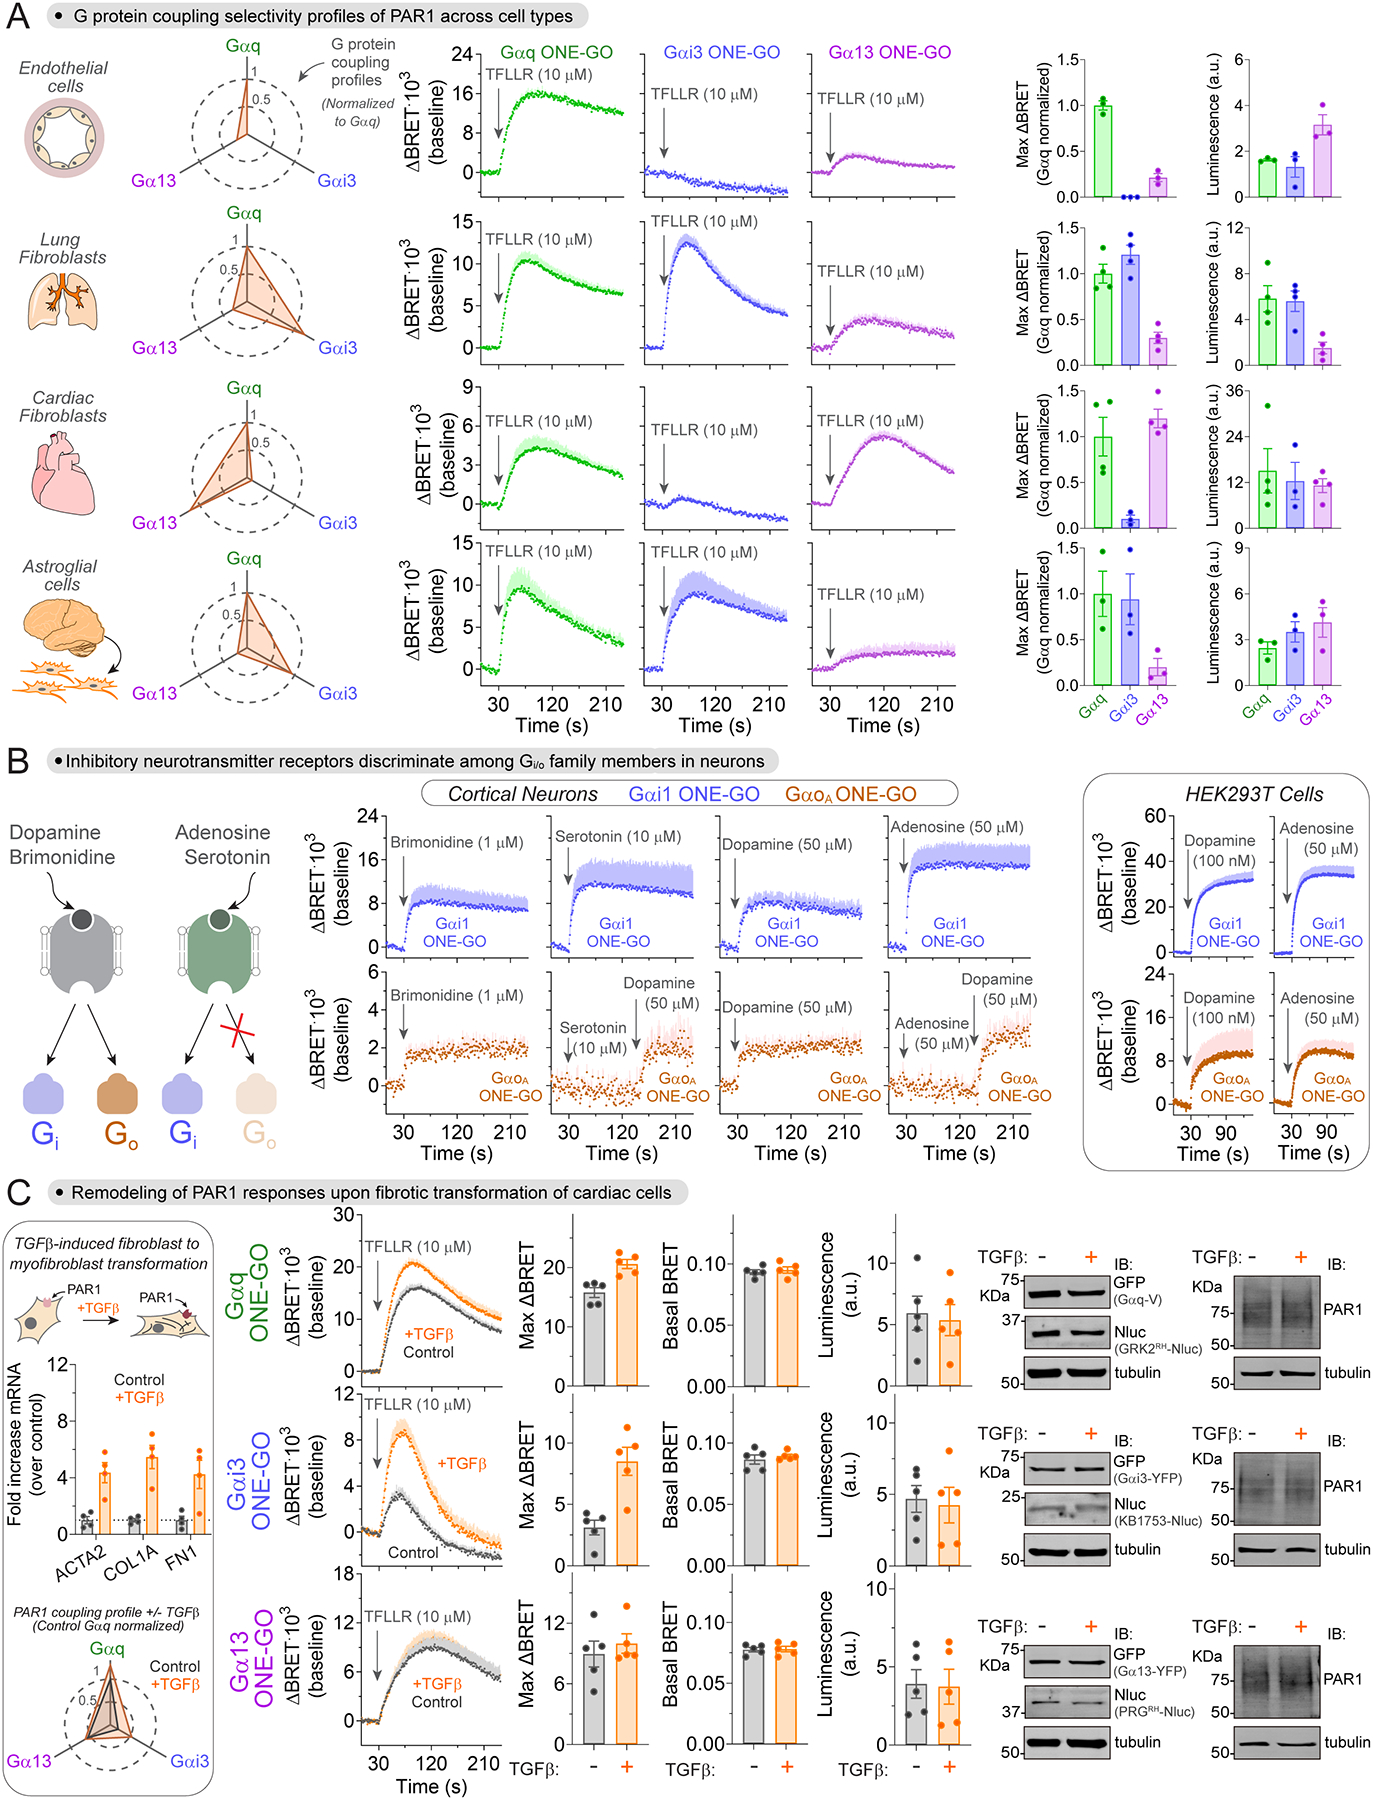
(A) Cell type-dependent G protein selectivity profiles of PAR 1. Left, spider plot summarizing PAR1 G protein activation profiles for each cell type. Middle, BRET in each one of the 4 primary cell types transduced with the indicated ONE-GO biosensor. Right, maximal BRET responses normalized to Gαq ONE-GO and raw luminescence counts indicative of biosensor expression. Mean ± S.E.M. (n=3–4).
(B) Discrimination across Gi/o isoforms by neuroinhibitory GPCRs in primary neurons. Left, BRET in primary mouse cortical neurons transduced with Gαi1 ONE-GO (top row, blue) or GαoA ONE-GO (bottom row, brown) biosensors stimulated with the indicated neurotransmitters. Mean ± S.E.M. (n=3–6). Right (box), BRET in HEK293T cells expressing either the D2R or the A1R along with the indicated ONE-GO biosensor. Mean ± S.E.M. (n=3).
(C) Myofibroblast transformation remodels the G protein selectivity profile of PAR1. Left (box), confirmation of TGFβ-induced myofibroblast transformation by RT-qPCR (mean ± S.E.M., n=4), and spider plot summarizing PAR1 G protein activation profiles before and after myofibroblast transformation (mean, n=5). Middle, BRET in human cardiac fibroblasts transduced with the indicated ONE-GO biosensors and treated (orange) or not (grey) with TGFβ. Bar graphs represent from left to right: maximal BRET responses normalized to Gαq ONE-GO, BRET signal in unstimulated cells, and raw luminescence counts indicative of biosensor expression. Mean ± S.E.M. (n=5). Right, immunoblots showing no difference in expression of the biosensor components (Gα, Nluc) or PAR1 upon TGFβ treatment (from n=3).
Some neuroinhibitory GPCRs discriminate across Gi/o isoforms in primary neurons
A widely held tenet based on studies of GPCRs exogenously expressed in cell lines is that those that couple to Gi/o proteins do not discriminate between members of the same family like Gαi and Gαo isoforms75. We investigated Gαi1 and GαoA activation using ONE-GO biosensors in mouse cortical neurons upon stimulation with full agonists for Gi/o coupled GPCRs, like α2-adrenergic, 5-HT1 serotonin, D2-like dopamine, and A1 adenosine receptors. While we detected robust Gαi1 responses in all conditions, GαoA responses were detected only upon stimulation with brimonidine (α2-adrenergic agonist) and dopamine (Fig.7B). The lack of GαoA response for serotonin and adenosine could not be attributed to poor health of the cell preparations because subsequent stimulation with dopamine in the same recordings led to responses (Fig.7B). It is also unlikely that the absence of response is due to lack of sensitivity, given that Gαi1 responses with serotonin and adenosine are even larger than with brimonidine and dopamine (Fig.7B), so one would have expected proportionally larger GαoA responses with the former pair of receptors compared to the latter. We confirmed that stimulation of A1 adenosine receptors exogenously expressed in HEK293T cells led to activation of both Gαi1 and GαoA, and that the relative activation of GαoA compared to Gαi1 is equivalent to that observed upon activation of the D2 dopamine receptor (Fig.7B, right box), which contrasts with the observations in neurons. We conclude that some endogenous Gi/o coupled GPCRs in primary cortical neurons can discriminate between Gαi and Gαo isoforms.
Myofibroblast transformation remodels the G protein selectivity profile of protease-activated receptor 1
To characterize changes in signaling behavior of endogenous GPCRs in the context of disease, we focused on PAR1 responses in a model of fibrotic transformation of cardiac fibroblasts. Conversion cardiac fibroblasts into myofibroblasts is a hallmark of heart failure upon fibrotic transformation88,89. Although PAR1 receptors contribute to fibrotic transformation in the heart and other tissues90–94, whether changes in their signaling behavior accompany the process of transformation and the specific features of these changes are unknown. To address this question, we measured activation of Gαq, Gαi3 and Gα13 with ONE-GO biosensors upon stimulation with a PAR1-specific agonist in a widely used model of fibrotic transformation (Fig.7C). This model consists of inducing the conversion of quiescent cardiac fibroblasts into myofibroblasts by TGFβ stimulation95,96, which we confirmed in our hands by detecting the upregulated expression of the fibrosis markers (Fig.7C, left box). Compared to quiescent cardiac fibroblasts, transformed myofibroblasts displayed a modest increase in Gαq activation, a marked increase in Gαi3 activation, and no difference in Gα13 activation (Fig.7C). These differences could not be attributed to differences in expression of the components of the biosensors or the PAR1 receptor, as assessed by immunoblotting and/or measurements of luminescence (Fig.7C). The lack of difference in basal BRET ratios also indicates that fibrotic transformation does not alter G protein activity under unstimulated conditions (Fig.7C). Overall, these results not only indicate that PAR1 signaling is altered upon fibrotic transformation, but that the changes consist of a remodeling of the relative strength of activation of different G protein types, rather than a global upregulation or downregulation of the receptor responses.
DISCUSSION
The main advances provided by this work are both technical and conceptual. We generated a set of tools to interrogate GPCR activity with high fidelity and ease even when the receptors are expressed endogenously in their native cellular environment and leveraged these tools to provide insights into GPCR biology and pharmacology. The virtually universal applicability of ONE-GO biosensors is supported not only by their demonstrated suitability for a broad set of G proteins and receptors, but also by their implementation across a wide range of cell types (primary cultures and immortalized lines), scalable assay formats (endpoint or kinetic), and gene delivery approaches (transient transfection/ transduction or stable genomic integration). An important concept put forth by our findings with ONE-GO biosensors is that GPCR signaling is hardwired in a context-dependent manner, e.g. in specific cell types, even at the level of the signal transduction event most proximal to ligand-mediated receptor activation (e.g., loading of GTP on G proteins). The phenomenon of context-dependent signaling hardwiring, also known as system bias20, has been a concern in GPCR drug discovery because it may underlie the lack of consistent translation of findings in vitro into the desired pharmacological properties in vivo13,20. For example, ligand-induced signaling bias currently identified for a given drug candidate in vitro using mainstay approaches with transfected cell lines might become negated by system bias when the receptor is expressed endogenously in the target tissue. This issue could be alleviated by implementing ONE-GO biosensors to test drug candidates in vitro in cellular systems more relevant to the intended final application, like a primary cell type endogenously expressing the GPCR of interest. A similar approach could also open an avenue for personalized medicine by investigating endogenous GPCR activity in cells differentiated from induced pluripotent stem cells of patients. Other conceptual advances reported here by the implementation of the biosensors include the elucidation of structure-function relationships in G protein activation, and the discovery of unknown features of the pharmacological or pharmacogenomic profiles of widely prescribed drugs (antipsychotics) or of natural ligands (SCFA).
While our findings of context-dependent signaling reveal that system bias is a prevalent feature of endogenous GPCRs, we can only speculate about the possible causes. For example, although there could be differences in expression of PAR1 across the 4 cell types in which it was investigated, this is unlikely to cause the differences observed because these are changes in the relative strength of activation of different G proteins. The possible influence of GPCR and G protein stoichiometry was more definitely ruled out in the experiments testing PAR1 G protein activation remodeling upon fibrotic transformation, in which we confirmed no changes in the abundance of the different signaling components. Similarly, changes in receptor and/or G protein levels cannot explain our observations in neurons. We envision at least three general factors that could shape GPCR responses in a context-dependent manner. One is post-translational modifications. For example, it has been reported that PAR1 glycosylation differentially affects signaling by distinct G proteins97. Another factor is compartmentalization. For example, GPCRs distributed to specific subcellular structures (e.g., synapses in neurons) or signaling complexes might have different accessibility to different G proteins25,98–101. A third factor is the presence of molecules that directly affect the activity of GPCRs or G proteins, which can differ across cell types and/or states. For example, GPCRs can be modulated by lipids like cholesterol or phosphatidylinositol 4,5-bisphosphate102–105, or by proteins like Receptor Activity-Modifying Proteins (RAMPs)106–108, and G proteins can be regulated by GAPs109, GDIs110, and GEFs111–114, among others115,116.
An advantage of ONE-GO biosensors is that they only require the expression of low amounts of exogenous Gα subunits, which bind to endogenous Gβγ to assemble functional G protein complexes that can be activated by GPCRs. On one hand, this prevents the loss of fidelity imposed by the use of specific combinations of exogenous Gβ and Gγ subunits, which alters the signaling profiles of GPCRs29,117. On the other hand, this minimizes the potential impact of gross overexpression on the signaling system under investigation, as demonstrated by the lack of measurable effects of ONE-GO biosensors on downstream signaling to modulate cAMP or kinases.
Limitations of the study
It is still a limitation over other biosensor systems like BERKY30 that an exogenous Gα needs to be expressed. It is therefore important for investigators to tailor the use of a given biosensor platform to their question of interest. In cases in which fidelity of the response is of utmost importance, BERKY biosensors are more suitable due to the complete absence of exogenous G proteins. However, there might be instances in which the larger dynamic range of ONE-GO biosensors compared to BERKY might justify a minimal compromise of fidelity due to expression of low amounts of Gα. Another limitation to keep in mind for ONE-GO biosensors is that the tagging of Gα could influence their behavior, although this is unlikely based on previous observations25,30,60. A general concern for any biosensor is that it is theoretically impossible to record an activity with them without affecting the signaling process in absolute terms. For example, probes used for Ca2+ imaging can also chelate the divalent cation118,119 or EKAR-type kinase activity biosensors can compete with the native kinase substrates120. What is critical to determine is whether the effect on the signaling process under investigation is insignificant in practical terms, as our results with ONE-GO biosensors confirm. Finally, it could be a limitation that there are no ONE-GO biosensors for some Gα subunits.
STAR Methods
RESOURCE AVAILABILITY
Lead Contact
Further information and requests for resources and reagents should be directed to and will be fulfilled by the lead contact, Mikel Garcia-Marcos (mgm1@bu.edu).
Materials Availability
All biosensor plasmids generated in this paper have been deposited to Addgene, including a kit for the 10 ONE-GO sensors under the CMV promoter (Addgene Kit #1000000224).
Data and Code Availability
Gel and membrane original scans from all Figures were deposited on Mendeley at http://dx.doi.org/10.17632/9tjcy8rg4t.1.
This paper does not report original code.
Any additional information required to reanalyze the data reported in this paper is available from the lead contact upon request.
EXPERIMENTAL MODEL AND STUDY PARTICIPANT DETAILS
Cell lines
HEK293T cells (ATCC cat# CRL-3216,) and HeLa cells (ATCC cat# CCL-2) were grown at 37°C, 5% CO2 in DMEM (Gibco cat# 11965–092) supplemented with 10% FCS (HyClone cat# SH30073.03), 100 U/ml penicillin, 100 μg/ml streptomycin, and 2 mM L-glutamine. SH-SY5Y cells (ATCC cat# CRL-2266) were grown at 37°C, 5% CO2 in DMEM supplemented with 15% heat-inactivated FCS, 100 U/ml penicillin, 100 μg/ml streptomycin, and 2 mM L-glutamine. SH-SY5Y stably expressing Gαi*-BERKY330 were grown in the same medium as naïve cells supplemented with 100 μg/ml hygromycin.
Institutional approval for mouse experiments
All animal procedures were approved by the Institutional Animal Care and Use Committee (IACUC) at Boston University Chobanian & Avedisian School of Medicine (PROTO202000018). C57BL/6N wild-type mice were from an in-house colony originally established with animals obtained from the Mutant Mouse Resource & Research Centers (MMRRC) at UC Davis.
Mouse primary cortical & striatal neuron culture
Neurons were isolated from neonatal mouse brains as previously described121 with modifications. Newborn mouse pups (P0) were euthanized by decapitation. Brains removed from the skull and placed in cold HBSS. The cerebrum was detached from other brain regions under a stereomicroscope by removal of the olfactory bulb and cerebellum, and meninges were peeled off with a tweezer. For cortical neurons, the cortex was dissected out with forceps by removing the hippocampus and the entire midbrain region. For striatal neurons, the hippocampus and the cortex were removed using forceps. The cortex or striatum was minced into approximately 1–2 mm pieces using a sterile razor blade, and digested with 0.05% (w:v) trypsin in HBSS for 10 min at 37°C. Trypsinized tissue was washed three times with HBSS to remove trypsin, and resuspended in DMEM supplemented with 10% FBS (Gibco cat# 2614–079), 100 U/ml penicillin, 100 μg/ml streptomycin (complete neuro DMEM) before passing through a sterile 40 μm cell strainer (Fisherbrand, cat# 22363547) to obtain a cell suspension. Approximately 75,000–100,000 cells were plated on 5 mm diameter coverslips (Word Precision Instruments cat# 502040; coated overnight with 0.1 mg/mL poly-L-lysine hydrobromide [Millipore Sigma cat# P9155], and washed 3x with HBSS) and placed in 96-well plates containing 200 μl of complete neuro DMEM for 4 h, before replacing one half of the volume of medium in each well with Neurobasal medium (GIBCO, cat# 21103049) with B-27 supplement (GIBCO, cat# 17504001) and 1x Glutamax-I (GIBCO, cat# 35050061) (complete neural medium). Approximately 48 h later (day in vitro 3, DIV3), half of the volume of medium in each well was replaced with complete neural media supplemented with 5 μM AraC to achieve a final concentration of 2.5 μM in the well. Beginning DIV5, half of the volume of medium in each well was replaced by fresh complete neural medium every other day.
Mouse primary cortical astroglial cell culture
Astrocyte-rich glial cultures were prepared from the cortex of neonatal mice using a protocol similar to that used for cortical neuron cultures except for the following differences. The initial tissue was obtained from neonatal mouse pups (P0–3)121, and after straining trypsin-digested tissues, the cell suspension was used to seed 1.5 million cells in each well of a poly-L-lysine coated 6-well plate in complete neuro DMEM. Media was changed the following day, and cells were subsequently split at a 1:2 ratio every 2–3 days by trypsinization followed by centrifugation at 180 × g for 5 minutes before resuspending and reseeding in complete neuro DMEM. Cells were cultured for not more than 5 passages.
Mouse primary lung fibroblast cell culture
Lung fibroblasts were isolated from 8–16 week old mice as previously described122 with modifications. Mice were euthanized by CO2 inhalation followed by cervical dislocation. An incision was made with scissors to open the peritoneal cavity and the skin was removed to expose the cardiothoracic cavity. The sternum was cut open and the ribcage was held open using hemostat forceps. An incision was made in the liver, and DPBS containing calcium and magnesium (Corning, cat# 21–030-CV) was slowly injected into the right ventricle of the heart using a 25-gauge needle to perfuse the lungs. Both lungs and the heart were then dissected out and placed in cold DPBS with calcium and magnesium. The heart and any remaining parts of the trachea or other connective tissue were removed, and the outside of the lungs was rinsed three times in DPBS containing calcium and magnesium. Lungs from 4 mice were minced into ~1 mm pieces using curved scissors and digested with 1 mg/ml collagenase type 1 (Worthington, cat# LS004194) and 1X dispase (Corning, cat# 354235) in 12 ml of DPBS containing calcium and magnesium for 45 min on a shaker at 37°C. The digested tissue was passed through a 40 μm cell strainer (Fisherbrand, cat# 22363547) to obtain a cell suspension. Twenty ml of DMEM supplemented with 15% FBS, 100 U/ml penicillin, 100 μg/ml streptomycin, and 2 mM L-glutamine (complete fibroblast DMEM) were added to neutralize the digestion cocktail and the tube was spun at 300 × g for 5 min. The pellet was resuspended in 20 ml of complete fibroblast DMEM and cells corresponding to tissue from 4 mice were seeded on two 10 cm tissue culture plates. Cells were washed three times with PBS the following day and fresh complete fibroblast DMEM was added. Two days later, cells were split at a 1:3 ratio by trypsinization followed by centrifugation at 250 × g for 4 minutes before resuspending and reseeding in complete fibroblast media on a total of six 10 cm tissue culture plates. Three days later, all cells were harvested by trypsinization and split in 7 1.2 ml cryogenic vials (Fisherbrand, cat# 1050025) in complete fibroblast media supplemented with 20% FBS and 10% DMSO, and frozen in liquid nitrogen as passage 1 cells for further use. For experiments, these passage 1 cells were quickly thawed in a 30°C water bath, and seeded in a 10 cm culture dish in 15 ml of complete fibroblast media. Media was replaced the day after and cells cultured by splitting as described above for not more than 4 passages.
Human primary cardiac fibroblasts
Human cardiac fibroblasts were obtained from ScienCell (cat# 6340) and cultured as previously described123. After thawing quickly in a 30°C water bath, ~350 thousand cells were seeded in each well of a 6-well plate precoated overnight with 0.4% Matrigel (Corning, cat# 356231) in DMEM, and cultured in fibroblast growth medium 3 (Promocell, cat# C-23025) supplemented with 10% growth medium supplement (Promocell, C-39345), 5 μM SB431542 (Selleckchem, cat# S1067), 100 U/ml penicillin, 100 μg/ml streptomycin, and 2 mM L-glutamine. Every two days, cells were split at a 1:2 ratio by incubation in Accutase (Sigma cat# A6964) at 37°C for 3 min to detach cells, followed by centrifugation at 200 × g for 3 min before resuspending and reseeding in fibroblast growth medium 3 supplemented with 10% growth medium supplement, 5 μM SB431542, 100 U/ml penicillin, 100 μg/ml streptomycin, and 2 mM L-glutamine. Cells were typically used within 5 passages, and never cultured for more than 9 passages.
Human primary umbilical vein endothelial cells
Human umbilical vein endothelial cells (HUVECs) were acquired from Lonza (cat# CC-2519) and cultured in EBM Basal Medium (Lonza, cat# CC-3121) supplemented with the EGM Singlequots Supplement Pack (Lonza, cat# CC-4133) following the supplier’s recommendations. After thawing quickly in a 30°C water bath, ~600 thousand cells were seeded on a 10 cm tissue culture dish. Cells were split at a 1:2 ratio every 2 days by trypsinization (Lonza cat# CC-5012), followed by centrifugation at 200 × g for 3 min before resuspending and reseeding in EBM Basal Medium supplemented with the EGM Singlequots Supplement Pack. Cells were cultured for not more than 8 passages.
Human primary bronchial smooth muscle cells
Human bronchial smooth muscle cells were obtained from Promocell (cat# C-12561) and cultured in SMC Basal medium 2 (Promocell, cat# C-22262) supplemented with Growth Medium 2 supplement Mix (Promocell, cat# 39267), 100 U/ml penicillin, 100 μg/ml streptomycin, and 2 mM L-glutamine following the supplier’s recommendations. After thawing quickly in a 30°C water bath, ~200 thousand cells were seeded in each well of a 6 well plate. Cells were split at a 1:2 ratio every 3 days by trypsinization (Promocell cat# C41210), followed by centrifugation at 220 × g for 3 min before resuspending and reseeding in SMC Basal medium 2 supplemented with Growth Medium 2 supplement Mix, 100 U/ml penicillin, 100 μg/ml streptomycin, and 2 mM L-glutamine. Cells were cultured for not more than 5 passages.
Method Details
Plasmids
To generate plasmids encoding putative G protein-binding peptides fused to GST (amino acid sequences presented in Fig. 1A), complementary primers encoding the peptides and overhanding ends complementary to EcoRI and HindIII were annealed and inserted between the EcoRI and HindIII site of the previously described pGEX-KG-KB1753 plasmid124 to replace the existing KB1753 sequence.
Plasmids encoding KB1691-Nluc (pcDNA3.1-mas-KB1691-Nluc) and KB2123-Nluc (pcDNA3.1-mas-KB2123-Nluc) with a membrane anchoring sequence (mas) were generated by replacing the GRK3ct sequence of pcDNA3.1-mas-GRK3ct-NLuc27 by digestion with HindIII/BamHI and subsequent insertion of the KB1691 sequence (SRELAWGISEWLEEWG) or the KB2123 sequence (SSSELADYFGWDGWPG) flanked with a Gly-Gly linker on each end. Plasmids encoding KB1753-Nluc (pcDNA3.1-mas-KB1753-Nluc), GRK2RH-Nluc (pcDNA3.1-mas-GRK2RH-Nluc), and PRGRH-Nluc (pcDNA3.1-mas-PRGRH-Nluc) have been described previously30. The plasmid encoding KB1691-mKate2 (pcDNA3.1-mas-KB1691-mKate2) was generated by replacing the Nluc sequence of pcDNA3.1-mas-KB1691-Nluc by digestion with BamHI/XhoI and subsequent insertion by Gibson assembly of the sequence encoding for mKate2. The Plasmid encoding KB1753-mKate2 (pcDNA3.1-mas-KB1753-mKate2) was generated by replacing the KB1691 sequence of pcDNA3.1-mas-KB1691-mKate2 by digestion with HindIII/BamHI and subsequent insertion by Gibson of the KB1753 sequence. Plasmids encoding human Gαs-67V (pcDNA3.1-Gαs-67V), Gαs-99V (pcDNA3.1-Gαs-99V), and Gαs-154V (pcDNA3.1-Gαs-154V) have previously been described38. Plasmids encoding rat Gαi3-YFP (pcDNA3.1-Gαi3-YFP)125, mouse Gαq-V (pcDNA3.1-Gαq-V)101, and human Gα13-YFP (pcDNA3.1- Gα13-YFP)30, all of which are internally tagged with the fluorescent protein at the αb-αc loop of the G protein, have been previously described. The plasmids encoding Gαs/Gαi chimeras were generated using Gibson assembly by swapping either CT-s, αNβ1-s, or both to CT-i and αNβ1-i on human Gαs-99V, and swapping either CT-i, αNβ1-i, or both to CT-s and αNβ1-s on rat Gαi3-YFP. The plasmid encoding FLAG-Ric-8B (pcDNA3.1-FLAG-Ric-8B) was a gift from Dr. Kirill Martemyanov and has been described previously126. Plasmids encoding untagged Gβ1 and Gγ2 (pcDNA3.1-Gβ1, pcDNA3.1-Gγ2) have been described previously26. The plasmid encoding Glosensor 22F was acquired from Promega (cat# E2301). The plasmid encoding cytosolic KB1691-Nluc (pcDNA3.1-cyto-KB1691-Nluc) was generated by mutation of the glycine in position 2 of pcDNA3.1-mas-KB1691-Nluc to alanine, which removes the myristoylation site of the membrane anchoring sequence. The plasmid encoding for Venus fused to the membrane anchoring sequence of kRas (pVenus-C1-Venus-K-Ras) was a gift from Dr. Nevin Lambert41. The pSPAX2 and pMD2.G plasmids for lentiviral packaging were acquired from Addgene (#12260 and #12259).
To generate plasmids encoding ONE-GO biosensors of Gα-GTP species under a CMV promoter, sequences of Gα proteins internally tagged with a YFP at a loop of the all-helical domain along with sequences from an IRES and an Nluc-fused detector module were inserted between the BamHI and MluI sites of vector pLVX-IRES-Hyg by Gibson assembly. The species of the G proteins and amino acid (aa) position of YFP insertion were as follows: Gαs (human, aa99), Gαi1 (rat, aa121), Gαi2 (rat, aa114), Gαi3 (rat, aa114), GαoA (rat, aa119), GαoB (rat, aa119), Gαz (rat, 119), Gαq (mouse, aa124), Gα12 (human, aa140), Gα13 (human, aa131). The IRES used for the ONE-GO biosensors (denoted IRES* in Fig. S3B) has previously been described57, which includes a spacer sequence before the post-IRES start codon and results in diminished expression relative to the coding sequence right downstream of the promoter57,58. For Gαs ONE-GO, a T2A-Ric-8B sequence was inserted after KB1691-Nluc (without a stop codon). To generate SV40-Gαi3 ONE-GO and SV40-Gαs ONE-GO constructs, a previously described plasmid (pLVX-mVenus-MYC-DAPLE, based on the pLVX-IRES-Hyg backbone)127 was digested with ClaI and SpeI to remove the CMV promoter and insert an SV40 promoter in its place to create pLVX-SV40-mVenus-MYC-DAPLE. The mVenus-MYC-DAPLE cassette between the BamHI and MluI sites was replaced by the same components of the Gαi3 ONE-GO and Gαs ONE-GO constructs described above. All ONE-GO biosensor sequences are provided in Supplemental Item 1 [SI 1]. To generate plasmids encoding ONE-GO biosensors of Gα-GTP species under the neuron-specific promoter of human Synapsin (hSyn), the CMV promoter was removed from the plasmids described above by digestion with ClaI and SpeI, followed by insertion of the hSyn promoter followed by a Xho I site in the same sites by Gibson assembly. The sequence of these plasmids (pLVX-hSyn-Gαi1-YFP-IRES*-KB1753-Nluc, pLVX-hSyn-GαoA-YFP-IRES*-KB1753-Nluc, and pLVX-hSyn-Gαq-V-IRES*-GRK2RH-Nluc) are provided in Supplemental Item 1 [SI 1].
To generate constructs encoding Gβγ ONE-GO biosensors for different Gα subunits, we first generated a parental plasmid without the Gα component (pLVX-CMV-IRESWT-GRK3ct-Nluc-T2A-Gβ1-T2A-Gγ2-V). For this, the vector pLVX-IRES-Hygro was digested with NotI and MluI, and sequences for IRESWT, GRK3ct-Nluc, and T2A-Gβ1-T2A-Gγ2-V were inserted by Gibson assembly. In contrast to IRES*, IRESWT does not contain a spacer sequence before the post-IRES start codon and results in comparable expression relative to the coding sequence right downstream of the promoter. To generate plasmids encoding Gαs/Gβγ ONE-GO and Gαi3/Gβγ ONE-GO biosensors, human Gαs or rat Gαi3 were inserted in the NotI site of the parental plasmid described above. In the case of Gαs, a BamHI site was included right before the start codon. Full sequences of parental Gβγ ONE-GO, Gαs/Gβγ ONE-GO and Gαi3/Gβγ ONE-GO biosensor are provided in Supplemental Item 1 [SI 1].
Plasmids encoding GPCRs were obtained from various sources (as indicated Key Resources Table) or subcloned into pcDNA3.1 from the PRESTO-Tango GPCR kit (Addgene Kit #1000000068) as described next. Briefly, GPCR sequences were amplified using primers that preserved the N-terminal FLAG tag present in the Tango library but introduced a stop codon after the end of the sequence of the native GPCR (i.e., it did not include the V2-tail, TEV site and tTA transcription factor present in the Tango constructs). The amplicons were inserted between the NotI and Apa I sites of pcDNA3.1 by Gibson assembly. The FLAG tag was not included for the following mGluR-encoding plasmids generated from the PRESTO-Tango library: pcDNA3.1(+)-GRM1, pcDNA3.1(+)-GRM2, pcDNA3.1(+)-GRM5, pcDNA3.1(+)-GRM7, and pcDNA3.1(+)-GRM8.
Key Resources Table
| REAGENT or RESOURCE | SOURCE | IDENTIFIER |
|---|---|---|
| Antibodies | ||
| Mouse monoclonal anti His | Millipore Sigma | Cat #H1029 |
| Rabbit monoclonal anti β-Actin | LI-COR | Cat #926–42210 |
| Mouse monoclonal anti GFP (JL-8) | Clontech | Cat #632380 |
| Mouse monoclonal anti FLAG (M2) | Millipore Sigma | Cat #F1804 |
| Rabbit polyclonal anti Gαs (C18) | SCBT | Cat #sc-383 |
| Mouse monoclonal anti α-tubulin | Millipore Sigma | Cat #T6074 |
| Mouse monoclonal anti Gβ (H-1) | SCBT | Cat #sc-166123 |
| Mouse monoclonal anti PAR-1 (ATAP2) | Millipore Sigma | Cat #MABF244 |
| Rabbit polyclonal anti Gαi3 | Aviva Systems Biology | Cat #OAAB19207 |
| Rabbit polyclonal anti Gαi3 | Millipore Sigma | Cat #06–270 |
| Rabbit polyclonal anti Nanoluciferase | Promega42 | N/A |
| Mouse monoclonal anti Nanoluciferase | Promega | Cat #N7000A |
| Mouse monoclonal anti Nanoluciferase | R&D Systems | Cat #MAB10026 |
| Mouse monoclonal anti RFP | Invitrogen | Cat #MA5–15257 |
| Rabbit monoclonal anti pERK1/2 (T202/Y204) | Cell Signaling | Cat #4370 |
| Rabbit monoclonal anti ERK1/2 | Cell Signaling | Cat #4695 |
| Goat anti rabbit Alexa Fluor 680 | Invitrogen | Cat #A-21077 |
| Goat anti mouse Alexa Fluor 680 | Invitrogen | Cat #A21058 |
| Goat anti mouse IRDye 800 | LI-COR | Cat #926–32210 |
| Goat anti rabbit DyLight 800 | Thermo | Cat #35571 |
| Bacterial and virus strains | ||
| NEB 5-alpha competent E. coli | NEB | Cat #C2987I |
| Chemicals, peptides, and recombinant proteins | ||
| Isoproterenol | Alfa Aesar | Cat #J61788 |
| Alprenolol | Tocris Bioscience | Cat #2806 |
| Brimonidine | Ark Pharm | Cat #AK-35795 |
| Yohimbine | Alfa Aesar | Cat #J60185 |
| Carbachol | Acros Organics | Cat #108240050 |
| TRAP-6 | Anaspec | Cat #AS-24190 |
| Thrombin | Prolytix | Cat #HCT-0020 |
| Vorapaxar | MCE | Cat #HY-10119 |
| Dopamine | Alfa Aesar | Cat #A11136 |
| Haloperidol | Alfa Aesar | Cat #J61688 |
| PGE2 | TCI | Cat #P1884 |
| Serotonin | Alfa Aesar | Cat #B21263 |
| Adenosine | Acros Organics | Cat #164045000 |
| CGS 15943 | Sigma | Cat #C199 |
| GS 6201 | Cayman Chemical | Cat #33333 |
| KW 3902 | Cayman Chemical | Cat #11940 |
| DAMGO | BACHEM | Cat #4007829 |
| Dynorphin A | Cayman Chemical | Cat #18169 |
| Met-Enkephalin | Cayman Chemical | Cat #23284 |
| Leu-Enkephalin | Cayman Chemical | Cat #23283 |
| β-endorphin | Cayman Chemical | Cat #24955 |
| Endomorphin 1 | Cayman Chemical | Cat #23280 |
| Endomorphin 2 | Cayman Chemical | Cat #23281 |
| Naloxone | Alfa Aesar | Cat #J60013 |
| Adrenaline | Alfa Aesar | Cat #L04911 |
| Histamine | Alfa Aesar | Cat #J61727 |
| Anandamide | ENZO life sciences | Cat #BML-FA017 |
| Endothelin-1 | Millipore Sigma | Cat #05–23–3800 |
| UDP | MP Biomedicals | Cat #ICN101205 |
| UTP | Fisher | Cat #J63427.MC |
| ADP | Fisher | Cat #AAJ6449706 |
| ATP | Fisher | Cat #AAL1452206 |
| L-Glutamate | Acros Organics | Cat #156210010 |
| Somatostatin-14 | Fisher | Cat #AAJ66168LB0 |
| DynorphinA | Cayman Chemical | Cat #18169 |
| Melatonin | Fisher | Cat #AC125360050 |
| GABA | Tocris Bioscience | Cat #0344 |
| CGP-54626 | Tocris Bioscience | Cat #1088 |
| Acetic acid | Acros Organics | Cat #212662500 |
| Propionic acid | Acros Organics | Cat #149010250 |
| Butyric acid | Acros Organics | Cat #263190250 |
| Brexipiprazole | Cayman Chemical | Cat #22906 |
| Iloperidone | Cayman Chemical | Cat #22957 |
| Cariprazine | Cayman Chemical | Cat #31446 |
| Baclofen | Tocris Bioscience | Cat #0796 |
| 3,5-DHPG | Tocris Bioscience | Cat #0805 |
| Phenylephrine | Tocris Bioscience | Cat #2838 |
| TFLLR | Cayman Chemical | Cat #27548 |
| Pertussis toxin | List Biological Labs | Cat #179 A |
| YM-254890 | FUJIFILM Wako Pure Chemical Corp. | Cat #257–00631 |
| TGFβ1 | R&D Systems | Cat #7666-MB |
| Poly-L-Lysine hydrobromide | Millipore Sigma | Cat #P9155 |
| Polybrene | Tocris Bioscience | Cat #7711/10 |
| Critical commercial assays | ||
| Nano-Glo Luciferase Assay System | Promega | Cat #N1120 |
| LunaScript RT SuperMix Kit | NEB | Cat #E3010 |
| Fast SYBR Green Master Mix | Applied Biosystems | Cat #4385612 |
| QuikChange II Site-Directed Mutagenesis Kit | Agilent | Cat # 200523 |
| Deposited data | ||
| ONE-GO Biosensors Kit and related plasmids (including full plasmid sequences) | Addgene | Kit #1000000224 |
| Original images from blotting | This paper | Mendeley: http://dx.doi.org/10.17632/9tjcy8rg4t.1 |
| Experimental models: Cell lines | ||
| HEK293T | ATCC | Cat #CRL-3216 |
| HeLa | ATCC | Cat #CCL-2 |
| SH-SY5Y | ATCC | Cat #CRL-2266 |
| Lenti-X 293T | Takara Bio | Cat #632180 |
| Experimental models: Organisms/strains | ||
| Mouse: C57BL/6N | MMRRC | N/A |
| Oligonucleotides | ||
| F-h18S (CGGCGACGACCCATTCGAAC) | This paper | N/A |
| R-h18S (GAATCGAACCCTGATTCCCCGTC) | This paper | N/A |
| F-hACTA2 (AAAAGACAGCTACGTGGGTGA) | This paper | N/A |
| R-hACTA2 (GCCATGTTCTATCGGGTACTTC) | This paper | N/A |
| F-hCOL1A (ACGAAGACATCCCACCAATCACCT) | This paper | N/A |
| R-hCOL1A (AGATCACGTCATCGCACAACACCT) | This paper | N/A |
| F-hFN1 (GGCAACGTGTTACGATGAT) | This paper | N/A |
| R-hFN1 (CGGGAATCTTCTCTGTCAG) | This paper | N/A |
| Recombinant DNA | ||
| pcDNA3.1-mas-KB1691-Nluc | This paper | N/A |
| pcDNA3.1-mas-KB2123-Nluc | This paper | N/A |
| pcDNA3.1-mas-GRK3ct-NLuc | 27 | N/A |
| pcDNA3.1-mas-KB1753-Nluc | 30 | N/A |
| pcDNA3.1-mas-GRK2RH-Nluc | 30 | N/A |
| pcDNA3.1-mas-PRGRH-Nluc | 30 | N/A |
| pcDNA3.1-Gαs-67V | 38 | N/A |
| pcDNA3.1-Gαs-99V | 38 | N/A |
| pcDNA3.1-Gαs-154V | 38 | N/A |
| pcDNA3.1-mas-KB1691-mKate2 | This paper | N/A |
| pcDNA3.1-mas-KB1753-mKate2 | This paper | N/A |
| pcDNA3.1-Gαs-99V R201C | This paper | N/A |
| pcDNA3.1-Gαs-99V Q227L | This paper | N/A |
| pcDNA3.1-Gαi3-YFP | 121 | N/A |
| pcDNA3.1-Gαq-V | 101 | N/A |
| pcDNA3.1-Gα13-YFP | 30 | N/A |
| pcDNA3.1-Gαs-99V CT-i | This paper | N/A |
| pcDNA3.1-Gαs-99V αNβ1-i | This paper | N/A |
| pcDNA3.1-Gαs-99V CT-i/αNβ1-i | This paper | N/A |
| pcDNA3.1-Gαi3-YFP CT-s | This paper | N/A |
| pcDNA3.1-Gαi3-YFP αNβ1-s | This paper | N/A |
| pcDNA3.1-Gαi3-YFP CT-s/αNβ1-s | This paper | N/A |
| pcDNA3.1-FLAG-Ric-8B | 122 | N/A |
| pcDNA3.1-Gβi | 26 | N/A |
| pcDNA3.1-Gγ2 | 26 | N/A |
| pcDNA3.1-Gβ1-V(155–239) | 26 | N/A |
| pcDNA3.1-Gγ2-V(1–155) | 26 | N/A |
| Glosensor 22F | Promega | Cat #E2301 |
| pcDNA3.1-cyto-KB1691-Nluc | This paper | N/A |
| pVenus-C1-Venus-K-Ras | 41 | N/A |
| pLVX-CMV-Gαs-99V-IRES*-KB1691-Nluc-T2A-Ric-8B | This paper | N/A |
| pLVX-CMV-Gαi1-YFP-IRES*-KB1753-Nluc | This paper | N/A |
| pLVX-CMV-Gαi2-YFP-IRES*-KB1753-Nluc | This paper | N/A |
| pLVX-CMV-Gαi3-YFP-IRES*-KB1753-Nluc | This paper | N/A |
| pLVX-CMV-GαoA-YFP-IRES*-KB1753-Nluc | This paper | N/A |
| pLVX-CMV-GαoB-YFP-IRES*-KB1753-Nluc | This paper | N/A |
| pLVX-CMV-Gαz-YFP-IRES*-KB1753-Nluc | This paper | N/A |
| pLVX-CMV-Gαq-V-IRES*-GRK2RH-Nluc | This paper | N/A |
| pLVX-CMV-Gα12-YFP-IRES*-PRGRH-Nluc | This paper | N/A |
| pLVX-CMV-Gα13-V-IRES*-PRGRH-Nluc | This paper | N/A |
| pLVX-SV40-Gαs-99V-IRES*-KB1691-Nluc-T2A-Ric-8B | This paper | N/A |
| pLVX-SV40-Gαi3-YFP-IRES*-KB1753-Nluc | This paper | N/A |
| pLVX-CMV-IR ESWT-GRK3ct-Nluc-T2A-Gβ1-T2A-Gγ2-V | This paper | N/A |
| pLVX-CMV-Gαs-IRESWT-GRK3ct-Nluc-T2A-Gβ1-T2A-Gγ2-V | This paper | N/A |
| pLVX-CMV-Gαi3-IRESWT-GRK3ct-Nluc-T2A-Gβ1-T2A-Gγ2-V | This paper | N/A |
| pLVX-hSyn-Gαi1-YFP-IRES*-KB1753-Nluc | This paper | N/A |
| pLVX-hSyn-GαoA-YFP-IRES*-KB1753-Nluc | This paper | N/A |
| pLVX-hSyn-Gαq-V-IRES*-GRK2RH-Nluc | This paper | N/A |
| pLVX-CMV-Gαi3 G183S-YFP-IRES*-KB1753-Nluc | This paper | N/A |
| pSPAX2 | Addgene | #12260 |
| pMD2.G | Addgene | #12259 |
| pcDNA3.1-FLAG-HTR1A (human) | 123 | N/A |
| pcDNA3.1(+)-HTR1B (human) | This paper | N/A |
| pcDNA3.1(+)-HTR1D (human) | This paper | N/A |
| pcDNA3.1(+)-HTR1E (human) | This paper | N/A |
| pcDNA3.1(+)-HTR1F (human) | This paper | N/A |
| pcDNA3.1-FLAG-HTR2A (human) | 123 | N/A |
| pcDNA3.1(+)-HTR2B (human) | This paper | N/A |
| pcDNA3.1(+)-HTR2C (human) | This paper | N/A |
| pcDNA3.1(+)-HTR4 (human) | This paper | N/A |
| pcDNA3.1(+)-HTR5 (human) | This paper | N/A |
| pcDNA3.1(+)-HTR6 (human) | This paper | N/A |
| pcDNA3.1(+)-HTR7A (human) | cDNA Resource Center | Cat #HTR07A0000 |
| pcDNA3.1(+)-DRD1 (human) | cDNA Resource Center | Cat #DRD0100000 |
| pcDNA3.1(+)-FLAG-D2DR (human) | 124 | N/A |
| pcDNA3.1-FLAG-D3R (human) | 125 | N/A |
| pcDNA3.1-FLAG-D4R (human) | 126 | N/A |
| pcDNA3.1-FLAG-D5R (human) | 127 | N/A |
| pcDNA3.1–3xHA-ADRA1A (human) | cDNA Resource Center | Cat #AR0A1ATN00 |
| pcDNA3.1(+)-ADRA1B (human) | This paper | N/A |
| pcDNA3.1(+)-ADRA1D (human) | This paper | N/A |
| pcDNA3-α2A/D-AR (rat) | 128,129 | N/A |
| pcDNA3.1(+)-ADRA2B (human) | This paper | N/A |
| pcDNA3.1(+)-ADRA2C (human) | This paper | N/A |
| pcDNA3-Flag-beta-1-adrenergic receptor (human) | Addgene130 | Cat #14698 |
| pcDNA3-Flag-beta-2-adrenergic receptor (human) | Addgene130 | Cat #14697 |
| pcDNA3.1(+)-ADRB3 (human) | This paper | N/A |
| pcDNA3.1(+)-H1R (human) | This paper | N/A |
| pcDNA3.1(+)-H2R (human) | This paper | N/A |
| pcDNA3.1(+)-H3R (human) | This paper | N/A |
| pcDNA3.1(+)-H4R (human) | This paper | N/A |
| pcDNA3.1(+)-CB1 (human) | This paper | N/A |
| pcDNA3.1(+)-CB2 (human) | This paper | N/A |
| pBJ-FLAG-hPAR1 (human) | Addgene131 | Cat #53226 |
| pcMIM-ETAR (human) | 132 | N/A |
| pcDNA3.1(+)-PTGER2 (human) | cDNA Resource Center | Cat #PER0200000 |
| pcDNA3.1(+)-ADORA1 (human) | cDNA Resource Center | Cat #ADRA100000 |
| pcDNA3.1(+)-ADORA2A (human) | cDNA Resource Center | Cat #ADRA2ATN00 |
| pcDNA3.1(+)-ADORA2B (human) | This paper | N/A |
| pcDNA3.1(+)-A3R (human) | This paper | N/A |
| pcDNA3.1(+)-P2Y1 (human) | This paper | N/A |
| pcDNA3.1(+)-P2Y2 (human) | This paper | N/A |
| pcDNA3.1(+)-P2Y4 (human) | This paper | N/A |
| pcDNA3.1(+)-P2Y6 (human) | This paper | N/A |
| pcDNA3.1(+)-P2Y11 (human) | This paper | N/A |
| pcDNA3.1(+)-P2Y12 (human) | This paper | N/A |
| pcDNA3.1(+)-P2Y13 (human) | This paper | N/A |
| pcDNA3.1(+)-P2Y14 (human) | This paper | N/A |
| pcDNA3.1(+)-GRM1 (human) | This paper | N/A |
| pcDNA3.1(+)-GRM2 (human) | This paper | N/A |
| pRK5-GRM3 (rat) | 133 (Gifted from J. Levitz) | N/A |
| pcDNA3.1(+)-GRM4 (human) | cDNA Resource Center (Gifted from J. Wang) | Cat #GRM4000000 |
| pcDNA3.1(+)-GRM5 (human) | This paper | N/A |
| pcDNA3.1(+)-GRM6 (human) | cDNA Resource Center | Cat #GRM6000000 |
| pcDNA3.1(+)-GRM7 (human) | This paper | N/A |
| pcDNA3.1(+)-GRM8 (human) | This paper | N/A |
| pcDNA3.1(+)-SSTR1 (human) | This paper | N/A |
| pcDNA3.1(+)-SSTR2 (human) | This paper | N/A |
| pcDNA3.1(+)-SSTR3 (human) | This paper | N/A |
| pcDNA3.1(+)-SSTR4 (human) | This paper | N/A |
| pcDNA3.1(+)-SSTR5 (human) | This paper | N/A |
| Myc-M1R (human) | 127 | N/A |
| pcDNA3.1(+)-CHRM2 (human) | This paper | N/A |
| pcDNA3.1(+)-3xHA-M3R (human) | cDNA Resource Center | Cat #MAR030TN00 |
| pcDNA3.1(+)-2xHA-hM4R (human) | cDNA Resource Center | Cat #MAR040TN00 |
| pcDNA3.1(+)-CHRM5 (human) | This paper | N/A |
| pcDNA3.1-HA-mMOR (mouse) | 134 | N/A |
| pcDNA3.1(+)-DOR (human) | cDNA Resource Center | Cat #OPRD100000 |
| pcDNA3.1(+)-KOR (human) | cDNA Resource Center | Cat #OPRK100000 |
| pcDNA3.1(+)-MT1 (human) | This paper | N/A |
| pcDNA3.1(+)-MT2 (human) | This paper | N/A |
| pcDNA3.1(+)-GABAb R1a (rat) | 135 | N/A |
| pcDNA3.1(+)-GABAb R1b (rat) | 135 | N/A |
| pcDNA3.1(+)-GABAb R2 (rat) | 135 | N/A |
| pcDNA3.1(+)-HCA2 (human) | This paper | N/A |
| pcDNA3.1(+)-FFAR2 (human) | This paper | N/A |
| pcDNA3.1(+)-FFAR3 (human) | This paper | N/A |
| pcDNA3.1(+)-PAR1(Nterm)-ADGRL3 (mouse) | 66 | N/A |
| Software and algorithms | ||
| GraphPad Prism | GraphPad Software | https://www.graphpad.com/scientific-software/prism/ |
| Adobe Photoshop | Adobe | https://www.adobe.com/ |
| Adobe Illustrator | Adobe | https://www.adobe.com/ |
| ICM | Molsoft LLC | http://www.molsoft.com/ |
| Other | ||
| 5 mm diameter glass coverslips | Word Precision Instruments | Cat #502040 |
All point mutations were generated using QuikChange II following the manufacturer’s instructions (Agilent, 200523).
Pulldown assays
Putative G protein-binding peptides fused to GST were expressed in BL21(DE3) E. coli transformed with the corresponding plasmids by overnight induction at 23°C with 1 mM isopropyl β-D-1-thio-galactopyranoside (IPTG). IPTG was added when the OD600 reached ~0.8. Bacteria pelleted from 50 ml of culture were resuspended at 4°C in 10.5 ml of lysis buffer (50 mM NaH2PO4, pH 7.4, 300 mM NaCl, 10 mM imidazole supplemented with a protease inhibitor mixture of 1 μM leupeptin, 2.5 μM pepstatin, 0.2 μM aprotinin, and 1 mM phenylmethylsulfonyl fluoride). The cell suspension was supplemented with 1% (v/v) Triton X-100 and sonicated (3 pulses of 20 s separated by 30 s intervals for cooling). The resulting lysate was cleared by centrifugation at 4,300 × g for 40 min at 4°C. The supernatant for each construct was collected and 2 ml aliquots were frozen until use.
For pulldown assays, an aliquot of lysate containing ~25–50 μg of each GST-fused peptide was incubated with ~20 μl of glutathione-agarose beads (Thermo, 16100) at 4°C for 90 min. Beads were washed twice with lysis buffer and resuspended in 250 μl of binding buffer (50 mM Tris-HCl, 100 mM NaCl, 0.4% NP-40, 10 mM MgCl2, 5 mM EDTA, 1 mM DTT) supplemented with 30 μM GDP, 30 μM AlCl3, and 10 mM NaF. His-tagged Gαs or Gαo, purified as described previously128,129, was diluted in binding buffer supplemented with 30 μM GDP, 30 μM AlCl3, and 10 mM NaF to obtain 2 μg of protein in 50 μl, and incubated at 30°C for 60 min. GDP-AlF4−-loaded G proteins were centrifuged at 14,000 × g for 3 min before addition to tubes containing the GST-fused peptides immobilized on glutathione-agarose beads. Tubes were incubated for 4 h at 4°C with constant rotation. Beads were washed three times with 1 ml of wash buffer (4.3 mM Na2HPO4, 1.4 mM KH2PO4, pH 7.4, 137 mM NaCl, 2.7 mM KCl, 0.1% (v/v) Tween 20, 10 mM MgCl2, 5 mM EDTA, 1 mM DTT) supplemented with 30 μM GDP, 30 μM AlCl3, and 10 mM NaF, and resin-bound proteins were eluted with Laemmli sample buffer by incubation at 37°C for 10 min. Proteins were separated by SDS-PAGE and immunoblotted with antibodies as indicated under “Protein Electrophoresis and Immunoblotting.”
Bioluminescence Resonance Energy Transfer (BRET) measurements in HEK293T cells
HEK293T cells were seeded on 6-well plates (~400,000 cells/well) coated with 0.1% gelatin (Sigma-Aldrich cat# G1393), and transfected ~24 h later using the calcium phosphate method. For experiments with bi-molecular biosensors consisting of YFP-tagged Gα proteins and Nluc-fused detector modules (Fig. 1, 2, 3; Fig. S1, S2, S3), cells were transfected in the combinations indicated in the figures with the following plasmids (amount per well indicated in parenthesis): Gαs-67V (1 μg), Gαs-99V (1 μg), Gαs-154V (1 μg), Gαi3-YFP (1 μg), Gαq-V (1 μg) or Gα13-YFP (1 μg), KB1691-Nluc (0.05 μg), KB2123-Nluc (0.05 μg), KB1753-Nluc (0.05 μg), GRK2RH-Nluc (0.05 μg), PRGRH-Nluc (0.05 μg), Ric-8B (0.1 μg), Gβ1 (0.2 μg), Gγ2 (0.2 μg), and different GPCRs (0.2 μg). For the bystander Gαs biosensor system (Fig. S1D), cells were transfected with the following plasmids (amount per well indicated in parenthesis): Gαs (0.5 μg), cytosolic KB1691-Nluc (0.01 μg), Venus-kRas (0.25 μg), and β2AR (0.2 μg). For experiments with Venus-tagged Gβγ and Nluc-fused GRK3ct (Fig. S4A), cells were transfected with the following plasmids (amount per well indicated in parenthesis): Gαs or Gαi3 (1 or 0.5 μg, respectively), Gβ1-V (0.2 μg), Gγ2-V (0.2 μg), GRK3ct-Nluc (0.05 μg). Unless otherwise indicated in the figures, the amount of plasmid transfected per well for Gα-GTP ONE-GO biosensors and Gβγ ONE-GO biosensors was 0.05 μg and 1μg, respectively, and the amount of GPCR-encoding plasmids co-transfected was 200 ng, except for the plasmid PAR1-ADGRL3 in Fig. 4D which was 500ng to replicate previously described conditions, or plasmids encoding A1R, P2Y6 and P2Y12 in [Supplemental Item 2], which was 5 ng to reduce basal activity.
Six hours after transfection, media was replaced by fresh complete medium or medium with reduced serum (0.1% FCS) in the case of experiments with glutamate receptors (Fig. 4B; [Supplemental Item 2]). Cells were harvested 18–24 h later for luminescence measurements by washing with PBS once and gentle scraping in 1 ml of PBS. Cells were centrifuged for 5 min at 550 × g, and resuspended in BRET buffer (140 mM NaCl, 5 mM KCl, 1 mM MgCl2, 1 mM CaCl2, 0.37 mM NaH2PO4, 20 mM HEPES pH 7.4, 0.1% glucose) at a concentration of approximately 1 million cells/ml. Twenty-five to fifty thousand cells were added to a white opaque 96-well plate (Opti-Plate, PerkinElmer cat# 6005290) and mixed with the nanoluciferase substrate Nano-Glo (Promega cat# N1120, final dilution 1:200) for 2 min before measuring luminescence in a POLARstar OMEGA plate reader (BMG Labtech) at 28°C. Luminescence was measured at 460 ± 40 nm and 535 ± 15 nm, and BRET signal was calculated as the ratio between the emission intensity at 535 nm divided by the emission intensity at 460 nm.
For kinetic BRET measurements, luminescence signals were measured every 0.24 s (with a signal integration time of 0.24 s) for the duration of the experiment. Reagents were added to the wells during live measurements using injectors. BRET data are presented as the difference from baseline BRET signal [△BRET (baseline)] by subtracting the average of signal pre-stimulation from all data points. A similar procedure with minor modifications was followed for time-resolved multi-well experiments (Fig. S5C). Briefly, cells were added to 48 wells of an assay plate and incubated with CTZ400a as the luciferase substrate (GoldBio cat# C-320–1; final concentration of 10 μM) before measuring luminescence in each well every 15 seconds. The Z’ values for the time-resolved multi-well experiments were calculated as described previously130 by using the formula Z’ = 1−[3*(δpositive + δnegative)/│μpositive - μnegative│], where δ is the standard deviation, μ is the mean, and positive / negative indicates presence of absence of agonist, respectively.
For endpoint BRET measurements to determine concentration dependent responses, CTZ400a (final concentration of 10 μM) was used as luciferase substrate, and the BRET signal (535 nm luminescence / 460 nm luminescence) was measured every minute for 5 minutes with a signal integration time of 0.32 s for each measurement. Calculations were done with data corresponding to BRET signals at different time points depending on the kinetics of the response for different receptors and G proteins. BRET data are presented as the difference from BRET signal relative to a condition without agonist [△BRET (no agonist)]. Where indicated, the EC50 and pEC50 values were determined by using a 3-parameter sigmoidal curve-fit in Prism (GraphPad). To compare EC50 values experimentally determined with ONE-GO biosensors for different GPCRs and existing curated pharmacological parameters (Fig. 4B), we extracted pKd, pKi or pE/IC50 values for from the IUPHAR database62, with the following prioritization based on availability : pKd > pKi > pE/IC50. The data was extracted for GPCRs of the same species as the ones used in the experiments with ONE-GO sensors, and when a range of values were given the midpoint was used. For some experiments, the data was further processed in the following ways. For Fig. 2C, D the △BRET values for each G protein chimera (shown in Fig. S2) were normalized by using the maximal △BRET value obtained with the cognate wild-type G protein for each GPCR as 1. For Fig. 5A, the △BRET values were normalized by using the △BRET value obtained upon stimulation with an EC80 concentration of the cognate agonist for each GPCR as 1. Data processed this way was used to generate the Principal Component Analysis (PCA) presented in this panel using the PCA tool with the centered method and with all principal components selected in Prism (GraphPad). For Fig. S5A, the △BRET values were normalized by using the △BRET value obtained upon stimulation with an EC100 concentration of the cognate agonist for each wild-type GPCRs as 1. For Fig. 5C, the △BRET values were first corrected by subtraction of BRET values obtained with cells treated with the same ligands but without GPCR transfection (shown in Fig. S5B), followed by normalization using the corrected △BRET value corresponding to the maximal response observed for a given G protein across all three GPCR as 1. For curves in Fig. S5B with detectable responses (> 0.001 ΔBRET) that could not be reliably fit to accurately determine EC50 values, an arbitrary EC50 value of 30 mM was given.
At the end of some BRET experiments, a separate aliquot of the same pool of cells used for the luminescence measurements was centrifuged for 1 min at 14,000 × g and pellets stored at −20°C for subsequent immunoblot analysis (see “Protein electrophoresis and Immunoblotting” section below).
Luminescence-based cAMP measurements in cells
Approximately 300,000 HEK293T cells were seeded on each well of 6-well plates coated with 0.1% (w/v) gelatin, and transfected with plasmids ~24 hr later using the calcium phosphate method. For experiments testing the effect of the multi-plasmid Gαs sensor system on cAMP signaling (Fig. 1D), cells were transfected with the following plasmids (amount per well indicated in parenthesis): Gαs-99V (1 μg), FLAG-Ric-8B (0.1 μg), Gβ1 (0.2 μg), Gγ2 (0.2 μg), β2AR (0.2 μg), with or without KB1691-Nluc (0.05 μg) and supplemented with pcDNA3.1 to equalize total amount of DNA per well. For experiments testing the effect of Gα ONE-GO biosensors on cAMP signaling (Fig. 3D), cells were transfected with the following plasmids (amount per well indicated in parenthesis): Gαs or Gαi3 ONE-GO biosensor (0.05 μg), α2A-AR (0.2 μg; only in combination with Gαi3 ONE-GO) and supplemented with pcDNA3.1 to equalize total amount of DNA per well. The amount of Glosensor 22F plasmid transfected per well for all experiments was 0.8 μg. Cell medium was changed 6 h after transfections.
Approximately 16–24 h after transfection, cells were washed and gently scraped in room temperature PBS, and centrifuged (5 min at 550 × g). For kinetic measurements, cells were resuspended in 750 μl Tyrode’s buffer (140 mM NaCl, 5 mM KCl, 1 mM MgCl2, 1 mM CaCl2, 0.37 mM NaH2PO4, 24 mM NaHCO3, 10 mM HEPES and 0.1% glucose, pH 7.4). Two-hundred μl of cells were mixed with 200 μl of 5 mM D-luciferin K+ salt (GoldBio, LUCK-100) diluted in Tyrode’s buffer and incubated at 28 °C for 15 minutes. Ninety μl of cells pre-incubated with D-luciferin were added to a white opaque 96-well plate (Opti-Plate, PerkinElmer Life Sciences, 6005290) before measuring luminescence without filters at 28 °C every 10 s in a BMG Labtech POLARStar Omega plate reader. Agonists were added as indicated in the figures during the recordings using built-in injectors. Kinetic traces are represented as raw luminescence signal.
For concentration dependence experiments, cells were washed and scraped as above, but resuspended in 300 μl Tyrode’s buffer. Two-hundred and forty μl of cells were mixed with 240 μl of 5 mM D-luciferin K+ salt diluted in Tyrode’s buffer and incubated at 28 °C for 15 minutes. For experiments testing the effect of Gαs ONE-GO expression, 20 μl of different concentrations of isoproterenol diluted in Tyrode’s buffer at 5X the final concentration desired in the assay were added to wells of a white opaque 96-well plate and further diluted with. 57.6 μl of Tyrode’s buffer. Reactions were initiated by addition of 22.4 μl of the suspension of cells pre-incubated with D-luciferin and luminescence measurements were immediately started. Luminescence signal was measured without filters at 28 °C every 30 s in a BMG Labtech POLARStar Omega plate reader. For each concentration of isoproterenol, the response values were calculated by averaging the 3 time points around the peak of the kinetic trace (270, 300, and 330 s after start of measurement) and normalizing them by using the response at maximal concentration of isoproterenol as 100. For experiments testing the effect of Gαi3 ONE-GO expression, 20 μl of different amounts of brimonidine diluted in Tyrode’s buffer at 4X the final concentration desired in the assay were added to wells of a white opaque 96-well plate, and further diluted by addition of 37.6 μl of Tyrode’s buffer. Reactions were initiated at room temperature by addition of 22.4 μl of the cell suspension pre-incubated with D-luciferin, and 2 minutes later 20 μl of 500 nM isoproterenol (to achieve a final concentration of 100 nM in the assay) diluted in Tyrode’s buffer were added, followed immediately by luminescence measurements as was done above for Gαs ONE-GO. For each concentration of brimonidine, response values were calculated by averaging the 3 time points around the peak of the kinetic trace (270, 300, and 330 s after start of measurement) and normalizing them by using the response in the absence of brimonidine as 100.
At the end of some experiments, a separate aliquot of the same pool of cells used for the measurements was centrifuged for 1 min at 14,000 × g and pellets stored at −20°C for subsequent immunoblot analysis (see “Protein electrophoresis and Immunoblotting” section below).
BRET measurements in HeLa cells
HeLa cells stably expressing Gαi3 ONEGO or Gαi3/Gβγ ONEGO were generated by lentiviral transduction followed by Fluorescence-Activated Cell Sorting (FACS). Lenti-X 293T (Cat# 632180, Takara Bio) cells were seeded on 6-well plates (~400,000 cells/well) coated with 0.1% gelatin and transfected the next day using the polyethylenimine (PEI) method131 at a 2:1 PEI:DNA ratio with the following plasmids (amount of DNA per well in parenthesis): pLVX-CMV-Gαi3-YFP-IRES*-KB1753-Nluc or pLVX-CMV-Gαi3-IRESWT-GRK3ct-Nluc-T2A-Gβ1-T2A-Gγ2-V (1.8 μg), psPAX2 (1.2 μg), and pMD2.G (0.75 μg). The DNA was added to 200 μl of DMEM and mixed with 7.5 μl of PEI reagent (Polysciences Inc cat# 23966). Tubes were incubated at room temperature for 15 min before adding to cells. Six hours after transfection, media was replaced with DMEM supplemented with 10% FCS, 100 U/ml penicillin, 100 μg/ml streptomycin, and 2 mM L-glutamine (complete medium). Lentivirus-containing media was collected 24 hr and 48 hr after transfection, centrifuged at 1500 × g for 5 min after pooling, and filtered through a 0.45-μm surfactant-free cellulose acetate (SFCA) membrane filter (Corning cat# 431220).
HeLa cells were seeded on 6-well plates (~200,000 cells per well) precoated with 0.1 mg/mL poly-L-lysine hydrobromide (overnight incubation followed by 3 washes with HBSS) and transduced the next day by a 48 hr incubation in 2 ml of a 1:1 mix of lentivirus-containing supernatants described above mixed with fresh complete media, supplemented with 6 μg/ml of polybrene (Tocris Bioscience cat# 7711/10). Cells were first transferred from the 6-well plate to a 10-cm plate after virus transduction for expansion. Once the 10-cm plate was confluent, cells were further expanded into 15-cm dishes to have enough material for sorting as described next. For FACS, HeLa cells were trypsinized, resuspended in complete medium, and 7.5 million cells were transferred to a 15 ml conical tube. Cells were washed 3 × with 10 ml cold PBS by cycles of centrifugation (300 × g for 3 minutes), aspiration, and resuspension. Cells were resuspended in 1.5 ml cold PBS and stored on ice until sorting. A subset of the trypsinzed HeLa cells were resuspended in complete DMEM containing DAPI (1 μg/ml), washed as described above, and used for the gating process. Cell sorting was performed on a Moflo Astrios EQ (Beckman Coulter), and the 488ex/513em nm fluorescence channel (Voltage: 354 nV) was used for positive selection. Cells with fluorescent intensity above 300 were collected as “High sensor expression”, and cells with fluorescent intensity from 80 to 300 were collected as “Low sensor expression”. Cells were collected and seeded in a 6-well plate with complete DMEM for expansion.
For BRET experiments, HeLa cells stably expressing Gαi3 ONEGO or Gαi3/Gβγ ONEGO were seeded on 5 mm glass coverslips precoated with 0.1 mg/mL poly-L-lysine hydrobromide (overnight incubation followed by 3 washes with HBSS) and placed in a 96-well plate (~35,000 cells per well). Recordings were done 24 h after seeding as described next. Coverslips were washed with 200 μl BRET buffer and transferred to a well of a white opaque 96-well plate containing BRET buffer and Nano-Glo (final dilution 1:200) with tweezers, followed by incubation in the dark for 2 min at room temperature before measuring luminescence in a POLARstar OMEGA plate reader (BMG Labtech). Measurements and data processing were done as described in “BRET measurements in HEK293T cells” except that measurements with Gαi3/Gβγ ONEGO were made every 0.48 s (with a signal integration time of 0.48 s).
To collect samples for immunoblotting, HeLa cells were seeded on a 6-well plate as described above, scraped in PBS and spun at 550 × g for 5 min. Pellets were processed for immunoblotting as described below in “Protein electrophoresis and Immunoblotting”.
Production of concentrated lentiviral particles
Lentiviruses used for transduction of SH-SY5Y cells and primary cells were concentrated after large scale packaging as described previously131,132. Lenti-X 293T cells were plated on 150 mm diameter dishes (~2.5 million cells / dish) and cultured at 37°C, 5% CO2 in DMEM supplemented with 10% FCS, 100 U/ml penicillin, 100 μg/ml streptomycin, and 2 mM L-glutamine. After 16–24 h, cells were transfected using the polyethylenimine (PEI) method131 at a 2:1 PEI:DNA ratio with the following plasmids (amount of DNA per dish in parenthesis): psPAX2 (18 μg), pMD2.G (11.25 μg) and Gα ONE-GO biosensor (27 μg). Approximately 16 h after transfection, media was replaced. Lentivirus containing media was collected 24 and 48 h after the initial media change (~70 mL per dish and 4 dishes for each construct). Media was centrifuged for 5 min at 900 × g and filtered through a 0.45 μm sterile PES filter (Fisherbrand cat# FB12566505). Filtered media was centrifuged for ~18 h at 17,200 × g at 4°C (Sorvall RC6+, ThermoScientific F12–6×500 LEX rotor) to sediment lentiviral particles. Pellets were washed and gently resuspended in 1 mL of PBS and centrifuged at 50,000 × g for 1 h at 4°C (Beckman Optima MAX-E, TLA-55 rotor). Pellets were resuspended in 500 μl of PBS to obtain concentrated lentiviral stocks that were stored at −80°C in aliquots. Each aliquot was thawed only once and used for less than a week stored at 4°C for subsequent experiments.
BRET measurements in SH-SY5Y cells
Naïve SH-SY5Y cells and SH-SY5Y cells stably expressing Gαi*-BERKY330 were seeded on 35 mm plates (~700,000 cells/plate) coated with 0.1% gelatin. The following day, naïve cells were transduced by replacing the media with fresh medium supplemented with concentrated lentiviral particles of the Gαi3 ONE-GO biosensor under the CMV promoter (1:400 final dilution). Approximately 18 h later, lentivirus-containing media was replaced with fresh medium. Both SH-SY5Y cells stably expressing Gαi*-BERKY3 and cells expressing the Gαi3 ONE-GO sensor were harvested for luminescence measurements approximately 48 h after plating.
Briefly, cells were washed with PBS once, scraped, and spun at 550 × g for 5 min. Cells were resuspended in BRET buffer at a concentration of approximately 1 million cells/ml. For luminescence measurements, 40,000–100,000 cells were added to a white opaque 96-well plate and kinetic BRET measurements were performed as described in “Bioluminescence Resonance Energy Transfer (BRET) measurements in HEK293T cells”. At the end of some BRET experiments, a separate aliquot of the same pool of cells used for the luminescence measurements was centrifuged for 1 min at 14,000 × g and pellets stored at −20°C for subsequent immunoblot analysis (see “Protein electrophoresis and Immunoblotting” section below).
BRET measurements in primary cell cultures
ONE-GO biosensors were expressed in primary cells by lentiviral transduction according to the specific procedures described below using concentrated stocks described in “Production of concentrated lentiviral particles”. All primary cells were transduced with lentiviral constructs expressing the ONE-GO biosensors under the CMV promoter, except for neurons, where ONE-GO biosensors were expressed under the human synapsin I (hSyn) promoter. Cell seeding, viral dilutions, and other parameters are detailed next for each one of the cell types investigated. Mouse lung fibroblasts were seeded on 5 mm glass coverslips precoated with 0.1% gelatin (5 min incubation at room temperature followed by aspiration) and placed in a 96-well plate (15,000 cells per well). Approximately 18 h after seeding, cells were transduced by replacing the media with 100 μl of fresh media supplemented with 6 μg/ml polybrene and the following lentiviruses (final dilution in parenthesis): Gαq ONE-GO (1:500), Gαi3 ONE-GO (1:500), Gα13 ONE-GO (1:500). Plates were spun at 600 × g for 30 min and returned to the incubator. Media was replaced ~24 h later. BRET recordings were done 48 or 72 h after the addition of virus as described below. Mouse astroglial cells were seeded on 5 mm glass coverslips precoated with 0.1 mg/mL poly-L-lysine hydrobromide (overnight incubation followed by 3 washes with HBSS) and placed in a 96-well plate (40,000 cells per well). Approximately 18 h after seeding, cells were transduced by replacing the media with 100 μl of fresh media supplemented with 6 μg/ml polybrene and the following lentiviruses (final dilution in parenthesis): Gαq ONE-GO (1:250), Gαi3 ONE-GO (1:500), Gα13 ONE-GO (1:100–1:250). Plates were spun at 600 × g for 30 min and returned to the incubator. Media was replaced ~24 h later. BRET recordings were done ~48 h post-transduction as described below. Mouse cortical and striatal neurons were seeded as explained above in “Mouse primary cortical & striatal neuron culture”. On DIV7, cells were transduced by replacing half of the media with fresh media containing the following lentiviruses (final dilution in parenthesis): Gαq ONE-GO (1:200), Gαi1 ONE-GO (1:200), GαoA ONE-GO (1:200). Half of the media was replaced with fresh medium ~2 h later and BRET recordings were done on DIV12–19 for cortical neurons, or DIV18–20 for striatal neurons, as described below. Human bronchial SMCs were seeded on 5 mm glass coverslips precoated with 0.1% gelatin and placed in a 96-well plate (15,000 cells per well). Approximately 18 h after seeding, cells were transduced by replacing the media with 100 μl of fresh media supplemented with 6 μg/ml polybrene and the following lentiviruses (final dilution in parenthesis): Gαq ONE-GO (1:1,500), Gαs ONE-GO (1:1,500), Gα13 ONE-GO (1:1,500). Plates were then spun at 600 × g for 30 min and returned to the incubator. Media was replaced ~24 h later, followed by BRET recordings that same day as described below. HUVECs were seeded on 5 mm glass coverslips precoated with 0.1% gelatin and placed in a 96-well plate (15,000 cells per well). Approximately 18 h after seeding, cells were transduced by replacing the media with 100 μl of fresh media supplemented with 6 μg/ml polybrene and the following lentiviruses (final dilution in parenthesis): Gαq ONE-GO (1:2,000), Gαs ONEGO (1:500), Gαi3 ONE-GO (1:2,000), Gα13 ONE-GO (1:500). Plates were then spun at 600 × g for 30 min and returned to the incubator. Media was replaced ~24 h later, followed by BRET recordings the same day as described below. Human cardiac fibroblasts were seeded on 5 mm glass coverslips precoated overnight with 0.4% Matrigel in DMEM and placed in a 96-well plate (13,000 cells per well). Approximately 18 h after seeding, cells were transduced the following ways depending on experimental purposes. For Fig. 6 and Fig. S7, cells were washed twice with HBSS to remove SB431542.Then, cells were incubated in 100 μl of fresh media supplemented with 6 μg/ml polybrene and the following lentiviruses (final dilution in parenthesis): Gαq ONE-GO (1:4,000–1:5,000), Gαs ONE-GO (1:1,000), Gαi3 ONE-GO (1:2,000 for adenosine stimulated cells, 1:4,000–1:5,000 for TRAP-6 stimulated cells), Gα13 ONE-GO (1:4,000–1:5,000). Plates were spun at 600 × g for 30 min, returned to the incubator and media was replaced ~24 h later, followed by BRET recordings 2 h later when testing the effect of adenosine or 24 h later when testing the effect of TRAP-6. For Fig. 7A, cells were kept in media supplemented with 5 μM SB431542 throughout. Approximately 18 h after seeding, cells were incubated in 100 μl of fresh media supplemented with 6 μg/ml polybrene and the following lentiviruses (final dilution in parenthesis): Gαq ONE-GO (1:2,000), Gαi3 ONE-GO (1:2,000), Gα13 ONE-GO (1:2,000). Plates were spun at 600 × g for 30 min, returned to the incubator and media was replaced ~24 h later, followed by BRET recordings 24 h later. For Fig. 7C, cells were washed twice with HBSS to remove SB431542 approximately 18 h after seeding. Then, cells were incubated in 100 μl of fresh media supplemented with 6 μg/ml polybrene and the following lentiviruses in the presence or absence of TGFβ (final dilutions without/with 1 nM TGFβ respectively in parenthesis): Gαq ONE-GO (1:2,000/1:5,000), Gαi3 ONE-GO (1:2,000/1:5,000), Gα13 ONE-GO (1:2,000/1:5,000). Plates were spun at 600 × g for 30 min, returned to the incubator and media was replaced ~48 h later, followed by BRET recordings 2 h later.
Kinetic BRET recordings were done the same way for all cell types. Briefly, coverslips were washed with 200 μl BRET buffer and transferred to a well of a white opaque 96-well plate containing BRET buffer and Nano-Glo (final dilution 1:200) with tweezers, followed by incubation in the dark at room temperature for 2 min before measuring luminescence in a POLARstar OMEGA plate reader (BMG Labtech). Measurements and data processing were done as described in “BRET measurements in HEK293T cells” except that measurements were taken every 0.96 s (with a signal integration time of 0.96 s). Where indicated in the figures or figure legends, cells were pretreated with pertussis toxin (overnight), YM-254890 (2 min), or a GPCR antagonist (2 min). To determine “Max △BRET” (Fig. 7A, 7C), 9 data points centered around the maximum response were averaged. For some representations in Fig. 7, Max △BRET values were normalized by using the Max △BRET value obtained with Gαq ONE-GO for each cell type as 1. The “Basal BRET” and “Luminescence” values reported in Fig. 7C were obtained by averaging the first 10 data points of 535/460 ratios or direct counts in the 460 nm channel, respectively.
For endpoint BRET measurements to determine concentration-dependent responses with cardiac fibroblasts (Fig. 6), coverslips were washed and transferred to an assay plate as explained above. A 10X agonist solution was simultaneously added to all wells using a multi-channel pipette, and BRET signal (535 nm luminescence / 460 nm luminescence) was measured every minute for 5 minutes with a signal integration time of 0.96 s for each measurement. Calculations were done with data corresponding to BRET signals at different time points depending on the kinetics of the response for different receptors and G proteins. BRET data are presented as the difference from BRET signal relative to a condition without agonist [△BRET (no agonist)]. The Gαi3 ONE-GO concentration response curve was generated by doing kinetic BRET measurements as explained above and taking the difference in △BRET at max amplitude for each concentration compared to BRET buffer only injections.
To collect samples of human cardiac fibroblasts for immunoblotting, cells were seeded on a glass bottom 12-well plate precoated overnight with 0.4% Matrigel in DMEM (~140,000 cells per well). Transductions and TGFβ treatments were done exactly as described above for the BRET measurements. Cells were washed with PBS and 90 μl of ice-cold lysis buffer was added to each well before proceeding with the rest of the steps described in “Protein electrophoresis and Immunoblotting” section below.
RT-qPCR of cardiac fibroblast mRNA
Human cardiac fibroblasts were seeded on a glass-bottom 12-well plate precoated overnight with 0.4% Matrigel in DMEM (~140,000 cells per well). Approximately 18 h after seeding, cells were washed 2 × with HBSS, and then incubated in 1 ml of fresh media without SB431542 supplemented (or not) with 1 nM TGFβ. Approximately 48 h later, RNA was extracted using the PureLink RNA Mini kit (ThermoFisher cat# 12183018A) and stored at −80°C. Two-hundred and fifty ng of RNA were used for reverse transcription reactions using the LunaScript RT SuperMix (New England BioLabs cat# E3010). For the qPCR, 10 μl reactions were prepared in technical triplicate for each condition by mixing 1 μl of reverse-transcribed DNA, 4 μl of primer mix (to achieve a final concentration of 10 μM), and 5 μl of 2X SYBR Green PCR Master Mix (Applied biosystems cat# 4385612). For each gene target, the primer mixes consisted of the following forward (F) and reverse (R) primers: h18S (F: CGGCGACGACCCATTCGAAC; R: GAATCGAACCCTGATTCCCCGTC); hACTA2 (F: AAAAGACAGCTACGTGGGTGA; R: GCCATGTTCTATCGGGTACTTC); hCOL1A (F: ACGAAGACATCCCACCAATCACCT; R: AGATCACGTCATCGCACAACACCT); hFN1 (F: GGCAACGTGTTACGATGAT; R: CGGGAATCTTCTCTGTCAG). The qPCR was run on a ViiA 7 Real-Time PCR machine (Applied biosystems) using the following conditions: Initial denaturation was done at 95°C for 20 s, then 40 cycles were repeated going from 1 s at 95°C to 20 s at 60°C.
Relative mRNA expression was calculated using the 2(-△△ Ct) method as described133 using h18S as the housekeeping gene. The fold increase mRNA upon TGFβ treatment was calculated by dividing each value from the previous step by the average mRNA expression of the control condition (without TGFβ) for each target gene.
ERK1/2 phosphorylation assay
HEK293T cells were seeded and transfected with or without the Gαq ONE-GO biosensor as described in “BRET measurements in HEK293T cells”. One day after the transfection, cells were stimulated for 5 minutes with carbachol (100 μM) with or without a 2 minute pre-incubation with YM-254890 (1 μM) as indicated in Fig. S4B. Cells were harvested and centrifuged for 1 min at 14,000 × g and pellets stored at −20°C for subsequent immunoblot analysis (see “Protein electrophoresis and Immunoblotting” section below).
Protein electrophoresis and immunoblotting
Pellets of HEK293T, SH-SY5Y cells, or HeLa cells were resuspended on ice with lysis buffer (20 mM HEPES, 5 mM Mg(CH3COO)2, 125 mM K(CH3COO), 0.4% (v:v) Triton X-100, 1 mM DTT, 10 mM β-glycerophosphate, 0.5 mM Na3VO4, supplemented with a protease inhibitor cocktail [SigmaFAST cat# S8830], pH 7.4) and thoroughly vortexed. Cardiac fibroblasts were lysed directly in the culture wells as described in “BRET measurements in primary cell cultures” with the same buffer and transferred to 1.5 ml tubes before thorough vortexing. Lysates were cleared by centrifugation (10 min at 14,000 × g, 4°C) and quantified by Bradford (Bio-Rad, cat#5000205). All samples were then boiled for 5 min in Laemmli sample buffer, except those used to detect PAR1 (Fig. 7C), which were incubated at 37°C for 10 min.
Proteins were separated by SDS-PAGE, followed by transfer to PVDF membranes (EMD Millipore cat# IPFL00010) for 2 h. Membranes were stained with Ponceau S solution (0.1% w/v Ponceau S in 5% v/v acetic acid) and imaged on a flatbed scanner prior to immunoblotting. PVDF membranes were blocked with TBS supplemented with 5% (w;v) non-fat dry milk for 1 hour, and then incubated sequentially with primary and secondary antibodies diluted in TBST supplemented with 2.5% (w:v) non-fat dry milk. Primary antibody species, vendors, and dilutions were as follows (in parenthesis): His (mouse, Sigma cat# H1029; 1:2,500); β-actin (rabbit, LI-COR cat# 926–42210; 1:2,500); GFP (mouse, Clontech cat# 632380; 1:2,000); FLAG (mouse, Millipore Sigma cat# F1804; 1:1000); Gαs (rabbit, SCBT cat# sc-383; 1:500); tubulin (mouse, Sigma cat# T6074; 1:2,500); Gβ (mouse, SCBT cat# sc-166123; 1:250–1:500); PAR1 (mouse, Millipore Sigma cat# MABF244; 1:500); RFP (mouse, Invitrogen cat# MA5–15257; 1:2000); pERK1/2(T202/Y204) (rabbit, Cell Signaling cat# 4370; 1:1000); ERK1/2 (rabbit, Cell Signaling cat# 4695; 1:1000); Gαi3 (rabbit, Aviva cat# OAAB19207; 1:250), except in Fig. 3C, D, which has rabbit, Millipore Sigma cat# 06–270; 1:500; Nluc in Fig. 1D, Fig. S1A–B, Fig. S3B, Fig. S6 (rabbit, Promega42; 1:1,000); Nluc in Fig. 2A, 3B, 4A, 7C (mouse, Promega cat# N700A; 1:500–1:1000); Nluc in Fig. 3C–D (mouse, R&D systems cat# MAB10026; 1:250). The following secondary antibodies were used at a 1:10,000 dilution (species and vendor indicated in parenthesis): anti-rabbit Alexa Fluor 680 (goat, Invitrogen cat# A21077); anti-mouse Alexa Fluor 680 (goat, Invitrogen cat# A21058); anti-mouse IRDye 800 (goat, LI-COR cat# 926–32210); anti-rabbit DyLight 800 (goat, Thermo cat# 35571). Infrared imaging of immunoblots was performed according to manufacturer’s recommendations using an Odyssey CLx infrared imaging system (LI-COR Biosciences). Images were processed using Image Studio software (LI-COR), and assembled for presentation using Photoshop and Illustrator software (Adobe).
QUANTIFICATION AND STATISTICAL ANALYSIS
Unless otherwise indicated, all experiments were performed at least three times, and presented as averages ± the standard error of the mean (SEM). For the sake of clarity, in the presentation of kinetic BRET measurements the SEM is only presented in the positive direction and displayed as bars of a lighter color tone than that of its corresponding data points. Protein structure images displayed in Fig. 2A, 2B were prepared in ICM (Molsoft LLC., San Diego, CA). Chemical structures (Fig. 5A, C) were generated using ChemDraw (PerkinElmer informatics, Waltham, MA).
Supplementary Material
Figure S1. Live-cell Gαs activity biosensor design, Related to Figure 1.
(A, B) Identification of optimal acceptor design for Gαs-GTP biosensors based on KB1691-Nluc and KB2123-Nluc. BRET responses were measured in HEK293T cells expressing KB1691-Nluc or KB2123-Nluc along with Gβ1, Gγ2, Gαs (short isoform) tagged with Venus at three different internal positions (67V, 99V, or 154V), and with (orange) or without (black) co-expression of Ric-8B. Results are the mean ± S.E.M. of n=3–4. A representative immunoblot showing the expression of the different components of the biosensor is presented on the right.
(C) Biosensors based on KB1691 or KB2123 detect Gαs activation by D1R. BRET responses were measured in HEK293T cells expressing D1R, Gβ1, Gγ2, Gαs-99V and either KB1691-Nluc or KB2123-Nluc. Results are the mean ± S.E.M. of n=3–5.
(D) Bystander BRET biosensor design for active Gαs using KB1691-Nluc. Left, schematic representation of bystander BRET sensor system. KB1691-Nluc without any targeting sequence is expressed in the cytosol but is recruited to the plasma membrane upon GPCR-mediated activation of Gαs. A membrane-anchored Venus serves as the bystander BRET acceptor for KB1691-Nluc after translocation. Right, BRET was measured in HEK293T cells expressing the β2AR, untagged Gαs, cytosolic KB1691-Nluc, and a membrane anchored Venus. Results are the mean ± S.E.M. of n=4.
(E) Detection of Gαi, Gαq and Gα13 activation with previously described biosensors. BRET responses were measured in HEK293T cells expressing the indicated combination of cognate GPCR, G protein, and Gα-GTP detector modules fused to Nluc. All Gα subunits were internally tagged with a YFP and they were co-transfected with Gβ1 and Gγ2. Experiments were done in parallel to those in Fig. 1C with the same stimulation conditions to serve as positive controls. Results are the mean ± S.E.M. of n=4–5.
Figure S2. Contribution of the C-terminal tail (CT) and the αN/β1 ‘hinge’ of Gα subunits to their coupling to GPCRs, Related to Figure 2. BRET was measured in HEK293T cells expressing the indicated combinations of GPCR, G protein and Gα-GTP detector modules fused to Nluc. All Gα subunits were internally tagged with a YFP and they were co-transfected with Gβ1, Gγ2, and either KB1691-Nluc (Gαs-GTP biosensor) or KB1753-Nluc (Gαi-GTP biosensor). Results are the mean ± S.E.M. of n=3–5.
Figure S3. Gαs biosensor performance with or without expression of exogenous Gβγ and ONE-GO biosensor optimization, Related to Figure 3.
(A) Top, schematic of the reduction of Gαs-GTP biosensor components from five to three. Bottom, BRET was measured in HEK293T cells co-expressing KB1691-Nluc, Gαs-99V, Ric-8B, and the indicated GPCR (β2AR or D1R) with (black) or without (orange) exogenous Gβ1 and Gγ2. Results are the mean ± S.E.M. of n=3–5.
(B) Gαs and Gαi3 ONE-GO biosensor designs. Two designs using a stronger or weaker promoter (CMV or SV40, respectively) were investigated for both Gαs and Gαi3 biosensors. In all cases, the Gα-YFP component was placed right after the promoter and the membrane-anchored Nluc-fused component after a modified IRES (IRES*) of low efficiency to achieve higher acceptor-to-donor BRET ratios. BRET was measured in HEK293T cells transfected with different amounts of the indicated single-plasmid ONE-GO biosensors or their multi-plasmid (M-P) counterparts. β2AR or α2A-AR were co-expressed for Gαs or Gαi3, respectively. Results are the mean of n=2–3. A representative immunoblot showing expression of biosensor components is presented on the bottom left.
(C) Gβγ ONE-GO biosensor designs. All constructs were based on a CMV promoter. Untagged Gα subunits were placed right after the promoter, followed by the Gβγ detector mas-GRK3ct-Nluc, Gβ1 and Venus tagged Gγ2 (separated by self-cleaving T2A sequences) after a high efficiency IRES (IRESWT). This favors the expression of Gα and Gβγ at similar level to facilitate their assembly into a functional heterotrimer. BRET was measured in HEK293T cells expressing the indicated combination of Gα/Gβγ ONE-GO biosensor and GPCR. Results are representative traces of an individual experiment.
Figure S4. Expression of biosensor components does not affect Gβγ association or dissociation and does not interfere with Gq/PKC/ERK signaling, Related to Figures 3, 4.
(A) Expression of Gα-binding peptides used as detector modules in the ONE-GO biosensors does not affect Gβγ association with Gα or their dissociation upon GPCR stimulation. Left, BRET was measured in HEK293T cells expressing the components of a biosensor for free Gβγ and the indicated amounts of plasmids encoding mas-KB1691-mKate2 or mas-KB1753-mKate2, which were paired with β2AR/Gαs or α2A-AR/Gαi expression, respectively. Measurements were carried out with or without the indicated GPCR agonists. Results are mean ± S.E.M. of n=4. Middle, kinetic BRET measurements in HEK293T cells transfected as in the left panels in the presence of 100 ng of mas-KB1691-mKate2 or mas-KB1753-mKate2. Results are mean ± S.D. of n=3. Right, Representative immunoblot to confirming increasing expression of detector peptides and no changes in the expression of components of the free Gβγ biosensor.
(B) Expression of the Gαq ONE-GO sensor does not affect ERK1/2 activation downstream of Gq activation by a GPCR. HEK293T cells expressing the M3R, with or without expression of the Gαq ONE-GO biosensor were stimulated (or not) with carbachol for 5 min as indicated. In some cases, cells were pretreated for 5 minutes with the selective Gq inhibitor YM-254890, as indicated. A representative immunoblot is shown, and the graph is the quantification of ERK1/2 activation (phosphor/total ratio) corresponding to the mean ± S.E.M. of n=3.
Figure S5. Large-scale parallel interrogation of GPCR activity with ONE-GO biosensors, Related to Figure 5.
(A) Pharmacogenomic profiles of atypical antipsychotics. Left, schematic of the assay. Right, BRET responses were measured in HEK293T cells expressing the indicated GPCRs and ONE-GO biosensors upon stimulation with the indicated concentrations of antipsychotic drug, of cognate agonist, or a combination of both, as shown. Results are the mean of n=3–7.
(B) Profiling of G protein selectivity across short-chain fatty acid receptors. Left, BRET responses were measured in HEK293T cells expressing the indicated combination of GPCR and ONE-GO biosensor upon stimulation with different short chain fatty acids, as shown. Results are the mean ± S.E.M. of n=4–6. Right, heatmaps represent maximal responses normalized by biosensor and pEC50 values calculated from concentration dependent curve fits presented on the left.
(C) Time-resolved parallel interrogation of GPCR responses. Left, schematic of the assay. Middle, BRET was measured in HEK293T cells expressing the α2A-AR and the Gαi3 ONE-GO biosensor, which were treated with ligands as indicated. The graph on the left is a representative experiment of 48 simultaneously kinetic measurements (thin traces are individual wells and the thick line is the average). The graph on the right is a scatter plot of Z’ values of 3 individual 48-condition recordings (i.e., in 3 plates) repeated in 2 independent experiments. Right, BRET was measured in HEK293T cells expressing the GABABR and ONE-GO biosensor for either Gαi3 (black traces) or for Gαi3 G183S (red traces). Results are 24 kinetic measurements for each G protein carried out simultaneously (thin traces are individual wells and the thick line is the average) from one representative experiment of 3.
Figure S6. Detection of endogenous GPCR activity in cell lines with ONE-GO biosensors, Related to Figure 6.
(A-B) Detection of endogenous GPCR activity in HeLa cells stably expressing ONE-GO biosensors. Top, generation of HeLa cells stably expressing high or low levels of either Gαi3 ONE-GO (A) or Gαi3/Gβγ ONE-GO (B) biosensors by lentiviral transduction followed by FACS. A representative immunoblotting result to confirm the relative expression of biosensor components and endogenous G proteins is shown on the bottom left. Bottom, BRET was measured in HeLa cells stably expressing either the Gαi3 ONE-GO or the Gαi3/Gβγ ONEGO sensor, and treated with ligands as indicated. The black traces in the insets correspond to previously described30 BRET responses detected in HeLa cells expressing another biosensor for the same G proteins (Gαi*-BERKY3 in A and Gβγ-BERKY3 in B) upon stimulation of endogenous α2 adrenergic receptors. Results are the mean ± S.E.M. of n=2–3.
(C) Detection of endogenous opioid receptor activation in SH-SY5Y cells acutely transduced with a ONE-GO biosensor. BRET was measured in parallel either in SH-SY5Y cells acutely transduced with a lentivirus for the expression of Gαi3 ONE-GO biosensor (orange), or in a previously established30 SH-SY5Y line stably expressing the Gαi*-BERKY3 biosensor (green) upon stimulation with the μ-opioid receptor agonist DAMGO. Results are the mean ± S.E.M. of n=4. The immunoblot shows the expression of ONE-GO biosensor components and endogenous Gαi3.
Figure S7. Endogenous GPCR responses and respective controls detected with ONE-GO biosensors in various primary cell types, Related to Figure 6.
BRET was measured in the indicated cell types after acute transduction with lentiviruses for the expression of different ONE-GO biosensors, as indicated. Cells were stimulated with agonists as indicated during the BRET recordings. In some cases, cells were pre-treated with the indicated GPCR antagonists (green and orange) or the Gq/11 inhibitor YM-254890 (blue) for two minutes before initiating the measurements, or with pertussis toxin (Ptx, red) overnight. Results are the mean ± S.E.M. of n=4–6.
Supplemental item 1_ONE-GO biosensor sequences, Related to Fig. 4.
Supplemental item 2_Concentration dependence curves for 72 GPCRs, Related to Fig. 4.
Supplemental item 3_IUPHAR vs ONE-GO pEC50, Related to Fig. 4.
Supplemental item 4_Neuropeptide MOR LogEC50s, Related to Fig. 4.
Supplemental item 5_Antipsycotics profiling, Mean, SD, Related to Fig. 5.
Supplemental item 6_Pharmacogenomic profiling of antipsychotics. Mean, SD, Related to Fig. S5.
Supplemental item 7_SCFA profiling. LogEC50s, Related to Fig. S5.
HIGHLIGHTS.
ONE-GO is a platform of biosensors for all main classes of GPCR-activated G proteins
ONE-GO sensors are broadly applicable across GPCRs, cell types, and assay formats
ONE-GO sensors detect endogenous GPCR activity in many different primary cell types
Context-dependence is a prevalent feature of endogenous GPCR activity
ACKNOWLEDGEMENTS
This work was primarily supported by NIH grant R01GM147931 (to MG-M), but also by R01NS117101 (to MG-M). RJ was supported by a Predoctoral Fellowship from the American Heart Association (898932). AL was supported by a F31 Ruth L. Kirschstein NRSA Predoctoral Fellowship (F31NS115318). JZ was supported by a Dahod International Scholar Award. HZ was supported by the American Heart Association (23CDA1050577). We thank Dr. A. Belkina for access to the Flow Cytometry Core at Boston University, and the following investigators for plasmids: N. Lambert, H. Yano, K. Martemyanov, J. Blumer, P. Polgar, J. Levitz, S. Schulz, P. Slessinger, J. Javitch, and A. Kovoor. We thank N. Lambert for sharing the Gα protein cartoon used in some figures.
Footnotes
Publisher's Disclaimer: This is a PDF file of an unedited manuscript that has been accepted for publication. As a service to our customers we are providing this early version of the manuscript. The manuscript will undergo copyediting, typesetting, and review of the resulting proof before it is published in its final form. Please note that during the production process errors may be discovered which could affect the content, and all legal disclaimers that apply to the journal pertain.
Declaration of interests: The authors declare no conflict of interests.
REFERENCES
- 1.Weis WI, and Kobilka BK (2018). The Molecular Basis of G Protein-Coupled Receptor Activation. Annu Rev Biochem 87, 897–919. 10.1146/annurev-biochem-060614-033910. [DOI] [PMC free article] [PubMed] [Google Scholar]
- 2.Wingler LM, and Lefkowitz RJ (2020). Conformational Basis of G Protein-Coupled Receptor Signaling Versatility. Trends in cell biology 30, 736–747. 10.1016/j.tcb.2020.06.002. [DOI] [PMC free article] [PubMed] [Google Scholar]
- 3.Wootten D, Christopoulos A, Marti-Solano M, Babu MM, and Sexton PM (2018). Mechanisms of signalling and biased agonism in G protein-coupled receptors. Nat Rev Mol Cell Biol 19, 638–653. 10.1038/s41580-018-0049-3. [DOI] [PubMed] [Google Scholar]
- 4.Hauser AS, Attwood MM, Rask-Andersen M, Schiöth HB, and Gloriam DE (2017). Trends in GPCR drug discovery: new agents, targets and indications. Nature Reviews Drug Discovery 16, 829–842. 10.1038/nrd.2017.178. [DOI] [PMC free article] [PubMed] [Google Scholar]
- 5.Sriram K, and Insel PA (2018). G Protein-Coupled Receptors as Targets for Approved Drugs: How Many Targets and How Many Drugs? Mol Pharmacol 93, 251–258. 10.1124/mol.117.111062. [DOI] [PMC free article] [PubMed] [Google Scholar]
- 6.Roth BL, and Kroeze WK (2015). Integrated Approaches for Genome-wide Interrogation of the Druggable Non-olfactory G Protein-coupled Receptor Superfamily. The Journal of biological chemistry 290, 19471–19477. 10.1074/jbc.R115.654764. [DOI] [PMC free article] [PubMed] [Google Scholar]
- 7.Cary BP, Zhang X, Cao J, Johnson RM, Piper SJ, Gerrard EJ, Wootten D, and Sexton PM (2023). New Insights into the Structure and Function of Class B1 GPCRs. Endocrine reviews 44, 492–517. 10.1210/endrev/bnac033. [DOI] [PMC free article] [PubMed] [Google Scholar]
- 8.Manglik A, and Kruse AC (2017). Structural Basis for G Protein-Coupled Receptor Activation. Biochemistry 56, 5628–5634. 10.1021/acs.biochem.7b00747. [DOI] [PMC free article] [PubMed] [Google Scholar]
- 9.Kenakin T (2019). Emergent Concepts of Receptor Pharmacology. Handbook of experimental pharmacology 260, 17–41. 10.1007/164_2019_297. [DOI] [PubMed] [Google Scholar]
- 10.Wootten D, Christopoulos A, and Sexton PM (2013). Emerging paradigms in GPCR allostery: implications for drug discovery. Nature reviews. Drug discovery 12, 630–644. 10.1038/nrd4052. [DOI] [PubMed] [Google Scholar]
- 11.Wall MJ, Hill E, Huckstepp R, Barkan K, Deganutti G, Leuenberger M, Preti B, Winfield I, Carvalho S, Suchankova A, Wei H, Safitri D, Huang X, Imlach W, La Mache C, Dean E, Hume C, Hayward S, Oliver J, Zhao FY, Spanswick D, Reynolds CA, Lochner M, Ladds G, and Frenguelli BG (2022). Selective activation of Galphaob by an adenosine A(1) receptor agonist elicits analgesia without cardiorespiratory depression. Nature communications 13, 4150. 10.1038/s41467-022-31652-2. [DOI] [PMC free article] [PubMed] [Google Scholar]
- 12.Qu Q, Huang W, Aydin D, Paggi JM, Seven AB, Wang H, Chakraborty S, Che T, DiBerto JF, Robertson MJ, Inoue A, Suomivuori CM, Roth BL, Majumdar S, Dror RO, Kobilka BK, and Skiniotis G (2023). Insights into distinct signaling profiles of the microOR activated by diverse agonists. Nature chemical biology 19, 423–430. 10.1038/s41589-022-01208-y. [DOI] [PMC free article] [PubMed] [Google Scholar]
- 13.Kenakin T (2018). Is the Quest for Signaling Bias Worth the Effort? Molecular pharmacology 93, 266–269. 10.1124/mol.117.111187. [DOI] [PubMed] [Google Scholar]
- 14.Che T, Dwivedi-Agnihotri H, Shukla AK, and Roth BL (2021). Biased ligands at opioid receptors: Current status and future directions. Science signaling 14. 10.1126/scisignal.aav0320. [DOI] [PMC free article] [PubMed] [Google Scholar]
- 15.Gillis A, Kliewer A, Kelly E, Henderson G, Christie MJ, Schulz S, and Canals M (2020). Critical Assessment of G Protein-Biased Agonism at the mu-Opioid Receptor. Trends in pharmacological sciences 41, 947–959. 10.1016/j.tips.2020.09.009. [DOI] [PubMed] [Google Scholar]
- 16.Gillis A, Gondin AB, Kliewer A, Sanchez J, Lim HD, Alamein C, Manandhar P, Santiago M, Fritzwanker S, Schmiedel F, Katte TA, Reekie T, Grimsey NL, Kassiou M, Kellam B, Krasel C, Halls ML, Connor M, Lane JR, Schulz S, Christie MJ, and Canals M (2020). Low intrinsic efficacy for G protein activation can explain the improved side effect profiles of new opioid agonists. Science signaling 13. 10.1126/scisignal.aaz3140. [DOI] [PubMed] [Google Scholar]
- 17.Kliewer A, Gillis A, Hill R, Schmiedel F, Bailey C, Kelly E, Henderson G, Christie MJ, and Schulz S (2020). Morphine-induced respiratory depression is independent of beta-arrestin2 signalling. British journal of pharmacology 177, 2923–2931. 10.1111/bph.15004. [DOI] [PMC free article] [PubMed] [Google Scholar]
- 18.Kliewer A, Schmiedel F, Sianati S, Bailey A, Bateman JT, Levitt ES, Williams JT, Christie MJ, and Schulz S (2019). Phosphorylation-deficient G-protein-biased mu-opioid receptors improve analgesia and diminish tolerance but worsen opioid side effects. Nature communications 10, 367. 10.1038/s41467-018-08162-1. [DOI] [PMC free article] [PubMed] [Google Scholar]
- 19.Schmid CL, Kennedy NM, Ross NC, Lovell KM, Yue Z, Morgenweck J, Cameron MD, Bannister TD, and Bohn LM (2017). Bias Factor and Therapeutic Window Correlate to Predict Safer Opioid Analgesics. Cell 171, 1165–1175 e1113. 10.1016/j.cell.2017.10.035. [DOI] [PMC free article] [PubMed] [Google Scholar]
- 20.Kenakin T (2019). Biased Receptor Signaling in Drug Discovery. Pharmacological reviews 71, 267–315. 10.1124/pr.118.016790. [DOI] [PubMed] [Google Scholar]
- 21.Maharana J, Banerjee R, Yadav MK, Sarma P, and Shukla AK (2022). Emerging structural insights into GPCR-beta-arrestin interaction and functional outcomes. Current opinion in structural biology 75, 102406. 10.1016/j.sbi.2022.102406. [DOI] [PMC free article] [PubMed] [Google Scholar]
- 22.Gilman AG (1987). G proteins: transducers of receptor-generated signals. Annual review of biochemistry 56, 615–649. 10.1146/annurev.bi.56.070187.003151. [DOI] [PubMed] [Google Scholar]
- 23.Knight KM, Ghosh S, Campbell SL, Lefevre TJ, Olsen RHJ, Smrcka AV, Valentin NH, Yin G, Vaidehi N, and Dohlman HG (2021). A universal allosteric mechanism for G protein activation. Molecular cell 81, 1384–1396 e1386. 10.1016/j.molcel.2021.02.002. [DOI] [PMC free article] [PubMed] [Google Scholar]
- 24.Bunemann M, Frank M, and Lohse MJ (2003). Gi protein activation in intact cells involves subunit rearrangement rather than dissociation. Proceedings of the National Academy of Sciences of the United States of America 100, 16077–16082. 10.1073/pnas.2536719100. [DOI] [PMC free article] [PubMed] [Google Scholar]
- 25.Gales C, Van Durm JJ, Schaak S, Pontier S, Percherancier Y, Audet M, Paris H, and Bouvier M (2006). Probing the activation-promoted structural rearrangements in preassembled receptor-G protein complexes. Nature structural & molecular biology 13, 778–786. 10.1038/nsmb1134. [DOI] [PubMed] [Google Scholar]
- 26.Hollins B, Kuravi S, Digby GJ, and Lambert NA (2009). The c-terminus of GRK3 indicates rapid dissociation of G protein heterotrimers. Cell Signal 21, 1015–1021. 10.1016/j.cellsig.2009.02.017. [DOI] [PMC free article] [PubMed] [Google Scholar]
- 27.Masuho I, Ostrovskaya O, Kramer GM, Jones CD, Xie K, and Martemyanov KA (2015). Distinct profiles of functional discrimination among G proteins determine the actions of G protein-coupled receptors. Science signaling 8, ra123. 10.1126/scisignal.aab4068. [DOI] [PMC free article] [PubMed] [Google Scholar]
- 28.Janetopoulos C, Jin T, and Devreotes P (2001). Receptor-mediated activation of heterotrimeric G-proteins in living cells. Science 291, 2408–2411. 10.1126/science.1055835. [DOI] [PubMed] [Google Scholar]
- 29.Olsen RHJ, DiBerto JF, English JG, Glaudin AM, Krumm BE, Slocum ST, Che T, Gavin AC, McCorvy JD, Roth BL, and Strachan RT (2020). TRUPATH, an open-source biosensor platform for interrogating the GPCR transducerome. Nature chemical biology 16, 841–849. 10.1038/s41589-020-0535-8. [DOI] [PMC free article] [PubMed] [Google Scholar]
- 30.Maziarz M, Park JC, Leyme A, Marivin A, Garcia-Lopez A, Patel PP, and Garcia-Marcos M (2020). Revealing the Activity of Trimeric G-proteins in Live Cells with a Versatile Biosensor Design. Cell 182, 770–785 e716. 10.1016/j.cell.2020.06.020. [DOI] [PMC free article] [PubMed] [Google Scholar]
- 31.Avet C, Mancini A, Breton B, Le Gouill C, Hauser AS, Normand C, Kobayashi H, Gross F, Hogue M, Lukasheva V, St-Onge S, Carrier M, Heroux M, Morissette S, Fauman EB, Fortin JP, Schann S, Leroy X, Gloriam DE, and Bouvier M (2022). Effector membrane translocation biosensors reveal G protein and betaarrestin coupling profiles of 100 therapeutically relevant GPCRs. eLife 11. 10.7554/eLife.74101. [DOI] [PMC free article] [PubMed] [Google Scholar]
- 32.Irannejad R, Tomshine JC, Tomshine JR, Chevalier M, Mahoney JP, Steyaert J, Rasmussen SG, Sunahara RK, El-Samad H, Huang B, and von Zastrow M (2013). Conformational biosensors reveal GPCR signalling from endosomes. Nature 495, 534–538. 10.1038/nature12000. [DOI] [PMC free article] [PubMed] [Google Scholar]
- 33.Ha CM, Park D, Kim Y, Na M, Panda S, Won S, Kim H, Ryu H, Park ZY, Rasenick MM, and Chang S (2015). SNX14 is a bifunctional negative regulator for neuronal 5-HT6 receptor signaling. Journal of cell science 128, 1848–1861. 10.1242/jcs.169581. [DOI] [PMC free article] [PubMed] [Google Scholar]
- 34.Sadana R, and Dessauer CW (2009). Physiological roles for G protein-regulated adenylyl cyclase isoforms: insights from knockout and overexpression studies. Neuro-Signals 17, 5–22. 10.1159/000166277. [DOI] [PMC free article] [PubMed] [Google Scholar]
- 35.Fowlkes D,M, Christensen D,J, Hamilton P,T, Blaesius R, Ramer J, Kevin, Hyde-DeRuyscher R, Duffin D, and Fredericks Z (2004). SYNTHETIC OR PARTIALLY PURIFIED PEPTIDES WHICH CAN BIND TO SPECIFIC SUBUNITS OF G PROTEINS AND USES THEREOF. World Intellctual Property Organization. Patent #WO 2004/035614 A1. [Google Scholar]
- 36.Yano H, Provasi D, Cai NS, Filizola M, Ferre S, and Javitch JA (2017). Development of novel biosensors to study receptor-mediated activation of the G-protein alpha subunits Gs and Golf. The Journal of biological chemistry 292, 19989–19998. 10.1074/jbc.M117.800698. [DOI] [PMC free article] [PubMed] [Google Scholar]
- 37.Gabay M, Pinter ME, Wright FA, Chan P, Murphy AJ, Valenzuela DM, Yancopoulos GD, and Tall GG (2011). Ric-8 proteins are molecular chaperones that direct nascent G protein alpha subunit membrane association. Science signaling 4, ra79. 10.1126/scisignal.2002223. [DOI] [PMC free article] [PubMed] [Google Scholar]
- 38.Yano H, Provasi D, Cai NS, Filizola M, Ferre S, and Javitch JA (2017). Development of novel biosensors to study receptor-mediated activation of the G-protein alpha subunits G(s) and G(olf). The Journal of biological chemistry 292, 19989–19998. 10.1074/jbc.M117.800698. [DOI] [PMC free article] [PubMed] [Google Scholar]
- 39.Lan TH, Liu Q, Li C, Wu G, and Lambert NA (2012). Sensitive and high resolution localization and tracking of membrane proteins in live cells with BRET. Traffic 13, 1450–1456. 10.1111/j.1600-0854.2012.01401.x. [DOI] [PMC free article] [PubMed] [Google Scholar]
- 40.Kuravi S, Lan TH, Barik A, and Lambert NA (2010). Third-party bioluminescence resonance energy transfer indicates constitutive association of membrane proteins: application to class a g-protein-coupled receptors and g-proteins. Biophysical journal 98, 2391–2399. 10.1016/j.bpj.2010.02.004. [DOI] [PMC free article] [PubMed] [Google Scholar]
- 41.Martin BR, and Lambert NA (2016). Activated G Protein Galphas Samples Multiple Endomembrane Compartments. The Journal of biological chemistry 291, 20295–20302. 10.1074/jbc.M116.729731. [DOI] [PMC free article] [PubMed] [Google Scholar]
- 42.Hall MP, Unch J, Binkowski BF, Valley MP, Butler BL, Wood MG, Otto P, Zimmerman K, Vidugiris G, Machleidt T, Robers MB, Benink HA, Eggers CT, Slater MR, Meisenheimer PL, Klaubert DH, Fan F, Encell LP, and Wood KV (2012). Engineered luciferase reporter from a deep sea shrimp utilizing a novel imidazopyrazinone substrate. ACS Chem Biol 7, 1848–1857. 10.1021/cb3002478. [DOI] [PMC free article] [PubMed] [Google Scholar]
- 43.Binkowski BF, Butler BL, Stecha PF, Eggers CT, Otto P, Zimmerman K, Vidugiris G, Wood MG, Encell LP, Fan F, and Wood KV (2011). A luminescent biosensor with increased dynamic range for intracellular cAMP. ACS chemical biology 6, 1193–1197. 10.1021/cb200248h. [DOI] [PubMed] [Google Scholar]
- 44.Wu V, Yeerna H, Nohata N, Chiou J, Harismendy O, Raimondi F, Inoue A, Russell RB, Tamayo P, and Gutkind JS (2019). Illuminating the Onco-GPCRome: Novel G protein-coupled receptor-driven oncocrine networks and targets for cancer immunotherapy. J Biol Chem 294, 11062–11086. 10.1074/jbc.REV119.005601. [DOI] [PMC free article] [PubMed] [Google Scholar]
- 45.Ramms DJ, Raimondi F, Arang N, Herberg FW, Taylor SS, and Gutkind JS (2021). Galphas-Protein Kinase A (PKA) Pathway Signalopathies: The Emerging Genetic Landscape and Therapeutic Potential of Human Diseases Driven by Aberrant Galphas-PKA Signaling. Pharmacol Rev 73, 155–197. 10.1124/pharmrev.120.000269. [DOI] [PMC free article] [PubMed] [Google Scholar]
- 46.Landis CA, Masters SB, Spada A, Pace AM, Bourne HR, and Vallar L (1989). GTPase inhibiting mutations activate the alpha chain of Gs and stimulate adenylyl cyclase in human pituitary tumours. Nature 340, 692–696. 10.1038/340692a0. [DOI] [PubMed] [Google Scholar]
- 47.Hu Q, and Shokat KM (2018). Disease-Causing Mutations in the G Protein Galphas Subvert the Roles of GDP and GTP. Cell 173, 1254–1264 e1211. 10.1016/j.cell.2018.03.018. [DOI] [PMC free article] [PubMed] [Google Scholar]
- 48.Kleuss C, Raw AS, Lee E, Sprang SR, and Gilman AG (1994). Mechanism of GTP hydrolysis by G-protein alpha subunits. Proc Natl Acad Sci U S A 91, 9828–9831. 10.1073/pnas.91.21.9828. [DOI] [PMC free article] [PubMed] [Google Scholar]
- 49.Conklin BR, Farfel Z, Lustig KD, Julius D, and Bourne HR (1993). Substitution of three amino acids switches receptor specificity of Gq alpha to that of Gi alpha. Nature 363, 274–276. 10.1038/363274a0. [DOI] [PubMed] [Google Scholar]
- 50.Okashah N, Wan Q, Ghosh S, Sandhu M, Inoue A, Vaidehi N, and Lambert NA (2019). Variable G protein determinants of GPCR coupling selectivity. Proceedings of the National Academy of Sciences 116, 12054–12059. doi: 10.1073/pnas.1905993116. [DOI] [PMC free article] [PubMed] [Google Scholar]
- 51.Semack A, Sandhu M, Malik RU, Vaidehi N, and Sivaramakrishnan S (2016). Structural Elements in the Galphas and Galphaq C Termini That Mediate Selective G Protein-coupled Receptor (GPCR) Signaling. J Biol Chem 291, 17929–17940. 10.1074/jbc.M116.735720. [DOI] [PMC free article] [PubMed] [Google Scholar]
- 52.Slessareva JE, Ma H, Depree KM, Flood LA, Bae H, Cabrera-Vera TM, Hamm HE, and Graber SG (2003). Closely related G-protein-coupled receptors use multiple and distinct domains on G-protein alpha-subunits for selective coupling. J Biol Chem 278, 50530–50536. 10.1074/jbc.M304417200. [DOI] [PubMed] [Google Scholar]
- 53.Rasmussen SG, DeVree BT, Zou Y, Kruse AC, Chung KY, Kobilka TS, Thian FS, Chae PS, Pardon E, Calinski D, Mathiesen JM, Shah ST, Lyons JA, Caffrey M, Gellman SH, Steyaert J, Skiniotis G, Weis WI, Sunahara RK, and Kobilka BK (2011). Crystal structure of the beta2 adrenergic receptor-Gs protein complex. Nature 477, 549–555. 10.1038/nature10361. [DOI] [PMC free article] [PubMed] [Google Scholar]
- 54.Mahoney JP, and Sunahara RK (2016). Mechanistic insights into GPCR-G protein interactions. Current opinion in structural biology 41, 247–254. 10.1016/j.sbi.2016.11.005. [DOI] [PMC free article] [PubMed] [Google Scholar]
- 55.Goedhart J, van Weeren L, Adjobo-Hermans MJ, Elzenaar I, Hink MA, and Gadella TW Jr. (2011). Quantitative co-expression of proteins at the single cell level--application to a multimeric FRET sensor. PloS one 6, e27321. 10.1371/journal.pone.0027321. [DOI] [PMC free article] [PubMed] [Google Scholar]
- 56.Kriz A, Schmid K, Baumgartner N, Ziegler U, Berger I, Ballmer-Hofer K, and Berger P (2010). A plasmid-based multigene expression system for mammalian cells. Nat Commun 1, 120. 10.1038/ncomms1120. [DOI] [PubMed] [Google Scholar]
- 57.Bochkov YA, and Palmenberg AC (2006). Translational efficiency of EMCV IRES in bicistronic vectors is dependent upon IRES sequence and gene location. BioTechniques 41, 283–292. 10.2144/000112243. [DOI] [PubMed] [Google Scholar]
- 58.van Unen J, Stumpf AD, Schmid B, Reinhard NR, Hordijk PL, Hoffmann C, Gadella TW Jr., and Goedhart J (2016). A New Generation of FRET Sensors for Robust Measurement of Galphai1, Galphai2 and Galphai3 Activation Kinetics in Single Cells. PloS one 11, e0146789. 10.1371/journal.pone.0146789. [DOI] [PMC free article] [PubMed] [Google Scholar]
- 59.Johnston CA, Lobanova ES, Shavkunov AS, Low J, Ramer JK, Blaesius R, Fredericks Z, Willard FS, Kuhlman B, Arshavsky VY, and Siderovski DP (2006). Minimal determinants for binding activated G alpha from the structure of a G alpha(i1)-peptide dimer. Biochemistry 45, 11390–11400. 10.1021/bi0613832. [DOI] [PMC free article] [PubMed] [Google Scholar]
- 60.Gibson SK, and Gilman AG (2006). Gialpha and Gbeta subunits both define selectivity of G protein activation by alpha2-adrenergic receptors. Proceedings of the National Academy of Sciences of the United States of America 103, 212–217. 10.1073/pnas.0509763102. [DOI] [PMC free article] [PubMed] [Google Scholar]
- 61.Day PW, Carman CV, Sterne-Marr R, Benovic JL, and Wedegaertner PB (2003). Differential interaction of GRK2 with members of the G alpha q family. Biochemistry 42, 9176–9184. 10.1021/bi034442+. [DOI] [PubMed] [Google Scholar]
- 62.Alexander SP, Christopoulos A, Davenport AP, Kelly E, Mathie A, Peters JA, Veale EL, Armstrong JF, Faccenda E, Harding SD, Pawson AJ, Southan C, Davies JA, Abbracchio MP, Alexander W, Al-Hosaini K, Back M, Barnes NM, Bathgate R, Beaulieu JM, Bernstein KE, Bettler B, Birdsall NJM, Blaho V, Boulay F, Bousquet C, Brauner-Osborne H, Burnstock G, Calo G, Castano JP, Catt KJ, Ceruti S, Chazot P, Chiang N, Chini B, Chun J, Cianciulli A, Civelli O, Clapp LH, Couture R, Csaba Z, Dahlgren C, Dent G, Singh KD, Douglas SD, Dournaud P, Eguchi S, Escher E, Filardo EJ, Fong T, Fumagalli M, Gainetdinov RR, Gasparo M, Gerard C, Gershengorn M, Gobeil F, Goodfriend TL, Goudet C, Gregory KJ, Gundlach AL, Hamann J, Hanson J, Hauger RL, Hay DL, Heinemann A, Hollenberg MD, Holliday ND, Horiuchi M, Hoyer D, Hunyady L, Husain A, AP IJ, Inagami T, Jacobson KA, Jensen RT, Jockers R, Jonnalagadda D, Karnik S, Kaupmann K, Kemp J, Kennedy C, Kihara Y, Kitazawa T, Kozielewicz P, Kreienkamp HJ, Kukkonen JP, Langenhan T, Leach K, Lecca D, Lee JD, Leeman SE, Leprince J, Li XX, Williams TL, Lolait SJ, Lupp A, Macrae R, Maguire J, Mazella J, McArdle CA, Melmed S, Michel MC, Miller LJ, Mitolo V, Mouillac B, Muller CE, Murphy P, Nahon JL, Ngo T, Norel X, Nyimanu D, O’Carroll AM, Offermanns S, Panaro MA, Parmentier M, Pertwee RG, Pin JP, Prossnitz ER, Quinn M, Ramachandran R, Ray M, Reinscheid RK, Rondard P, Rovati GE, Ruzza C, Sanger GJ, Schoneberg T, Schulte G, Schulz S, Segaloff DL, Serhan CN, Stoddart LA, Sugimoto Y, Summers R, Tan VP, Thal D, Thomas WW, Timmermans P, Tirupula K, Tulipano G, Unal H, Unger T, Valant C, Vanderheyden P, Vaudry D, Vaudry H, Vilardaga JP, Walker CS, Wang JM, Ward DT, Wester HJ, Willars GB, Woodruff TM, Yao C, and Ye RD (2021). THE CONCISE GUIDE TO PHARMACOLOGY 2021/22: G protein-coupled receptors. British journal of pharmacology 178 Suppl 1, S27–S156. 10.1111/bph.15538. [DOI] [PubMed] [Google Scholar]
- 63.Faouzi A, Wang H, Zaidi SA, DiBerto JF, Che T, Qu Q, Robertson MJ, Madasu MK, El Daibani A, Varga BR, Zhang T, Ruiz C, Liu S, Xu J, Appourchaux K, Slocum ST, Eans SO, Cameron MD, Al-Hasani R, Pan YX, Roth BL, McLaughlin JP, Skiniotis G, Katritch V, Kobilka BK, and Majumdar S (2023). Structure-based design of bitopic ligands for the micro-opioid receptor. Nature 613, 767–774. 10.1038/s41586-022-05588-y. [DOI] [PMC free article] [PubMed] [Google Scholar]
- 64.Barros-Alvarez X, Nwokonko RM, Vizurraga A, Matzov D, He F, Papasergi-Scott MM, Robertson MJ, Panova O, Yardeni EH, Seven AB, Kwarcinski FE, Su H, Peroto MC, Meyerowitz JG, Shalev-Benami M, Tall GG, and Skiniotis G (2022). The tethered peptide activation mechanism of adhesion GPCRs. Nature 604, 757–762. 10.1038/s41586-022-04575-7. [DOI] [PMC free article] [PubMed] [Google Scholar]
- 65.Stoveken HM, Hajduczok AG, Xu L, and Tall GG (2015). Adhesion G protein-coupled receptors are activated by exposure of a cryptic tethered agonist. Proceedings of the National Academy of Sciences of the United States of America 112, 6194–6199. 10.1073/pnas.1421785112. [DOI] [PMC free article] [PubMed] [Google Scholar]
- 66.Mathiasen S, Palmisano T, Perry NA, Stoveken HM, Vizurraga A, McEwen DP, Okashah N, Langenhan T, Inoue A, Lambert NA, Tall GG, and Javitch JA (2020). G12/13 is activated by acute tethered agonist exposure in the adhesion GPCR ADGRL3. Nature chemical biology 16, 1343–1350. 10.1038/s41589-020-0617-7. [DOI] [PMC free article] [PubMed] [Google Scholar]
- 67.Barman R, Majumder P, Doifode T, and Kablinger A (2021). Newer antipsychotics: Brexpiprazole, cariprazine, and lumateperone: A pledge or another unkept promise? World J Psychiatry 11, 1228–1238. 10.5498/wjp.v11.i12.1228. [DOI] [PMC free article] [PubMed] [Google Scholar]
- 68.Kenji M, Haruhiko S, Hitomi A, Naoki A, Jun S, Takashi F, Hiroshi Y, Nobuaki I, Robert DM, Arne M, Alan LP, Morten H, Vibeke N, Christoffer B, Jørn A, Tine Bryan S, and Tetsuro K (2014). Brexpiprazole I: In Vitro and In Vivo Characterization of a Novel Serotonin-Dopamine Activity Modulator. Journal of Pharmacology and Experimental Therapeutics 350, 589. 10.1124/jpet.114.213793. [DOI] [PubMed] [Google Scholar]
- 69.Szewczak MR, Corbett R, Rush DK, Wilmot CA, Conway PG, Strupczewski JT, and Cornfeldt M (1995). The pharmacological profile of iloperidone, a novel atypical antipsychotic agent. Journal of Pharmacology and Experimental Therapeutics 274, 1404. [PubMed] [Google Scholar]
- 70.Kalkman HO, Subramanian N, and Hoyer D (2001). Extended radioligand binding profile of iloperidone: a broad spectrum dopamine/serotonin/norepinephrine receptor antagonist for the management of psychotic disorders. Neuropsychopharmacology : official publication of the American College of Neuropsychopharmacology 25, 904914. 10.1016/S0893-133X(01)00285-8. [DOI] [PubMed] [Google Scholar]
- 71.Gyertyán I, Kiss B, Sághy K, Laszy J, Szabó G, Szabados T, Gémesi LI, Pásztor G, Zájer-Balázs M, Kapás M, Csongor ÉÁ, Domány G, Tihanyi K, and Szombathelyi Z (2011). Cariprazine (RGH-188), a potent D3/D2 dopamine receptor partial agonist, binds to dopamine D3 receptors in vivo and shows antipsychotic-like and procognitive effects in rodents. Neurochemistry International 59, 925–935. 10.1016/j.neuint.2011.07.002. [DOI] [PubMed] [Google Scholar]
- 72.Insel PA, Tang CM, Hahntow I, and Michel MC (2007). Impact of GPCRs in clinical medicine: monogenic diseases, genetic variants and drug targets. Biochim Biophys Acta 1768, 994–1005. 10.1016/j.bbamem.2006.09.029. [DOI] [PMC free article] [PubMed] [Google Scholar]
- 73.Hauser AS, Chavali S, Masuho I, Jahn LJ, Martemyanov KA, Gloriam DE, and Babu MM (2018). Pharmacogenomics of GPCR Drug Targets. Cell 172, 41–54 e19. 10.1016/j.cell.2017.11.033. [DOI] [PMC free article] [PubMed] [Google Scholar]
- 74.Schoneberg T, and Liebscher I (2021). Mutations in G Protein-Coupled Receptors: Mechanisms, Pathophysiology and Potential Therapeutic Approaches. Pharmacol Rev 73, 89–119. 10.1124/pharmrev.120.000011. [DOI] [PubMed] [Google Scholar]
- 75.Hauser AS, Avet C, Normand C, Mancini A, Inoue A, Bouvier M, and Gloriam DE (2022). Common coupling map advances GPCR-G protein selectivity. Elife 11. 10.7554/eLife.74107. [DOI] [PMC free article] [PubMed] [Google Scholar]
- 76.Pandy-Szekeres G, Caroli J, Mamyrbekov A, Kermani AA, Keseru GM, Kooistra AJ, and Gloriam DE (2023). GPCRdb in 2023: state-specific structure models using AlphaFold2 and new ligand resources. Nucleic acids research 51, D395–D402. 10.1093/nar/gkac1013. [DOI] [PMC free article] [PubMed] [Google Scholar]
- 77.Dalile B, Van Oudenhove L, Vervliet B, and Verbeke K (2019). The role of short-chain fatty acids in microbiota-gut-brain communication. Nature reviews. Gastroenterology & hepatology 16, 461–478. 10.1038/s41575-0190157-3. [DOI] [PubMed] [Google Scholar]
- 78.Tan J, McKenzie C, Potamitis M, Thorburn AN, Mackay CR, and Macia L (2014). The role of short-chain fatty acids in health and disease. Advances in immunology 121, 91–119. 10.1016/B978-0-12-800100-4.00003-9. [DOI] [PubMed] [Google Scholar]
- 79.Tang C, and Offermanns S (2017). FFA2 and FFA3 in Metabolic Regulation. Handbook of experimental pharmacology 236, 205–220. 10.1007/164_2016_50. [DOI] [PubMed] [Google Scholar]
- 80.Brown AJ, Goldsworthy SM, Barnes AA, Eilert MM, Tcheang L, Daniels D, Muir AI, Wigglesworth MJ, Kinghorn I, Fraser NJ, Pike NB, Strum JC, Steplewski KM, Murdock PR, Holder JC, Marshall FH, Szekeres PG, Wilson S, Ignar DM, Foord SM, Wise A, and Dowell SJ (2003). The Orphan G protein-coupled receptors GPR41 and GPR43 are activated by propionate and other short chain carboxylic acids. The Journal of biological chemistry 278, 11312–11319. 10.1074/jbc.M211609200. [DOI] [PubMed] [Google Scholar]
- 81.Taggart AK, Kero J, Gan X, Cai TQ, Cheng K, Ippolito M, Ren N, Kaplan R, Wu K, Wu TJ, Jin L, Liaw C, Chen R, Richman J, Connolly D, Offermanns S, Wright SD, and Waters MG (2005). (D)-beta-Hydroxybutyrate inhibits adipocyte lipolysis via the nicotinic acid receptor PUMA-G. The Journal of biological chemistry 280, 26649–26652. 10.1074/jbc.C500213200. [DOI] [PubMed] [Google Scholar]
- 82.Smith E, Chase P, Niswender CM, Utley TJ, Sheffler DJ, Noetzel MJ, Lamsal A, Wood MR, Conn PJ, Lindsley CW, Madoux F, Acosta M, Scampavia L, Spicer T, and Hodder P (2015). Application of Parallel Multiparametric Cell-Based FLIPR Detection Assays for the Identification of Modulators of the Muscarinic Acetylcholine Receptor 4 (M4). Journal of biomolecular screening 20, 858–868. 10.1177/1087057115581770. [DOI] [PMC free article] [PubMed] [Google Scholar]
- 83.Liu K, Southall N, Titus SA, Inglese J, Eskay RL, Shinn P, Austin CP, Heilig MA, and Zheng W (2010). A multiplex calcium assay for identification of GPCR agonists and antagonists. Assay and drug development technologies 8, 367–379. 10.1089/adt.2009.0245. [DOI] [PMC free article] [PubMed] [Google Scholar]
- 84.Lan KL, Sarvazyan NA, Taussig R, Mackenzie RG, DiBello PR, Dohlman HG, and Neubig RR (1998). A point mutation in Galphao and Galphai1 blocks interaction with regulator of G protein signaling proteins. The Journal of biological chemistry 273, 12794–12797. 10.1074/jbc.273.21.12794. [DOI] [PubMed] [Google Scholar]
- 85.Lambert NA, Johnston CA, Cappell SD, Kuravi S, Kimple AJ, Willard FS, and Siderovski DP (2010). Regulators of G-protein signaling accelerate GPCR signaling kinetics and govern sensitivity solely by accelerating GTPase activity. Proceedings of the National Academy of Sciences of the United States of America 107, 7066–7071. 10.1073/pnas.0912934107. [DOI] [PMC free article] [PubMed] [Google Scholar]
- 86.Locht C, Coutte L, and Mielcarek N (2011). The ins and outs of pertussis toxin. FEBS J 278, 4668–4682. 10.1111/j.1742-4658.2011.08237.x. [DOI] [PubMed] [Google Scholar]
- 87.Takasaki J, Saito T, Taniguchi M, Kawasaki T, Moritani Y, Hayashi K, and Kobori M (2004). A novel Galphaq/11-selective inhibitor. The Journal of biological chemistry 279, 47438–47445. 10.1074/jbc.M408846200. [DOI] [PubMed] [Google Scholar]
- 88.Frangogiannis NG (2021). Cardiac fibrosis. Cardiovasc Res 117, 1450–1488. 10.1093/cvr/cvaa324. [DOI] [PMC free article] [PubMed] [Google Scholar]
- 89.Hinderer S, and Schenke-Layland K (2019). Cardiac fibrosis - A short review of causes and therapeutic strategies. Adv Drug Deliv Rev 146, 77–82. 10.1016/j.addr.2019.05.011. [DOI] [PubMed] [Google Scholar]
- 90.Snead AN, and Insel PA (2012). Defining the cellular repertoire of GPCRs identifies a profibrotic role for the most highly expressed receptor, protease-activated receptor 1, in cardiac fibroblasts. FASEB journal : official publication of the Federation of American Societies for Experimental Biology 26, 4540–4547. 10.1096/fj.12213496. [DOI] [PMC free article] [PubMed] [Google Scholar]
- 91.Pawlinski R, Tencati M, Hampton CR, Shishido T, Bullard TA, Casey LM, Andrade-Gordon P, Kotzsch M, Spring D, Luther T, Abe J, Pohlman TH, Verrier ED, Blaxall BC, and Mackman N (2007). Protease-activated receptor-1 contributes to cardiac remodeling and hypertrophy. Circulation 116, 2298–2306. 10.1161/CIRCULATIONAHA.107.692764. [DOI] [PMC free article] [PubMed] [Google Scholar]
- 92.Sonin DL, Wakatsuki T, Routhu KV, Harmann LM, Petersen M, Meyer J, and Strande JL (2013). Protease-activated receptor 1 inhibition by SCH79797 attenuates left ventricular remodeling and profibrotic activities of cardiac fibroblasts. Journal of cardiovascular pharmacology and therapeutics 18, 460–475. 10.1177/1074248413485434. [DOI] [PMC free article] [PubMed] [Google Scholar]
- 93.Chambers RC, and Laurent GJ (2002). Coagulation cascade proteases and tissue fibrosis. Biochemical Society transactions 30, 194–200. [DOI] [PubMed] [Google Scholar]
- 94.Chambers RC, and Scotton CJ (2012). Coagulation cascade proteinases in lung injury and fibrosis. Proceedings of the American Thoracic Society 9, 96–101. 10.1513/pats.201201-006AW. [DOI] [PubMed] [Google Scholar]
- 95.Biernacka A, Dobaczewski M, and Frangogiannis NG (2011). TGF-beta signaling in fibrosis. Growth Factors 29, 196–202. 10.3109/08977194.2011.595714. [DOI] [PMC free article] [PubMed] [Google Scholar]
- 96.Meng XM, Nikolic-Paterson DJ, and Lan HY (2016). TGF-beta: the master regulator of fibrosis. Nat Rev Nephrol 12, 325–338. 10.1038/nrneph.2016.48. [DOI] [PubMed] [Google Scholar]
- 97.Soto AG, Smith TH, Chen B, Bhattacharya S, Cordova IC, Kenakin T, Vaidehi N, and Trejo J (2015). N-linked glycosylation of protease-activated receptor-1 at extracellular loop 2 regulates G-protein signaling bias. Proceedings of the National Academy of Sciences of the United States of America 112, E3600–3608. 10.1073/pnas.1508838112. [DOI] [PMC free article] [PubMed] [Google Scholar]
- 98.Neubig RR (1994). Membrane organization in G-protein mechanisms. FASEB journal : official publication of the Federation of American Societies for Experimental Biology 8, 939–946. 10.1096/fasebj.8.12.8088459. [DOI] [PubMed] [Google Scholar]
- 99.Weiss JM, Morgan PH, Lutz MW, and Kenakin TP (1996). The cubic ternary complex receptor-occupancy model. III. resurrecting efficacy. Journal of theoretical biology 181, 381–397. 10.1006/jtbi.1996.0139. [DOI] [PubMed] [Google Scholar]
- 100.Nobles M, Benians A, and Tinker A (2005). Heterotrimeric G proteins precouple with G protein-coupled receptors in living cells. Proceedings of the National Academy of Sciences of the United States of America 102, 18706–18711. 10.1073/pnas.0504778102. [DOI] [PMC free article] [PubMed] [Google Scholar]
- 101.Qin K, Dong C, Wu G, and Lambert NA (2011). Inactive-state preassembly of G(q)-coupled receptors and G(q) heterotrimers. Nature chemical biology 7, 740–747. 10.1038/nchembio.642. [DOI] [PMC free article] [PubMed] [Google Scholar]
- 102.Desai AJ, Dong M, Harikumar KG, and Miller LJ (2016). Cholecystokinin-induced satiety, a key gut servomechanism that is affected by the membrane microenvironment of this receptor. International journal of obesity supplements 6, S22–S27. 10.1038/ijosup.2016.5. [DOI] [PMC free article] [PubMed] [Google Scholar]
- 103.Potter RM, Harikumar KG, Wu SV, and Miller LJ (2012). Differential sensitivity of types 1 and 2 cholecystokinin receptors to membrane cholesterol. Journal of lipid research 53, 137–148. 10.1194/jlr.M020065. [DOI] [PMC free article] [PubMed] [Google Scholar]
- 104.Duncan AL, Song W, and Sansom MSP (2020). Lipid-Dependent Regulation of Ion Channels and G Protein-Coupled Receptors: Insights from Structures and Simulations. Annual review of pharmacology and toxicology 60, 31–50. 10.1146/annurev-pharmtox-010919-023411. [DOI] [PubMed] [Google Scholar]
- 105.Yen HY, Hoi KK, Liko I, Hedger G, Horrell MR, Song W, Wu D, Heine P, Warne T, Lee Y, Carpenter B, Pluckthun A, Tate CG, Sansom MSP, and Robinson CV (2018). PtdIns(4,5)P2 stabilizes active states of GPCRs and enhances selectivity of G-protein coupling. Nature 559, 423–427. 10.1038/s41586-018-0325-6. [DOI] [PMC free article] [PubMed] [Google Scholar]
- 106.Hay DL, and Pioszak AA (2016). Receptor Activity-Modifying Proteins (RAMPs): New Insights and Roles. Annual review of pharmacology and toxicology 56, 469–487. 10.1146/annurev-pharmtox-010715-103120. [DOI] [PMC free article] [PubMed] [Google Scholar]
- 107.Christopoulos A, Christopoulos G, Morfis M, Udawela M, Laburthe M, Couvineau A, Kuwasako K, Tilakaratne N, and Sexton PM (2003). Novel receptor partners and function of receptor activity-modifying proteins. The Journal of biological chemistry 278, 3293–3297. 10.1074/jbc.C200629200. [DOI] [PubMed] [Google Scholar]
- 108.Lorenzen E, Dodig-Crnkovic T, Kotliar IB, Pin E, Ceraudo E, Vaughan RD, Uhlen M, Huber T, Schwenk JM, and Sakmar TP (2019). Multiplexed analysis of the secretin-like GPCR-RAMP interactome. Science advances 5, eaaw2778. 10.1126/sciadv.aaw2778. [DOI] [PMC free article] [PubMed] [Google Scholar]
- 109.Ross EM, and Wilkie TM (2000). GTPase-activating proteins for heterotrimeric G proteins: regulators of G protein signaling (RGS) and RGS-like proteins. Annual review of biochemistry 69, 795–827. [DOI] [PubMed] [Google Scholar]
- 110.Willard FS, Kimple RJ, and Siderovski DP (2004). Return of the GDI: the GoLoco motif in cell division. Annual review of biochemistry 73, 925–951. 10.1146/annurev.biochem.73.011303.073756. [DOI] [PubMed] [Google Scholar]
- 111.DiGiacomo V, Marivin A, and Garcia-Marcos M (2018). When Heterotrimeric G Proteins Are Not Activated by G Protein-Coupled Receptors: Structural Insights and Evolutionary Conservation. Biochemistry 57, 255–257. 10.1021/acs.biochem.7b00845. [DOI] [PMC free article] [PubMed] [Google Scholar]
- 112.Cismowski MJ, Ma C, Ribas C, Xie X, Spruyt M, Lizano JS, Lanier SM, and Duzic E (2000). Activation of heterotrimeric G-protein signaling by a ras-related protein. Implications for signal integration. The Journal of biological chemistry 275, 23421–23424. 10.1074/jbc.C000322200. [DOI] [PubMed] [Google Scholar]
- 113.Lee MJ, and Dohlman HG (2008). Coactivation of G protein signaling by cell-surface receptors and an intracellular exchange factor. Curr Biol 18, 211–215. [DOI] [PMC free article] [PubMed] [Google Scholar]
- 114.Tall GG (2013). Ric-8 regulation of heterotrimeric G proteins. Journal of receptor and signal transduction research 33, 139–143. 10.3109/10799893.2013.763828. [DOI] [PMC free article] [PubMed] [Google Scholar]
- 115.Sato M, Blumer JB, Simon V, and Lanier SM (2006). Accessory proteins for G proteins: partners in signaling. Annual review of pharmacology and toxicology 46, 151–187. 10.1146/annurev.pharmtox.46.120604.141115. [DOI] [PubMed] [Google Scholar]
- 116.Park JC, Luebbers A, Dao M, Semeano A, Nguyen AM, Papakonstantinou MP, Broselid S, Yano H, Martemyanov KA, and Garcia-Marcos M (2023). Fine-tuning GPCR-mediated neuromodulation by biasing signaling through different G protein subunits. Molecular cell. 10.1016/j.molcel.2023.06.006. [DOI] [PMC free article] [PubMed] [Google Scholar]
- 117.Masuho I, Skamangas NK, Muntean BS, and Martemyanov KA (2021). Diversity of the Gbetagamma complexes defines spatial and temporal bias of GPCR signaling. Cell systems 12, 324–337 e325. 10.1016/j.cels.2021.02.001. [DOI] [PMC free article] [PubMed] [Google Scholar]
- 118.Grynkiewicz G, Poenie M, and Tsien RY (1985). A new generation of Ca2+ indicators with greatly improved fluorescence properties. The Journal of biological chemistry 260, 3440–3450. [PubMed] [Google Scholar]
- 119.Alonso MT, Chamero P, Villalobos C, and Garcia-Sancho J (2003). Fura-2 antagonises calcium-induced calcium release. Cell calcium 33, 27–35. 10.1016/s0143-4160(02)00179-3. [DOI] [PubMed] [Google Scholar]
- 120.Greenwald EC, Mehta S, and Zhang J (2018). Genetically Encoded Fluorescent Biosensors Illuminate the Spatiotemporal Regulation of Signaling Networks. Chemical reviews 118, 11707–11794. 10.1021/acs.chemrev.8b00333. [DOI] [PMC free article] [PubMed] [Google Scholar]
- 121.Kaech S, and Banker G (2006). Culturing hippocampal neurons. Nat Protoc 1, 2406–2415. 10.1038/nprot.2006.356. [DOI] [PubMed] [Google Scholar]
- 122.Luchsinger LL, Patenaude CA, Smith BD, and Layne MD (2011). Myocardin-related transcription factor-A complexes activate type I collagen expression in lung fibroblasts. J Biol Chem 286, 44116–44125. 10.1074/jbc.M111.276931. [DOI] [PMC free article] [PubMed] [Google Scholar]
- 123.Zhang H, Tian L, Shen M, Tu C, Wu H, Gu M, Paik DT, and Wu JC (2019). Generation of Quiescent Cardiac Fibroblasts From Human Induced Pluripotent Stem Cells for In Vitro Modeling of Cardiac Fibrosis. Circ Res 125, 552–566. 10.1161/CIRCRESAHA.119.315491. [DOI] [PMC free article] [PubMed] [Google Scholar]
- 124.Leyme A, Marivin A, Maziarz M, DiGiacomo V, Papakonstantinou MP, Patel PP, Blanco-Canosa JB, Walawalkar IA, Rodriguez-Davila G, Dominguez I, and Garcia-Marcos M (2017). Specific inhibition of GPCRindependent G protein signaling by a rationally engineered protein. Proc Natl Acad Sci U S A 114, E10319–E10328. 10.1073/pnas.1707992114. [DOI] [PMC free article] [PubMed] [Google Scholar]
- 125.Marivin A, Leyme A, Parag-Sharma K, DiGiacomo V, Cheung AY, Nguyen LT, Dominguez I, and Garcia-Marcos M (2016). Dominant-negative Galpha subunits are a mechanism of dysregulated heterotrimeric G protein signaling in human disease. Sci Signal 9, ra37. 10.1126/scisignal.aad2429. [DOI] [PMC free article] [PubMed] [Google Scholar]
- 126.Fenech C, Patrikainen L, Kerr DS, Grall S, Liu Z, Laugerette F, Malnic B, and Montmayeur JP (2009). Ric-8A, a Galpha protein guanine nucleotide exchange factor potentiates taste receptor signaling. Front Cell Neurosci 3, 11. 10.3389/neuro.03.011.2009. [DOI] [PMC free article] [PubMed] [Google Scholar]
- 127.Marivin A, Ho RX, and Garcia-Marcos M (2022). DAPLE orchestrates apical actomyosin assembly from junctional polarity complexes. J Cell Biol 221. 10.1083/jcb.202111002. [DOI] [PMC free article] [PubMed] [Google Scholar]
- 128.Marivin A, Maziarz M, Zhao J, DiGiacomo V, Olmos Calvo I, Mann EA, Ear J, Blanco-Canosa JB, Ross EM, Ghosh P, and Garcia-Marcos M (2020). DAPLE protein inhibits nucleotide exchange on Galpha(s) and Galpha(q) via the same motif that activates Galphai. J Biol Chem 295, 2270–2284. 10.1074/jbc.RA119.011648. [DOI] [PMC free article] [PubMed] [Google Scholar]
- 129.Garcia-Marcos M, Ghosh P, Ear J, and Farquhar MG (2010). A structural determinant that renders G alpha(i) sensitive to activation by GIV/girdin is required to promote cell migration. J Biol Chem 285, 12765–12777. 10.1074/jbc.M109.045161. [DOI] [PMC free article] [PubMed] [Google Scholar]
- 130.Zhang JH, Chung TD, and Oldenburg KR (1999). A Simple Statistical Parameter for Use in Evaluation and Validation of High Throughput Screening Assays. Journal of biomolecular screening 4, 67–73. 10.1177/108705719900400206. [DOI] [PubMed] [Google Scholar]
- 131.Longo PA, Kavran JM, Kim MS, and Leahy DJ (2013). Transient mammalian cell transfection with polyethylenimine (PEI). Methods Enzymol 529, 227–240. 10.1016/B978-0-12-418687-3.00018-5. [DOI] [PMC free article] [PubMed] [Google Scholar]
- 132.Janicot R, Park JC, and Garcia-Marcos M (2023). Detecting GPCR Signals With Optical Biosensors of Galpha-GTP in Cell Lines and Primary Cell Cultures. Current protocols 3, e796. 10.1002/cpz1.796. [DOI] [PMC free article] [PubMed] [Google Scholar]
- 133.Livak KJ, and Schmittgen TD (2001). Analysis of relative gene expression data using real-time quantitative PCR and the 2(-Delta Delta C(T)) Method. Methods 25, 402–408. 10.1006/meth.2001.1262. [DOI] [PubMed] [Google Scholar]
Associated Data
This section collects any data citations, data availability statements, or supplementary materials included in this article.
Supplementary Materials
Figure S1. Live-cell Gαs activity biosensor design, Related to Figure 1.
(A, B) Identification of optimal acceptor design for Gαs-GTP biosensors based on KB1691-Nluc and KB2123-Nluc. BRET responses were measured in HEK293T cells expressing KB1691-Nluc or KB2123-Nluc along with Gβ1, Gγ2, Gαs (short isoform) tagged with Venus at three different internal positions (67V, 99V, or 154V), and with (orange) or without (black) co-expression of Ric-8B. Results are the mean ± S.E.M. of n=3–4. A representative immunoblot showing the expression of the different components of the biosensor is presented on the right.
(C) Biosensors based on KB1691 or KB2123 detect Gαs activation by D1R. BRET responses were measured in HEK293T cells expressing D1R, Gβ1, Gγ2, Gαs-99V and either KB1691-Nluc or KB2123-Nluc. Results are the mean ± S.E.M. of n=3–5.
(D) Bystander BRET biosensor design for active Gαs using KB1691-Nluc. Left, schematic representation of bystander BRET sensor system. KB1691-Nluc without any targeting sequence is expressed in the cytosol but is recruited to the plasma membrane upon GPCR-mediated activation of Gαs. A membrane-anchored Venus serves as the bystander BRET acceptor for KB1691-Nluc after translocation. Right, BRET was measured in HEK293T cells expressing the β2AR, untagged Gαs, cytosolic KB1691-Nluc, and a membrane anchored Venus. Results are the mean ± S.E.M. of n=4.
(E) Detection of Gαi, Gαq and Gα13 activation with previously described biosensors. BRET responses were measured in HEK293T cells expressing the indicated combination of cognate GPCR, G protein, and Gα-GTP detector modules fused to Nluc. All Gα subunits were internally tagged with a YFP and they were co-transfected with Gβ1 and Gγ2. Experiments were done in parallel to those in Fig. 1C with the same stimulation conditions to serve as positive controls. Results are the mean ± S.E.M. of n=4–5.
Figure S2. Contribution of the C-terminal tail (CT) and the αN/β1 ‘hinge’ of Gα subunits to their coupling to GPCRs, Related to Figure 2. BRET was measured in HEK293T cells expressing the indicated combinations of GPCR, G protein and Gα-GTP detector modules fused to Nluc. All Gα subunits were internally tagged with a YFP and they were co-transfected with Gβ1, Gγ2, and either KB1691-Nluc (Gαs-GTP biosensor) or KB1753-Nluc (Gαi-GTP biosensor). Results are the mean ± S.E.M. of n=3–5.
Figure S3. Gαs biosensor performance with or without expression of exogenous Gβγ and ONE-GO biosensor optimization, Related to Figure 3.
(A) Top, schematic of the reduction of Gαs-GTP biosensor components from five to three. Bottom, BRET was measured in HEK293T cells co-expressing KB1691-Nluc, Gαs-99V, Ric-8B, and the indicated GPCR (β2AR or D1R) with (black) or without (orange) exogenous Gβ1 and Gγ2. Results are the mean ± S.E.M. of n=3–5.
(B) Gαs and Gαi3 ONE-GO biosensor designs. Two designs using a stronger or weaker promoter (CMV or SV40, respectively) were investigated for both Gαs and Gαi3 biosensors. In all cases, the Gα-YFP component was placed right after the promoter and the membrane-anchored Nluc-fused component after a modified IRES (IRES*) of low efficiency to achieve higher acceptor-to-donor BRET ratios. BRET was measured in HEK293T cells transfected with different amounts of the indicated single-plasmid ONE-GO biosensors or their multi-plasmid (M-P) counterparts. β2AR or α2A-AR were co-expressed for Gαs or Gαi3, respectively. Results are the mean of n=2–3. A representative immunoblot showing expression of biosensor components is presented on the bottom left.
(C) Gβγ ONE-GO biosensor designs. All constructs were based on a CMV promoter. Untagged Gα subunits were placed right after the promoter, followed by the Gβγ detector mas-GRK3ct-Nluc, Gβ1 and Venus tagged Gγ2 (separated by self-cleaving T2A sequences) after a high efficiency IRES (IRESWT). This favors the expression of Gα and Gβγ at similar level to facilitate their assembly into a functional heterotrimer. BRET was measured in HEK293T cells expressing the indicated combination of Gα/Gβγ ONE-GO biosensor and GPCR. Results are representative traces of an individual experiment.
Figure S4. Expression of biosensor components does not affect Gβγ association or dissociation and does not interfere with Gq/PKC/ERK signaling, Related to Figures 3, 4.
(A) Expression of Gα-binding peptides used as detector modules in the ONE-GO biosensors does not affect Gβγ association with Gα or their dissociation upon GPCR stimulation. Left, BRET was measured in HEK293T cells expressing the components of a biosensor for free Gβγ and the indicated amounts of plasmids encoding mas-KB1691-mKate2 or mas-KB1753-mKate2, which were paired with β2AR/Gαs or α2A-AR/Gαi expression, respectively. Measurements were carried out with or without the indicated GPCR agonists. Results are mean ± S.E.M. of n=4. Middle, kinetic BRET measurements in HEK293T cells transfected as in the left panels in the presence of 100 ng of mas-KB1691-mKate2 or mas-KB1753-mKate2. Results are mean ± S.D. of n=3. Right, Representative immunoblot to confirming increasing expression of detector peptides and no changes in the expression of components of the free Gβγ biosensor.
(B) Expression of the Gαq ONE-GO sensor does not affect ERK1/2 activation downstream of Gq activation by a GPCR. HEK293T cells expressing the M3R, with or without expression of the Gαq ONE-GO biosensor were stimulated (or not) with carbachol for 5 min as indicated. In some cases, cells were pretreated for 5 minutes with the selective Gq inhibitor YM-254890, as indicated. A representative immunoblot is shown, and the graph is the quantification of ERK1/2 activation (phosphor/total ratio) corresponding to the mean ± S.E.M. of n=3.
Figure S5. Large-scale parallel interrogation of GPCR activity with ONE-GO biosensors, Related to Figure 5.
(A) Pharmacogenomic profiles of atypical antipsychotics. Left, schematic of the assay. Right, BRET responses were measured in HEK293T cells expressing the indicated GPCRs and ONE-GO biosensors upon stimulation with the indicated concentrations of antipsychotic drug, of cognate agonist, or a combination of both, as shown. Results are the mean of n=3–7.
(B) Profiling of G protein selectivity across short-chain fatty acid receptors. Left, BRET responses were measured in HEK293T cells expressing the indicated combination of GPCR and ONE-GO biosensor upon stimulation with different short chain fatty acids, as shown. Results are the mean ± S.E.M. of n=4–6. Right, heatmaps represent maximal responses normalized by biosensor and pEC50 values calculated from concentration dependent curve fits presented on the left.
(C) Time-resolved parallel interrogation of GPCR responses. Left, schematic of the assay. Middle, BRET was measured in HEK293T cells expressing the α2A-AR and the Gαi3 ONE-GO biosensor, which were treated with ligands as indicated. The graph on the left is a representative experiment of 48 simultaneously kinetic measurements (thin traces are individual wells and the thick line is the average). The graph on the right is a scatter plot of Z’ values of 3 individual 48-condition recordings (i.e., in 3 plates) repeated in 2 independent experiments. Right, BRET was measured in HEK293T cells expressing the GABABR and ONE-GO biosensor for either Gαi3 (black traces) or for Gαi3 G183S (red traces). Results are 24 kinetic measurements for each G protein carried out simultaneously (thin traces are individual wells and the thick line is the average) from one representative experiment of 3.
Figure S6. Detection of endogenous GPCR activity in cell lines with ONE-GO biosensors, Related to Figure 6.
(A-B) Detection of endogenous GPCR activity in HeLa cells stably expressing ONE-GO biosensors. Top, generation of HeLa cells stably expressing high or low levels of either Gαi3 ONE-GO (A) or Gαi3/Gβγ ONE-GO (B) biosensors by lentiviral transduction followed by FACS. A representative immunoblotting result to confirm the relative expression of biosensor components and endogenous G proteins is shown on the bottom left. Bottom, BRET was measured in HeLa cells stably expressing either the Gαi3 ONE-GO or the Gαi3/Gβγ ONEGO sensor, and treated with ligands as indicated. The black traces in the insets correspond to previously described30 BRET responses detected in HeLa cells expressing another biosensor for the same G proteins (Gαi*-BERKY3 in A and Gβγ-BERKY3 in B) upon stimulation of endogenous α2 adrenergic receptors. Results are the mean ± S.E.M. of n=2–3.
(C) Detection of endogenous opioid receptor activation in SH-SY5Y cells acutely transduced with a ONE-GO biosensor. BRET was measured in parallel either in SH-SY5Y cells acutely transduced with a lentivirus for the expression of Gαi3 ONE-GO biosensor (orange), or in a previously established30 SH-SY5Y line stably expressing the Gαi*-BERKY3 biosensor (green) upon stimulation with the μ-opioid receptor agonist DAMGO. Results are the mean ± S.E.M. of n=4. The immunoblot shows the expression of ONE-GO biosensor components and endogenous Gαi3.
Figure S7. Endogenous GPCR responses and respective controls detected with ONE-GO biosensors in various primary cell types, Related to Figure 6.
BRET was measured in the indicated cell types after acute transduction with lentiviruses for the expression of different ONE-GO biosensors, as indicated. Cells were stimulated with agonists as indicated during the BRET recordings. In some cases, cells were pre-treated with the indicated GPCR antagonists (green and orange) or the Gq/11 inhibitor YM-254890 (blue) for two minutes before initiating the measurements, or with pertussis toxin (Ptx, red) overnight. Results are the mean ± S.E.M. of n=4–6.
Supplemental item 1_ONE-GO biosensor sequences, Related to Fig. 4.
Supplemental item 2_Concentration dependence curves for 72 GPCRs, Related to Fig. 4.
Supplemental item 3_IUPHAR vs ONE-GO pEC50, Related to Fig. 4.
Supplemental item 4_Neuropeptide MOR LogEC50s, Related to Fig. 4.
Supplemental item 5_Antipsycotics profiling, Mean, SD, Related to Fig. 5.
Supplemental item 6_Pharmacogenomic profiling of antipsychotics. Mean, SD, Related to Fig. S5.
Supplemental item 7_SCFA profiling. LogEC50s, Related to Fig. S5.
Data Availability Statement
Gel and membrane original scans from all Figures were deposited on Mendeley at http://dx.doi.org/10.17632/9tjcy8rg4t.1.
This paper does not report original code.
Any additional information required to reanalyze the data reported in this paper is available from the lead contact upon request.