

Abstract
Prior studies identified variable associations between competitive food and beverage policies (CF&B) and youth obesity, potentially due to differences across population subgroups. This review summarizes the evidence on associations between CF&B policies and childhood obesity within gender, grade/school age, race/ethnicity, and/or socioeconomic levels. PubMed, EMBASE, CINAHL and ERIC database searches identified studies published in English in Canada and the US between January 01, 2000 and February 28, 2022. Of the eighteen selected studies, 6 were cross-sectional, 2 correlational, 9 were before/after designs and 1 study utilized both a cross-sectional and pre-post design. Twelve studies reported findings stratified by a single sociodemographic factor, with grade level/age as the most frequently reported. Although the evidence varied, greater consistency in direction of associations and strengths of evidence were seen among middle school students. Six studies reported findings jointly by multiple socio-demographic subgroups with evidence suggesting CF&B associations with slower rate of increase, plateaus or declines in obesity among multiple subgroups, though the strengths of evidence varied. Over the past two decades, there have been relatively limited subgroup analyses on studies about CF&B policies and childhood obesity. Studies are needed with stronger designs and analyses diss-aggregated, particularly by race/ethnicities and socioeconomic factors, across places and time.
Keywords: nutrition policies, obesity, demographic subgroups
Introduction
Childhood obesity has reached epidemic proportions1 with alarming increases particularly among school-age youth.2–5 In response to the epidemic, the National Academies and other authoritative entities recommend policies to regulate the food environment in schools, where children spend approximately 6 hours6,7 per day and consume at least 40% of their daily calories.8,9 Since the early 2000s, local and state governments including in the United States (US) and Canada10,11 enacted policies to regulate “competitive” foods and beverages (CF&B) such as candy, chips and sodas sold in schools, which compete with those available through the school meal programs. CF&B may be offered as part of a la carte entrees in the cafeteria, in vending machines, school fundraisers and school stores. Policies for CF&B place limits in the amount of sugar, saturated fat, trans fat, calories from fat, and sodium in entrées/snacks, ban certain beverages and/or restrict the sale of those items to certain times of the day and in different venues (e.g., in stores, vending machines).12,13 In 2010, as part of a layered strategy to improve school nutrition environments, CF&B policies (so called “Smart Snacks in Schools”) were enacted nationwide through the Healthy Hunger Free Kids Act (HHFKA).13
Given local, state and national policy activities targeting CF&B over the past two decades, corresponding research into CF&B policy effects, and the urgent need to identify effective interventions to reverse the childhood obesity epidemic,14,15 reviews of the evidence about the influences of CF&B policies on obesity are critically important. Prior systematic reviews reported mixed findings about CF&B policy associations with child weight status,16–19 though those reviews summarized evidence among children overall. The evidence has not been synthesized specifically for children of different sociodemographic subgroups, including gender, grade level or age, race/ethnicity, and socioeconomic factors. A review of the literature is needed about the influences of CF&B policies on obesity within children of different sociodemographic backgrounds. This synthesis of the evidence is especially relevant in the context of the nationwide Smart Snacks policies, and has the potential to inform future nutrition policy-decisions at the local, state and national levels, including the HHFKA. This is critically important because prior research has shown racial/ethnic and income differences in the availability of CF&B in schools, and child-level consumption of CF&B.20–26 Evidence also suggests the associations between CF&B policies, children’s diet and obesity may vary by race/ethnicity, gender, grade or socioeconomic factors.23,27–30 Thus, the objectives of this study are to: 1) describe the scope of this literature; and 2) systematically review the evidence of associations between CF&B policies and child weight status by gender, grade/school age, race/ethnicity, socioeconomic factors or a combination of these characteristics.
Methods
This review included published articles that investigated the associations between CF&B policies and obesity according to children’s socio-demographic factors. The outcome of interest was weight status, based on body mass index (BMI). PubMed, EMBASE, CINAHL and ERIC databases were systematically searched. The search terms are included in the Supplemental materials (Table S1). Studies were included if they 1) assessed associations between CF&B policies and self-reported (SR) or measured (M) weight status; 2) reported findings stratified by a single factor, reported an interaction by a single factor and/or reported findings stratified by multiple factors combined (e.g., by gender, grade/school age, race/ethnicity, and/or socioeconomic characteristics of schools or children); 3) were published between January 01, 2000 and February 28, 2022; 4) were written in English; and 5) used child samples from the US and Canada. Studies were included if they examined CF&B policy-weight status associations among any of the sociodemographic subgroups e.g., only included boys or elementary school students. Intervention studies, systematic reviews, studies of samples outside the US and Canada and outside the K-12 grades, and those that did not examine CF&B policy in relation to obesity were excluded.
Two researchers independently reviewed the search results from all databases. Four reviewers discussed the final list of the articles to be included in the current review. The references of the selected articles were manually checked to identify additional relevant articles not identified in the searches. The following data were extracted by two researchers: year of publication, study design, sample size, age/grade, study location, description of the CF&B policies, definition and measurement of weight status, and effect estimates. Two researchers reviewed the extracted data against the selected published articles and resolved inconsistencies. The quality of the selected articles was assessed using the modified versions of the Quality Assessment Tools for Observational Cohort and Cross Sectional Studies and Before-After (Pre-Post) Studies with no Control Group from the National Heart Lung and Blood Institute31,32 (Appendix Tables S2/S3). Meta analyses were unfeasible due to heterogeneity in study methodologies. Thus, we present a narrative review of the findings.
RESULTS
Of the 24,607 non-duplicative records identified in the initial searches, 37 were eligible for a full-text review (Figure 1). Of those papers, 18 met criteria for inclusion (Table 1). Two studies used child samples from Canada33,34 while the remaining papers were from the United States, using national samples, or samples from states and/or other localities, including school districts. Of the 18 selected studies, 12 reported results by single sociodemographic factors including gender, age, and/or race/ethnicity, while 6 studies reported findings jointly stratified by two more sociodemographic subgroups.
Figure 1:
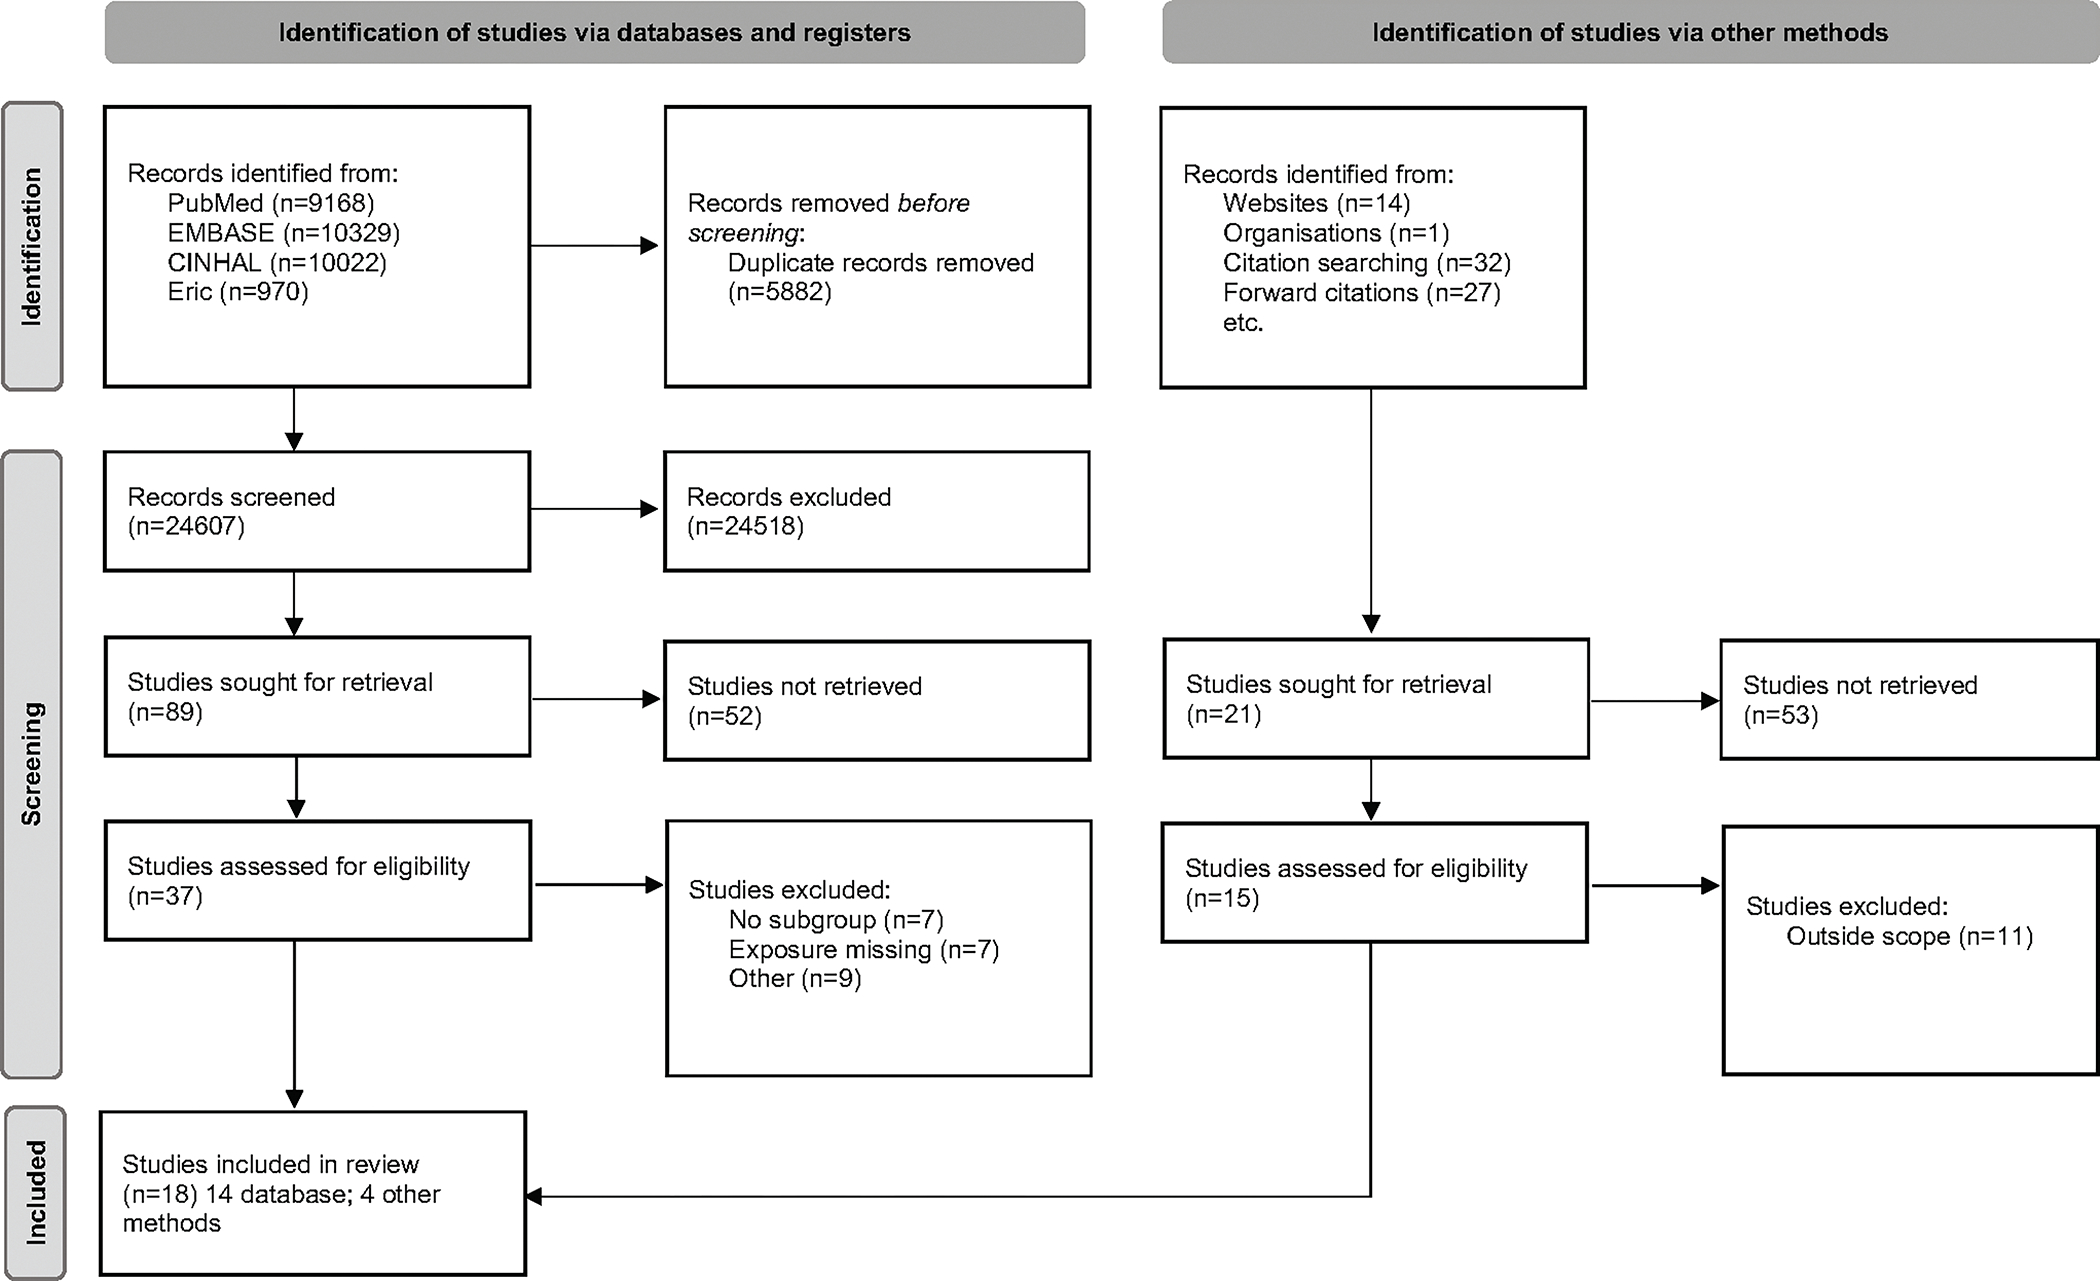
PRISMA 2020 flow diagram for systematic review, which included searches of databases, registers and other sources.
From: Page MJ, McKenzie JE, Bossuyt PM, Boutron I, Hoffmann TC, Mulrow CD, et al. The PRISMA 2020 statement: an updated guideline for reporting systematic reviews. BMJ 2021;372:n71. doi: 10.1136/bmj.n71. For more information, visit: http://www.prisma-statement.org/
Table 1.
Characteristics of the selected studies on associations between competitive food and beverage policies and weight status, reporting results by a single or multiple sociodemographic factors.
| Author/Year of publication | Country/State: Data source, Year of data collection | Sample size & Age/Grade & % minority/location | Outcome measurement methoda | Study Design | Subgroups analyzed separately or combined |
|---|---|---|---|---|---|
| Bauhoff, 2014 | State of California, Los Angeles Unified School District, Fitnessgram (2003, 2005; 2001, 2003 and 2005) for LAUSD and other school districts in the state (control group) | n = 133,244 & 173,582; 7th and 9th graders | M | Before & after difference-in-difference analysis with a synthetic control groupb | Gender; Gender & grade |
| Datar & Nicosia, 2017 | US (23 states): Military Teenagers Environment Exercise and Nutrition Study (M-TEENS) in Spring 2013 and Winter 2013–14. Linked Bridging the Gap policy data 2012–13 school year | n = 894 public school children 12–13 years old | SR | Cross-sectional (children assigned to state’s residence by military) | Age |
| Fung et al, 2013 | Canada: Nova-Scotia: CLASS (province-wide) study of students in 2003 and 2011 | n = 5,215 5th grade students in 2003 & 5508 5th grade students in 2011 | M | Before & after | 5th graders only |
| Gee, 2018 | US: Arkansas & Missouri; Youth Risk Behavior Survey 1999, 2001 (before), 2005, 2007 and 2009 (after) for relevant states | n = 7,492 (grade 9–12) from Arkansas & 7,871 from Missouri; 74% White, 24% Black | SR | Before & after with a comparison state; difference in difference | Grade |
| Hennessy et al, 2014 | US: National Survey of Children’s Health, 2007 linked with 2005 CLASS policy data | n = 16,271 children ages 11–14 years | SR | Cross-sectional | Grade |
| Hoffman et al, 2016 | US: Minnesota, District-level Minnesota Student Survey (2013) & Common Core Data (2012–2013); Wellness school assessment tool (WellSAT) scored in 2013–14 | n = 78,854; 270 school districts (out of a total of 325) Grades 9 and 11. District level: 38.9% free or reduced-price lunch | SR | Ecological (District-level) | Socio-economic advantage at the district-level |
| Jensen et al, 2012 | US: Rhode Island in-school student assessment data from 2006 and 2007 | 2 public middle schools n=444 students; 6th grade; 11–12 years old 79% White; 13% Black | M | Before & after | Gender |
| Leonard, 2017 | Canada: Six provinces Canadian Community Health Survey, conducted biannually from 2000–2007 and annually since 2007 (combined data from the 2000, 2003, 2005, and 2007–2013 cycles) | n = 153,230; children ages 12–26 years | SR | Cross-sectional | Gender; Age separately |
| Matsuzaki et al 2021 | US: California, Fitnessgram 2002–2016 | n = 12,620,300; 5th and 7th grade; ages 9 to 15 years | M | Before & after, Interrupted time series | Gender, grade & race/ethnicity |
| Matsuzaki et al, 2022 | US: California Fitnessgram, 2002–2010 | n = 3,272,748 in 3,017 schools; 7th grade; ages 11 to 15 years | M | Before & after, Interrupted time series | Gender & urbanicity |
| Nanney et al, 2016 | US: Minnesota Students Survey 2007 & 2013 linked with Minnesota Profiles Survey of the National School Health Profiles Survey (65% of schools in 2006 and 66% in 2012); Of 87 schools that completed the survey in both 2006 and 2012, 50 schools in final analytic sample | n = 7,237 9th grade in 2007 vs 6,791 9th grade in 2013; 86% rural location; 9.7% vs 14.4% minority enrollment; 29.6% vs 35% free or reduced-price lunch | SR | Correlational Cohort of schools followed over time (student data aggregated at school level) | Gender (9th only); Race/ethnicity; school-level student enrollment in free or reduced-price lunch |
| Palakshappa et al, 2016 | US: National Survey of Children’s Health 2003 and 2011–12 linked with 2010 CLASS data to assess policy exposure at the state level | n = 40,177, children ages 10–17 years ES (10 years) M (11–14 years) HS (15–17 years) 67.5% White 16.0% Black 19% Hispanic |
SR | Before & after | Grade |
| Riis et al, 2012 | US: National Survey of Children’s Health 2003 & 2007 linked with 2003–2006 School Nutrition Environment State Policy Classification System | n = 42,871 children ages 10–17 years ES: 4,451 MS:19,753 HS: 18,667 |
SR | Cross-sectional | Grade |
| Sanchez-Vaznaugh et al, 2010 | US: California Fitnessgram 2001–2008 | n = 575,549; 5th & 7th graders in Los Angeles and California | M | Before & after | Gender & grade |
| Sanchez-Vaznaugh et al, 2015 | US: California Fitnessgram, 2001–2010 | n = 3,175,781; 5th grade students; mean age: 10.5 years | M | Before & after | Gender & school-neighborhood income |
| Sanchez-Vaznaugh et al, 2021 | US: California Fitnessgram, 2002–2016 | n = 12,363,089 in 7,879 schools; 5th & 7th graders | M | Before & after, Interrupted time series | Gender, grade & race/ethnicity |
| Sanjeevi et al, 2020 | US: 21 states: NEXT Study, 2010 & 2012 assessment waves linked with CLASS data to assess policy exposure in 2010, 2011, and 2012 | n = 2,751; students in grades 10 and 12 | M | Cross-sectional | Grade |
| Taber et al, 2011 | US: 2007 Youth Risk Behavior Survey linked with 2000 and 2006 School Health Policies and Programs Study | n = 90,730; 9th–12th grade students Age 14 to 18+ years |
SR | Cross-sectional | Race/ethnicity: formally tested for differences in association |
M= measured height and weight; SR=Self-reported.
Synthetic control groups were constructed based on combinations of unaffected districts reweighted to resemble the treatment unit (LAUSD) in the pre-intervention period.
Table 2 summarizes the evidence reported separately by a single sociodemographic factor: gender, grade or age, race/ethnicity or socioeconomic indicators. Grade level or age33–41 was the most frequently reported demographic (n=9), whereas four studies reported results by gender,33,36,42,43 two papers reported findings by race/ethnicity,29,36 and two studies displayed results by socioeconomic factors,36,44 using eligibility for free or reduced-price lunch (FRPL) as a proxy (Figure 2). Six papers reported results jointly stratified by two or more sociodemographic dimensions.27,30,43,45–47 Studies reported different measures of weight status, including body mass index (BMI), BMI z-scores, overweight, obesity, and/or combined overweight/obesity.
Table 2.
Associations between competitive food and beverage policies and weight status according to a single sociodemographic factor: gender, grade or age, race/ethnicity, or school/district-level socioeconomic advantage.
| Author, Year | Exposure/duration | Comparison | Subgroup | Outcome | Measure of Association/Effect size/95%CI/P-value | Control Variables |
|---|---|---|---|---|---|---|
| 1) Gender | ||||||
| Bauhoff, 2014 | Los Angeles Food & Bev. Policy (passed in 2003; effective in 2004) Duration: 8–15 months |
Synthetic controls (29 untreated districts in California) Cohort: 7th vs 9th grade in pre and post periods |
Boys | BMI z-scores Overweight/obesity Obesity |
Cohort: 7th
graders (in pre: 2003) vs 9th
grades in post (2005) periods relative to synthetic controls β: 0.009 (SE 0.026), p>0.10 β: −0.798 (SE 0.848), p>0.10 β: −1.678 (SE 1.571), p>0.10 (no actual p-values provided) |
Ethnicity, sex, immigrant status, free & reduced lunch status, school, enrollment, food vendors within 300 m of school property, School size quintile, title I school status, pupil-teacher ratios |
| Girls | BMI z-scores Overweight/obesity Obesity |
Cohort: 7th
graders (in pre: 2003) vs 9th
grades in post (2005) periods relative to synthetic controls β: −0.053 (0.045), p>0.10 β: −0.454 (1.748), p>0.10 β: −1.183 (1.097), p>0.10 (no actual p-values provided) |
||||
| Jensen et al, 2012 | Competitive beverage policy/regulation (state-wide policy passed in 2007) | Pre-policy (2006) vs Post-policy (2007) | Boys | Mean BMI Mean BMI percentile % with Overweight % with Obesity |
20.90 (SD: 5.09) vs 21.5 (SD: 4.65), no p-value 66.56 (SD: 30.5) vs 68.2 (SD: 28.3), no p-value 22.6 vs 19.6, no p-value 21.6 vs 19, no p-value |
None (Bivariate) |
| Girls | Mean BMI Mean BMI percentile % with Overweight % with Obesity |
20.55 (SD: 4.20) vs 22.1 (SD: 4.88), no p-value 66.24 (SD: 28.9) vs 70.9 (SD: 26.2), no p-value 23.6 vs 23.9, no p-value 15.5 vs 16.1, no p-value |
None (Bivariate) | |||
| Nanney et al, 2016 | School weight-related policies/practices in 2006 and 2012: Policy summary score: Fruit and Vegetable availability, sum of less healthy foods, PE required, inter-mural opportunities available |
Compared 2006 policy year to 2012 policy year; Weight status in 2007 and 2013) | Boys | School-level average Student BMI percentile School-level average Obesity prevalence |
β: −0.01 (−0.02, 0.00), p>0.05 β: −0.01 (−0.03, 0.01), p>0.05 |
Year of data collection, % of free & reduced priced meals students, % of minority enrollment, & school rural/urban location. Fixed effects linear models, control for time invariant factors at school level. |
| Girls | School-level average Student BMI percentile School-level average Obesity prevalence |
β: 0.00 (−0.02, 0.01), p>0.05 β: −0.01 (−0.03, 0.00), p<0.05* No evidence of differential policy effect by sex. |
||||
| Leonard, 2017 | Number of school years students were exposed to a province-wide school-based junk food ban (0–8 years) | Number of years the policy was in place (dose-response) and categorical exposure: Before <2005 and after policies>2007 Difference in Diff method |
Boys | BMI BMIz BMI BMIz |
# of years of exposure β: −0.0380 (SE: 0.0184), p=0.036* β: −0.00944 (SE: 0.005), p= .019* Categorical exposurea ≤ 1 year β: 0.00682 (SE: 0.0592), p = 0.938 1.5–4.5 years β: −0.0106 (SE: 0.0974), p =0.891 ≥5 years β: −0.341 (SE: 0.0960), p = 0.004* ≤ 1 year β: −0.00524 (SE: 0.0113), p=0.811 1.5–4.5 year β: −0.00631 (SE: 0.0252), p=0.728 ≥ 5y β: −0.0813 (SE: 0.0250), p= 0.001* |
Province, survey year, quartic age, race/ethnicity, and health region (BMIz models do not control for the later two variables) |
| Girls | BMI BMIz BMI BMIz |
# of years of exposure β: −0.0648 (SE: 0.0299) p=0.006* β: −0.0144 (SE: 0.006), p =.005* Categorical exposurea ≤ 1 year β: −0.102 (SE: 0.1260), p = .249 1.5–4.5 year β: −0.204 (SE: 0.114), p= .017* 5y or more β: −0.424 (SE: 0.181), p=.004* ≤ 1 year β: −0.0314 (SE: 0.0236), p=0.124 1.5–4.5 years β: −0.0503 (SE: 0.0225), p=0.009 ≥ 5y or more β: −0.0888 (SE: 0.0355), p= 0.012 |
||||
| 2) Single grade sample, sample stratified by grade levels or school age groups | ||||||
| Riis et al, 2012 | Exposure to nutrition policies regulating competitive foods in al carte in cafeteria, vending machines & other venues, comparing 2003 data to 2007 | 2003 students (not exposed to nutrition policies) compared to children exposed in 2007 | ES (age 10) | Obesity (>95th percentile) in 2007 Obesity (>95th percentile) in 2007 |
Association of 2006 nutrition policy score and obesity in 2007 CF ala carte cafeteria OR: 1.01 (0.98, 1.03), p>0.05 CF vending machine OR: 1.02 (0.98, 1.06), p>0.05 CF in other venues OR: 1.04 (1.00, 1.07), p<0.05* Association of changes in policy scores (from 2003 to 2006) and obesity in 2007 CF ala carte cafeteria OR: 0.98 (0.95, 1.02), p>0.05 CF vending machine OR: 1.01 (0.96, 1.06), p>0.05 CF in other venues OR: 1.02 (0.98, 1.06), p>0.05 |
Age, sex, race/ ethnicity, health status, child participation in sports and physical activity, TV in child bedroom, family income level, child school type, parent/guardian’s level of education, family structure, child TV and computer use, maternal age, access to neighborhood parks. Models of policy change scores additionally adjusted for 2003 age- and state-specific obesity levels |
| MS (age 11–14) | Obesity (>95th percentile) in 2007 Obesity (>95th percentile) in 2007 |
Association between 2006 policy score and obesity in 2007 CF ala carte cafeteria OR: 1.00 (0.98, 1.01), p>0.05 CF vending machine OR: 1.00 (0.98, 1.02), p>0.05 CF in other venues OR: 1.00 (0.98, 1.02), p>0.05 Association between policy change scores (from 2003 to 2006) and obesity in 2007 CF ala carte cafeteria OR: 0.99 (0.95, 1.02), p>0.05 CF vending machine: OR 0.99 (0.96, 1.03), p>0.05 CF in other venues: OR 0.99 (0.95, 1.03), p>0.05 |
||||
| HS (age 15–17) | Obesity (>95th percentile) in 2007 Obesity (>95th percentile) in 2007 |
Association between 2006 policy score and obesity in 2007 CF ala carte cafeteria: OR: 1.01 (1.00, 1.02), p>0.05 CF vending machine: OR: 1.01 (1.00, 1.02), p>0.05 CF in other venues: OR: 1.01 (1.00, 1.02), p>0.05 Association between policy change scores (from 2003 to 2006) and obesity in 2007 CF ala carte cafeteria: OR: 1.00 (0.98, 1.02), p>0.05 CF vending machine: OR:1.00 (0.97, 1.03), p>0.05 CF in other venues: OR: 1.00 (0.97, 1.03), p>0.05 |
||||
| Nanney et al, 2016 | School weight-related policies/practices in 2006 and 2012: Policy summary score: Fruit and Vegetable availability, sum of less healthy foods, PE required, inter-mural opportunities available |
Compared 2006 policy year to 2012 policy year; Weight status in 2007 and 2013) | 9th graders only | School-level average Student BMI percentile School-level average Obesity prevalence |
β: −0.01 (−0.02, 0.00), p>0.05 β: −0.01 (−0.02, 0.00), p>0.05 |
Year of data collection, % of free & reduced priced meals students, % of minority enrollment, and school rural or urban location. Fixed effects linear models, control for time invariant factors at school level |
| Palakshappa et al, 2016 | State laws governing school nutrition | States with no laws (ref) States with strong laws for 8 years vs. States with weak laws or States with strong laws in place for less time. Children in States with no laws or only 1 or only 1 non CF&B law (ref) - One CF&B law or multiple weak laws; - 2–3 strong laws -4 or more strong laws |
ES ES |
State-level Analysis (ES only) Subject-level Analysis Overweight: 85th to <95th pct) Obesity (≥95th pct) |
States with no laws (ref) States with strong laws for 8 years β = −0.02; 95% CI: −0.04, 0.00 No laws (ref)b Weak laws OR: 0.83 (0.47, 1.46), p>0.05 Strong laws OR: 1.04 (0.73, 1.48), p>0.05 No laws or only 1 non CF&B law: Ref 1 or weak OR: 1.16 (0.74, 1.8), p>0.05 2–3 strong OR: 0.97 (.61, 1.52), p>0.05 4 + strong OR: 1.04 (.59, 1.84), p>0.05 No laws (ref)b Weak laws OR: 0.78 (0.44, 1.36, p>0.05 Strong laws: 0.68 (0.48, 0.96), p<0.01* No laws or only 1 Non CF&B law (ref) 1 or weak OR: 0.70 (0.44, 1.09), p>0.05 2–3 strong OR: 0.57 (0.36, 0.90), p<0.05 * 4 + strong OR: 0.57 (0.34, 0.97), p<0.05* |
Gender, race, ethnicity, and family income level by state |
| MS | Overweight: 85th to <95th pct) Obesity (≥95th pct) |
No laws (ref)b Weak laws OR: 0.97 (0.78, 1.20), p>0.05 Strong laws OR: 0.85 (0.71, 1.02), p>0.05 No laws or only 1 Non CF&B law: Ref 1 or weak OR: 0.81 (0.65, 1.02), p>0.05 2–3 strong OR: 0.70 (0.55, 0.90), p<0.05 * 4 + strong OR: 0.76 (0.57, 0.99), p<0.05 * No laws (ref)b Weak laws OR: 0.89 (0.70, 1.13), p>0.05 Strong laws OR: 0.94 (0.77, 1.14), p>0.05 No laws or only 1 Non CF&B law: Ref 1 or weak OR: 1.00 (0.78, 1.30), p>0.05 2–3 strong OR: 0.91 (0.70, 1.20), p>0.05 4 + strong OR: 1.00 (0.73, 1.38), p>0.05 |
||||
| HS | Overweight: 85th to <95th pct) Obesity (≥95th pct) |
No laws (ref)b Weak laws OR: 0.97 (0.76, 1.23), p>0.05 Strong laws OR: 1.00 (0.81, 1.25), p>0.05 No laws or only 1 Non CF&B law: Ref 1 or weak OR: 1.20 (0.89, 1.60), p>0.05 2–3 strong OR: 1.21 (0.90, 1.60), p>0.05 4 + strong OR: 1.11 (0.79, 1.55), p>0.05 No laws (ref)b Weak laws OR: 1.05 (0.80, 1.38), p>0.05 Strong laws OR: 0.89 (0.69, 1.13), p>0.05 No laws or only 1 Non CF&B law: Ref 1 or weak OR: 0.94 (0.68, 1.31), p>0.05 2–3 strong OR: 0.84 (0.61, 1.16), p>0.05 4 + strong OR: 0.78 (0.54, 1.13), p>0.05 |
||||
| Sanjeevi et al, 2020 | State-level competitive food laws (21 states only) | Strength of state competitive food law in 2010: None: <1 score no law Weak: 1–2 score law with non-specific standards Strong:>2 score laws with specific and mandated req. Composite law score for competitive foods and beverages at 3 locations: vending machines, cafeterias and other venues. |
10th grade | BMI Percentile Overweight/Obesity (≥ 85th pct vs normal weight (≥5 to <85 pct). Participants 20 years old: adult cut offs OV/OB≥25.0 |
None: Ref Weak β:-7.44 (2.89), p<0.05* Strong β:-5.32 (2.83), p>0.05 None: Ref Weak OR: 0.63 (0.41–0.98), p<0.05* Strong OR: 0.72 (0.48–1.06), p>0.05 |
Sex, race/ethnicity, school urbanicity, parent educational attainment, family affluence, and vigorous physical activity (hours/week). Models account for clustering at the school level |
| Strength of state competitive food law in 2012: None: <1 score no law Weak: 1–2 score law with non-specific standards Strong:>2 score laws with specific and mandated req. Composite law score for competitive foods and beverages at 3 locations: vending machines, cafeterias and other venues. |
12th grade | BMI Percentile Overweight/Obesity (≥ 85th pct vs normal weight (≥ 5 to <85 pct). Participants 20 yo: adult cut offs OV/OB≥25.0 |
None: Ref Weak β:-10.43 (2.71), p<0.001* Strong β:-8.29 (2.64), p<0.01* None: Ref Weak OR: 0.58 (0.37–0.91), p<0.05* Strong OR: 0.60 (0.42–0.86), p<0.05* |
|||
| Fung et al, 2013 | Policy introduced in 2006, expected to be implemented in all schools by 2009 | Pre-policy period (2003) | 5th grade | Overweight vs normal Obesity vs normal weight | PRR comparing overweight in 2011 vs 2003 PRR 95%CI: 1.03 (0.94, 1.12) PRR 95%CI: 1.26 (1.08, 1.48) p<.05* |
Gender, household income, parental education and place of residency |
| Leonard, 2017 | Number of school years students were exposed to a province-wide school-based junk food ban (0–8 years) |
Number of years of the policy was in place (dose-response) and categorical exposure: ≤ 1 year 1.5–4.5 y 5+ years Difference in Diff method |
Ages 12–15y | BMI BMI |
Continuous years of policy exposure β −0.062, (cluster-robust SE [prov]): (0.025), p=0.031* Categorical exposurea ≤ 1 year or less: −0.0954 (cluster-robust SE [prov]): (0.075), p=0.362 1.5–4.5 years: −0.217, (cluster-robust SE [prov]): (0.078), p =0.026* ≥ 5 years or more: −0.323 (cluster-robust SE [prov]): (0.152), p = 0.052* |
Province, survey year, quartic age, gender, race/ethnicity, and health region |
| Ages 16–20 | BMI BMI |
Continuous years of policy exposure β: −0.014, (cluster-robust SE [prov]): (0.016), p=0.500 Categorical exposurea ≤ 1 year or less: 0.0253, (cluster-robust SE [prov]): (0.075), p = .742 1.5–4.5 years: 0.0234 (cluster-robust SE [prov]): (0.065), p = .777 ≥ 5y or more: −0.155 (cluster-robust SE [prov]): (0.104), p = .300 |
||||
| Datar & Nicosia, 2017 | State-wide CF&B policies. State policies governing CF&Bs in schools, obtained from Bridging the Gap-State Wellness Policy Data from 2012 to 2013 school year | 1st comparison: States with 0–4 weak or strong policies (ref), 5–6 and 7–9 weak or strong polices. & 2nd comparison: No strong (ref) 1 strong policy 2–5 strong policies |
Ages 12–13 (Middle School) | BMIz Overweight/obesity BMIz Overweight/obesity |
0–4 weak or strong state policies (Ref) 5–6 weak/strong policies β: −0.04 (0.06) 7–9 weak/strong policies β:-0.18 (0.07), p<0.05* 0–4 weak or strong state policies (Ref) 5–6 weak/strong policies AOR: 0.87 (0.62, 1.23) 7–9 weak/strong policies AOR: 0.69 (0.51, 0.92) p<0.05* # of strong CF&B policies in child’s state No strong policy=Ref 1 strong policy β: −0.10 (0.07) 2–5 strong policies β:-0.13 (0.06) No strong policy=Ref 1 strong policy AOR: 0.72 (0.51–1.01) 2–5 strong policies AOR: 0.74 (0.57–0.98), p<0.05* |
Child's age in months, gender, race/ethnicity, parents' marital status, highest education level, military parent rank, household income, number of children in household, months at current army base, on post residence |
| Gee, 2018 | Arkansas’s Act 1220 of 2003 –which in part prohibited vending machines in elementary schools | Change in outcome after (2005, 2007 and 2009) versus Before (1999–2001), paired with youth in the state of Missouri as a comparison group (same time period) | High school | BMIz-scores | Difference in difference estimate BMI for age z score (average difference in zBMI associated with Act 1220) Overall: − 0.017 (− 0.097, 0.063), p=0.68 Overweight group: − 0.003 (−0.043, 0.036), p=0.89 Obese group: − 0.010 (− 0.070, 0.051), p=0.75 Difference in difference estimate for effect of Arkansas’ Act 1220 on adolescents' probability of being in a lower versus higher weight category: Probability (healthy weight versus overweight): − 0.011 (−0.045, 0.023), p=0.51 Probability (healthy weight versus obese): 0.015 (− 0.017, 0.046), p=0.35 Probability (overweight versus obese): 0.047 ( − 0.005, 0.099), p>0.5 |
adolescents’ self-reported gender, age, and their racial and ethnic backgrounds |
| Hennessy et al, 2014 | NSCH from 2007 linked to State competitive food laws; based on 2005 CLASS database -scores laws between 0–6. States average score categorized: 0 no law; 1–2 weak laws; >2 strong laws; |
Children in states with no laws (composite score of 0) | Middle school students/ ages 11–14 | Overweight/obesity BMI ≥ 85th percentile |
No law = 1.00 (reference) Weak law Adj. OR: 1.23 (1.05, 1.44), p<0.01* Strong law Adj. OR: 1.01 (0.798, 1.30) | Age, sex race/ethnicity, TV in child's bedroom, physical activity, sleep, family meals, parenťs age, family structure, household poverty status (family income: poverty threshold) |
| 3) Race/Ethnicity | ||||||
| Taber et al, 2011 | Change in State policies regarding junk food in schools between 2000 and 2006 (School Health Policies and Programs Study): 1) Recommend or Require 2) Require 3) Neither (Ref) |
Students in states that neither required or recommended schools prohibit junk food. | Non-Hispanic White | BMI Percentile in 2007 |
Policies for vending machines
c Neither recommend or require: Ref Recommend or require β: −0.71 (1.34), p=0.596 Require β: −1.09 (1.61), p=0.498 Policies for Snack bars Neither recommend or require: Ref Recommend or require β: −0.51 (1.25), p=0.683 Require β: −0.77 (1.43), p=0.59 Policies for Concession Stands Recommend or require β: −.88 (1.00), p=0.38 Policies for Parties Recommend or require β: −.63 (.92), p=0.49 |
Gender, state-level log median income, state obesity prevalence, and state political party of state legislature |
| Non-Hispanic Black | BMI Percentile in 2007 |
Policies for vending machines Neither recommend or require: Ref Recommend or require β: 0.31 (1.64), p=0.85 Require β: −0.20 (1.88), p=0.915 Policies for Snack bars Neither recommend or require: Ref Recommend or require: β: 0.83 (1.54), p=0.589 Require: β: 0.64 (1.72), p=0.709 Policies for Concession Stands Recommend or require β: −0.54 (1.46), p=0.71 Policies for Parties Recommend or require β:0.08 (1.32), p=0.95 |
||||
| Hispanic | BMI Percentile in 2007 |
Policies for vending machines Neither recommend or require: Ref Recommend or require β: 0.78 (2.06), p=0.705 Require β: −0.34 (2.47), p=0.890 Policies for Snack bars States that neither recommend or require that schools prohibit junk food: Ref Recommend or require β: 0.76 (2.00), p=0.704 Require β: −0.29 (2.28), p=0.899 Policies for Concession Stands Recommend or require β: −1.91 (1.67), p=0.25 Policies for Parties Recommend or require β: −1.29 (1.61), p=0.42 |
||||
| Non-Hispanic Other | BMI Percentile in 2007 |
Policies for vending machines Neither recommend or require: Ref Recommend or require: β: 2.94 (3.57), p=0.410 Require: β: 4.09 (4.22), p=0.333 Policies for Snack bars Neither recommend or require: Ref Recommend or require β: 4.47 (3.19), p=0.161 Require β: 5.48 (3.61), p=0.129 Policies for Concession Stands Recommend or require β: 1.69 (3.32), p=0.61 Policies for Parties Recommend or require β: 1.34 (3.37), p=0.69 |
||||
| Nanney et al, 2016 | School weight-related policies/practices in 2006 and 2012: Policy summary score: Vegetable availability, sum of less healthy foods, PE required, inter-mural opportunities available |
Compared 2006 policy year to 2012 policy year | School-level minority enrollment | School-level BMI Percentile School-level Obesity prevalence (averaged within schools) |
There was no evidence of significant interaction by school-level student race/ethnicity. No data were reported. |
Year of data collection, % of free & reduced priced meals students, % of minority enrollment, and school rural or urban location. Fixed effects linear models, control for time invariant factors at school level |
| 4) Socioeconomic factors | ||||||
| Nanney et al, 2016 | School weight-related policies/practices in 2006 and 2012: Policy summary score: Vegetable availability, sum of less healthy foods, PE required, inter-mural opportunities available |
Compared 2006 policy year to 2012 policy year | School level FRPL | School-level BMI Percentile School-level Obesity prevalence (averaged within schools) |
No evidence of significant interactions by school-level student FRPL status. No data were reported by subgroup. |
See above |
| Hoffman et al, 2016 | School wellness policies in 2013 compared to 2014 Written wellness policies in a sample of Minnesota public school districts participating in the National School Lunch Program |
Effect on BMI analyzed based on WellSAT score (Range 0–100). Positive association = higher the score, higher the BMI percentile, or higher the percent overweight obese | Low FRPL (<35%) | School District-level BMI Percentile School-district level % with Overweight/Obesity BMI Percentile % with Overweight/Obesity |
Total Strength of Policies 10 unit increase in WellSAT score: β: 0.34 (0.23), p>0.05 β: 0.12 (0.36), p>0.05 Total Comprehensiveness of Policies β: 0.46 (0.30), p>0.05 β: 0.19 (0.47), p>0.05 |
District-level free & reduced priced lunch category, minority enrollment percentage and geographic location |
| Medium FRPL (35–50%) | BMI Percentile % with Overweight/Obesity BMI Percentile % with Overweight/Obesity |
Total Strength of Policies 10 unit increase in WellSAT score: β: −0.07 (0.23), p>0.05 β: −0.16 (0.36), p>0.05 Total Comprehensiveness of Policies β: −0.19 (0.29), p>0.05 β: −0.53 (0.45), p>0.05 |
||||
| High FRPL (>50%) | BMI Percentile % with Overweight/Obesity BMI Percentile % with Overweight/Obesity |
Total Strength of Policies 10 unit increase in WellSAT score: β: 0.76 (0.32), p<0.05* β: 1.35 (0.50), p<0.01* Total Comprehensiveness of Policies β: 0.83 (0.38), p<0.05* β: 1.35 (0.60), p<0.05* |
||||
Statistically significant effect sizes.
Coefficients are for policy effects for each individual categories in comparison to the other two groups.
Original published paper reported beta coefficients. The authors of this review exponentiated the beta coefficients to obtain odds ratios and 95% confidence intervals.
No p-values were reported within race/ethnic groups; therefore the authors calculated them.
Figure 2:
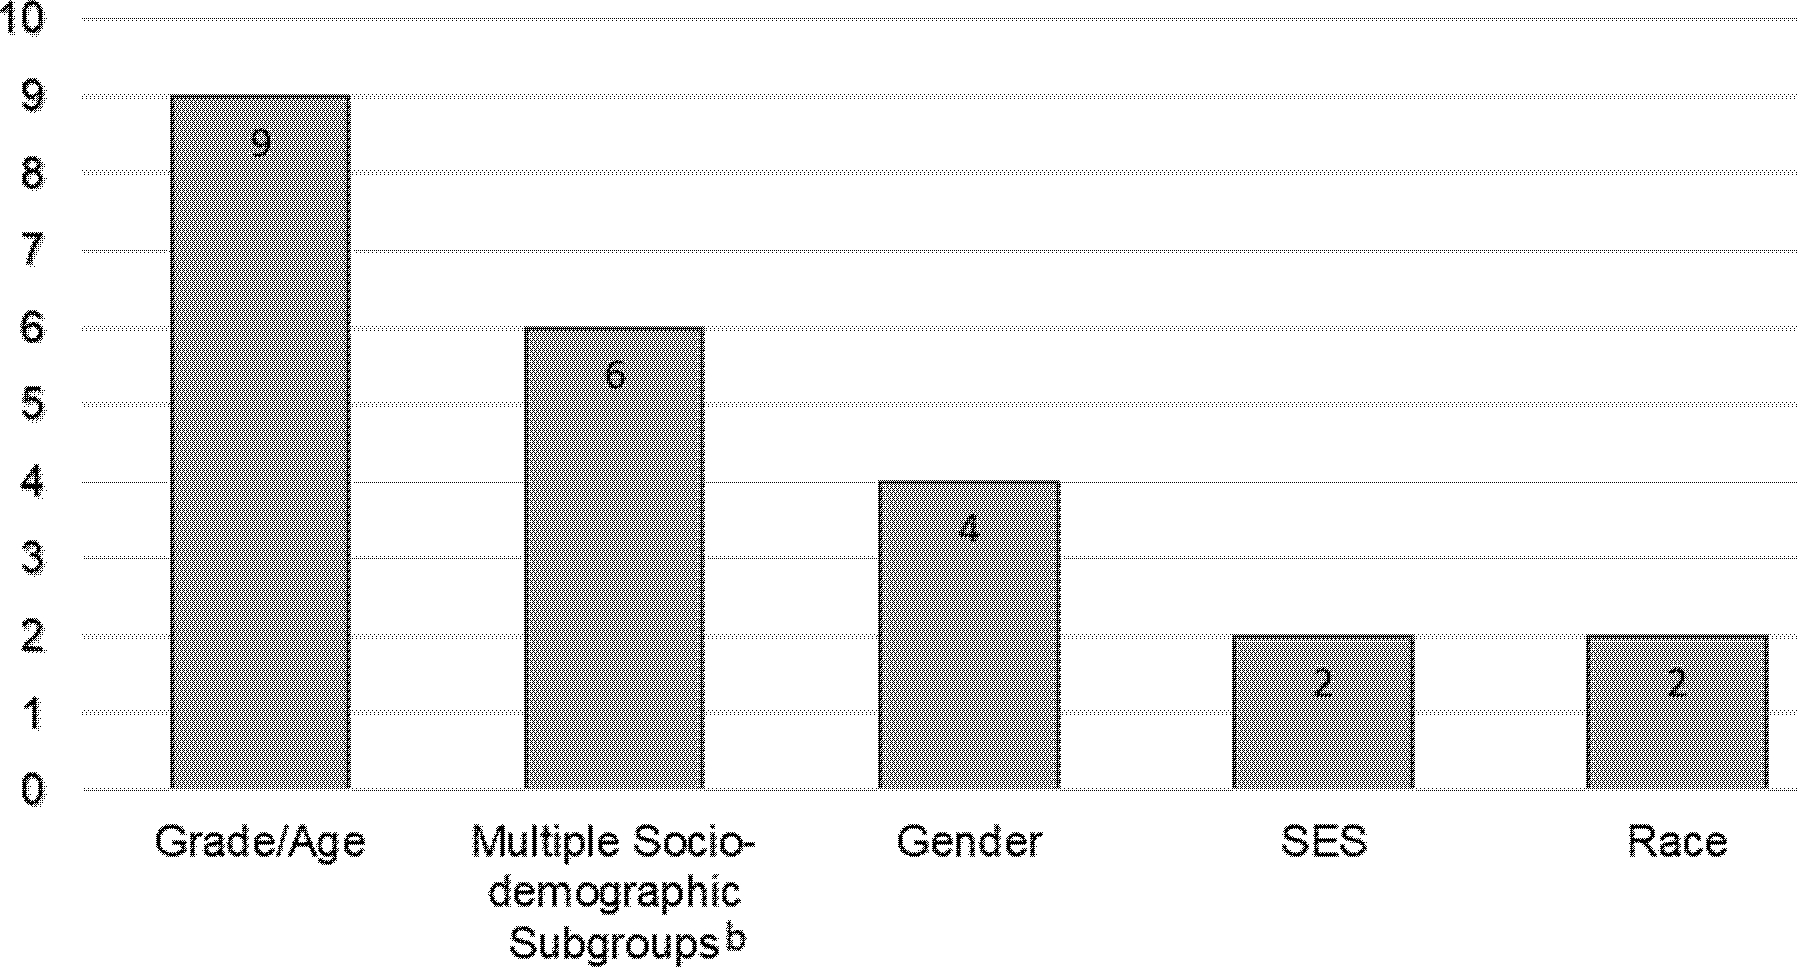
Number and types of socio-demographic subgroup analyses reported in the selected studies.a
a Number does not add up to 18 studies because some studies reported results separately for more than one demographic subgroup, e.g., gender or race/ethnicity.
b Multiple-sociodemographic subgroups include combinations of two or more social factors jointly or in stratified analyses by: grade and gender (Bauhoff, 2014; Sanchez-Vaznaugh et al, 2010); grade, gender and race/ethnicity (Matsuzaki et al, 2021; Sanchez-Vaznaugh et al, 2021), grade, gender and school-neighborhood income (Sanchez-Vaznaugh et al, 2015) and gender and urbanicity (Matsuzaki et al, 2022).
Associations by gender.
The evidence of association between CF&B policies and weight status among gender groups is mixed. Using data from Canada, a study reported a dose-response association between years of exposure to the policies and lower BMI and BMI z-scores among both boys and girls (Table 2).33 When the exposure to the policy was categorized in time-intervals, the association was significant after five years among boys; among girls, policy effects were apparent after 1.5 years of exposure.33 Two US studies reported favorable—though non-significant—policy associations with overweight/obesity combined and/or obesity among boys.36,43 Based on California data from 7th and 9th-grade girls, Bauhoff showed weak evidence of association between CF&B policies and lower overweight/obesity and obesity relative to public school students elsewhere in the state.43 A study from Minnesota found that each additional school food policy and practice was significantly associated with a 1.0% lower school-level obesity prevalence among girls.36 Using data from Rhode Island and based on bivariate associations, a study observed BMI and BMI z-scores were higher among both genders one year after (2007) versus before the policies (2006). Among boys overweight and obesity prevalence where lower in 2007 compared to 2006, but among girls the prevalence of overweight and obesity was slightly higher in 2007.42
Associations by grade or age.
Nine studies reported results separately by grade, age group or utilized a sample of children of the same age.33–41 Among elementary and high school students, the evidence is mixed, whereas findings tend to be more consistent among middle school students. Among children of elementary school age, one of three studies reported CF&B laws were associated with lower odds of obesity. Using a national US sample, Palakshappa et al. found that states with 2 or more strong laws were significantly associated with lower odds of obesity, but not overweight.39 Riis et al. observed generally no clear evidence of impact of policies for cafeteria and vending machines, though policies for other venues such as school stores or canteens were significantly related to higher obesity.40 In the same study, changes in the strength of the food policy between 2003 and 2006 were not associated with obesity.40 A study from Canada reported non-significantly higher overweight and significantly higher obesity in the post- versus the pre-policy period.34
Five studies reported findings among children in middle schools.33,35,38–40 Of those, three studies reported modest though generally consistent evidence of favorable associations. Using US national data, data from 23 states, or data from six Canadian provinces, three studies found policy exposure was associated with lower weight status - the evidence was strongest for longer duration of exposure and with the number and strength of the CF&B policies.33,35,39 Conversely, one study found no associations between 2006 policy scores for competitive foods and obesity measured in 2007.40 Using the 2007 National Survey of Children’s Health (NSCH), a study observed that children ages 11–14, in states with weak CF&B laws had significantly higher likelihood of overweight/obesity compared with those in states with no laws.38 On the other hand, the study reported null findings for the association between states with strong laws and overweight/obesity.38
Among high school-age students, six studies reported variable evidence of associations between competitive food and beverage policies and body weight.33,36,37,39–41 Youth in 12th-grade in states with weak or strong laws compared to those in states with no laws had significantly lower BMI z-scores, overweight/obesity.41 Similar findings were seen for 10th-grade students, though the association was significant only for weak laws.41 Four studies reported weak evidence of policy influences on body weight. The number and strength of laws were related to lower obesity in the U.S.,39 whereas exposure to school policies among students in Arkansas was associated with lower BMI z-scores in comparison with those unexposed to policies in Missouri.37 The number of years of exposure as well as exposure to policies for five or more years was related to lower BMI among Canadian students between 16–20 years of age.33 In a sample of Minnesota schools, school-level policies and practices were associated with lower school-level average BMI percentile and obesity prevalence.36 Other studies found positive associations. Using a Canadian youth sample, exposure to policies for less than 4.5 years was associated with higher BMI.33 Palakshappa et al. found the number of and the strength of state laws for competitive foods/drinks was associated with higher overweight.39 Conversely, Riis et al. reported null associations between policy change scores from 2003–2006 and obesity in 2007 using national data.40
Associations by race/ethnicity.
Two studies reported results stratified by race/ethnicity29 and/or findings from interaction tests,36 with no clear evidence of associations. Using cross-sectional data from the Youth Risk Behavior Survey, a U.S. study found that state policy changes to require or recommend banning the sale of unhealthy food and beverages in several settings (e.g., vending machines, snack bars, concession stands, and parties) were non-significantly associated with BMI percentile among White, Black and Hispanic students, though the direction and strength of the associations depended on type of setting. While the interaction between state policies and race/ethnicity was significant, the study authors suspected the results to be driven by students in the non-Hispanic Other group.29 A correlational study in Minnesota found overall negative non-significant associations between nutrition policies/practices and school-level obesity prevalence, with no evidence of variation by school-level enrollment of minority students (no numerical data was reported).36
Associations by socioeconomic factors.
Two correlational studies from Minnesota reported mixed evidence of associations between policies and school or district-level weight status, by student eligibility for FRPL.36,44 Stronger and more comprehensive policies were associated with lower district-level BMI percentile and prevalence of overweight/obesity in districts with medium FRPL. Positive associations were seen among districts with low and high proportions of students eligible for FRPL, although significant only among the latter.44 Nanney et al., recorded no evidence of differential influence of school policies and practices on school-level BMI percentile or obesity prevalence by school-level FRPL; however effect sizes were unavailable.36
Associations jointly stratified by more than two socio-demographic factors.
Using data from the state of California, paired with pre-post and/or interrupted time series designs, six studies reported results jointly stratified by gender and grade;43,45 gender, grade and race/ethnicity;30,46 and gender and school-neighborhood socioeconomic factors or ubanicity27,47 (Table 3). These studies observed associations between CF&B policies and lower rates of increase in overweight/obesity, plateaus or declines among multiple subgroups, but the strengths of evidence varied and were weaker for some groups especially girls in 7th- and 9th-grade.
Table 3.
Associations between competitive food and beverage policies and weight status jointly stratified by two or more socio-demographic factors.
| Author/ Year | Gender | Grade | Race/ethnicity or SES or Locality | Outcomes | Measure of Association/Effect size/P-value | Control variables |
|---|---|---|---|---|---|---|
| Bauhoff 2014 a | Boys | 9th grade | Los Angeles Unified School | BMI z-scores Overweight/obesity Obesity |
β: −0.046 (SE 0.042), p>0.10 β: −1.545 (SE 1.809), p>0.10 β: −0.864 (SE 1.501), p>0.10 |
Ethnicity, sex, immigrant status, free & reduced lunch status, school, enrollment, food vendors within 300 m of school property, school size quintile, title I school status, pupil-teacher ratios |
| Girls | 9th grade | Los Angeles Unified School | β: 0.036 (0.025), p>0.10 β: 2.140 (1.840), p>0.10 β: 1.125 (0.899), p>0.10 |
Same as above | ||
| Sanchez-Vaznaugh et al, 2010 b | Boys | 5th grade | Los Angeles Unified School | Overweight/obesity |
Annual log odds after vs before the CF&B policy, p value for change in trends −0.002 vs 0.041, p=0.002 |
Age, race/ethnicity, physical fitness; school enrollment, school racial/ethnic composition, portion of children eligible for free and reduced priced meals, annual median household income, household education; district- level enrollment, number of schools., and percent of children eligible for free and reduced priced meals |
| Girls | 5th grade | Los Angeles Unified School | 0.008 vs 0.048, p=0.003 | Same as above | ||
| Boys | 7th grade | Los Angeles Unified School | 0.014 vs 0.039, p=0.175 | Same as above | ||
| Girls | 7th grade | Los Angeles Unified School | 0.023 vs 0.033, p=0.543 | Same as above | ||
| Boys | 5th grade | California, statewide (except LAUSD) | 0.001 vs 0.023, p=0.001 | Same as above | ||
| Girls | 5th grade | California, statewide(except LAUSD) | 0.009 vs 0.018, p=0.111 | Same as above | ||
| Boys | 7th grade | California, statewide(except LAUSD) | −0.004 vs 0.034, p<0.001 | Same as above | ||
| Girls | 7th grade | California, statewide (except LAUSD) | 0.003 vs 0.027, p<0.001 | Same as above | ||
| Matsuzaki et al, 2021 c | Boys | 5th grade | White Pacific Islander American Indian/Alaskan Native Filipino |
Overweight/obesity |
Change in annual log odds after (2005–2012) versus before 2002–2004 CF&B policy: −0.021, p<0.001 −0.142, p<0.001 −0.033, p=0.173 −0.014, p=0.341 |
Age in years, sex, racial/ethnic origins/backgrounds and fitness levels; total enrollment, school racial/ethnic majority, proportions of students eligible for free or reduced price meals, median household income and proportions of the residents achieving a bachelor’s degree or above, District-level free or reduced-price meals |
| Girls | 5th grade | White Pacific Islander American Indian/Alaskan Native Filipino |
−0.032, p<0.001 −0.139, p<0.001 −0.076, p= 0.002 −0.002, p= 0.888 |
Same as above | ||
| Boys | 7th grade | White Pacific Islander American Indian/Alaskan Native Filipino |
−0.016, p=0.013 −0.049, p=0.065 −0.057, p=0.029 0.007, p=0.667 |
Same as above | ||
| Girls | 7th grade | White Pacific Islander American Indian/Alaskan Native Filipino |
−0.019, p=0.005 −0.084, p=0.002 −0.076, p=0.003 −0.02, p=0.237 |
Same as above | ||
| Sanchez-Vaznaugh et al, 2015 d | Boys | 5th grade |
School neighborhood income Lowest tertile Middle tertile Highest tertile School neighborhood education Lowest tertile Middle tertile Highest tertile |
Overweight/obesity |
Annual log odds after vs before the CF&B policy, p value for change in trends −0.0028 vs 0.0275, p<0.05 −0.0060 vs 0.0235, p<0.05 −0.0105 vs 0.0106, p<0.05 −0.0004 vs 0.0272, p<0.05 −0.0057 vs 0.0213, p<0.05 −0.0141 vs 0.0116, p<0.05 |
Race/ethnicity, fitness levels, and school-level enrollment, racial/ethnic composition, and proportion of children eligible for free or reduced-price meals. Models by neighborhood income additionally adjust for continuous neighborhood education; models by education additionally adjust for continuous income |
| Girls | 5th grade |
School neighborhood income Lowest tertile Middle tertile Highest tertile School neighborhood education Low tertile Middle tertile Highest tertile |
0.0008 vs 0.0198, p<0.05 −0.0009 vs 0.0191, p<0.05 −0.0116 vs 0.0178, p<0.05 0.0033 vs 0.0199, p<0.05 −0.0041 vs 0.0235, p<0.05 −0.0126 vs 0.0131, p<0.05 |
Same as above | ||
| Matsuzaki et al, 2022 e | Boys | 7th grade | Rural Second City Suburban Urban |
Overweight/obesity |
Annual log odds after vs before the CF&B policy, p value for change in trends 0.00 vs 0.03, p=0.031 −0.01 vs 0.01, p=0.227 −0.01 vs 0.02, p=0.004 0.01 vs 0.02, p=0.041 |
Sex, age, race/ethnicity, fitness level, school enrollment, school racial/ethnic composition, school free or reduced-price lunch, eligibility, neighborhood income, resident educational attainment |
| Girls | 7th grade | Rural Second City Suburban Urban |
0.01 vs 0.03, p=0.046 0.00 vs 0.03, p=0.051 0.00 vs 0.02, p=0.078 0.01 vs 0.01, p=0.917 |
Same as above | ||
| Sanchez-Vaznaugh et al, 2021 f | Boys | 5th grade | African Americans Asian Latino White |
Overweight/obesity |
Annual log odds after vs before the CF&B policy, p value for change in trends −0.009 vs 0.038, p<0.001 −0.007 vs 0.026, p<0.001 −0.007 vs 0.030, p<0.001 −0.012 vs 0.011, p<0.001 |
Sex, age, race/ethnicity, fitness level, school enrollment, school racial/ethnic composition, school free or reduced-price lunch, eligibility, neighborhood income, resident educational attainment |
| Girls | 5th grade | African Americans Asian Latino White |
0.010 vs 0.045, p<0.001 −0.005 vs 0.009, p=0.221 0.005 vs 0.028, p<0.001 −0.003 vs 0.019, p<0.001 |
Same as above | ||
| Boys | 7th grade | African Americans Asian Latino White |
−0.009 vs 0.035, p<0.001 −0.006 vs 0.031, p=0.001 −0.004 vs 0.037, p<0.001 −0.011 vs 0.006, p=0.012 |
Same as above | ||
| Girls | 7th grade | African Americans Asian Latino White |
0.018 vs 0.006, p=0.218 0.002 vs 0.019, p=0.155 0.009 vs 0.018, p=0.112 0.003 vs 0.019, p=0.013 |
Same as above | ||
Bauhoff, 2014 examined Los Angeles Food & Bev. Policy passed in 2003; effective in 2004 Duration: 8–15 months. Cross sectional data comparing weight status before (2003) and after (2005) the policy took place vs synthetic controls –students elsewhere in California (diff in diff analyses).
Sanchez-Vaznaugh et al, 2010 examined the Healthy Beverage Resolution and Obesity Prevention Motion that took effect in 2004 (For Los Angeles Unified School District). They compared weight status trends before (2001–2004) and after the policies took effect (2005–2008). Additionally, they examined CA competitive food & beverage policies (SB 677) that took effect in 2004 for California as a whole.
Matsuzaki et al, 2021 examined California statewide policies and federal school meal policies comparing overweight/obesity trends 1) before policies took place (2002–2004); 2) after CA policies (2005–2012) and 3) when both policies were in effect (2012–2016), the latter not reported here because it is outside the scope of this review.
Sanchez-Vaznaugh et al, 2015 examined California statewide competitive food and beverage policies, comparing overweight/obesity trends between the pre- (2001–2005) versus the post policy periods (2005–2010).
Matsuzaki et al, 2022 compared overweight/obesity trends before (2002–2004) and after CF&B policies took place (2005–2010).
Sanchez-Vaznaugh et al, 2021 examined the California competitive food and beverage policies comparing overweight/obesity trends 1) before the policies took place (2002–2005); 2) after California nutrition policies took place (2005–2012).
CF&B policies in the Los Angeles Unified School District (LAUSD) were non-significantly associated with lower BMI z-scores, overweight/obesity and obesity among boys in 9th-grade, but with higher weight status among girls.43 Conversely, a separate study found significantly reduced rates of increase in overweight/obesity after versus before the policies took effect, among 5th-grade boys and girls in the LAUSD and among 5th-grade boys and 7th-graders in the rest of California. The evidence of changes in overweight/obesity trends was unclear among 7th-graders in the LAUSD and 5th-grade girls in the rest of California, although annual changes in overweight/obesity prevalence trends slowed, plateaued or declined among all subgroups studied.45 Using statewide data from California on American Indian/Alaskan Native (AI/AN), Filipino, Pacific Islander and White students in 5th- and 7th-grades, a study found changes in overweight/obesity trends with plateaus or declines in the period after CF&B policies for all subgroups in 5th-grade, though evidence of changes was weak among 5th-grade Filipino girls and boys and AI/AN boys,30 Among 7th-graders, overweight/obesity trends changed, where rates of increase were smaller, no longer evident or led to decline in overweight/obesity in the period after the CF&B policies took effect across the majority of the race/ethnic-gender subgroups, although non-significant findings were seen among Pacific Islander boys, and Filipino girls. CF&B policies were not associated with OVOB among 7th-grade Filipino boys.30
Using statewide data on 5th-grade California students, a study examined whether CF&B policy-overweight/obesity associations varied by school-neighborhood socioeconomic advantage among boys and girls separately.27 Prior to the CF&B policies, overweight/obesity trends increased significantly among students attending schools located across all school-neighborhood socioeconomic (SES) levels; after the policies took effect (2006–2010), the trends appeared to level off among students in the lowest and middle SES tertiles, and declined among students in the highest neighborhood-SES tertiles; findings were similar for girls and boys.27 A state-wide study of 7th-graders saw favorable changes in overweight/obesity trends after versus before CF&B policies took effect among boys in rural, suburban and urban areas, and among girls in all except urban areas, though the strength of the evidence varied, and was weak among girls.47 Using statewide California data, a study found significant changes in overweight/obesity, where trends tended to decline after versus before the CF&B policies among 5th- and 7th-grade Asian, African American, Latino and White boys. The study found declines, plateaus or slower increases in overweight/obesity trends after versus before the policies, among girls, though the evidence was weak among 5th grade Asian, and 7th grade African American and Latino girls.46
Quality of Evidence
The body of evidence reflects a mix of study designs. Eight of the 18 selected studies utilized cross-sectional29,33,35,38,40,41 or correlational designs.36,44 One study used both a cross-sectional, and before-after design with a control group,43 while ten papers used a before/after design,27,34,39,42,45 paired with interrupted time series30,46,47 or with a control group.37,43 The latter studies help enhance inferences about policy associations with overweight/obesity, though the length of before-after time periods also varied among studies. Eight of the before and after studies used measured height and weight, whereas six studies used obesity indicators measured at multiple time points before and after the policies were enacted. To ascertain policy exposure, some studies utilized markers of quantity and strength, while others used nominal measures reflecting presence or absence.
DISCUSSION
This systematic review revealed a limited number of studies that have reported findings specific to socio-demographic subgroups. The body of evidence we reviewed covered a period of two decades and consisted of cross-sectional or correlational, and pre-post study designs with interrupted time series. Grade level or age was the most commonly reported demographic in studies that stratified the analyses by a single factor. The findings varied for elementary and high school age children, with modest and more consistent evidence in the direction of CF&B policies-obesity associations among middle school students. Further, among studies that examined multiple demographics combined (e.g., grade-, gender- and/or race/ethnicity), the evidence suggests CF&B associations with slower rates of increase, plateaus or declines in obesity among multiple population subgroups in California, though the strengths of evidence varied.
Previous reviews16–18 observed mixed findings about the effects of CF&B policies on childhood obesity overall. Building on this work, the present study summarized the evidence from studies reporting results separately by gender, grade or age, race or ethnicity, socioeconomic advantage or a combination of these factors. We identified less than a handful of studies reporting results from stratified analyses by gender, where stronger evidence of associations between CF&B policies and lower body weight appears to be present among boys than girls. Given gender differences in patterns of consumption of competitive food and beverages in schools,36,43 research is needed to examine differential obesity effects of policies to regulate food and beverages outside of school meals across gender groups including possible underlying mechanisms for those differences. We observed variable findings for elementary and high school students and modest, though more consistent evidence for middle school youth. There were too few studies which reported results by race and ethnicity or socioeconomic factors, limiting the ability to draw any conclusions. Additional research is needed to examine potential differential effects of CF&B policies on obesity among children of different racial, ethnic and socioeconomic backgrounds.
Several studies included in this review reported results jointly according to more than one demographic factor e.g., by age/grade and gender, race/ethnicity or school neighborhood income. The evidence from these studies, all using data from California, generally suggests CF&B policy associations with weight status, across multiple (though not all) sociodemographic subgroups. Specifically, relative to the period before CF&B policies, after the policies took effect, obesity increased at a slower pace, plateaued or declined among multiple population subgroups including students in elementary schools located in varying neighborhood-SES levels, and boys of many—but not all--racial/ethnic backgrounds in middle schools. The evidence remains unclear as to the potential impact of CF&B policy in some subgroups including Pacific Islander and Filipino boys in middle schools, girls in 9th-grade as well as 7th-grade African American, Latino and Asian girls. This underscores the need for further investigation into why these policies may not have been as effective for those students in California.
Multiple interrelated factors may explain the variable evidence about the obesity influences of CF&B policies across population subgroups. Those factors include differences in the types of CF&B policies the studies evaluated, differences in school or district-level adherence to the policies, variations in study designs, co-occurring obesity prevention interventions, as well as environmental factors. The types of CF&B policies in the studies we reviewed varied in terms of strength and scope. For example, in one study, the policy consisted of vending machine removal. Policies to regulate CF&B in vending machines may have limited influence among younger children because vending machines are typically less available in earlier grades.48 In other studies, CF&B policies set standards for snacks, entrees and beverages offered in various school venues, such as vending machines, stores and cafeterias. Moreover, CF&B policies often included food and beverage provisions for elementary, middle and high schools, which resulted in differences in strengths of standards across grade levels. In one state-level policy, electrolyte replacement beverages were prohibited in elementary schools, but were allowed in middle and high schools with size limits unregulated. In the federal Smart Snacks policy, these beverages are banned in elementary and middle schools and allowed in high schools with size limits up to twelve ounces.
Adherence to and implementation of CF&B policies may be another explanation. Evidence suggests adherence to CF&B varied across elementary, middle and high schools though compliance has improved over time in schools and school districts.49–51 Additionally, the comprehensiveness of policies governing food and beverages has been associated with district level implementation and with reporting, monitoring and evaluation,52,53 underscoring the need for stronger policies. The federal Smart Snacks in Schools policy may help minimize implementation differences in schools across the nation, thereby influence children’s diet and weight outcomes. Nearly all studies included in this review utilized data from before or just after the Smart Snacks policy took effect. Future studies are needed to examine the influences of the national Smart Snacks policy, including compliance, differences in compliance across schools and school districts, and related associations with children’s diet and body weight.
The studies in this review utilized a mix of designs. We observed some positive associations between CF&B laws and overweight/obesity among some students in some studies. Studies with generally weaker designs, including use of data from a single time point, hamper the ability to disentangle the temporal sequence between policy exposure and obesity. Some or all the observed positive associations suggest the possibility that states may have implemented stronger laws in response to high child obesity prevalence (i.e., reverse causation).40,44,54–56 Conversely, some national studies found a lack of associations in states or schools with strong laws, which may be related to lower child obesity prevalence in those places. For example, states or schools may have distinct characteristics associated with healthy weight such as higher socioeconomic advantage, healthier eating patterns, and/or better food and physical activity environments. In contrast other studies included in this review used pre-post with interrupted times series designs or a control group. These studies have the advantage of clear temporal sequence between the policy exposure and body weight, thus improving inferences about policy effects.
Isolating the effects of CF&B policies on obesity is challenging, because exposure to these policies is typically non-randomized, and because other strategies to prevent childhood obesity may be occurring simultaneously with these policies. Future studies may advance the field by unpacking the obesity influences of CF&B policies over time and in the context of other interventions. For instance, a simulation study estimated nutrition standards for foods and beverages in schools would have the largest effects in preventing childhood obesity in 2025 versus other interventions (e.g., SSB taxes, menu labeling policies, access to adolescent bariatric surgery).14
Environmental factors could play a role in the heterogeneity of findings across studies. The food environment near schools may enhance or undermine the effectiveness of CF&B policies, especially among children depending on their age/grade level, and food environment near their schools.57,58 Relative to elementary and middle school children, youth in high schools may be allowed off campus during lunchtime, thus, youth may be more likely to purchase and consume unhealthy foods and beverages from food outlets near high schools. Similarly, children of color often attend schools with greater concentrations of fast food and convenience stores nearby. Future research should assess differential associations between CF&B policies, the food environment near schools and obesity.
This review has limitations. We excluded studies published in languages other than English, and studies with samples outside of Canada and the U.S. Given the global increase in childhood obesity, it is imperative to incorporate strategies to prevent and mitigate youth obesity epidemics everywhere. One study from China examined policies similar to those studied here in relation to overweight/obesity, reporting mixed associations among girls but not boys,59 which is consistent with US evidence presented in this review. Studies from non-US countries are needed to provide insights on the effectiveness of policies that regulate food and beverages outside of school meals to determine potential differential policy influences across population subgroups in those countries. This review also did not include studies that stratified samples based on other socio-demographic factors; for example, children with or without special health care needs.60 Future research is needed to include dis-aggregated analyses based on children’s sexual and gender identity/orientation, immigration status and other factors that may influence dietary patterns and obesity so that we can identify subgroups who are in most need for interventions and policies to improve diet and nutritional outcomes. The papers included in this review were not assessed in terms of their ability to isolate the impact on obesity of the CF&B policies in the context of other interventions that may have been occurring simultaneously with the policies.
Implications
The present review found that over the period of twenty-two years, the accumulated body of evidence focused on population subgroups of children is relatively limited. Nevertheless, collectively, the findings have implications for future evaluations on the obesity effects of CF&B policies. While policies to regulate food and beverages in schools were not designed to specifically target reduction of obesity disparities by race and ethnicity, those policies may influence disparities because of differences in children’s consumption of CF&B items by gender, racial/ethnic and/or socioeconomic factors.21,29 This, in turn, may influence policy effects on obesity differently across population subgroups. For example, following the California CF&B policy, overweight/obesity disparities slightly narrowed between 7th grade African American and Latino versus White boys, whereas prior to the policies, disparities between these groups were widening.46 Moreover, national nutritional environment components similar to the USDA standards for CF&B are associated with significantly lower odds of overweight/obesity among non-white high school students, whereas no association was detected among White students.61 New studies are needed to systematically assess the impact of CF&B policies along with the national Smart Snacks policy on racial/ethnic and socioeconomic disparities in obesity. Additionally, varying geographies may affect the nature and characteristics of the child samples such as the racial/ethnic distribution, the baseline obesity prevalence, and the scope and duration of exposure to the policies in those places. The studies that examined a combination of various socio-demographic and locational data in the subgroup analyses were from California. There is a need to replicate similar subgroup analyses in other places across the United States and other countries that enact similar school nutrition policies.
It is perhaps, implausible to expect CF&B policies would have the same effects among diverse population subgroups, because of differences in exposure to structural factors including the social determinants of health.62–64 Children attend schools often located in vastly different neighborhoods of varying income levels and health-promoting or damaging resources including food outlets58,65 that carry healthy and unhealthy foods and beverages. To thoroughly understand reasons for mixed findings in this field, future studies with improved designs, are needed that disaggregate analyses by more than one population subgroup, particularly grade, race/ethnicity and socioeconomic markers. Research is warranted to identify population subgroups who may be more likely to benefit from the policies, and/or for whom targeted obesity prevention interventions are needed. Increasing and strengthening this body of evidence is necessary to evaluate the degree of consistency in the influences of CF&B policies on obesity across populations, places and time, and to enable thorough assessments of policy effectiveness.
The presence of the historic national policy for Smart Snacks coupled with the variation in state-level CF&B policies offers analytic opportunities to study the separate and combined effects of those policies on diet, obesity but also other child outcomes. An exemplar study exploited the strength, temporal and geographic differences among the state and national policies to evaluate CF&B policy associations with adolescent consumption of fruit and vegetables.66 Evidence suggests significant improvements in the school food environment.67 Based on data from the School Meal Nutrition Cost study, researchers observed greater availability of healthy beverages is associated with lower consumption of unhealthy beverages among high schoolers. Further, strong CF&B policies is associated with healthier school food environments, and lower consumption of unhealthy beverages.51 Using the same dataset, a comprehensive report68 observed that the vast majority of school breakfast (74%) and lunch (86%) participants consume competitive foods. School breakfast and lunch participants respectively consumed 125 and 150 calories from competitive foods. A high proportion of these calories comes from low nutrient, energy dense foods (68% and 66% for breakfast and lunch participants respectively). Continued programmatic and policy efforts are needed to implement population-level strategies to improve nutrition quality and prevent obesity among children. While the evidence reviewed here is limited and mixed for current CF&B policies, some of that evidence, suggests the strengths of policies could play a role in reducing youth obesity or halting upward trends. Strengthened nutrition policy interventions with provisions to further restrict availability of low-nutrient energy- dense foods and beverages, and to allocate resources for schools to support full policy implementation may hold promise in improving population-level children’s weight status specifically and health more broadly.
Conclusion
This study reviewed evidence over the past two decades, and revealed a limited number of studies on the associations between CF&B policies and obesity within gender, grade or race/ethnicity and socioeconomic subgroups. Many studies have reported findings separately by grade level or age, though there is less evidence by race/ethnicity or socioeconomic factors. The prevalence of childhood obesity remains high and varies across multiple sociodemographic factors, with disproportionately high burden among children of different races and ethnicities and children of lower socioeconomic backgrounds. Future studies using stronger designs are needed that disaggregate analyses by more than one demographic subgroup, particularly grade, race/ethnicity and socioeconomic markers, to help understand reasons for the variable findings. Additionally, research is warranted to reveal population subgroups for whom policies may have been more or less effective in preventing childhood obesity. Expanding and strengthening this body of evidence will help evaluate the degree of consistency in the influences of CF&B policies on obesity across populations, places and time. This, in turn, will enable thorough assessments of CF&B policy effectiveness in promoting healthy weight across all children and youth.
Supplementary Material
Acknowledgements
The authors received salary support from the National Institutes of Health. The funder had no role in the design and conduct of the study; collection, management, analysis, and interpretation of the data; preparation, review, or approval of the manuscript; and decision to submit the manuscript for publication. The content in this article is solely the responsibility of the authors and does not necessarily represent the official views of the funding institution. The authors declare no conflicts of interest.
Contributor Information
Emma V. Sanchez-Vaznaugh, Department of Public Health, Health Equity Institute, San Francisco State University and Center for Health Equity, University of California, San Francisco, CA.
Mika Matsuzaki, Department of International Health, Johns Hopkins Bloomberg School of Public Health, Baltimore, MD.
Maria Elena Acosta, Department of Public Health, San Francisco State University, CA.
Sahana Vasanth, Department of Public Health, San Francisco State University, CA.
Erika Rachelle Dugay, Department of Public Health, San Francisco State University, CA.
Brisa N. Sánchez, Department of Epidemiology and Biostatistics, Dornsife School of Public Health, Drexel University, PA.
References
- 1.Sanyaolu A, Okorie C, Qi X, Locke J, Rehman S. Childhood and adolescent obesity in the United States: a public health concern. Glob Pediatr Health. 2019;6:2333794X19891305. doi: 10.1177/2333794X19891305 [DOI] [PMC free article] [PubMed] [Google Scholar]
- 2.Wang Y, Beydoun MA, Min J, Xue H, Kaminsky LA, Cheskin LJ. Has the prevalence of overweight, obesity and central obesity levelled off in the United States? Trends, patterns, disparities, and future projections for the obesity epidemic. Int J Epidemiol. 2020;49(3):810–823. [DOI] [PMC free article] [PubMed] [Google Scholar]
- 3.Fryar CD, Carroll MD, Ogden CL. Prevalence of overweight, obesity, and severe obesity among children and adolescents aged 2–19 years: United States, 1963–1965 through 2015–2016. 2018; [Google Scholar]
- 4.Lange SJ, Kompaniyets L, Freedman DS, et al. Longitudinal Trends in Body Mass Index Before and During the COVID-19 Pandemic Among Persons Aged 2–19 Years - United States, 2018–2020. MMWR Morb Mortal Wkly Rep. Sep 17 2021;70(37):1278–1283. doi: 10.15585/mmwr.mm7037a3 [DOI] [PMC free article] [PubMed] [Google Scholar]
- 5.Woolford SJ, Sidell M, Li X, et al. Changes in Body Mass Index Among Children and Adolescents During the COVID-19 Pandemic. JAMA. 2021;326(14):1434–1436. doi: 10.1001/jama.2021.15036 [DOI] [PMC free article] [PubMed] [Google Scholar]
- 6.Institute of Medicine. Preventing Childhood Obesity: Health in the Balance. The National Academies Press; 2005:434. [PubMed] [Google Scholar]
- 7.Centers for Disease Control and Prevention. Comprehensive framework for addressing the school nutrition environment and services. Atlanta, GA: Centers for Disease Control and Prevention, US Dept of Health and Human Services; 2019. [Google Scholar]
- 8.Briefel RR, Wilson A, Gleason PM. Consumption of low-nutrient, energy-dense foods and beverages at school, home, and other locations among school lunch participants and nonparticipants. J Am Diet Assoc. 2009;109(2):S79–S90. [DOI] [PubMed] [Google Scholar]
- 9.Larson N, Story M. Are ‘competitive foods’ sold at school making our children fat? Health Aff (Millwood). 2010;29(3):430–435. [DOI] [PubMed] [Google Scholar]
- 10.Critch JN. School nutrition: Support for providing healthy food and beverage choices in schools. Paediatr Child Health. Feb 2020;25(1):33–46. doi: 10.1093/pch/pxz102 [DOI] [PMC free article] [PubMed] [Google Scholar]
- 11.Martorell H Canadian policy interventions supporting healthy eating in schools. FLEdGE (Food: Locally Embedded Globally Engaged) and Food Secure Canada; 2017. https://fledgeresearch.ca/?p=552 [Google Scholar]
- 12.Centers for Disease Control and Prevention. Competitive foods and beverages in US schools: A state policy analysis. Atlanta: US: Department of Health and Human Services. 2012. [Google Scholar]
- 13.Food and Nutrition Service, USDA. National School Lunch Program and School Breakfast Program: nutrition standards for all foods sold in school as required by the Healthy, Hunger-Free Kids Act of 2010. Interim final rule. Fed Regist. To be codified at 7 CFR §210 & 220. 2013;78(125):39068–39120. http://www.gpo.gov/fdsys/pkg/FR-2013-06-28/pdf/2013-15249.pdf [PubMed] [Google Scholar]
- 14.Gortmaker SL, Wang YC, Long MW, et al. Three Interventions That Reduce Childhood Obesity Are Projected To Save More Than They Cost To Implement. Health Aff (Millwood). Nov 2015;34(11):1932–9. doi: 10.1377/hlthaff.2015.0631 [DOI] [PMC free article] [PubMed] [Google Scholar]
- 15.Di Cesare M, Sorić M, Bovet P, et al. The epidemiological burden of obesity in childhood: a worldwide epidemic requiring urgent action. BMC Medicine. 2019/11/25 2019;17(1):212. doi: 10.1186/s12916-019-1449-8 [DOI] [PMC free article] [PubMed] [Google Scholar]
- 16.Chriqui JF, Pickel M, Story M. Influence of school competitive food and beverage policies on obesity, consumption, and availability: a systematic review. JAMA Pediatr. Mar 2014;168(3):279–86. doi: 10.1001/jamapediatrics.2013.4457 [DOI] [PubMed] [Google Scholar]
- 17.Welker E, Lott M, Story M. The school food environment and obesity prevention: progress over the last decade. Curr Obes Rep. Jun 2016;5(2):145–55. doi: 10.1007/s13679-016-0204-0 [DOI] [PubMed] [Google Scholar]
- 18.Micha R, Karageorgou D, Bakogianni I, et al. Effectiveness of school food environment policies on children’s dietary behaviors: A systematic review and meta-analysis. PLoS One. 2018;13(3):e0194555. doi: 10.1371/journal.pone.0194555 [DOI] [PMC free article] [PubMed] [Google Scholar]
- 19.Community Preventive Services Task Force. Healthier Food and Beverage Interventions in Schools: Recommendation of the Community Preventive Services Task Force. Am J Prev Med. Jul 2020;59(1):e11–e14. doi: 10.1016/j.amepre.2020.01.014 [DOI] [PubMed] [Google Scholar]
- 20.Bardin S, Washburn L, Gearan E. Disparities in the healthfulness of school food environments and the nutritional quality of school lunches. Nutrients. Aug 8 2020;12(8):2375. doi: 10.3390/nu12082375 [DOI] [PMC free article] [PubMed] [Google Scholar]
- 21.Terry-McElrath YM, O’Malley PM, Johnston LD. School soft drink availability and consumption among US secondary students. Am J Prev Med. 2013;44(6):573–582. [DOI] [PMC free article] [PubMed] [Google Scholar]
- 22.Cohen JF, Schwartz MB, Leider J, Turner L, Chriqui JF. Meal quality of entrées that can be sold as competitive foods in schools and potential impact of the proposed USDA rollbacks. Nutrients. 2020;12(10):3003. [DOI] [PMC free article] [PubMed] [Google Scholar]
- 23.Briefel RR, Crepinsek MK, Cabili C, Wilson A, Gleason PM. School food environments and practices affect dietary behaviors of US public school children. J Am Diet Assoc. Feb 2009;109(2 Suppl):S91–107. doi: 10.1016/j.jada.2008.10.059 [DOI] [PubMed] [Google Scholar]
- 24.Wiecha JL, Finkelstein D, Troped PJ, Fragala M, Peterson KE. School vending machine use and fast-food restaurant use are associated with sugar-sweetened beverage intake in youth. J Am Diet Assoc. 2006;106(10):1624–1630. [DOI] [PubMed] [Google Scholar]
- 25.Russo RG, Northridge ME, Wu B, Stella SY. Characterizing sugar-sweetened beverage consumption for US children and adolescents by race/ethnicity. J Racial Ethn Health Disparities. 2020;7(6):1100–1116. [DOI] [PMC free article] [PubMed] [Google Scholar]
- 26.Nanney MS, Bohner C, Friedrichs M. Poverty-related factors associated with obesity prevention policies in Utah secondary schools. J Am Diet Assoc. Jul 2008;108(7):1210–5. doi: 10.1016/j.jada.2008.04.019 [DOI] [PMC free article] [PubMed] [Google Scholar]
- 27.Sanchez-Vaznaugh EV, Sanchez BN, Crawford PB, Egerter S. Association between competitive food and beverage policies in elementary schools and childhood overweight/obesity trends: differences by neighborhood socioeconomic resources. JAMA Pediatr. May2015;169(5):e150781. doi: 10.1001/jamapediatrics.2015.0781 [DOI] [PMC free article] [PubMed] [Google Scholar]
- 28.Taber DR, Chriqui JF, Chaloupka FJ. Differences in nutrient intake associated with state laws regarding fat, sugar, and caloric content of competitive foods. Arch Pediat Adol Med. May 2012;166(5):452–8. doi: 10.1001/archpediatrics.2011.1839 [DOI] [PubMed] [Google Scholar]
- 29.Taber DR, Stevens J, Evenson KR, et al. State policies targeting junk food in schools: racial/ethnic differences in the effect of policy change on soda consumption. Am J Public Health. Sep 2011;101(9):1769–75. doi: 10.2105/AJPH.2011.300221 [DOI] [PMC free article] [PubMed] [Google Scholar]
- 30.Matsuzaki M, Sánchez BN, Rebanal RD, Gittelsohn J, Sanchez-Vaznaugh EV. California and federal school nutrition policies and obesity among children of Pacific Islander, American Indian/Alaska Native, and Filipino origins: interrupted time series analysis. PLoS Med. 2021;18(5):e1003596. [DOI] [PMC free article] [PubMed] [Google Scholar]
- 31.National Heart L, and Blood Institute. Study quality assessment tool: Quality assessment tool for observational cohort and cross-sectional studies. 2022. Accessed 2022-07-01, 2022. https://www.nhlbi.nih.gov/health-topics/study-quality-assessment-tools
- 32.National Heart L, and Blood Institute. Study quality assessment tool: Quality assessment tool for before-after (pre-post) studies with no control group. 2022. Accessed 2022-07-01, 2022. https://www.nhlbi.nih.gov/health-topics/study-quality-assessment-tools
- 33.Leonard PS. Do school junk food bans improve student health? Evidence from Canada. Can Public Policy. 2017;43(2):105–119. [Google Scholar]
- 34.Fung C, McIsaac JL, Kuhle S, Kirk SF, Veugelers PJ. The impact of a population-level school food and nutrition policy on dietary intake and body weights of Canadian children. Article. Prev Med. 2013;57(6):934–40. doi: 10.1016/j.ypmed.2013.07.016 [DOI] [PMC free article] [PubMed] [Google Scholar]
- 35.Datar A, Nicosia N. The effect of state competitive food and beverage regulations on childhood overweight and obesity. J Adolesc Health. May 2017;60(5):520–527. doi: 10.1016/j.jadohealth.2016.09.003 [DOI] [PMC free article] [PubMed] [Google Scholar]
- 36.Nanney MS, MacLehose RF, Kubik MY, et al. School obesity prevention policies and practices in Minnesota and student outcomes: a longitudinal cohort study. Am J Prev Med. Nov 2016;51(5):656–663. doi: 10.1016/j.amepre.2016.05.008 [DOI] [PMC free article] [PubMed] [Google Scholar]
- 37.Gee KA. Leveraging the public school system to combat adolescent obesity: the limits of Arkansas’s statewide policy initiative. J Adolesc Health. Nov 2018;63(5):561–567. doi: 10.1016/j.jadohealth.2018.06.006 [DOI] [PubMed] [Google Scholar]
- 38.Hennessy E, Oh A, Agurs-Collins T, et al. State-level school competitive food and beverage laws are associated with children’s weight status. J Sch Health. Sep 2014;84(9):609–16. [DOI] [PMC free article] [PubMed] [Google Scholar]
- 39.Palakshappa D, Fiks AG, Faerber JA, Feudtner C. Association between state school nutrition laws and subsequent child obesity. Prev Med. Sep 2016;90:107–13. doi: 10.1016/j.ypmed.2016.06.039 [DOI] [PubMed] [Google Scholar]
- 40.Riis J, Grason H, Strobino D, Ahmed S, Minkovitz C. State school policies and youth obesity. Matern Child Health J. Apr 2012;16 Suppl 1:S111–8. doi: 10.1007/s10995-012-1000-4 [DOI] [PubMed] [Google Scholar]
- 41.Sanjeevi N, Lipsky LM, Nansel TR, Haynie D, Liu A, Simons-Morton B. Stronger state school nutrition laws are associated with healthier eating behaviors and optimal weight status in US adolescents. Am J Health Promot. Nov 2020;34(8):857–866. doi: 10.1177/0890117120902346 [DOI] [PMC free article] [PubMed] [Google Scholar]
- 42.Jensen CD, Sato AF, McMurtry CM, Hart CN, Jelalian E. School nutrition policy: an evaluation of the Rhode Island healthier beverages policy in schools. ICAN: Infant, Child, & Adolescent Nutrition. 2012;4(5):276–282. doi: 10.1177/1941406412458314 [DOI] [Google Scholar]
- 43.Bauhoff S The effect of school district nutrition policies on dietary intake and overweight: a synthetic control approach. Econ Hum Biol. Jan 2014;12:45–55. doi: 10.1016/j.ehb.2013.06.001 [DOI] [PubMed] [Google Scholar]
- 44.Hoffman PK, Davey CS, Larson N, Grannon KY, Hanson C, Nanney MS. School district wellness policy quality and weight-related outcomes among high school students in Minnesota. Health Educ Res. Apr 2016;31(2):234–46. doi: 10.1093/her/cyv101 [DOI] [PMC free article] [PubMed] [Google Scholar]
- 45.Sanchez-Vaznaugh EV, Sanchez BN, Baek J, Crawford PB. ‘Competitive’ food and beverage policies: are they influencing childhood overweight trends? Health Aff (Millwood). Mar-Apr 2010;29(3):436–46. doi: 10.1377/hlthaff.2009.0745 [DOI] [PubMed] [Google Scholar]
- 46.Sanchez-Vaznaugh EV, Matsuzaki M, Braveman P, et al. School nutrition laws in the US: Do they influence obesity among youth in a racially/ethnically diverse state? Int J Obes. 2021;45(11):2358–2368. [DOI] [PMC free article] [PubMed] [Google Scholar]
- 47.Matsuzaki M, Sánchez BN, Acosta ME, Sanchez-Vaznaugh EV. Competitive food and beverage policies and obesity among middle school students: Variability by urbanicity in California. Child Obes. 2022;18(1):41–49. [DOI] [PMC free article] [PubMed] [Google Scholar]
- 48.Centers for Disease Control and Prevention. Characteristics of Vending Machines Available to Students in U.S. Schools: Results from the School Health Policies and Practices Study, 2014. Atlanta, Georgia: US Department of Health and Human Services; 2018. [Google Scholar]
- 49.Samuels SE, Hutchinson KS, Craypo L, Barry J, Bullock SL. Implementation of California state school competitive food and beverage standards. J Sch Health. Dec 2010;80(12):581–7. [DOI] [PubMed] [Google Scholar]
- 50.Wang YC, Hsiao A, Chamberlin P, et al. Nutrition quality of US school snack foods: A first look at 2011–2014 bid records in 8 school districts. J Sch Health. Jan 2017;87(1):29–35. doi: 10.1111/josh.12465 [DOI] [PubMed] [Google Scholar]
- 51.Chriqui JF, Leider J, Cohen JFW, Schwartz M, Turner L. Are nutrition standards for beverages in schools associated with healthier beverage intakes among adolescents in the US? Nutrients. Dec 29 2020;13(1)doi: 10.3390/nu13010075 [DOI] [PMC free article] [PubMed] [Google Scholar]
- 52.Chriqui JF, Leider J, Turner L, Piekarz-Porter E, Schwartz MB. State wellness policy requirement laws matter for district wellness policy comprehensiveness and wellness policy implementation in the United States. Nutrients. Jan 9 2021;13(1)doi: 10.3390/nu13010188 [DOI] [PMC free article] [PubMed] [Google Scholar]
- 53.Turner L, Asada Y, Leider J, Piekarz-Porter E, Schwartz M, Chriqui JF. Can monitoring make it happen? An assessment of how reporting, monitoring, and evaluation can support local wellness policy implementation in US schools. Nutrients. Jan 9 2021;13(1)doi: 10.3390/nu13010193 [DOI] [PMC free article] [PubMed] [Google Scholar]
- 54.Grannon KY, Larson N, Pelletier J, O’Connell MJ, Nanney MS. State agency support of weight-related school policy implementation. J Sch Health. Sep 2018;88(9):685–692. doi: 10.1111/josh.12673 [DOI] [PubMed] [Google Scholar]
- 55.Nanney MS, Nelson T, Wall M, et al. State school nutrition and physical activity policy environments and youth obesity. Am J Prev Med. Jan 2010;38(1):9–16. doi: 10.1016/j.amepre.2009.08.031 [DOI] [PMC free article] [PubMed] [Google Scholar]
- 56.Pelletier JE, Laska MN, MacLehose R, Nelson TF, Nanney MS. Evidence-based policies on school nutrition and physical education: Associations with state-level collaboration, obesity, and socio-economic indicators. Prev Med. Jun 2017;99:87–93. doi: 10.1016/j.ypmed.2017.02.005 [DOI] [PMC free article] [PubMed] [Google Scholar]
- 57.Ohri-Vachaspati P, Acciai F, Melnick EM, et al. Food environments within and outside of schools play a critical role in curtailing the rise in obesity among school-aged children over time. J Nutr. Oct 14 2023;doi: 10.1016/j.tjnut.2023.09.027 [DOI] [PMC free article] [PubMed] [Google Scholar]
- 58.Sanchez-Vaznaugh EV, Weverka A, Matsuzaki M, Sanchez BN. Changes in fast food outlet availability near schools: Unequal patterns by income, race/ethnicity, and urbanicity. Am J Prev Med. Sep 2019;57(3):338–345. doi: 10.1016/j.amepre.2019.04.023 [DOI] [PMC free article] [PubMed] [Google Scholar]
- 59.Jia P, Li M, Xue H, Lu L, Xu F, Wang Y. School environment and policies, child eating behavior and overweight/obesity in urban China: the childhood obesity study in China megacities. Int J Obes (Lond). May 2017;41(5):813–819. doi: 10.1038/ijo.2017.2 [DOI] [PubMed] [Google Scholar]
- 60.An R, Guan C, Ji M, Donovan S. State laws governing competitive foods and beverages sold in schools and childhood obesity among children with special healthcare needs, 2007–2016. Am J Health Behav. Nov 1 2018;42(6):124–133. doi: 10.5993/AJHB.42.6.12 [DOI] [PubMed] [Google Scholar]
- 61.Terry-McElrath YM, O’Malley PM, Johnston LD. Potential impact of national school nutritional environment policies: cross-sectional associations with US secondary student overweight/obesity, 2008–2012. JAMA Pediatr. Jan 2015;169(1):78–85. doi: 10.1001/jamapediatrics.2014.2048 [DOI] [PubMed] [Google Scholar]
- 62.Braveman P, Barclay C. Health disparities beginning in childhood: a life-course perspective. Pediatrics. Nov 2009;124 Suppl 3(Supplement 3):S163–75. [DOI] [PubMed] [Google Scholar]
- 63.Braveman PA, Egerter SA, Mockenhaupt RE. Broadening the focus: the need to address the social determinants of health. Am J Prev Med. Jan 2011;40(1 Suppl 1):S4–18. [DOI] [PubMed] [Google Scholar]
- 64.Williams DR, Jackson PB. Social sources of racial disparities in health. Health Aff (Millwood). Mar-Apr 2005;24(2):325–34. doi: 10.1377/hlthaff.24.2.325 [DOI] [PubMed] [Google Scholar]
- 65.Sanchez BN, Sanchez-Vaznaugh EV, Uscilka A, Baek J, Zhang L. Differential associations between the food environment near schools and childhood overweight across race/ethnicity, gender, and grade. Am J Epidemiol. Jun 15 2012;175(12):1284–93. doi: 10.1093/aje/kwr454 [DOI] [PMC free article] [PubMed] [Google Scholar]
- 66.Chriqui JF, Lin W, Leider J, Shang C, Perna FM. The harmonizing effect of Smart Snacks on the association between state snack laws and high school students’ fruit and vegetable consumption, United States-2005–2017. Prev Med. Oct 2020;139:106093. [DOI] [PMC free article] [PubMed] [Google Scholar]
- 67.Story M, Miller L, Lott M. The School Nutrition and Meal Cost Study-I: Overview of findings related to improving diet quality, weight, and disparities in US children and policy implications. Nutrients. Apr 19 2021;13(4)doi: 10.3390/nu13041357 [DOI] [PMC free article] [PubMed] [Google Scholar]
- 68.U.S. Department of Agriculture, Food and Nutrition Service, Office of Policy Support. School Nutrition and Meal Cost Study, Final Report Volume 4: Student Participation, Satisfaction, Plate Waste, and Dietary Intakes. 2019. https://www.fns.usda.gov/school-nutrition-and-meal-cost-study
Associated Data
This section collects any data citations, data availability statements, or supplementary materials included in this article.