

Abstract
Endometriosis is a common and debilitating disease, affecting ∼170 million women worldwide. Affected patients have limited therapeutic options such as hormonal suppression or surgical excision of the lesions, though therapies are often not completely curative. Targeting receptor tyrosine kinases (RTKs) could provide a nonhormonal treatment option for endometriosis. We determined that 2 RTKs, macrophage-colony stimulating factor 1 receptor (CSF1R) and mast/stem cell growth factor receptor KIT (KIT), are overexpressed in endometriotic lesions and could be novel nonhormonal therapeutic targets for endometriosis. The kinase activity of CSF1R and KIT is suppressed by pexidartinib, a small molecule inhibitor that was recently approved by the US Food and Drug Administration. Using immunohistochemistry, we detected CSF1R and KIT in endometriotic tissues obtained from peritoneal lesions, colorectal lesions, and endometriomas. Specifically, we show that KIT is localized to the epithelium of the lesions, while CSF1R is expressed in the stroma and macrophages of the endometriotic lesions. Given the high epithelial expression of CSF1R and KIT, 12Z endometriotic epithelial cells were used to evaluate the efficacy of dual CSF1R and KIT inhibition with pexidartinib. We found that pexidartinib suppressed activation in 12Z cells of JNK, STAT3, and AKT signaling pathways, which control key proinflammatory and survival networks within the cell. Using quantitative real-time polymerase chain reaction, we determined that pexidartinib suppressed interleukin 8 (IL8) and cyclin D1 (CCND1) expression. Lastly, we demonstrated that pexidartinib decreased cell growth and viability. Overall, these results indicate that pexidartinib-mediated CSF1R and KIT inhibition reduces proinflammatory signaling and cell viability in endometriosis.
Keywords: endometriosis, nonhormonal therapeutics, CSF1R, KIT, pexidartinib, PLX3397
Endometriosis is a common but potentially debilitating disease defined by the presence of benign endometrial glands and stroma occurring outside the uterus. It is estimated that approximately 10% of all women have the disease, though disease prevalence increases when considering patients with infertility or chronic pelvic pain (1-3). The condition can cause a significant symptom burden for patients, ranging from pain, infertility, requirement for surgical procedures to gastrointestinal disturbances (1).
Despite the disease prevalence and burden of disease, a complete understanding of the pathogenesis of endometriosis remains unclear and new therapeutic options remain elusive. The most widely accepted theory of how endometriosis begins is that retrograde menstruation seeds endometrial cells in the abdomen and pelvis which implant and persist to cause symptomatology (3). However, since most women who experience retrograde menstruation do not develop endometriosis, additional factors must be involved at a cellular level to allow extrauterine implantation and survival. Increased activity of receptor tyrosine kinases (RTKs) could explain some of these factors since they often control key cellular processes such as proliferation, differentiation, metabolism, and cell cycle regulation (4-6). RTKs have also proven attractive for novel therapeutics in other conditions, so if RTKs are confirmed to be expressed and upregulated in endometriosis lesions, they could not only provide clues to the pathogenesis of the disease but also be targeted for novel, nonhormonal therapeutic options.
Mast/stem cell growth factor receptor KIT (here referred to as KIT) is the RTK encoded by KIT. It serves as the receptor for KIT ligand (here referred to as KITL)/stem cell factor and has previously been shown to be expressed in a wide variety of human tissues. Its interaction with KITL is known to affect multiple processes like cell survival, cell proliferation and cell migration, all of which could play roles in the development of endometriosis (7). Another RTK that is similar in molecular structure to KIT is macrophage colony-stimulating factor 1 receptor (which we abbreviate as CSF1R), encoded by CSF1R (8). CSF1R signals in response to its ligand, macrophage colony-stimulating factor 1 (here abbreviated as MCSF) and is best known for its role in stimulating monocyte-derived cell growth and proliferation. However, it has also been described in other tissue types including the human uterus, where early work showed that CSF1R and MCSF may be involved in placental invasion and differentiation (9-13). With a known role in tissue invasion at the uteroplacental interface, this RTK could also potentially provide a pathologic role in the formation of endometriosis. Previous studies identified that KIT and CSF1R expression were elevated in the endometriotic lesions in patients with endometriosis, suggesting that inhibition of these pathways could serve a therapeutic benefit in endometriosis (14, 15).
Targeting CSF1R in other diseases led to the development of pexidartinib, or PLX3397, which is a novel RTK inhibitor that has been approved by the US Food and Drug Administration (FDA) for the indication of tenosynovial giant-cell tumors (16). In addition to inhibiting CSF1R at a 13 nM concentration in enzymatic assays, pexidartinib also inhibits KIT activity with an affinity of 27 nM in these same tests. In this study we hypothesize and sought to assess if CSF1R and KIT are upregulated in endometriosis lesions and if the FDA-approved CSF1R/KIT inhibitor, pexidartinib, could be used to reduce cellular activity and cell survival in an immortalized endometriosis cell line, 12Z (RRID:CVCL_0Q73) (17).
Materials and Methods
Evaluation of CSF1R, KIT, CSF1, and KITL in Previously Published Data Sets
The EndometDB is a database that evaluated lesion-specific gene expression from over 100 patients with endometriosis and 50 control patients (accessed at https://endometdb.utu.fi/) (18). We assessed gene expression in 1 database (GSE141549) to evaluate for RTKs that were upregulated in human endometriosis specimens compared with normal and eutopic endometrium. We focused our search on RTKs that already had FDA-approved small-molecule inhibitors to select which targets to assess experimentally.
Cell Culture and Protein Extraction and Quantification
12Z cells (validation available in supplemental information, available at doi:10.5061/dryad.66t1g1k7s (19)) were cultured in Dulbecco's modified Eagle’s medium (DMEM, Gibco, USA, catalog #11966025) with 10% fetal bovine serum (FBS, Sigma-Aldrich, USA, catalog #F2442) and antibiotic/antimycotic (Gibco, USA, catalog #15240-062) (hereafter referred to as standard media). Media changes occurred every 2 to 3 days with passaging every 4 to 5 days. For protein isolation, cells were manually removed from dishes using cell lifters (Corning, USA, catalog #CLS3008). After temperature-controlled centrifugation at 4 °C, cell pellets were stored at −80 °C until use. Protein extraction was performed using Mammalian Protein Extraction Reagent (ThermoScientific, USA, catalog #78505), Halt Phosphatase Inhibitor Cocktail (ThermoScientific, USA, catalog #78420), and Halt Protease Inhibitor Cocktail (ThermoScientific, USA, catalog #78429). Protein concentrations were then calculated using Pierce BCA Protein Assay reagents (ThermoScientific, USA, catalog #23227) according to the manufacturer's instructions and then quantified by measuring absorbance at 562 nm with the Tecan Infinite M1000Pro (Switzerland) using Magellan software 7.2.
Western Blot Analyses
Western blot samples were made from each protein source by combining protein supernatant, Mammalian Protein Extraction Reagent, and a 4 × NuPAGE LDS Sample Buffer (Invitrogen, USA, catalog #NP0008) with 5% 2-Mercaptoethanol (Sigma-Aldrich, USA, catalog #M-7522). Samples were boiled at 95 °C for 10 minutes after mixing and either loaded on the gel for electrophoresis or stored at −80 °C until used.
We used 12 or 15-lane mini protein gels (Bolt 4-12% Bis-Tris Plus. Invitrogen. USA, catalog #NW04122BOX or #NW04125BOX), a 180 kilodalton (kDa) protein ladder (ThermoScientific, USA, catalog #26616) and Bolt MES SDS running buffer (Invitrogen, USA, catalog #B000202) in all western blot analyses. Samples were loaded and run at 100 volts for 10 minutes then 180 volts for 40 to 50 minutes to complete protein separation. After electrophoresis, gels were transferred to nitrocellulose membranes using the Trans-Blot Turbo Transfer Kit (Bio-Rad, USA, catalog #1704273). After protein transfer, nitrocellulose membranes were incubated in 5% milk (Difco, USA, catalog #232100) in 1 × tris-buffered saline with Tween 20 detergent (TBST, GenDepot, USA, catalog #T8056-100) for 60 minutes for nonspecific blocking. Membranes were then incubated in their respective primary antibodies at corresponding dilutions (see Table 1 for all primary and secondary antibodies used) overnight at 4 °C.
Table 1.
Primary and secondary antibodies used
| Antibody | Catalog number | RRID | Source | Company | Dilution | Application |
|---|---|---|---|---|---|---|
| Anti-CSF1R | 3152 | AB_2085233 | Rabbit | Cell Signaling | 1:1000 | Western blot |
| Anti-KIT | A450229-2 | AB_2335702 | Rabbit | Agilent | 1:1000 1:200 |
Western blot Immunohistochemistry |
| Anti-CSF1R | 183316 | AB_2885197 | Rabbit | Abcam | 1:200 | Immunohistochemistry |
| Anti-CD68 | 14-0688-82 | AB_11151139 | Mouse | ThermoFisher Scientific | 1:1000 | Immunohistochemistry |
| Phosphorylated STAT3 | 9145 | AB_2491009 | Rabbit | Cell Signaling | 1:1000 | Western blot |
| Total STAT3 | 8768 | AB_2722529 | Rabbit | Cell Signaling | 1:1000 | Western blot |
| Phosphorylated JNK | 4668 | AB_823588 | Rabbit | Cell Signaling | 1:1000 | Western blot |
| Total JNK | 9252 | AB_2250373 | Rabbit | Cell Signaling | 1:1000 | Western blot |
| Phosphorylated AKT | 9271 | AB_329825 | Rabbit | Cell Signaling | 1:1000 | Western blot |
| Total AKT | 9272 | AB_329827 | Rabbit | Cell Signaling | 1:1000 | Western blot |
| GAPDH-HRP conjugate | HRP-60004 | AB_2737588 | Mouse | ProteinTech | 1:5000 | Western blot |
| Anti-rabbit HRP conjugate | 711-035-152 | AB_10015282 | Donkey | Jackson ImmunoResearch Laboratories | 1:5000 | Western blot |
| Anti-rabbit biotinylated antibody | BA-1000 | AB_2313606 | Goat | Vector Laboratories | 1:200 | Immunohistochemistry |
| Anti-mouse biotinylated antibody | BA-9200 | AB_2336171 | Goat | Vector Laboratories | 1:200 | Immunohistochemistry |
A listing of the primary and secondary antibodies used for western blot and immunohistochemistry.
Abbreviations: AKT, protein kinase B; HRP, horseradish peroxidase; JNK, c-Jun N-terminal kinase; STAT3, signal transducer and activator of transcription-3.
After incubating with primary antibody, membranes were washed 3 times at 5 minutes intervals in TBST. They were then incubated in 5% milk in TBST containing the corresponding secondary antibodies conjugated to horseradish peroxidase at a dilution of 1:5000 for 60 minutes. Membranes were then washed 3 times for 5 minutes each in TBST before development. SuperSignal West Pico Plus Chemiluminescent substrate (Pico Plus, ThermoScientific, USA, catalog #34580) and SuperSignal West Femto Maximum Sensitivity Substrate (Femto, ThermoScientific, USA, catalog #34095) were used as chemiluminescent reagents before imaging on the iBright CL1500 Imaging System (Invitrogen, USA, catalog #A44114). For all GAPDH imaging, Pico Plus was used; Femto substrate was used for all other western blots. If membrane stripping was required, we washed the membrane in Restore Western Blot Stripping Buffer (ThermoScientific, USA, catalog #21063) for 15 minutes before rinsing in TBST, blocking in 5% milk in TBST and then proceeding with primary antibody incubation as mentioned previously.
Immunohistochemistry
We used pathology-confirmed human surgical endometriosis specimens and normal endometrial samples collected as part of an institution review board–approved protocol (H-21138) for immunohistochemistry (IHC). Slides were deparaffinized in histoclear (National Diagnostics, USA, catalog #HS-202) for 2 10-minute periods. They were then rehydrated for 30 seconds in solutions of 100% ethanol twice, 90% ethanol, 80% ethanol, 60% ethanol, and then distilled water twice. After completing deparaffinization, we heated slides in 10 mM sodium citrate and 0.05% Tween 20 at pH 6 for 20 minutes, allowed them to cool for 40 minutes, and then incubated the slides in 3% hydrogen peroxide in TBST for 10 minutes at room temperature. After rinsing in TBST, slides were placed in a humidified chamber. They were blocked with Avidin for 10 minutes, rinsed briefly in TBST, blocked with Biotin for 10 minutes (Vector Laboratories, USA, catalog #SP-2001), rinsed again in TBST, then blocked with 3% bovine serum albumin (BSA, Sigma-Aldrich, USA, catalog #A2153) in TBST for 60 minutes. After blocking, they were incubated overnight at 4 °C with primary antibody diluted in 3% BSA in TBST.
After incubation, slides were washed with TBST for 2 5-minute intervals. They were then incubated in secondary antibodies in 3% BSA in TBST for 1 hour. We prepared the ABC solution (Vector Laboratories, USA, catalog #PK-6100) 30 minutes into this incubation by combining the solutions at a ratio of 1 drop of reagent A and B each for every 2.5 mL of TBST. After washing the tissue slides with 2 5-minute washes in TBST, we incubated sections with the dilute ABC mixture for 1 hour. We then washed the slides 3 times for 5 minutes each in TBST before applying DAB solution (Vector Laboratories, USA, catalog #SK-100). When an appropriate reaction interval passed, we stopped the reaction with distilled water. We then counterstained slides by using 0.22-μm filter-sterilized hematoxylin (Sigma-Aldrich, USA, catalog #MHS32). Slides were dehydrated by placing them in 60%, 80%, and 95% ethanol for 30 seconds each before 2 washes in 100% ethanol for 30 seconds each. Slides were then washed twice in xylene (Honeywell, USA, catalog #534056) for 10 minutes each before mounting with Permount (Fisher Scientific, USA, catalog #SP15-100). Slides were imaged microscopically (Nikon, Japan, catalog #BX41-PH-B), evaluated with a gynecologic pathologist for characterization, and digitally imaged (Nikon DS-Fi2 and through the Baylor College of Medicine's Department of Pathology Digital Pathology Service). After imaging, digital versions of each slide were evaluated using ImageJ software (20, 21). Relative staining was quantified across 3 or 4 different samples of each tissue type, with pooled averages for each tissue type compared for statistically significant changes.
Dose–Response Assays and Inhibitor Studies Assessing Protein Phosphorylation
We purchased and resuspended KITL (Biotechne, R&D Systems, USA, catalog #255-SC) and MCSF (Biotechne, R&D Systems, USA, catalog #216-MC) per manufacturer's instructions. We selected and then purchased the CSF1R/KIT inhibitor, PLX3397/pexidartinib (MedChemExpress, USA, catalog #HY-16749, CAS no: 1029044-16-3), resuspended it in dimethyl sulfoxide (DMSO, Sigma-Aldrich, USA, catalog #D2650), and stored it at −20 °C until use.
In dose–response assays, we plated 500 000 12Z cells on 6-well plates using standard media. The following evening, we placed the cells in media containing 2% FBS and then cultured cells the next morning with either vehicle or increasing concentrations of each ligand, choosing concentrations of 12.5, 25, 50, and 100 ng/mL to assess dose responses. After treating cells with the ligands, we collected cells 30 and 60 minutes later to assess for protein phosphorylation via western blot analysis as previously described. For analysis, we assessed signaling activity in the c-Jun N-terminal kinase (JNK), signal transducer and activator of transcription-3 (STAT3), and AKT (also known as protein kinase B) pathways.
For inhibitor studies, we plated 500 000 12Z cells on 6-well plates using standard media. The next evening, we changed the cells’ media to media containing 2% charcoal-stripped FBS (CS-FBS). The following morning, we added dilute DMSO and pexidartinib in 2% CS-FBS prior to cell collection. To assess the effect of pexidartinib on 12Z cells without the presence of stimulatory ligands, we cultured the cells in 10 μM DMSO or pexidartinib concentrations of 1, 3, and 10 μM for 60 and 90 total minutes (to reflect the total inhibitor exposure in the ligand experiments) at 37 °C before collecting cells for protein quantification and western blot analysis as previously described. For experiments involving the inflammatory ligands, we first incubated cells in 1.5 mL of 20 μM DMSO vehicle control or pexidartinib concentrations that were 2 times the desired final concentration, in this case adding 2, 6, and 20 μM, for thirty minutes. After this initial pretreatment, we added 2% CS-FBS media to the vehicle control and a 2× concentrated ligand solution to each experimental condition to create a final ligand concentration of 25 ng/mL for both MCSF and KITL, pexidartinib concentrations of 1, 3, and 10 μM, and a DMSO concentration of 10 μM. After incubating at 37 °C for 30 and 60 minutes to allow for 60 and 90 minutes of drug exposure, we collected cells for protein quantification and western blot analysis. Experiments were performed in triplicate for reproducibility and for statistical analysis.
For semiquantification, we used ImageJ software (20) to estimate western blot band strength for phosphorylated antibody signal, total antibody levels, and GAPDH controls. After quantification, we normalized values by using the vehicle lanes as the reference then dividing each subsequent lane by the vehicle value. Once this was done for phosphorylated antibody, total antibody, and housekeeping protein control, we divided the phosphorylated antibody levels by the total antibody values and then divided this ratio by GAPDH for standardization. After creating normalized signal ratios for the 3 experiments, the values were averaged across the 3 experiments and assessed for statistically significant differences.
Gene Expression in the Presence of Pexidartinib
We plated 100 000 12Z cells on 12-well plates using standard media. The next evening, we removed the media and replaced it with DMEM 1×, antibiotic/antimycotic, and 2% CS-FBS. The following morning, we then performed inhibitor studies in the presence and absence of MCSF and KITL. To assess the effect of pexidartinib independent of ligands, cells were cultured in 2% CS-FBS containing either 10 μM DMSO or 3 and 10 μM pexidartinib concentrations. After 6 hours of incubation at 37 °C, cells were collected in RLT Lysis Buffer (Qiagen, Netherlands, catalog #79216) with suspensions frozen at −80 °C until RNA extraction. For experiments with KITL and MCSF, we first pretreated the cells with either vehicle control (DMSO) or concentrations of pexidartinib that were 2 times the desired final concentration, in this case adding 6 and 20μM of pexidartinib for 30 minutes. We then added 2% CS-FBS media to vehicle control wells and added 2 times the desired final concentration of ligand solution to their respective wells to bring the final inhibitor concentration to 3 and 10 μM, the final ligand concentration to 25 ng/mL, and DMSO vehicle control to a final concentration of 10 μM. We incubated the plates for 6 hours at 37 °C then collected and stored the suspensions as mentioned previously.
For RNA extraction, the RNeasy Mini Kit (Qiagen, Netherlands, catalog #74104) was used per manufacturer's specifications along with utilizing DNAse I (Qiagen, Netherlands, catalog #79256). After completing RNA extraction, RNA levels were quantified using the NanoDrop Spectrophotometer ND-1000 (Marshall Scientific, USA, catalog #ND-1000) before generating complementary DNA (cDNA). We added 1000 ng of mRNA to RNAse-free water and qScript (QuantaBio, USA, catalog #95048) then placed in the thermal cycler (BioRad, USA, catalog #1861096) for 5 minutes at 25 °C, 30 minutes at 42 °C, and 5 minutes at 85 °C to complete cDNA generation. The cDNA was diluted and then plated for quantitative polymerase chain reactions. Primer master-mixes were made by adding water, the forward and reverse primer pairs (see Table 2 for primer pairs), and a SYBR Green Master Mix (AppliedBiosystems, USA, catalog #4309155). We then performed quantitative polymerase chain reaction and results were quantified using the 2−ΔΔCt method (22). The absolute CT number for GAPDH was also compared to see if any gene expression differences were driven by changes in overall gene expression. All experiments were performed with 3 technical replicates and 3 to 4 biological replicates to ensure reproducibility. We analyzed each experiment to produce an average value of the technical replicates then compared each experimental result across the experimental replicates to allow statistical analysis.
Table 2.
qPCR primer pairs used
| Gene | Forward primer | Reverse primer | NCBI gene number |
|---|---|---|---|
| IL-8 | GAGAGTGATTGAGAGTGGACCAC | CACAACCCTCTGCACCCAGTTT | 3576 |
| CCND1 | GCTGCGAAGTGGAAACCATC | CCTCCTTCTGCACACATTTGAA | 595 |
| GAPDH | ACAACTTTGGTATCGTGGAAGG | GCCATCACGCCACAGTTTC | 2597 |
A listing of the forward and reverse primer pairs used for the genes of interest in quantitative real-time polymerase chain reaction experiments.
Cell Viability in the Presence of Pexidartinib
We plated 2000 12Z cells per well in 96-well plates using standard media. The next day, we removed the media and replaced it with DMEM containing 10% CS-FBS, Antibiotic/Antimycotic and either DMSO vehicle or increasing concentrations of pexidartinib. Cells were then incubated at 37 °C in the presence of 20 μM DMSO or pexidartinib concentrations of 1, 3, 10, or 20 μM. After 72 hours, media was removed and phenol-red free media was added. Next, a luminescent cell viability substrate mixture (Promega, USA, catalog #G7570) was added to each experimental well, and after mixing, the solution was transferred to new 96-well plates for measurement. Luminescence was measured using the Tecan Infinite M1000Pro and Magellan software 7.2.
Luminescence output was compared as a relative cell survival percentage. Relative cell survival was calculated by dividing luminescence output from each experimental condition by the vehicle control to give a fractional cell survival value. Each experiment was performed with quadruplicate technical replicates to give an average luminescence value for each condition in each experiment. These values were then averaged across the 3 experiments for evaluation and statistical comparison.
Statistical Analysis
We analyzed gene expression in a previously published dataset (GSE141549) using R 4.2.0. We limited our assessment of the database to evaluating RTKs, and we performed t-tests comparing gene expression from endometrium from women with endometriosis (patient endometrium, PE) and each lesion subtype (peritoneal endometriosis lesion, PeL; DIE, deep-infiltrating endometriosis; endometrioma, OMA) against control endometrium (CE). For analysis, P values were adjusted by the Bonferroni method, with P ≤ .001 considered as significant to account for the multiple comparisons. In IHC experiments, pooled averages of relative staining were compared using the Kruskal–Wallis test with a Dunn's multiple comparison post-test with significance noted at P ≤ .05 For comparison of western blot phosphorylation ratios, gene expression data, and cell viability, 1-way analysis of variance (ANOVA) tests were performed on pooled averages of the replicate experiments for each set of results, and statistical significance was noted at P ≤ .05. IHC, Western blot, gene expression, and cell viability data were analyzed using GraphPad Prism version 9 software.
Results
KIT and CSF1R Expression Are Upregulated in Endometriotic Lesions
Analysis of a previously published dataset (GSE 141549) revealed that KIT and CSF1R both showed increases in RNA expression in PE (n = 104) and endometriosis lesions (PeL, n = 79; DIE, n = 91; OMA, n = 28) compared with control endometrium (CE, n = 43) (Fig. 1). We also observed increased levels of the ligands for each of these receptors, KITLG and CSF1, in the endometriotic lesions compared with the control and patient eutopic endometrium (Fig. 1A). Lesion types including PeL, DIE, and OMAs showed statistically significant increases compared with CE and PE (Fig. 1). KIT expression appeared to be highest in advanced-stage endometriosis lesions such as DIE and OMAs (Fig. 1B). CSF1R expression was increased in peritoneal endometriosis compared to the other lesion types, but all 3 lesion types showed increased expression compared to the control endometrium (Fig. 1B). Given the overexpression observed, we elected to pursue CSF1R and KIT as potential targets for drug inhibition in endometriosis. We also selected pexidartinib as an experimental therapeutic given its strong specificity for both CSF1R and KIT (16).
Figure 1.
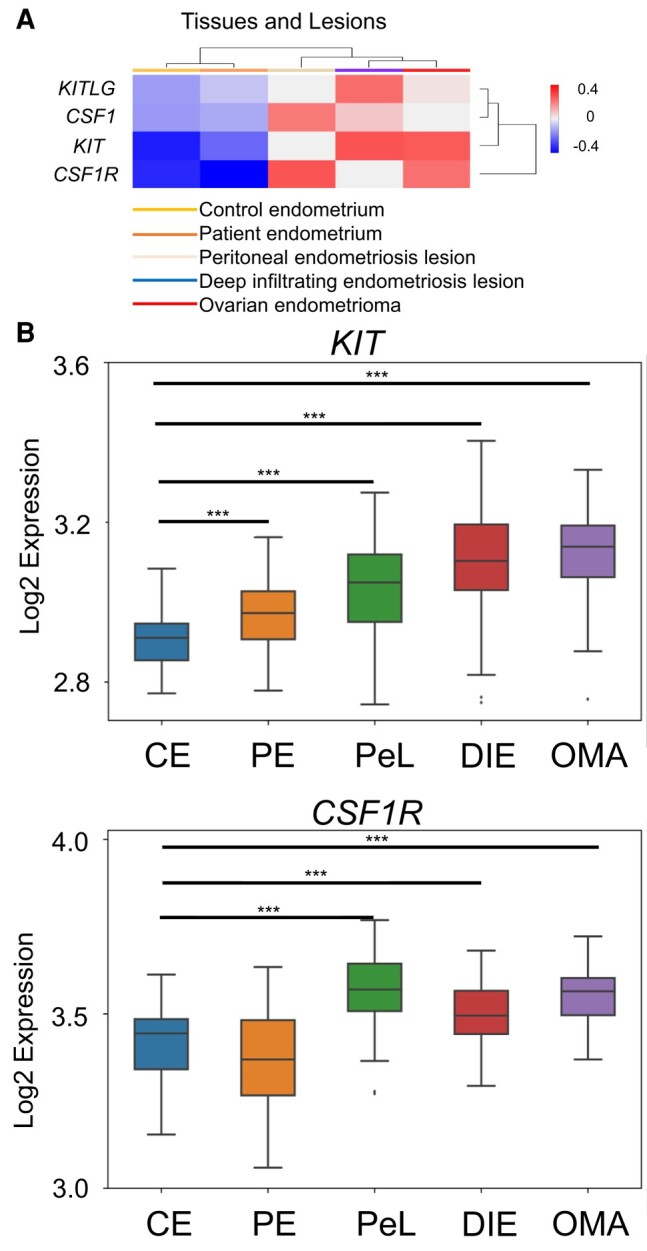
KIT and CSF1R are upregulated in endometriosis lesions. (A) Heat-map assessment of KIT and CSF1R and the genes for their respective ligands derived from EndometDB. Median values of patient and control samples of the endometrium and lesions were plotted on a cluster heatmap using complete linkage. (B) Specific analyses of KIT and CSF1R expression across endometriosis lesion types. Abbreviations: CE, control endometrium; PE, patient endometrium; PeL, peritoneal endometriosis lesion; DIE, deep infiltrating endometriosis; OMA, endometrioma. Lesion expression evaluated with normal t-test of each condition vs control endometrium. ***P ≤ .001.
KIT and CSF1R Are Both Identified in Endometriosis Stroma and Epithelium
Immunohistochemistry was performed on histologically confirmed endometriosis specimens and on normal endometrium to compare tissue expression of CSF1R and KIT (Fig. 2). KIT staining showed predominantly an epithelial pattern (Fig. 2A-2D) while CSF1R staining seemed to localize more to the stroma (Fig. 2E-2H). Analysis was performed in endometrium from the proliferative and midsecretory phases; however, no significant differences in KIT or CSF1R were observed between the groups. There were some regions of epithelium that stained for CSF1R, with these tending to occur in regions of tubal metaplasia (Fig. S1A, indicated by arrowheads (19)). When comparing expression levels, we saw a trend toward increased KIT expression in peritoneal (Pelvic) and OMA lesions (Fig. 2I) compared with endometrial samples. CSF1R expression showed a statistically significant increase (P = .01, Kruskal–Wallis test) in peritoneal (Pelvic) lesions compared with the midsecretory endometrium along with a trend of increased lesion expression in rectal lesions and in OMAs (Fig. 2J). To perform a subjective assessment of the stromal cell population(s) that expressed the protein, we utilized serial sections to colocalize CSF1R against macrophage location by comparing CSF1R expression against CD68 expression (Fig. S1A-F (19)). These results indicated that CSF1R expression tended to occur in stromal cells and macrophages, with colocalization somewhat more consistent in OMAs or colorectal lesions.
Figure 2.

Endometriosis lesions express KIT and CSF1R. Pathology-confirmed endometriosis lesions and normal endometrium were stained with KIT antibody (A-D) and CSF1R antibody (E-H). KIT expression was predominantly an epithelial pattern, while CSF1R was mostly expressed in the stroma of lesions. KIT expression showed a trend to increased expression in peritoneal and endometrioma lesions (I) while CSF1R was upregulated in pelvic lesions (P = .01) compared with MSE samples (J). There was a trend to increased CSF1R expression in all lesion types compared to endometrial samples. Scale bar: 60 μm in all images. Abbreviations: ProEn-proliferative phase endometrium; MSE-mid-secretory phase endometrium; Rectal-colorectal endometriosis lesion; Pelvic-pelvic peritoneal endometriosis lesions; OMA-endometrioma. Images represent experiments performed in 3 or 4 patients per lesion subtype. Analyzed using a Kruskal–Wallis test with a Dunn's post-test for multiple comparisons. *P ≤ .05.
Pexidartinib Reduces AKT, JNK and STAT3 Signaling in 12Z Cells
We first performed dose–response assays to evaluate MCSF and KITL activation in 12Z cells by assessing protein phosphorylation levels in the JNK, STAT3, and AKT pathways. We observed a dose-dependent increase in JNK phosphorylation at 60 minutes after MCSF stimulation and after 30 minutes of KITL stimulation (Fig. S2A and B (19)). Increased phosphorylated STAT3 was observed after 30 minutes of KITL exposure (Fig. S3A and B (19)). Phosphorylated AKT (pAKT) levels increased ∼1.3-fold with 25 ng/mL of MCSF after 60 minutes, while 25 ng/mL of KITL also increased pAKT ∼1.3-fold after 30 minutes (Fig. S4A and B (19)). Given that 25 ng/mL consistently stimulated all the pathways tested, we elected to use 25 ng/mL to attempt to use the lowest ligand dose possible for future experiments. After completing the ligand dose-response investigation, we next explored pexidartinib's effects on these same pathways.
When 12Z cells were stimulated with MCSF, pexidartinib reduced activity in several pathways (Fig. 3). Pretreatment with a pexidartinib concentration of 3 and 10μM reduced phosphorylated JNK (pJNK) signaling by 60% (P = .05, 1-way ANOVA) and 97% (P = .002), respectively, after 30 minutes of ligand exposure (Fig. 3A and 3B; 60 minute data available at Fig. S5A (19)). Regarding phosphorylated STAT3 (pSTAT3), pexidartinib reduced MCSF signaling by 48% (P = .005) and 67% (P < .001) at the 3 μM and 10 μM concentrations, respectively, compared with the ligand condition at 60 minutes (Fig. 3C and 3D; 30 minute data available at Fig. S5C (19)). Pexidartinib also inhibited phosphorylated AKT (pAKT) signaling at both time points after MCSF stimulation (Fig. 3E). At 30 minutes, signaling was reduced by approximately 90% by the 10 μM concentration (P = .02) (Fig. 3F). At 60 minutes, pexidartinib concentrations of 3 μM decreased pAKT levels by 99% (P = .04), and concentrations of 10 μM reduced activity 130% compared to the ligand condition (P = .009) (Fig. 3G).
Figure 3.

Pexidartinib reduces intracellular signaling after MCSF stimulation in 12Z cells. 12Z cells were stimulated with MCSF (25 ng/mL) and 3 increasing concentrations of pexidartinib. Pexidartinib reduced phosphorylated JNK signaling at 30 minutes (A, B) and phosphorylated STAT3 signaling at 60 minutes (C, D) with both the 3 μM and 10 μM concentrations. Pexidartinib reduced AKT activity at the 10μM concentration at 30 minutes of ligand exposure (E, F), and it reduced activity at 60 minutes by both the 3 and the 10μM concentration (E, G). GAPDH utilized for loading control. Time points of T = 30 minutes and T = 60 minutes reflect duration of ligand exposure. Abbreviations: L, ladder; V, vehicle; Pex, pexidartinib; AU, arbitrary unit; pJNK, phosphorylated JNK; pSTAT3, phosphorylated STAT3; pAKT, phosphorylated AKT; T, time; Min, minutes. Histograms represent mean ± SEM. Analyzed by one-way ANOVA with a Tukey's post-test. *P ≤ .05; **P < .01; ***P < .001. Experiments were replicated using 3 biological replicates.
Pexidartinib also inhibited KITL-stimulated STAT3 and AKT signaling in 12Z cells (Fig. 4). There was no significant effect on JNK signaling after KITL stimulation at either 30 or 60 minutes (Fig. 4A and 4B; see also 60 minute data available elsewhere (Fig. S5B (19)). At 60 minutes, KITL-mediated STAT3 phosphorylation was reduced by 113% (P = .002) by the 10 μM pexidartinib concentration (Fig. 4C and 4D); 30 minute data available elsewhere (Fig. S5D (19)). KITL signaling through AKT was significantly affected at both time points (Fig. 4E-4G). When compared to the ligand condition at 30 minutes, pexidartinib reduced pAKT levels by approximately 43% (P = .01), 47% (P = .009) and 70% (P < .001) at the 1, 3, and 10 μM concentrations, respectively (Fig. 4E and 4F). After 60 minutes of ligand exposure, pexidartinib continued to reduce pAKT levels, with concentrations of 1, 3, and 10 μM all showing reductions in phosphorylated activity of 43% (P < .001), 66% (P < .001), and 80% (P < .001), respectively (Fig. 4E and 4G). Further, there was a component of a dose-response observed, with an additional reduction of 23% when increasing the pexidartinib concentration from 1 μM to 3 μM (P = .03).
Figure 4.

Pexidartinib reduces intracellular signaling after KITL stimulation in 12Z cells. 12Z cells were stimulated with KITL (25 ng/mL) and 3 increasing concentrations of pexidartinib. Pexidartinib did not reduce phosphorylated JNK signaling at either time point (A, B). It reduced phosphorylated STAT3 signaling at 60 minutes with the 10 μM concentration (C, D). Phosphorylated AKT inhibition occurred with all concentrations at each time point (E-G). GAPDH utilized for loading control. Time points of T = 30 minutes and T = 60 minutes reflect duration of ligand exposure. Abbreviations: L, ladder; V, vehicle; Pex, pexidartinib; AU, arbitrary units; pJNK, phosphorylated JNK; pSTAT3, phosphorylated STAT3; pAKT, phosphorylated AKT; T, time; Min, minutes. Histograms represent Mean ± SEM. Analyzed by 1-way ANOVA with a Tukey's post-test. *P ≤ .05; **P < .01; ***P < .001. Experiments were replicated using 3 biological replicates.
While signaling suppression was seen in 3 inflammatory pathways in the presence of MCSF and KITL, pexidartinib suppressed only STAT3 activation in the absence of ligands (Figs. S6 and S7 (19)). When 12Z cells were exposed to pexidartinib for the same total duration as in the ligand experiments, pJNK levels were similar between the vehicle condition and each pexidartinib concentration (Figs. S6A, S7A and B (19)). Phosphorylated STAT3 levels were unchanged across conditions at 60 minutes of drug exposure (Figs. S6B and S7C (19)) but noted a statistically significant suppression at 90 minutes of exposure (Figs. S6B and S7D (19)). A concentration of 3 μM reduced pSTAT3 signaling by 35% (P = .03). Pexidartinib at a concentration of 10 μM nearly eliminated signaling, with a reduction of 95% seen (P < .001). There was also a dose-dependent inhibition when increasing from 3 to 10 μM, consistent with a further reduction of 60% (P = .001) (Fig. S7D (19)). Experiments using only pexidartinib did not show statistically significant reductions in pAKT levels at any of the concentrations tested (Figs. S6C, S7E and F (19)). Hence, pexidartinib reduced JNK, STAT3 and AKT-mediated signaling in endometriotic epithelial cells through its inhibition of KIT and CSF1R. This inhibitory effect was less pronounced for the JNK and AKT pathways, but maintained for STAT3, when MCSF and KITL were removed.
Pexidartinib Modulates Endometriosis Gene Expression and Reduces Cell Survival In Vitro
Because pexidartinib successfully reduced phosphorylation signaling in pathways involved with inflammation, cell survival, and proliferation, we sought to explore changes in gene expression related to these pathways (Fig. 5). Expression of interleukin 8 (IL8) was chosen as a marker of inflammatory gene response given its previously described roles in the pathology of endometriosis (23, 24). Cyclin D1 (CCDN1) is a regulator of cyclin-dependent kinases and is critical for the control of the G1/S transition in cells (25). Pexidartinib decreased expression of interleukin 8 (IL8) mRNA at a concentration of 10 μM after both MCSF and KITL stimulation, with a nearly 47% reduction in the presence of MCSF (P = .02, 1-way ANOVA) and a reduction approaching 57% (P = .004) after KITL (Fig. 5A).
Figure 5.

Pexidartinib reduces IL8 and CCND1 expression and cell survival in 12Z cells. Pexidartinib therapy reduced expression of IL8 (A) and CCND1 (B) after stimulation with 25 ng/mL of MCSF and 25 ng/mL of KITL without causing overt suppression of gene expression, evidenced by similar GAPDH CT values (C). 12Z cell viability was reduced after 72 hours of culture with pexidartinib as assessed by quantification of intracellular ATP levels using CellTiterGlo (D). Abbreviations: Pex, pexidartinib. Histograms represent mean ± SEM. Analyzed by 1-way ANOVA with a Tukey post-test. *P ≤ .05; **P < .01; ***P < .001. Experiments were replicated using 3 biological replicates and 3 technical replicates for gene expression and using 3 biological replicates with 4 technical replicates for the cell survival experiment.
Pexidartinib also reduced CCND1 gene expression in 12Z cells (Fig. 5B). After MCSF stimulation, pexidartinib reduced CCND1 expression by 35% (P < .001) and 64% (P < .001) at concentrations of 3 and 10μM, respectively. While expression was reduced in the unopposed ligand (P < .001), there was a 34% reduction (P < .001) when comparing MCSF to cells treated with 10 μM pexidartinib (Fig. 5B). Further, there was a trend toward a dose-response relationship, as the 10 μM condition reduced expression by an additional 29% compared to the 3 μM condition (P < .001). When considering KITL-induced expression, the ligand condition showed reduced gene expression compared to vehicle (P < .001). We noted a beneficial treatment effect, however, in that the 3 μM condition reduced expression by 36% (P < .001) and the 10 μM condition reduced expression by 69% (P < .001) in the presence of KITL. While expression levels were reduced in the ligand condition, we noted that pexidartinib 10 μM reduced expression compared to the KITL condition by 28% (P < .001), and there was also a dose-response effect of an additional 33% (P < .001) when comparing pexidartinib 3 μM and 10 μM in the presence of KITL. To ensure reductions in gene expression were not driven by overall reductions in gene expression from possible toxicity, absolute GAPDH levels were evaluated as well. GAPDH expression was unchanged across all experimental conditions (Fig. 5C). Gene expression experiments in the absence of KITL or MCSF did not show similar reductions in IL8 or CCND1 levels nor did they reveal evidence of generalized suppressions in gene expression (Fig. S8 (19)), suggesting that ligand-based activation of the pathway may be necessary for pexidartinib activity.
Based on the reductions in prosurvival gene expression, we next sought to assess for differences in cell viability at 72 hours of exposure to varying concentrations of pexidartinib (Fig. 5D). While we did not observe differences in cell survival at 1 or 3 μM conditions, we observed reductions in cell survival of 46% at 10 μM (P = .03) and of 90% at 20 μM (P < .001) of pexidartinib. There was a trend toward a dose–response curve in the data, but only the differences between the 10 and 20 μM conditions showed a statistically significant difference, amounting to a cell survival reduction of 44% (P = .04).
Discussion
Here we demonstrate that patient endometriosis lesions express CSF1R and KIT and that pexidartinib successfully inhibits key signaling pathways, gene expression, and cell survival in 12Z endometriotic epithelial cells. While there was a trend to increases in JNK, STAT3, and AKT phosphorylation in 12Z cells, there was not a concomitant increase in gene expression after MCSF or KITL stimulation. Interestingly, pexidartinib's inhibitory effect seemed to be magnified when cultured with either KITL or MCSF as opposed to when cultured without the ligands. Treatment with pexidartinib provided an overall therapeutic benefit, and these experimental findings are summarized in the schematic shown in Fig. 6.
Figure 6.

CSF1R and KIT are expressed by the major cell types in endometriosis lesions. Schematic representing the endometriosis lesion microenvironment and the various cell types that express CSF1R and/or KIT. The major cell types present have all been shown to express 1 or both proteins, so treatments targeting these 2 receptors have the potential to modulate nearly the entire cell population present in endometriosis. Image created with BioRender.com.
We detected increased gene expression of CSF1R and KIT in a large published database. IHC assessment on a limited sample size showed trends to increased KIT and CSF1R expression compared with healthy endometrium, with a statistically significant increase in CSF1R expression in pelvic lesions compared with the endometrium. This builds on prior work showing increases in both KIT and CSF1R in endometriosis. For instance, the peritoneal fluid of women with endometriosis has increased levels of MCSF, and CSF1R is postulated to have a role in the early development of endometriosis lesions (14, 26, 27). A larger IHC analysis showed CSF1R expression in 55.5% of early-stage and in 82.3% of advanced-stage endometriosis cases, compared to in only 11.2% of endometrial specimens (28). While their work found CSF1R expression in the epithelium of lesions, we found greater variability in the cell types expressing the protein. KITL levels are also increased in the peritoneal fluid of patients with endometriosis, and IHC studies have similarly demonstrated increased KIT expression (15, 29, 30). In 1 IHC study, KIT was expressed in 58.6% of endometriosis samples compared with in only 21.2% of eutopic samples and 22.7% of control endometrial samples (15). With the increased expression at both the mRNA and protein level, these proteins serve as promising targets in endometriosis.
In this study, we elected to assess 12Z cells for their ability to serve as a cell model for CSF1R and KIT activity in endometriosis given their ease in cell culture and widespread use in endometriosis investigations. We were able to establish cellular signaling suppression by pexidartinib across multiple critical cellular pathways, including pJNK at 30 minutes, pSTAT3 at 60 minutes, and pAKT at both time points. Observing a treatment effect in each of these pathways is significantly important, as these pathways have been shown to be notable therapeutic targets in endometriosis (31).
After establishing signaling suppression, we assessed both gene expression and cell survival for tangible endpoints regarding pexidartinib's treatment effect. We elected to evaluate genes associated with inflammation and cell survival given the suppression seen on STAT3, JNK, and AKT. We assessed for changes in CCND1, as it has a critical role in cell survival and cell cycle progression and has also been shown to be of importance in communicating MCSF signaling (32, 33). We also evaluated IL8 given it has been shown to be elevated in cases of endometriosis along with contributing to processes important in the disease such as cell adhesion and neovascularization (34, 35). We noted reductions of both genes, though the largest effects were seen at the 10 μM pexidartinib concentrations. Interestingly, in the case of CCND1, expression was also noted to be reduced in the unopposed ligand conditions. While these reductions with the unopposed ligands did occur, we observe that gene expression in the treatment groups were lower than the ligand condition, showing a preserved treatment effect. Lastly, our observations of reduced cell survival at the 10 and 20 μM concentrations of pexidartinib could indicate that it achieves its effect on cell number by reducing expression of prosurvival genes. An additional possible explanation is that increasing drug concentrations inhibit “off-target” kinases, leading to reduced cell survival by inhibiting other receptors or pathways.
When performing these same experiments without MCSF or KITL, there was minimal inhibition that occurred, suggesting that pexidartinib's effect in 12Z cells was maximized when ligands were present even though neither ligand caused clear increases in the parameters that we measured. There are several possible explanations as to why this occurred and why neither ligand caused significantly increased activation of the pathways we measured. It is possible that the increase in activation of MCSF and KITL is relatively subtle compared to more traditional inflammatory ligands. One other study's results support this theory, where gene expression in response to simulation through CSF1R's alternative ligand, IL-34, also did not induce a robust increase in gene expression (36). Additionally, it is possible that these ligands are functioning more of a time-specific or cell cycle–specific role to allow cell development or cell maintenance, in which case large increases in gene expression might not be required. A final possibility is that another cell type such as a macrophage or inflammatory cell may have a more significant increase in cell signaling and gene expression. As AKT, JNK and STAT3 phosphorylation was reduced at nearly every time point when comparing the ligand condition to pexidartinib-treated conditions but was almost entirely unchanged when cells were treated only with pexidartinib, the observed treatment effect seems to be maximized with the combination of ligand and pexidartinib. We are continuing to explore the exact mechanism for this effect, especially given the effect on cell survival occurred independent of ligand exposure.
As we sought in this work to first characterize tissue expression of CSF1R and KIT and then evaluate for any treatment effect in an easily reproducible cell model, future work should evaluate pexidartinib's effect on endometriosis-associated macrophages due to the significant role CSF1R plays in macrophage function and the role macrophages play in endometriosis (37). Since it can inhibit the epithelial cells of a lesion, pexidartinib would treat nearly all the cell types in the endometriosis microenvironment if future work shows similar inhibition to occur in macrophages and stromal cells (Fig. 6).
Our results also have additional strengths and limitations that require discussion. First, focusing on signal transduction through protein phosphorylation helped explore the effect of MCSF and KITL stimulation on 12Z cells along with identifying pathways that pexidartinib inhibits in this cell type. Second, utilizing 12Z cells provides a significant strength to our results, as it is well-established model of endometriosis and has been shown to be quite similar to patient-derived cells (38). Despite its strengths, our findings do have limitations. For instance, by using a cell model alone, we do not completely capture the endometriotic microenvironment, making it possible that we do not identify a significant treatment effect that a more complex model, such as a murine model, might illustrate. Further, by focusing on only cell culture data, we are not able to significantly assess for toxicity that treatment with pexidartinib might induce. Lastly, advanced models utilizing pexidartinib as a treatment for endometriosis would be required to evaluate for any effects on the uterus or endometrium before advancing pexidartinib to clinical trials targeting endometriosis.
In conclusion, CSF1R and KIT are expressed in patient endometriosis lesions and are also expressed by the immortalized cell, 12Z. We also demonstrate that pexidartinib decreases signaling activity in the JNK, STAT3, and AKT pathways, all of which are known to be of importance in endometriosis. Further, we show that pexidartinib modulates gene expression and reduces cell survival in endometriosis cells. Targeting the CSF1R and KIT receptors provides an avenue for modulating endometriosis cellular activity across the entire endometriosis microenvironment that should be further explored in the search for novel nonhormonal therapeutics in endometriosis.
Acknowledgments
We want to sincerely thank the Baylor College of Medicine Department of Pathology Digital Pathology service for their assistance with providing digital imaging of the immunohistochemistry slides.
Abbreviations
- AKT
protein kinase B
- ANOVA
analysis of variance
- BSA
bovine serum albumin
- CE
control endometrium
- CS
charcoal stripped
- CSF1R
macrophage-colony stimulating factor 1 receptor
- DMEM
Dulbecco's modified Eagle’s medium
- DMSO
dimethyl sulfoxide
- FBS
fetal bovine serum
- FDA
Food and Drug Administration
- DIE
deep-infiltrating endometriosis
- IL
interleukin
- IHC
immunohistochemistry
- JNK
c-Jun N-terminal kinase
- KIT
mast/stem cell growth factor receptor KIT
- KITL
KIT ligand
- MCSF
macrophage colony-sitmulating factor 1
- OMA
endometrioma
- PE
patient endometrium
- PeL
peritoneal endometriosis lesion
- RTK
receptor tyrosine kinase
- STAT3
signal transducer and activator of transcription-3
- TBST
tris-buffered saline with Tween 20 detergent
Contributor Information
Timothy N Dunn, Division of Reproductive Endocrinology & Infertility, Baylor College of Medicine, Houston, TX 77030, USA; Department of Obstetrics and Gynecology, Baylor College of Medicine, Houston, TX 77030, USA; Department of Pathology & Immunology, Baylor College of Medicine, Houston, TX 77030, USA; Center for Drug Discovery, Baylor College of Medicine, Houston, TX 77030, USA.
Dominique I Cope, Department of Pathology & Immunology, Baylor College of Medicine, Houston, TX 77030, USA; Center for Drug Discovery, Baylor College of Medicine, Houston, TX 77030, USA.
Suni Tang, Department of Pathology & Immunology, Baylor College of Medicine, Houston, TX 77030, USA; Center for Drug Discovery, Baylor College of Medicine, Houston, TX 77030, USA.
Tirupataiah Sirupangi, Department of Pathology & Immunology, Baylor College of Medicine, Houston, TX 77030, USA; Center for Drug Discovery, Baylor College of Medicine, Houston, TX 77030, USA.
Sydney E Parks, Department of Pathology & Immunology, Baylor College of Medicine, Houston, TX 77030, USA; Center for Drug Discovery, Baylor College of Medicine, Houston, TX 77030, USA.
Zian Liao, Department of Pathology & Immunology, Baylor College of Medicine, Houston, TX 77030, USA; Center for Drug Discovery, Baylor College of Medicine, Houston, TX 77030, USA.
Fei Yuan, Center for Drug Discovery, Baylor College of Medicine, Houston, TX 77030, USA.
Chad J Creighton, Dan L. Duncan Comprehensive Cancer Center Division of Biostatistics, Baylor College of Medicine, Houston, TX 77030, USA; Human Genome Sequencing Center, Baylor College of Medicine, Houston, TX 77030, USA; Department of Medicine at Baylor College of Medicine, Baylor College of Medicine, Houston, TX, 77030, USA.
Ramya P Masand, Department of Obstetrics and Gynecology, Baylor College of Medicine, Houston, TX 77030, USA; Department of Pathology & Immunology, Baylor College of Medicine, Houston, TX 77030, USA.
Linda Alpuing Radilla, Department of Pathology & Immunology, Baylor College of Medicine, Houston, TX 77030, USA.
Xiaoming Guan, Department of Obstetrics and Gynecology, Baylor College of Medicine, Houston, TX 77030, USA.
Laura Detti, Division of Reproductive Endocrinology & Infertility, Baylor College of Medicine, Houston, TX 77030, USA; Department of Obstetrics and Gynecology, Baylor College of Medicine, Houston, TX 77030, USA.
Diana Monsivais, Department of Pathology & Immunology, Baylor College of Medicine, Houston, TX 77030, USA; Center for Drug Discovery, Baylor College of Medicine, Houston, TX 77030, USA.
Martin M Matzuk, Department of Pathology & Immunology, Baylor College of Medicine, Houston, TX 77030, USA; Center for Drug Discovery, Baylor College of Medicine, Houston, TX 77030, USA.
Funding
This research is supported by the Eunice Kennedy Shriver National Institute of Child Health and Human Development (R01HD105800, HD096057 [D.M.] and R01HD110038 [M.M.M.]). D.M. is supported by a Next Gen Pregnancy Award from the Burroughs Wellcome Fund (NGP10125). C.J.C. is supported by the Dan L. Duncan Cancer Center Grant CA125123. This research is also supported (in part) by an Alpha Omega Alpha Carolyn L. Kuckein Student Research Fellowship (D.I.C.)
Disclosures
The authors do not report any conflicts of interest that require disclosure.
Data Availability
The data underlying this article are primarily presented here and in its online supplementary material available at doi:10.5061/dryad.66t1g1k7s (19). The dataset utilized (GSE141549) to evaluate RNA expression in endometriosis lesions (18) can be accessed at the Gene Expression Omnibus through NCBI at (https://www.ncbi.nlm.nih.gov/geo/query/acc.cgi?acc=GSE141549).
References
- 1. Zondervan KT, Becker CM, Missmer SA. Endometriosis. N Engl J Med. 2020;382(13):1244‐1256. [DOI] [PubMed] [Google Scholar]
- 2. Committee on Practice Bulletins-Gynecology . Practice bulletin no. 114: management of endometriosis. Obstet Gynecol. 2010;116(1):223‐236. [DOI] [PubMed] [Google Scholar]
- 3. Zondervan KT, Becker CM, Koga K, Missmer SA, Taylor RN, Viganò P. Endometriosis. Nat Rev Dis Primers. 2018;4(1):9. [DOI] [PubMed] [Google Scholar]
- 4. Lemmon MA, Schlessinger J. Cell signaling by receptor tyrosine kinases. Cell. 2010;141(7):1117‐1134. [DOI] [PMC free article] [PubMed] [Google Scholar]
- 5. Cohen P, Cross D, Jänne PA. Kinase drug discovery 20 years after imatinib: progress and future directions. Nat Rev Drug Discov. 2021;20(7):551‐569. [DOI] [PMC free article] [PubMed] [Google Scholar]
- 6. Attwood MM, Fabbro D, Sokolov AV, Knapp S, Schiöth HB. Trends in kinase drug discovery: targets, indications and inhibitor design. Nat Rev Drug Discov. 2021;20(11):839‐861. [DOI] [PubMed] [Google Scholar]
- 7. Lennartsson J, Rönnstrand L. Stem cell factor receptor/c-kit: from basic science to clinical implications. Physiol Rev. 2012;92(4):1619‐1649. [DOI] [PubMed] [Google Scholar]
- 8. Qiu FH, Ray P, Brown K, et al. Primary structure of c-kit: relationship with the CSF-1/PDGF receptor kinase family–oncogenic activation of v-kit involves deletion of extracellular domain and C terminus. EMBO J. 1988;7(4):1003‐1011. [DOI] [PMC free article] [PubMed] [Google Scholar]
- 9. Guilbert LJ, Stanley ER. Specific interaction of murine colony-stimulating factor with mononuclear phagocytic cells. J Cell Biol. 1980;85(1):153‐159. [DOI] [PMC free article] [PubMed] [Google Scholar]
- 10. Yeung YG, Jubinsky PT, Sengupta A, Yeung DC, Stanley ER. Purification of the colony-stimulating factor 1 receptor and demonstration of its tyrosine kinase activity. Proc Natl Acad Sci U S A. 1987;84(5):1268‐1271. [DOI] [PMC free article] [PubMed] [Google Scholar]
- 11. Pampfer S, Daiter E, Barad D, Pollard JW. Expression of the colony-stimulating factor-1 receptor (c-fms proto-oncogene product) in the human uterus and placenta. Biol Reprod. 1992;46(1):48‐57. [DOI] [PubMed] [Google Scholar]
- 12. Arceci RJ, Shanahan F, Stanley ER, Pollard JW. Temporal expression and location of colony-stimulating factor 1 (CSF-1) and its receptor in the female reproductive tract are consistent with CSF-1-regulated placental development. Proc Natl Acad Sci U S A. 1989;86(22):8818‐8822. [DOI] [PMC free article] [PubMed] [Google Scholar]
- 13. Jokhi P, Chumbley G, King A, Gardner L, Loke Y. Expression of the colony stimulating factor-1 receptor (c-fms product) by cells at the human uteroplacental interface. Lab Invest. 1993;68(3):308‐320. [PubMed] [Google Scholar]
- 14. Budrys NM, Nair HB, Liu YG, et al. Increased expression of macrophage colony-stimulating factor and its receptor in patients with endometriosis. Fertil Steril. 2012;97(5):1129‐1135.e1. [DOI] [PMC free article] [PubMed] [Google Scholar]
- 15. Pacchiarotti A, Caserta D, Sbracia M, Moscarini M. Expression of oct-4 and c-kit antigens in endometriosis. Fertil Steril. 2011;95(3):1171‐1173. [DOI] [PubMed] [Google Scholar]
- 16. Tap WD, Wainberg ZA, Anthony SP, et al. Structure-guided blockade of CSF1R kinase in tenosynovial giant-cell tumor. N Engl J Med. 2015;373(5):428‐437. [DOI] [PubMed] [Google Scholar]
- 17. Zeitvogel A, Baumann R, Starzinski-Powitz A. Identification of an invasive, N-cadherin-expressing epithelial cell type in endometriosis using a new cell culture model. Am J Pathol. 2001;159(5):1839‐1852. [DOI] [PMC free article] [PubMed] [Google Scholar]
- 18. Gabriel M, Fey V, Heinosalo T, et al. A relational database to identify differentially expressed genes in the endometrium and endometriosis lesions. Sci Data. 2020;7(1):284. [DOI] [PMC free article] [PubMed] [Google Scholar]
- 19. Dunn T, Cope D, Tang S, et al. Supplemental information for: Inhibition of CSF1R and KIT with pexidartinib reduces inflammatory signaling and cell viability in endometriosis [Dataset]. Dryad. 2024. Doi: 10.5061/dryad.66t1g1k7s [DOI] [PMC free article] [PubMed]
- 20. Schneider CA, Rasband WS, Eliceiri KW. NIH image to ImageJ: 25 years of image analysis. Nat Methods. 2012;9(7):671‐675. [DOI] [PMC free article] [PubMed] [Google Scholar]
- 21. Yang T, Poenisch M, Khanal R, et al. Therapeutic HNF4A mRNA attenuates liver fibrosis in a preclinical model. J Hepatol. 2021;75(6):1420‐1433. [DOI] [PubMed] [Google Scholar]
- 22. Schmittgen TD, Livak KJ. Analyzing real-time PCR data by the comparative C(T) method. Nat Protoc. 2008;3(6):1101‐1108. [DOI] [PubMed] [Google Scholar]
- 23. Beste MT, Pfaffle-Doyle N, Prentice EA, et al. Molecular network analysis of endometriosis reveals a role for c-Jun-regulated macrophage activation. Sci Transl Med. 2014;6(222):222ra216. [DOI] [PMC free article] [PubMed] [Google Scholar]
- 24. Nishimoto-Kakiuchi A, Sato I, Nakano K, et al. A long-acting anti-IL-8 antibody improves inflammation and fibrosis in endometriosis. Sci Transl Med. 2023;15(684):eabq5858. [DOI] [PubMed] [Google Scholar]
- 25. Tchakarska G, Sola B. The double dealing of cyclin D1. Cell Cycle. 2020;19(2):163‐178. [DOI] [PMC free article] [PubMed] [Google Scholar]
- 26. Orlova YA, Hromova AM, Kaidashev IP, Shlykova OA, Izmailova OV, Martynenko VB. Pathogenetic role of macrophage colony-stimulating factor (Csf-1) in predicting endometrioid disease. Wiad Lek. 2021;74(8):1939‐1944. [PubMed] [Google Scholar]
- 27. Liu YG, Tekmal RR, Binkley PA, Nair HB, Schenken RS, Kirma NB. Induction of endometrial epithelial cell invasion and c-fms expression by transforming growth factor beta. Mol Hum Reprod. 2009;15(10):665‐673. [DOI] [PMC free article] [PubMed] [Google Scholar]
- 28. Mettler L, Schmutzler AG, Koch K, Schollmeyer T, Salmassi A. Identification of the M-CSF receptor in endometriosis by immunohistochemistry and RT-PCR. Am J Reprod Immunol. 2004;52(5):298‐305. [DOI] [PubMed] [Google Scholar]
- 29. Osuga Y, Koga K, Tsutsumi O, et al. Stem cell factor (SCF) concentrations in peritoneal fluid of women with or without endometriosis. Am J Reprod Immunol. 2000;44(4):231‐235. [DOI] [PubMed] [Google Scholar]
- 30. Uzan C, Cortez A, Dufournet C, Fauvet R, Siffroi JP, Daraï E. Endometrium from women with and without endometriosis, and peritoneal, ovarian and bowel endometriosis, show different c-kit protein expression. J Reprod Immunol. 2005;65(1):55‐63. [DOI] [PubMed] [Google Scholar]
- 31. McKinnon BD, Kocbek V, Nirgianakis K, Bersinger NA, Mueller MD. Kinase signalling pathways in endometriosis: potential targets for non-hormonal therapeutics. Hum Reprod Update. 2016;22(3):382‐403. [DOI] [PubMed] [Google Scholar]
- 32. Fu M, Wang C, Li Z, Sakamaki T, Pestell RG. Minireview: cyclin D1: normal and abnormal functions. Endocrinology. 2004;145(12):5439‐5447. [DOI] [PubMed] [Google Scholar]
- 33. Roussel MF. Regulation of cell cycle entry and G1 progression by CSF-1. Mol Reprod Dev. 1997;46(1):11‐18. [DOI] [PubMed] [Google Scholar]
- 34. Gazvani MR, Christmas S, Quenby S, Kirwan J, Johnson PM, Kingsland CR. Peritoneal fluid concentrations of interleukin-8 in women with endometriosis: relationship to stage of disease. Hum Reprod. 1998;13(7):1957‐1961. [DOI] [PubMed] [Google Scholar]
- 35. Ryan IP, Tseng JF, Schriock ED, Khorram O, Landers DV, Taylor RN. Interleukin-8 concentrations are elevated in peritoneal fluid of women with endometriosis. Fertil Steril. 1995;63(4):929‐932. [PubMed] [Google Scholar]
- 36. Lin K, Ma J, Peng Y, et al. Autocrine production of interleukin-34 promotes the development of endometriosis through CSF1R/JAK3/STAT6 signaling. Sci Rep. 2019;9(1):16781. [DOI] [PMC free article] [PubMed] [Google Scholar]
- 37. Hogg C, Horne AW, Greaves E. Endometriosis-associated macrophages: origin, phenotype, and function. Front Endocrinol (Lausanne). 2020;11:7. [DOI] [PMC free article] [PubMed] [Google Scholar]
- 38. Banu SK, Lee J, Starzinski-Powitz A, Arosh JA. Gene expression profiles and functional characterization of human immortalized endometriotic epithelial and stromal cells. Fertil Steril. 2008;90(4):972‐987. [DOI] [PubMed] [Google Scholar]
Associated Data
This section collects any data citations, data availability statements, or supplementary materials included in this article.
Data Citations
- Dunn T, Cope D, Tang S, et al. Supplemental information for: Inhibition of CSF1R and KIT with pexidartinib reduces inflammatory signaling and cell viability in endometriosis [Dataset]. Dryad. 2024. Doi: 10.5061/dryad.66t1g1k7s [DOI] [PMC free article] [PubMed]
Data Availability Statement
The data underlying this article are primarily presented here and in its online supplementary material available at doi:10.5061/dryad.66t1g1k7s (19). The dataset utilized (GSE141549) to evaluate RNA expression in endometriosis lesions (18) can be accessed at the Gene Expression Omnibus through NCBI at (https://www.ncbi.nlm.nih.gov/geo/query/acc.cgi?acc=GSE141549).