

Abstract
Background:
A substantial fraction of sexually transmitted infections (STIs) occur in patients who have previously been treated for an STI. We assessed whether routine electronic health record (EHR) data can predict which patients presenting with an incident STI are at greatest risk for additional STIs in the next 1 to 2 years.
Methods:
We used structured EHR data on patients 15 years or older who acquired an incident STI diagnosis in 2008 to 2015 in eastern Massachusetts. We applied machine learning algorithms to model risk of acquiring ≥1 or ≥2 additional STIs diagnoses within 365 or 730 days after the initial diagnosis using more than 180 different EHR variables. We performed sensitivity analysis incorporating state health department surveillance data to assess whether improving the accuracy of identifying STI cases improved algorithm performance.
Results:
We identified 8723 incident episodes of laboratory-confirmed gonorrhea, chlamydia, or syphilis. Bayesian Additive Regression Trees, the best-performing algorithm of any single method, had a cross-validated area under the receiver operating curve of 0.75. Receiver operating curves for this algorithm showed a poor balance between sensitivity and positive predictive value (PPV). A predictive probability threshold with a sensitivity of 91.5% had a corresponding PPV of 3.9%. A higher threshold with a PPV of 29.5% had a sensitivity of 11.7%. Attempting to improve the classification of patients with and without repeat STIs diagnoses by incorporating health department surveillance data had minimal impact on cross-validated area under the receiver operating curve.
Conclusions:
Machine algorithms using structured EHR data did not differentiate well between patients with and without repeat STIs diagnosis. Alternative strategies, able to account for sociobehavioral characteristics, could be explored.
In 2018, the counts of chlamydia, gonorrhea, and syphilis cases reported to public health agencies reached the highest numbers ever in the United States1 and the state of Massachusetts.2 Rates of reported cases of all 3 sexually transmitted infections (STIs) have been rising since 2000.1,2 The growing number of STIs is of serious concern because of their morbidity, role in facilitating HIV acquisition, long-term risks for infertility and pelvic inflammatory disease in women, and health care utilization costs.3,4
A substantial fraction of all STI cases occur among individuals who have previously been infected.5 People with repeated STIs serve as core disease transmitters and bear a disproportionate share of STI-related morbidity.6 In 2014 to 2016 in Massachusetts, individuals who acquired ≥1 repeat STI diagnoses comprised less than 0.2% of the general Massachusetts population but accounted for 27.7% of all bacterial STIs reported during this period. In addition, individuals who acquired ≥2 repeat STI diagnoses accounted for 8.5% of all reported bacterial STIs during this period.5
Current guidelines already recommend that clinicians perform repeat STI testing in those with history of STI,7 but these guidelines are poorly adhered to.8 The ability to identify patients with an incident STI who are at even greater increased risk for recurrent STIs could provide an opportunity for targeted interventions by clinicians and public health officials to lower patient likelihood of STI reacquisition, reduce population transmission, and improve health care resource utilization. The objective of this analysis was to assess the utility of machine learning algorithms to analyze routine, structured electronic health record (EHR) data to help clinicians identify which individuals presenting with an incident STI are at increased risk for additional STIs within the next 1 to 2 years.
METHODS
Setting
For this analysis, we extracted detailed EHR data from Atrius Health, which provides ambulatory care for approximately 740,000 patients annually at 31 clinical sites in eastern Massachusetts. This patient population encompasses individuals with Medicare, Medicaid, and commercial health insurance from urban and suburban communities. Data were extracted from the Atrius Health EHR via the electronic medical record Support for Public Health (ESP) system, an open-source public health surveillance platform, which uses daily data extracted from EHR systems to identify and report on specific conditions to public health departments. To accomplish this, ESP maps extracted data to common terms, analyzes these data for reportable diseases or updates to existing cases, and automatically submits case reports or aggregate summaries to health departments’ electronic surveillance systems. Additional information about ESP is available at https://www.esphealth.org/.9–13
Study Design
We focused the analysis on patients with an initial STI diagnosis both to increase analytic efficiency and to make the approach clinically pertinent, because we reasoned that clinicians are more likely to engage in a conversation about repeat STI risk in patients with an STI within the past 1 or 2 years, rather than in patients who have not been recently diagnosed with an STI. We identified 8279 patients 15 years or older with at least one positive laboratory test result for gonorrhea or chlamydia, or a syphilis diagnosis, in 2008 to 2015. Syphilis diagnoses were defined as (1) an International Classification of Diseases, Ninth Revision (ICD-9) or ICD-10 diagnostic code with a corresponding order for syphilis approved antibiotic, (2) a serum rapid plasma reagin or venereal disease research laboratory test value greater than or equal to 1:8 and a Treponema pallidum particle agglutination assay or fluorescent treponemal antibody absorption test or T. pallidum IgG test with result reactive/positive ever in the past and up to 1 month after the rapid plasma reagin or venereal disease research laboratory test, or (3) a positive cerebrospinal fluid test result for syphilis. This was the definition used by ESP for reporting syphilis cases to the Massachusetts Department of Public Health (MDPH) during the study period. We excluded chlamydia and gonorrhea diagnoses that occurred within 30 days of the prior diagnosis or 180 days for syphilis diagnosis, to avoid counting the same diagnostic event as a repeat STI.
We defined a priori an incident STI as one in which there were no recorded gonorrhea, chlamydia, or syphilis events in the calendar year preceding the incident diagnosis in their medical record. For example, an incident STI in 2008 would require the absence of laboratory-confirmed STIs in 2007. This allowed all incident STI diagnoses to have a consistently defined starting point for determining repeat STI diagnoses and provided the opportunity for patients to contribute multiple incident STIs over the course of the study period. Sixty-five patients were excluded from the analysis because none of their STI diagnoses, which occurred only during the beginning of the study period, met the requirement for an incident STI of no recorded STI diagnoses in the preceding calendar year. In addition, based on the age criteria of ≥15 years, 17 patients were excluded because their sole incident STI occurred before 15 years of age. We then assessed patients for subsequent STI diagnoses in either the 365 or 730 days after the incident STI diagnosis.
Outcomes
For the primary analysis, we attempted to identify patients with ≥2 repeat STI diagnoses within 730 days after an incident STI diagnosis. Three alternative outcomes were also explored: (1) patients who acquired ≥2 repeat STI diagnoses within 365 days after an incident diagnosis, (2) patients who acquired ≥1 repeat STI diagnoses within 365 days after an incident diagnosis, and (3) patients who acquired ≥1 repeat STI diagnoses within 730 days after an incident STI diagnosis.
Predictor Variables
We examined patients’ demographics, diagnosis codes including type of incident STI, STI-related prescriptions, clinical events, and STI-related laboratory information to identify potential predictors of repeat STIs. Demographics included age, sex, race/ethnicity, and primary language. Sex within Atrius Health was defined as the legal sex, which was recorded as male or female. Clinical events included number of clinical encounters with at least one diagnosis code, vital sign, any laboratory test, or any prescription. Sexually transmitted infection–related prescriptions included antibiotics used to treat STIs and prescriptions for HIV preexposure prophylaxis (PrEP). Diagnosis codes included ICD-9-CM and ICD-10-CM codes for STI diagnoses (e.g., contact with or exposure to venereal disease, genital herpes, or pelvic inflammatory disease) or known risk factors for STI infection (e.g., HIV, opioid dependence, and depression). A complete list of all variables can be found online in Supplemental Table 1 http://links.lww.com/OLQ/A543.
Algorithm Development (Primary Analysis)
Multiple machine learning techniques were applied to the extracted EHR data beginning with super learning (SL), an ensemble machine learning approach that combines predictions from multiple prediction algorithms.14,15 Instead of prespecifying a single parametric model, machine learning algorithms can learn to model the outcome as a complex function of the covariates by exploiting associations in the data. The algorithms specified for these analyses were variants of logistic regression,15 least absolute shrinkage and selection operator regression (LASSO),16 RIDGE regression,16 Bayesian Additive Regression Trees (BART),17 gradient boosting,18 neural networks,19 and support vector machines.20 These algorithms were selected to provide a cross section of approaches to modeling the outcome. Some produced interpretable main terms logistic regression models, with or without carrying out covariate selection internally. Others explored higher-order interactions among covariates, and nonlinearities in covariate-outcome relationships (Supplemental Table 2 http://links.lww.com/OLQ/A543). To determine how well these algorithms performed, the area under the receiver operating curve (AUC) was assessed. A perfect prediction algorithm would have an AUC of 1, indicating that the risk scores of all future repeaters are higher than those of nonrepeaters. An algorithm that assigned risk scores by chance would have an AUC of 0.5. An AUC of 0.75 thus means that 75% of the time the model would assign a higher risk score to an STI repeater than to a nonrepeater. Algorithms were evaluated based on their cross-validated (cv) AUCs; cross-validation more accurately reflects predictive performance on novel data from the same population.21 Instead of dividing the data into a single validation set and test set, we used V-fold cross-validation (V = 5), which averages over V splits of the data to more efficiently estimate the cv-AUC. We assessed each algorithm’s performance characteristics (sensitivity, specificity, and positive and negative predictive values) and distribution of risk scores for patients with repeat STIs among all patients’ predicted risk scores.
Using Augmented Data Set for 2014 to 2016 (Sensitivity Analysis)
Because some patients might have received an STI diagnosis outside the Atrius Health network, surveillance data from the MDPH were incorporated to reduce the likelihood of misclassification. Data from the MDPH were used because all laboratory-confirmed diagnoses of gonorrhea, chlamydia, and syphilis from across the state are reported to the MDPH.22
Sexually transmitted infection data from the MDPH were matched to the Atrius Health EHR data based on patient name and date of birth. Matching was performed at the MDPH. In addition, matched patients were reviewed to confirm that the MDPH had the same type of STI diagnosis and total number of STI cases as those provided in the Atrius data set. The STI data from the MDPH included STI diagnoses between mid-2014 and mid-2016. This period was selected because the data had already been collated and cleaned for a previous analysis.5 When the MDPH and Atrius data were merged, both incident and repeat STI cases were updated and deidentified, and subsequent analyses were performed using a data set stripped of identifiers. The models containing both Atrius and MDPH data restricted the time frame for incident STI cases based on the follow-up period. For outcomes measured within 365 days, the incident STI dates were restricted to 2013–2015 and to 2013–2014 for outcomes measured within 730 days.
RESULTS
Sample Description
Between 2008 and 2015, 8197 patients at Atrius Health had a least one laboratory-confirmed gonorrhea, chlamydia, or syphilis diagnosis. Some patients had multiple incident STI events, and thus, there were 8723 incident STIs across the study population. Of the 8723 incident STIs, 7517 (86.2%) were followed by no repeat STI diagnoses, 987 (11.3%) were followed by 1 repeat STI diagnosis, and 223 (2.6%) were followed by ≥2 repeat STI diagnoses within 730 days. Most patients with incident STIs were between 15 and 24 years old at baseline (61% among those with 0 repeat STI diagnoses, 75% among those with 1 repeat STI diagnosis, and 76% among those with ≥2 repeat STI diagnoses) and were female (67% among those with 0 repeat STI diagnoses, 74% among those with 1 repeat STI diagnosis, and 71% among those with ≥2 repeat STI diagnoses). Most incident STI diagnoses followed by ≥2 repeat STI diagnoses within 730 days occurred among non-Hispanic Blacks (47% vs. 30% non-Hispanic Whites, 10% Hispanics, and 3% non-Hispanic Asians), whereas most incident STI diagnoses followed by no repeat STI diagnoses within 730 days occurred among non-Hispanic Whites (49% vs. 26% non-Hispanic Blacks, 8% Hispanics, and 4% non-Hispanic Asians). However, when comparing incident STI diagnoses followed by no repeat STI diagnosis, 1, or ≥2 repeat STI diagnoses within 730 days, race/ethnicity was not found to be statistically significantly different, nor were any other baseline patient characteristics such as age, sex, living with HIV, PrEP use, high-risk sexual behavior, depression, or alcohol/substance dependence (Table 1).
TABLE 1.
Baseline Characteristics of Patients With Incident Sexually Transmitted Infections (STIs)* Stratified by the Number of Repeat STI Diagnosis, Atrius Health, 2008 to 2015
| Incident STIs* With 0 Repeat STI† in 730 d (n = 7517) | Incident STIs* With 1 Repeat STI† in 730 d (n = 983) | Incident STIs* With ≥2 Repeat STIs† in 730 d (n = 223) | ||||||
|---|---|---|---|---|---|---|---|---|
| n | % | n | % | P ‡ | n | % | P ‡ | |
| Age, y§ | ||||||||
| 15–24 | 4560 | 61 | 734 | 75 | 0.76 | 170 | 76 | 0.74 |
| 25–34 | 1961 | 26 | 180 | 18 | 0.85 | 36 | 16 | 0.80 |
| 35–44 | 547 | 7 | 42 | 4 | 0.89 | 12 | 5 | 0.93 |
| 45–54 | 309 | 4 | 22 | 2 | 0.91 | 5 | 2 | 0.91 |
| 55–64 | 93 | 1 | 2 | 0 | 0.89 | 0 | 0 | 0.89 |
| ≥65 | 47 | 1 | 3 | 0 | 0.89 | 0 | 0 | 0.89 |
| Sex | ||||||||
| Male | 2510 | 33 | 257 | 26 | 0.88 | 64 | 29 | 0.93 |
| Female | 5007 | 67 | 726 | 74 | 0.88 | 159 | 71 | 0.93 |
| Race/ethnicity | ||||||||
| Non-Hispanic White | 3671 | 49 | 387 | 39 | 0.84 | 67 | 30 | 0.69 |
| Non-Hispanic Black | 1934 | 26 | 360 | 37 | 0.81 | 105 | 47 | 0.65 |
| Hispanic | 593 | 8 | 92 | 9 | 0.97 | 22 | 10 | 0.94 |
| Non-Hispanic Asian | 306 | 4 | 43 | 4 | 1.00 | 7 | 3 | 0.96 |
| Non-Hispanic other¶ | 361 | 5 | 50 | 5 | 1.00 | 11 | 5 | 1.00 |
| Unknown/Missing | 652 | 9 | 51 | 5 | 0.87 | 11 | 5 | 0.87 |
| Living with HIV∥ | 83 | 1 | 13 | 1 | 1.00 | 3 | 1 | 1.00 |
| PrEP use** | 5 | 0 | 1 | 0 | — | 0 | 0 | — |
| High-risk sexual behavior | 162 | 2 | 1 | 0 | 0.84 | 15 | 7 | 0.81 |
| Depression | 1107 | 15 | 181 | 18 | 0.94 | 41 | 18 | 0.94 |
| Alcohol/substance dependence†† | 131 | 2 | 19 | 2 | 1.00 | 4 | 2 | 1.00 |
Defined as positive laboratory result for chlamydia, gonorrhea, or a syphilis diagnosis.
Patients are able to have multiple incident STIs.
Compared with patients with an incident STI with 0 repeat STI in 730 days. The 2-sided P values were calculated from the standardized mean difference.
Age at incident STI.
Other race includes Native American, Native Hawaiian, American Indian, and races categorized as “other.”
HIV diagnosis before incident STI.
Tenofovir disoproxil fumarate/emtricitabine prescription for use as PrEP before incident STI year.
Alcohol and substance dependence includes alcohol, opioid, cocaine, and amphetamine dependence. This was identified based on the presence of an ICD-9 or ICD-10 codes.
Algorithm Performance
A total of 16 algorithms were assessed for the primary outcome (i.e., ≥2 repeat STI diagnoses within 730 days) and the 3 alternative outcomes (i.e., ≥2 repeat STI diagnoses within 365 days, ≥1 repeat STI diagnoses within 365 days, and ≥1 repeat STI diagnoses within 730 days; Table 2). The highest cv-AUV scores were 0.76 from SL and 0.75 from BART, both generated for the primary outcome of ≥2 repeat STI diagnoses within 730 days.
TABLE 2.
Cross-Validated Area Under the Receiver Operating Curve (cv-AUC) for Incident Sexually Transmitted Infections (STIs)* With ≥1 Repeat STI Diagnoses or ≥2 Repeat STI Diagnoses Stratified by Duration of Follow-Up, Atrius Health, 2008 to 2015
| 730 d of Follow-Up | 365 d of Follow-Up | |||
|---|---|---|---|---|
| Algorithm | Incident STIs With ≥2 Repeat STI, cv-AUC | Incident STIs With ≥1 Repeat STI, cv-AUC | Incident STIs With ≥2 Repeat STI, cv-AUC | Incident STIs With ≥1 Repeat STI, cv-AUC |
| SL | 0.76 | 0.66 | 0.70 | 0.64 |
| BART | 0.75 | 0.67 | 0.72 | 0.65 |
| LASSO | 0.73 | 0.67 | 0.67 | 0.64 |
| XGB2,50 | 0.73 | 0.64 | 0.69 | 0.61 |
| XGB4,50 | 0.73 | 0.62 | 0.69 | 0.59 |
| XGB2,25 | 0.72 | 0.65 | 0.70 | 0.63 |
| NN2,screen | 0.72 | 0.65 | 0.56 | 0.63 |
| XGB2,10 | 0.71 | 0.64 | 0.65 | 0.62 |
| NN1,screen | 0.71 | 0.65 | 0.51 | 0.63 |
| XGB4,25 | 0.70 | 0.62 | 0.70 | 0.59 |
| GLMscreen | 0.70 | 0.65 | 0.58 | 0.63 |
| RIDGE | 0.70 | 0.65 | 0.63 | 0.63 |
| XGB4,10 | 0.67 | 0.61 | 0.62 | 0.58 |
| SVM1.5,screen | 0.55 | 0.48 | 0.58 | 0.49 |
| SVM1,screen | 0.52 | 0.48 | 0.57 | 0.50 |
| GLM | 0.51 | 0.57 | 0.52 | 0.49 |
Defined as positive laboratory result for chlamydia, gonorrhea, or a syphilis diagnosis.
BART indicates Bayesian Additive Regression Trees (200 trees, 2-way interactions); GLM, generalized linear model logistic regression; LASSO, least absolute shrinkage and selection operator using AUC loss; NN, neural net with 1 or 2 nodes in the hidden layer; RIDGE, ridge regression using AUC loss; “screen,” covariates were prescreened to include only those whose correlation with the outcome had magnitude at least 0.2, although a minimum of 20 covariates were retained; SL, super learner; SVM, support vector machine (radial kernel with cost, 1 or 1.5); XGB, eXtreme Gradient Boosting (1000 trees; shrinkage, 0.1; maxdepth, 2 or 4 [interaction depth], 10, 25, or 50 minimum number of observations in terminal node).
Algorithm performance results are presented on analyses from BART, which yielded the best-performing algorithm of any single method, with performance essentially equivalent to SL, and LASSO, which had performance similar to BART and provided readily interpretable odds ratios for the variables retained in the analysis. Of all the variables assessed for inclusion in the LASSO regression, only 13 were retained in the final model (Table 3). Having a syphilitic infection before the incident year, the number of positive urogenital gonorrhea tests in the prior 2 years, and having a genital gonococcal infection as the incident STI event were the strongest predictors of experiencing ≥2 repeat STI diagnoses within 730 days (Table 3). In Figure 1, the exact distribution of risk scores for BART regression is shown for patients with a specific number of subsequent STI events among the full study population. Most individuals with higher numbers of repeat STI diagnoses did have higher risk scores, but some had low risk scores. A similar pattern was seen for the distribution of STI repeaters’ risk scores when using LASSO regression (Supplemental Fig. 1 http://links.lww.com/OLQ/A543). Sensitivities, specificities, and positive predictive values (PPVs) for a range of algorithm thresholds for BART regression are shown in Table 4. No a priori threshold was identified for this analysis because the selection of a threshold will often depend on an intervention’s goal or the availability of resources. For example, selecting a threshold that allows us to identify 91.5% of patients with repeat diagnoses (sensitivity, 91.5%) identified 60% of the study population, among whom 3.9% (PPV, 3.9%) actually acquired 2 or more repeat diagnoses. Selecting a threshold that only identified 1% of the study population as having repeat diagnoses had a higher PPV (29.5%) but a lower sensitivity (11.7%). In contrast, when 1% of the study population was identified as having repeat diagnoses by the LASSO algorithm, the PPV and sensitivity were lower (19.3% and 7.6%, respectively; Supplemental Table 3 http://links.lww.com/OLQ/A543).
TABLE 3.
Odds Ratios for the Covariates Retained in the Final LASSO Regression Model* for Detecting ≥2 Repeat Diagnoses of Sexually Transmitted Infections (STIs)† Within 730 Days
| Covariates | Odds Ratio |
|---|---|
| Age | 0.97 |
| Incident STI: genital gonorrhea | 2.13 |
| Incident STI: unknown anatomic site gonorrhea | 1.61 |
| Syphilis case before incident year | 2.97 |
| No. gonorrhea tests in the prior 2 y | 1.20 |
| No. positive gonorrhea test results (urogenital) before incident year | 1.01 |
| No. gonorrhea tests (throat) in the prior 2 y | 1.02 |
| No. positive gonorrhea tests results (urogenital) in the prior 2 y | 2.76 |
| Azithromycin prescription in the prior 2 y | 1.72 |
| Race indicator: Black | 1.46 |
| Race indicator: White | 0.97 |
| Language indicator: Spanish | 1.52 |
| Language indicator: unknown | 0.86 |
Cross-validated area under the receiver operating curve was 0.73.
Defined as positive laboratory result for chlamydia, gonorrhea, or a syphilis diagnosis.
LASSO indicates least absolute shrinkage and selection operator using receiver operating curve loss.
Figure 1.
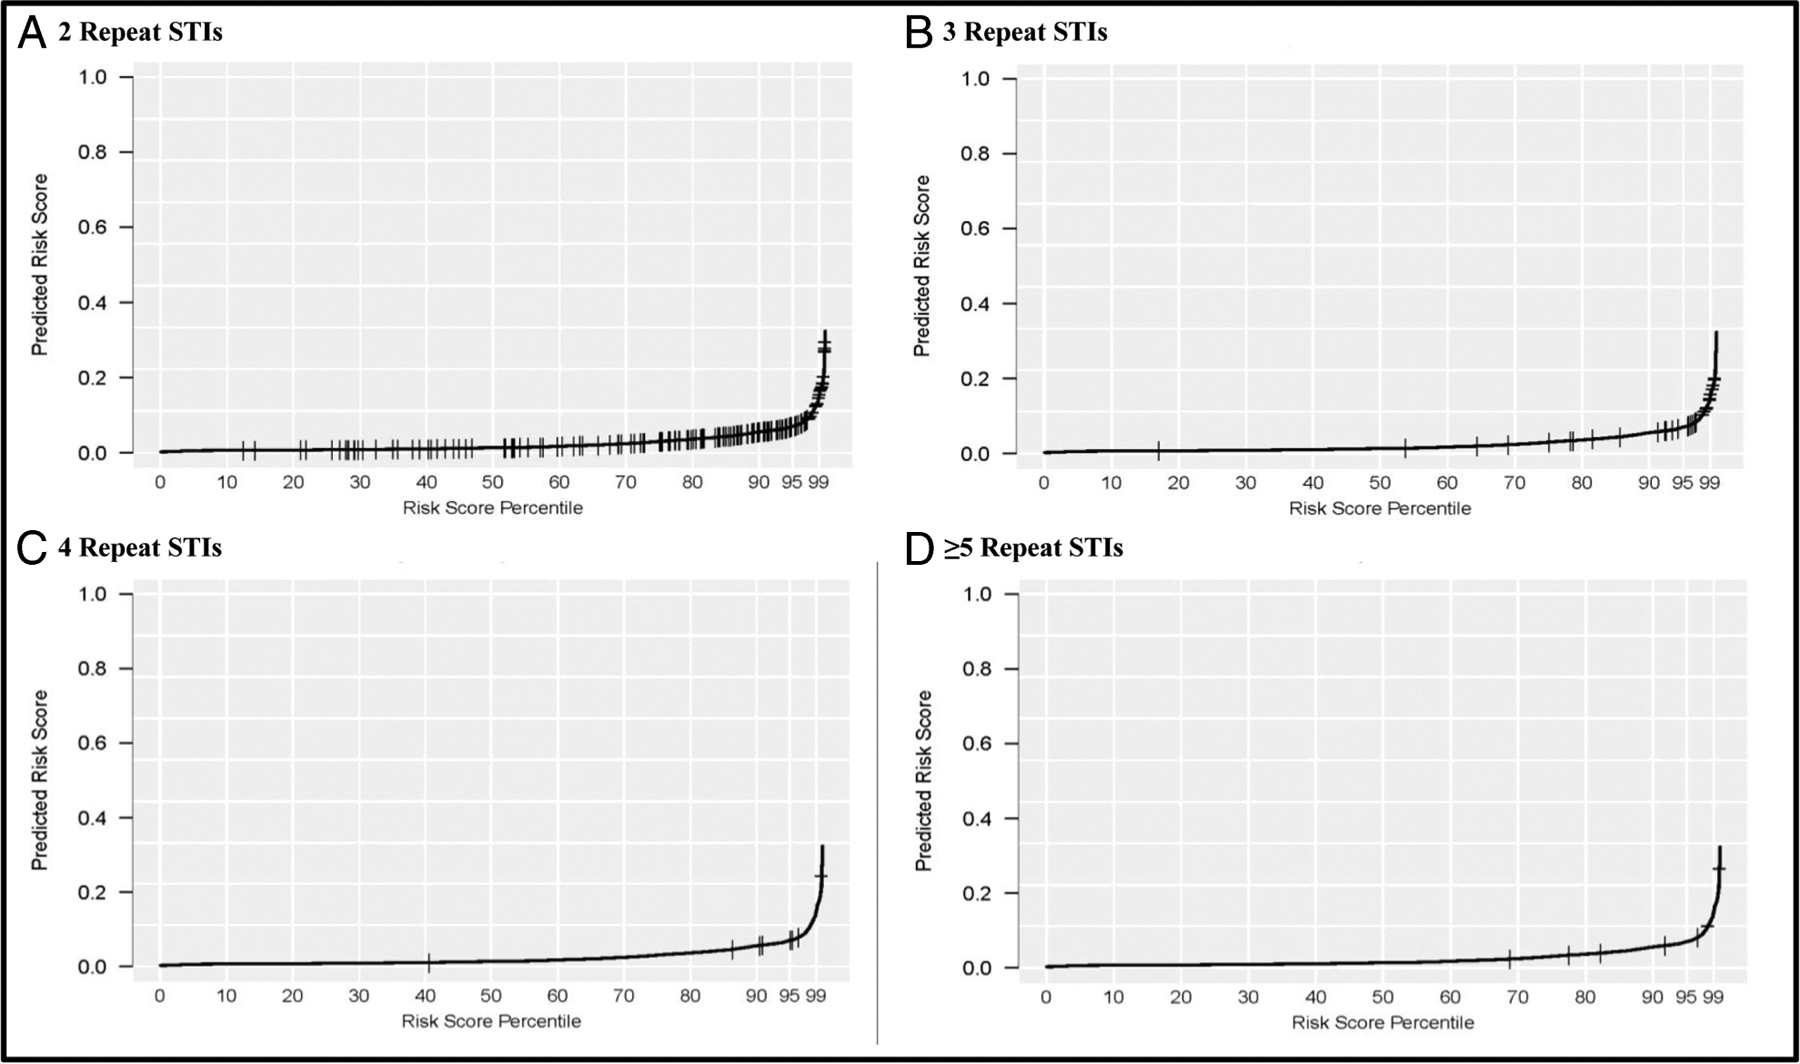
BART* regression model distribution of predicted risk scores, ≥2 repeat diagnoses of sexually transmitted infections (STIs)† within 730 days, Atrius Health, 2008 to 2015. A, Risk score distribution for patients with exactly 2 repeat STIs. B, Risk score distribution for patients with exactly 3 repeat STIs. C, Risk score distribution for patients with exactly 4 repeat STIs. D, Risk score distribution for patients with ≥5 repeat STIs. *BART indicates Bayesian Additive Regression Trees. †Defined as positive laboratory result for chlamydia, gonorrhea, or a syphilis diagnosis.
TABLE 4.
Performance of BART Algorithm for Detecting ≥2 Repeat Diagnoses of Sexually Transmitted Infections (STIs)* in 730 Days, Atrius Health, 2008 to 2015
| Fraction of the Study Population, % | Sensitivity, % | Specificity, % | Positive Predictive Value, % | Negative Predictive Value, % |
|---|---|---|---|---|
| 10 | 100.0 | 10.3 | 2.8 | 100.0 |
| 20 | 98.7 | 20.5 | 3.2 | 99.8 |
| 30 | 94.2 | 30.6 | 3.4 | 99.5 |
| 40 | 91.5 | 40.8 | 3.9 | 99.5 |
| 50 | 87.0 | 51.0 | 4.5 | 99.3 |
| 60 | 80.7 | 61.1 | 5.2 | 99.2 |
| 70 | 74.4 | 71.2 | 6.3 | 99.1 |
| 80 | 64.1 | 81.2 | 8.2 | 98.9 |
| 90 | 47.1 | 91.0 | 12.0 | 98.5 |
| 99 | 11.7 | 99.3 | 29.5 | 97.7 |
Defined as positive laboratory result for chlamydia, gonorrhea, or a syphilis diagnosis. BART indicates Bayesian Additive Regression Trees.
Using MDPH Augmented Data Set for 2014 to 2016
Once the MDPH data were incorporated into the analytic data set, the total number of incident STI events increased slightly to 8745. From mid-2014 to mid-2016, Atrius Health identified 253 patients who had at least 2 STI cases. After cross-matching ESP data with MDPH’s surveillance data, we identified an additional 99 patients with repeat infections, for a total of 352 patients with repeat STIs. These additional STI cases were reported to the MDPH by clinical providers outside the Atrius Health network. Adding these STI cases to the analytic data set increased the number of patients with ≥2 repeat STIs within 730 days from 223 to 259. A more detailed description of the augmented data set can be found in Supplemental Table 4 http://links.lww.com/OLQ/A543. After adding these data, however, the cv-AUC for the best-performing algorithm decreased to 0.64 (Table 5).
TABLE 5.
Sensitivity Analysis: Cross-Validated Area Under the Receiver Operating Curve (cv-AUC) Values for Best-Performing Algorithms of the Atrius Health, 2008 to 2015 Data Set, Augmented With the Massachusetts Department of Public Health Surveillance Data
| 730 d of Follow-Up | 365 d of Follow-Up | |||
|---|---|---|---|---|
| Algorithm | Incident STIs* With ≥2 Repeat STI†, cv-AUC | Incident STIs* With ≥1 Repeat STI†, cv-AUC | Incident STIs* With ≥2 Repeat STI‡, cv-AUC | Incident STIs* With ≥1 Repeat STI‡, cv-AUC |
| RIDGE | 0.64§ | 0.58 | 0.45 | 0.57 |
| GLMscreen | 0.61 | 0.57 | 0.61§ | 0.57 |
| SL | 0.62 | 0.59§ | 0.53 | 0.58§ |
| BART | 0.63 | 0.59§ | 0.53 | 0.58§ |
| LASSO | 0.59 | 0.59§ | 0.54 | 0.56 |
Defined as positive laboratory result for chlamydia, gonorrhea, or a syphilis diagnosis.
The incident STIs occurred between 2013 and 2014. This restriction was only used for the sensitivity analysis.
The incident STIs occurred between 2013 and 2015. This restriction was only used for the sensitivity analysis.
Best performing algorithm.
BART indicates Bayesian Additive Regression Trees (200 trees, 2-way interactions); GLM, generalized linear model logistic regression; LASSO, least absolute shrinkage and selection operator using AUC loss; “screen,” covariates were prescreened to include only those whose correlation with the outcome had magnitude at least 0.2, although a minimum of 20 covariates were retained; RIDGE, ridge regression using AUC loss; SL, super learner.
DISCUSSION
Our objective was to assess whether it was possible to develop a machine learning model to identify patients at increased risk for repeat STIs after an incident STI diagnosis using structured, routine EHR data. Despite using more than 180 potential predictor variables from the EHR and sophisticated automated algorithm development techniques, we found that machine learning algorithms had limited capacity to identify patients at increased risk for subsequent STI diagnoses in the 1 to 2 years after incident STI diagnosis. In effect, it may be that having an incident STI diagnosis is the factor most associated with subsequent STI diagnoses. Within this population, routine EHR data were only moderately successful at discriminating between patients at high risk for acquiring repeat STI diagnoses and those who did not have repeat diagnoses. This may in part be due to relative homogeneity with respect to the available predictors for a patient population restricted to individuals with an incident STI diagnosis.23 The patient population included in this analysis came from Atrius Health, which serves a well-insured population primarily in eastern Massachusetts, and thus, findings from this analysis might not generalize to other geographic regions or other health care organizations with different patient populations, which may differ demographically, or by sexual risk, stability of health care cover-age, and/or patterns of EHR use.
Although we had a primary outcome of ≥2 repeat STI diagnoses within 730 days, we also included 3 alternative outcomes (i.e., ≥2 repeat STI diagnoses within 365 days, ≥1 repeat STI diagnoses within 365 days, and ≥1 repeat STI diagnoses within 730 days) because this allowed us to assess whether the EHR data could better inform predictions for specific types of repeaters. The outcome of ≥2 repeat STI diagnoses within 730 days yielded the highest cv-AUC value with 0.76; however, for the purpose of informing clinical practice, it still did not adequately discriminate between patients who were diagnosed with repeat STIs and those who were not. These outcomes were based on incident STIs that required no recorded STI diagnoses in the preceding calendar year, a requirement that excluded 65 patients from the analysis at the beginning of the study period, which likely had a minimal impact on the results. In addition, the definitions used for chlamydia and gonorrhea diagnoses were unable to account for empirically treated events that have no accompanying laboratory tests. However, a syphilis diagnoses could be defined as an ICD-9 or ICD-10 diagnostic code with a corresponding order for syphilis-approved antibiotic, which can be thought of as empirically treated.
Analyses using data from a single practice or practice group are limited by an inability to assess patient care outside these practices. In addition, without regular and frequent STI testing or universal screening for repeat infections within these settings, model development would be restricted to available testing practices for identifying incident STIs and predicting repeat diagnoses only on those with repeat screening within this practice group. A strength of this analysis was our ability to use public health surveillance data to conduct a sensitivity analysis to address these limitations. Approximately 100 patients previously identified as having only 1 STI event were found to have at least 2 events after surveillance data were included. However, incorporating these data did not improve cv-AUC scores. Indeed, cv-AUC scores decreased after integrating additional STI diagnoses from the health department into the data set. This perhaps reflects the fact that these extra patients by definition were all individuals receiving care outside Atrius Health, and thus, the information within the Atrius Health EHR being used to model risk for repeat infections was likely to be incomplete. In addition, the MDPH data only encompassed a portion of the time frame included in the primary analysis. This does suggest, however, that outcome misclassification alone is unlikely to be an important factor hindering the development of a reliable algorithm. The use of the MDPH data was also able to partially validate incident STIs by accounting for STI diagnoses made out of network; however, using a stricter definition for an incident STI that required a negative STI test result in the prior year to a positive test result would have strengthened the overall definition and encompassed the whole time frame included in the primary analysis. The stricter definition was not used because it would have significantly reduced the sample size, as only 40% of incident STIs had a chlamydia, gonorrhea, syphilis, or HIV test in the prior year within this practice group and negative STI results were not available in the MDPH data for out-of-network care.
Possible reasons for the poor performance of our algorithms could include the paucity of structured data on important behavioral factors in EHRs including sexual orientation, number of sex partners, use of condoms, specific sexual behaviors, use of dating apps, transactional sex, intimate partner violence, and anonymous sexual partners. Socioeconomic factors may also be important, including income, highest educational attainment, local poverty rate, and urban-rural residency status.24,25 These data were not available in the Atrius Health system EHR and are rarely collected in a structured and systematic fashion in most EHRs.26 There may be strategies to nonetheless gather these data separately from patients with incident STIs, such as routine behavioral surveys, and incorporate them into risk algorithms that integrate patients’ EHR data with these behavioral and socioeconomic factors. Alternatively, strategies, such as geocoding patient address, could be used to collect proxy socioeconomic status based on existing patient contact information already existing within the EHR. Future work could focus on assessing the feasibility of gathering these data, integrating them with patients’ structured EHR data, and measuring their marginal impact on the performance of predictive algorithms for repeat STIs.
Alternatively, model development could occur outside the individual health care facility setting such as at the local or state department of public health. By conducting development and implementation at the health department level, it is possible some known EHR limitations including loss to follow-up, receiving out-of-network care, and missing data (i.e., behavior and socio-economic factors) could be partially addressed. Health departments collect behavior and limited socioeconomic factors during routine field follow-up and from provider submitted case report forms27; however, data collection and completion will vary by disease and across jurisdictions. Although this analysis did incorporate the MDPH data to address misclassification due to patients seeking out-of-network care, it did not yield improvements to the performance of the predictive algorithms. In addition, data on behavioral and socioeconomic factors collected by the MDPH were not included in the sensitivity analyses. Thus, this remains an avenue for future analyses. Despite the aforementioned limitations of standard EHR variables (i.e., diagnoses, laboratory information, and prescriptions), which were unable to account for sociobehavioral or environmental characteristics, our study had several strengths. These included the assessment of machine learning algorithms, a novel methodological approach for the analysis of EHR data, and the use of public health data to augment and circumvent concerns regarding outcome misclassification because of patients seeking care outside Atrius Health.
In conclusion, machine learning algorithms using routine EHR data were not sufficiently useful for identifying patients with an incident STI at high risk for diagnosis of repeat STIs. Further work is needed to better identify risk factors for repeat STIs, to assess their marginal contribution to helping identify patients at high risk for repeat STIs, and if successful, to assess whether automated systems for identifying patients at high risk for repeat STIs lead to meaningful interventions and tangible decreases in repeat infection rates.
Supplementary Material
Acknowledgments
This work was supported by the Division of STD Prevention, US Centers for Disease Control and Prevention, through the STD Surveillance Network Part B (CDC-RFA-PS13-1306).
Footnotes
Disclaimer: The findings and conclusions in this report are those of the authors and do not necessarily represent the official position of the Centers for Disease Control and Prevention.
Supplemental digital content is available for this article. Direct URL citations appearintheprinted text, and links tothedigital files areprovided in the HTML text of this article on the journal’s Web site (http://www.stdjournal.com).
Conflict of Interest and Sources of Funding:
None declared.
REFERENCES
- 1.Center for Disease Control and Prevention. Sexually Transmitted Disease Surveillance 2018. Atlanta, GA: US Department of Health and Human Services, 2019. [Google Scholar]
- 2.Overview of Sexually Transmitted Disease Surveillance Data, Massachusetts, 1990–2018. Massachusetts Department of Public Health, Bureau of Infectious Disease and Laboratory Sciences, 2020. Available at: https://www.mass.gov/lists/std-data-and-reports. Accessed May 7, 2020.
- 3.Fung M, Scott KC, Kent CK, et al. Chlamydial and gonococcal reinfection among men: A systematic review of data to evaluate the need for retesting. Sex Transm Infect 2007; 83:304–309. [DOI] [PMC free article] [PubMed] [Google Scholar]
- 4.Simms I, Stephenson JM. Pelvic inflammatory disease epidemiology: What do we know and what do we need to know? Sex Transm Infect 2000; 76:80–87. [DOI] [PMC free article] [PubMed] [Google Scholar]
- 5.Hsu KK, Molotnikov LE, Roosevelt KA, et al. Characteristics of cases with repeated sexually transmitted infections, Massachusetts, 2014–2016. Clin Infect Dis 2018; 67:99–104. [DOI] [PubMed] [Google Scholar]
- 6.Leichliter JS, Ellen JM, Gunn RA. STD repeaters: Implications for the individual and STD transmission in a population. In: Aral SO, Douglas JM Jr., eds. Behavioral Interventions for Prevention and Control of Sexually Transmitted Diseases. New York: Springer, 2007:354–373. [Google Scholar]
- 7.Workowski KA, Bolan GA, Centers for Disease Control and Prevention. Sexually transmitted diseases treatment guidelines, 2015. MMWR Recomm Rep 2015; 64(RR-03):1–137. [PMC free article] [PubMed] [Google Scholar]
- 8.Dee EC, Hsu KK, Kruskal BA, et al. Temporal patterns in chlamydia repeat testing in Massachusetts. Am J Prev Med 2019; 56:458–463. [DOI] [PMC free article] [PubMed] [Google Scholar]
- 9.Centers for Disease Control and Prevention (CDC). Automated detection and reporting of notifiable diseases using electronic medical records versus passive surveillance—Massachusetts, June 2006–July 2007. MMWR Morb Mortal Wkly Rep 2008; 57:373–376. [PubMed] [Google Scholar]
- 10.Klompas M, McVetta J, Lazarus R, et al. Integrating clinical practice and public health surveillance using electronic medical record systems. Am J Public Health 2012; 102(S3):S325–S332. [DOI] [PMC free article] [PubMed] [Google Scholar]
- 11.Klompas M, Cocoros NM, Menchaca JT, et al. State and local chronic disease surveillance using electronic health record systems. Am J Public Health 2017; 107:1406–1412. [DOI] [PMC free article] [PubMed] [Google Scholar]
- 12.Lazarus R, Klompas M, Campion FX, et al. Electronic support for public health: Validated case finding and reporting for notifiable diseases using electronic medical data. J Am Med Inform Assoc 2009; 16:18–24. [DOI] [PMC free article] [PubMed] [Google Scholar]
- 13.Vogel J, Brown JS, Land T, et al. MDPHnet: Secure, distributed sharing of electronic health record data for public health surveillance, evaluation, and planning. Am J Public Health 2014; 104:2265–2270. [DOI] [PMC free article] [PubMed] [Google Scholar]
- 14.Van der Laan MJ, Polley EC, Hubbard AE. Super learner. Stat Appl Genet Mol Biol 2007; 6. [DOI] [PubMed] [Google Scholar]
- 15.R Core Team. R: A Language and Environment for Statistical Computing. Vienna, Austria: R Foundation for Statistical Computing, 2018. Available at: https://www.R-project.org/. Accessed September 8, 2020. [Google Scholar]
- 16.Friedman J, Hastie T, Tibshirani R. Regularization paths for generalized linear models via coordinate descent. J Stat Softw 2010; 33:1–22. [PMC free article] [PubMed] [Google Scholar]
- 17.Chipman HA, George EI, McCulloch RE. BART: Bayesian Additive Regression Trees. Ann Appl Stat 2010; 4:266–298. [Google Scholar]
- 18.Chen T, He T, Benesty M, Khotilovich V, Tang Y. Xgboost: Extreme gradient boosting. R Package Version 0.6.4.1 2018. Available at: https://CRAN.R-project.org/package=xgboost. Accessed September 8, 2020. [Google Scholar]
- 19.Fritsch S, Guenther F. Neuralnet: Training of Neural Networks. R package version 1.33; 2016. Available at: https://CRAN.R-project.org/package=neuralnet. Accessed September 8, 2020. [Google Scholar]
- 20.Meyer D, Dimitriadou E, Hornik K, Weingessel A, Leisch F. e1071: Misc functions of the Department of Statistics, Probability Theory Group (formerly: E1071), TU Wien; R package e1071 version 1.6–8. 2017. Available at: https://CRAN.R-project.org/package=e1071. Accessed September 8, 2020.
- 21.Geisser S Predictive Inference. London: Chapman and Hall, 1993. [Google Scholar]
- 22.Troppy S, Haney G, Cocoros N, et al. Infectious disease surveillance in the 21st century: An integrated web-based surveillance and case management system. Public Health Rep 2014; 129:132–138. [DOI] [PMC free article] [PubMed] [Google Scholar]
- 23.Rose G Sick individuals and sick populations. Int J Epidemiol 2001; 30:427–432. [DOI] [PubMed] [Google Scholar]
- 24.Walsh JL, Senn TE, Carey MP. Exposure to different types of violence and subsequent sexual risk behavior among female sexually transmitted disease clinic patients: A latent class analysis. Psychol Violence 2012; 2:339–354. [DOI] [PMC free article] [PubMed] [Google Scholar]
- 25.Pinto CN, Dorn LD, Chinchilli VM, et al. Chlamydia and gonorrhea acquisition among adolescents and young adults in Pennsylvania: A rural and urban comparison. Sex Transm Dis 2018; 45:99–102. [DOI] [PubMed] [Google Scholar]
- 26.Benchimol EI, Smeeth L, Guttmann A, et al. The REporting of studies Conducted using Observational Routinely-collected health Data (RE-CORD) statement. PLoS Med 2015; 12:e1001885. [DOI] [PMC free article] [PubMed] [Google Scholar]
- 27.Goldstein BA, Navar AM, Pencina MJ, et al. Opportunities and challenges in developing risk prediction models with electronic health records data: A systematic review. J Am Med Inform Assoc 2017; 24:198–208. [DOI] [PMC free article] [PubMed] [Google Scholar]
Associated Data
This section collects any data citations, data availability statements, or supplementary materials included in this article.