

Abstract
Rho‐GTPases proteins function as molecular switches alternating from an active to an inactive state upon Guanosine triphosphate (GTP) binding and hydrolysis to Guanosine diphosphate (GDP). Among them, Rac subfamily regulates cell dynamics, being overexpressed in distinct cancer types. Notably, these proteins are object of frequent cancer‐associated mutations at Pro29 (P29S, P29L, and P29Q). To assess the impact of these mutations on Rac1 structure and function, we performed extensive all‐atom molecular dynamics simulations on wild‐type (wt) and oncogenic isoforms of this protein in GDP‐ and GTP‐bound states. Our results unprecedentedly elucidate that P29Q/S‐induced structural and dynamical perturbations of Rac1 core domain weaken the binding of the catalytic site Mg2+ ion, and reduce the GDP residence time within protein, enhancing the GDP/GTP exchange rate and Rac1 activity. This broadens our knowledge of the role of cancer‐associated mutations on small GTPases mechanism supplying valuable information for future drug discovery efforts targeting specific Rac1 isoforms.
Keywords: druggable cysteines, fast‐cycling mutations in cancer, molecular dynamics simulations, point mutations, small‐GTPases
1. INTRODUCTION
Small Guanosine Triphosphate Phosphohydrolases (GTPases) proteins govern many crucial cellular processes, such as actin cytoskeleton remodeling, cellular movements, cell polarity and division, and gene expression (Grosshans et al., 2006; Schwartz & Shattil, 2000; Song et al., 2019; Strassheim et al., 2019). This superfamily of enzymes acts as molecular switches cycling between an active GTP‐bound form (on‐state) and, after GTP hydrolysis, an inactive Guanosine diphosphate (GDP)‐bound form (off‐state). Such a cycle depends on the GDP/GTP exchange and intrinsic GTP hydrolysis of these proteins. The GTP/GDP turnover process is controlled by GTPase activating proteins (GAPs) and guanine exchange factors (GEFs) (Mishra & Lambright, 2016; Toma‐Fukai & Shimizu, 2019). In addition, the GDP dissociation inhibitors (GDIs) regulate the interactions between Rho‐GTPases and their protein regulators by controlling their cellular membrane trafficking, where GEFs and GAPs exert their function (DerMardirossian & Bokoch, 2005). Anomalies in this sophisticated regulatory mechanism, and, thus an imbalance in the ratio of the GTPases on/off states, lead to pathological conditions.
Rho‐GTPase family, comprising the Rho, Rac1‐3, and Cdc42 proteins, control cytoskeletal dynamics thus playing a crucial role in cancerous cells spreading. In particular, the activated Ras‐related C3 botulinum toxin substrate (Rac) subfamily promotes lamellipodia and membrane ruffles (Ridley & Hall, 1992) regulating cell adhesion, morphology, and movements. The Rac subfamily comprises members exhibiting a sequence similarity larger than 87%. These include Rac1, which demonstrates ubiquitous and extensive‐expression; Rac2, exclusively expressed in hematopoietic cells; and Rac3, primarily expressed in the brain (Carlos Amor et al., 1994; Schaefer et al., 2014; Wennerberg et al., 2005). Due to the large body of experimental data available in the literature and its ubiquitous expression, here, we select Rac1 as a representative member of the Rac subfamily.
The Rac1 structure consists of three domains (Schaefer et al., 2014): a flexible 20 residues carboxyl‐terminal hypervariable region (HVR) (Wennerberg et al., 2005), the few residues‐long N‐terminal region, and the core guanine nucleotide‐binding (G)‐domain (Figure 1). The latter is organized in a six‐stranded β‐sheets core enveloped by six helices interconnected via loops (Carlos Amor et al., 1994; Hirshberg et al., 1997; Nassar et al., 1995; Scheffzek et al., 1995). Rac1 architecture is made by several functional motifs: (i) switch‐I (residues 26–45) and II (residues 59–74), (ii) the insert region (residues 124–135), and (iii) the p‐loop (Figure 1). Switch‐I, also named “effector region,” interacts directly with the GAPs. Switch‐II, instead, interacts with Rac1 activating proteins (GEFs). The insert region (α3), a distinctive trait of small Rho‐GTPases (Figure 1), control the interaction with downstream protein regulators, particularly in the formation of NADPH oxidase complex, which regulates the concentration of reactive oxygen species (ROS) in the cell (Freeman et al., 1996). Specific Rac1 residues, among which Thr35, Tyr64, Arg66, His103, and His104, hydrogen bond to Rho‐GDI proteins, sequestering GTPase in its inactive form (Ferrandez et al., 2017). Notably, the catalytic site of Rac1 harbors a Mg2+ ion, which in the GTP‐loaded form, is coordinated by Thr17 and Thr35, two water molecules and two GTP oxygens, whereas in the GDP‐bound form, its coordination shell consists of Thr17, four water molecules and a GDP oxygen atom (Ferrandez et al., 2017).
FIGURE 1.
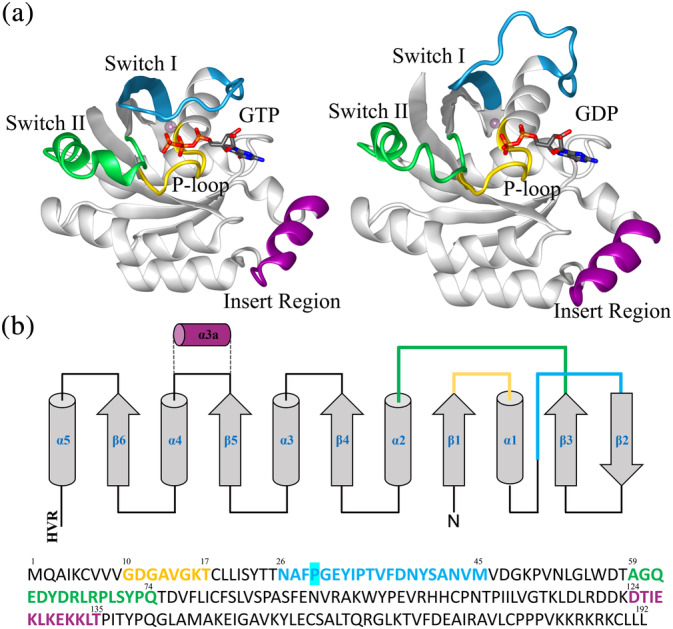
(a) Ribbon representations of GTP and GDP‐bound Rac1 with the main functional sites switch‐I, switch‐II, P‐loop, and insert‐region shown in cyan, green, yellow, and purple, respectively. The Mg2+ ion is shown as a pink sphere. (b) Schematic representation of Rac1 secondary structure, with the C‐terminal Hypervariable region (HVR) not shown in (a). On the bottom primary sequence with the color scheme according to (a). The mutation site is highlighted in cyan.
Increased expression levels of Rac1 are observed in different forms of cancer, including breast, lung, colorectal, gastric, prostate, hepatocellular, and ovarian cancer (Leng et al., 2015; Lin et al., 2020; López‐Cortés et al., 2020; Venugopal et al., 2020; Wu et al., 2020; Xia et al., 2019). Moreover, Rho‐GTPases are object of cancer‐associated mutations. The prevalent mutations in Rac proteins involve the substitution of proline 29 by serine (P29S), glutamine (P29Q), or leucine (P29L) (De et al., 2019; Kawazu et al., 2013). These mutations are classified according to their mechanism of actions as: (i) fast‐cycling mutants when they induce an accelerated GDP/GTP exchange, but retain the same GTP hydrolysis rate and (ii) constitutively activating mutants when they exhibit the same GDP/GTP exchange rate, while impairing GTP hydrolysis. Both types of mutations result in an increase of the GTP‐bound active state of Rho GTPases proteins (Crosas‐Molist et al., 2022). The most frequent P29S mutation of Rac1 (Rac1P29S), was observed in melanomas (Hodis et al., 2012; Krauthammer et al., 2012), breast, endometrial, head and neck cancers (Kawazu et al., 2013; Lionarons et al., 2019). This mutation was demonstrated to retain its intrinsic GTPase activity, while having enhanced GDP‐ and GTP‐cycling (Davis et al., 2013). Indeed, the switch‐I motif, housing P29, serves as a regulatory component, facilitating nucleotide binding and interactions with protein regulators (Hakoshima et al., 2003; Rajendran et al., 2016; Wennerberg et al., 2005). Specifically, the crystal structure of Rac1P29S isoform (PDB id: 3SBD) (Krauthammer et al., 2012) revealed the formation of direct hydrogen bond between the GTP ribose hydroxyl groups and the backbone carbonyls of Ser29 and Gly30 in contrast to the wild type (wt) form, where these interactions are water‐mediated. Hydrogen bonds rearrangement of the ribose —OH groups were observed also in hyper‐activated Ras isoforms (Dharmaiah et al., 2019; Ingólfsson et al., 2022; Matsumoto et al., 2016).
Although structural and biochemical studies provided valuable insights into the structure of wt and cancer‐associated Rac1 isoforms, these are unable to assess the structural, functional, and dynamical impact of these mutations at an atomic‐level of detail. Molecular dynamics (MD) simulations can provide this information and have been successfully exploited to decode mutation‐induced conformational and functional changes of K‐Ras and other Ras proteins (Al‐Koussa et al., 2020; Kaushik et al., 2021; Lu et al., 2016; Ogunlana et al., 2022; Sayyed‐Ahmad et al., 2017; Shang et al., 2012; Sun et al., 2020; Tu et al., 2022; Vatansever et al., 2019). Here, we apply MD simulations to elucidate the mechanism of Rac1P29S/L/Q cancer‐associated isoforms. As a result, we reveal that two of these cancer‐related variants, trigger a faster GDP dissociation by inducing a remodeling of the structure, and hydrogen bond network in the active site, which by weakening the binding of the Mg2+ ion and the GDP, facilitates GDP dissociation from Rac1 isoforms.
2. RESULTS
2.1. Structural analysis of Rac1 and Rac1 isoforms
We initially inspected the stability of Rac1wt and Rac1P29S/Q/L, for both the GPD‐ and GTP‐bound forms. A RMSD analysis revealed that the systems are stable for the whole 1 μs‐long MD simulation trajectory (Figures S1 and S2). Conversely, an analysis of their flexibility (i.e., a RMSF analysis) pinpointed differences between the Rac1 isoforms (Figure 2; Figure S3).
FIGURE 2.
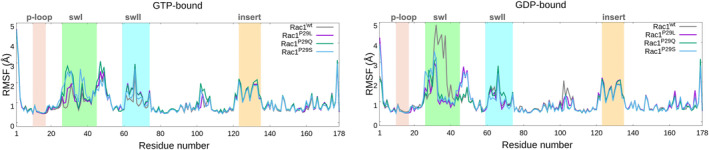
Root Mean Square Fluctuations (RMSF, Å) calculated on the backbone atoms, of wild type (gray) and P29L (magenta), P29Q (green) and P29S (cyan) mutants of the GTP‐bond (left) and GDP‐bound (right) Rac1 protein. The main functional sites p‐loop, switch‐I (swI), switch‐II (swII), and insert‐region (insert) are highlighted in pink, green, light‐blue, and orange, respectively.
Notably, the RMSF of the GTP‐bound Rac1 variants ranges between 0.7 and 3.0 Å, similarly to the Rac1 P29L/Q/S GDP‐bound. While the RMSF value of the Rac1wt‐GDP switch‐I region raises to 5.0 Å (Figure 2), indicating a larger mobility.
To scrutinize the conformational dynamics exhibited by the two switch regions throughout the MD simulations of GTP‐bound systems, we systematically inspected the non‐covalent interactions established between GTP and the G‐domain (Figure S4). The GTP is maintained into the active site of Rac1wt by forming hydrogen bonds with residues Ala13, Gly15, Thr17, Cys18, Tyr32, Gly60, Gln61, and Asp118 (Table S1). The hydrogen bond between Gly30 and GTP, present in the crystallographic structure of Rac1P29S‐GTP (Krauthammer et al., 2012), is instead lost in the MD simulations, similarly to what observed by Senyuz et al. (2021). Furthermore, electrostatic interactions and salt‐bridges are formed between the GTP phosphates and the positive charges of the Mg2+ ion and the Lys16 residue, for the entire MD simulation trajectory (Table S1). Additionally, a series of distances measurements were systematically undertaken to further elucidate structural changes. Specifically, the distances between Cα:Ala13 and Cα:Thr35 (Figure S5) and Cα:Gly12 and Cα:Gly60 (Figure S6) were measured to assess the opening switch‐I and switch‐II, respectively, with respect to the protein core. No significant differences among the investigated Rac1 isoforms emerged. Superimposition of the two most populated Rac1‐GTP clusters, representative of the wt and cancer‐associated isoforms, confirm the lack of substantial differences among the studied systems (Figures S7).
Conversely, larger RMSF changes are visible among GDP‐bound isoforms. Particularly, the RMSF of switch‐I, from the mutation position (residue 29) to Asn39, markedly decreases in all mutants as compared with wt form. By plotting the Cα:Phe37‐Cα:Thr58 (Figure 3a) and Cα:Arg68‐Mg2+ (Figure 3b) distances, which allow account for switch‐I and switch‐II opening, respectively, we observed in Rac1wt an alternance of switch‐I closed and open conformations (mean distances Cα:Phe37‐Cα:Thr58 equal to 5.47 ± 0.47 Å and 10.50 ± 0.61 Å, in the closed and open state, respectively). Instead, in all P29 isoforms, the switch‐I remains closed for the entire MD simulation trajectory (mean distance of Cα:Phe37‐Cα:Thr58 equal to 5.33 ± 0.26 Å, 5.52 ± 0.26 Å, and 5.61 ± 0.35 Å for Rac1P29L, Rac1P29Q, and Rac1P29S, respectively). This behavior is also confirmed by the analysis of the Cα:Ala13‐Cα:Thr35 distance (Figures S8 and S10). Instead, the distance between Cα:Arg68 and the Mg2+ ion (Figure 3; Figures S9 and S11), clearly shows that switch‐II remains in a closed state in Rac1P29L and Rac1wt, while assuming an open conformation in Rac1P29S and Rac1P29Q for most of the simulation time.
FIGURE 3.
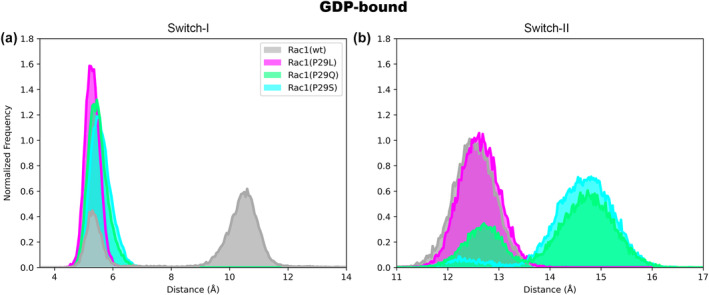
The probability distribution function of the distance (Å) between (a) Cα:Phe37 and Cα:Thr58 accounting for switch‐I opening (b) Cα:Arg68 and Mg2+ atoms, accounting for switch‐II opening calculated along the 1 μs‐long classical MD trajectory of Rac1‐GDP wild type (gray) and P29L (magenta), P29Q (green), and P29S (cyan). The probability distribution function for replicas is reported in Figure S11.
The mutations also affect the secondary structure of key structural motifs. Indeed, the tract corresponding to residues Gly30‐Phe37, which is part of switch‐I, prevalently assumes an unstructured secondary structure in Rac1wt (Figure S12), while in P29Q/S cancer isoforms becomes more structured in the Gly30‐Ile33 part. The visual inspection of MD trajectories, corroborated by the secondary structure analyses (Figures S13 and S14), depicts an increase transient α‐helical content within the Gly30‐Ile33 stretch for the Rac1P29Q variant (Figure S13a). As well, residues Asp65‐Arg68, belonging to switch‐II, more frequently adopt a 3–10 helix conformation in the P29Q/S cancer‐related variants (Figure S13).
We next systematically analyzed all differences in the non‐covalent intramolecular interactions among the different Rac1 isoforms using key Interactions Finders program (Crean et al., 2023) (Figure 4). This analysis allows one to gain insights into the interaction‐network remodeling induced by the mutations (Spinello et al., 2023).
FIGURE 4.
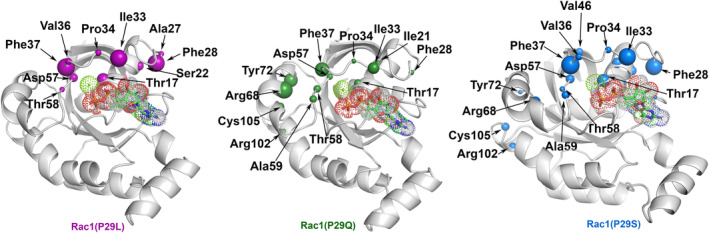
Ribbon representations of GDP‐bound Rac1. The sphere sizes refer to per‐residue score and account for the differences in the Rac1/GDP interactions between Rac1 wt and the different mutants. Van deer Waals spheres, highlighting the residues experiencing the largest differences, are depicted in magenta, green, and cyan for P29, P29Q, and P29S, respectively. For clarity, only differences higher than 25% are reported. The GDP is shown in licorice surrounded by dotted spheres.
As a result, we observed that in all mutations the interaction‐network is different in proximity of switch‐I residues Phe28, Ile33, Pro34, and Phe37. In Rac1P29Q and Rac1P29S the interaction‐network remodeling also involves the switch‐II residues Tyr72 and Arg68 (Figure 4; Table S4). Notably, the Thr17/Asp57 residues are well‐known to maintain the binding and a suitable orientation of Mg2+ within the Rho‐GTPases catalytic site (Hakoshima et al., 2003; Zhang et al., 2000). In Rac1wt, for almost the whole simulation time the carboxyl oxygens of Asp57 hydrogen bonds with the Thr17 hydroxyl group, with a water molecule from the Mg2+ coordination shell, and with the Thr58 amide backbone (Figure S15). However, in all cancer‐associated isoforms, the frequency of the hydrogen bond between the carboxylic group of Asp57 and the Thr58 amide backbone is reduced (Table S5). Since Thr58 and Asp57 keep the Mg2+ ion in the active site through water‐mediated hydrogen bonds (Figure S15), the less frequent hydrogen bonding between Asp57 and Thr58 in cancer‐related isoforms of Rac1 increased the mobility of the Mg2+ ion.
We also explored how switches remodeling affects the dynamical coupling and functional dynamics of the GDP‐bound systems. The cross‐correlation matrix, based on the Pearson correlation coefficients, revealed that in GDP‐bound Rac1 switch‐I is anticorrelated with the other functional motifs (Figure S16). In all cancer‐related isoforms, the p‐loop is positively correlated to switch‐I and switch‐II.
Then we performed the principal component analysis (PCA). The PCA scatter plot, across the first two PCs, reveals that the distribution of conformational space explored by mutants is similar, being nevertheless different from the wt form (Figure S17), which exhibits larger conformational variability. Indeed, the first principal component (PC1), which allows grasping the slow and functionally relevant motion of the biomolecule (Casalino et al., 2018; Saltalamacchia et al., 2020), revealed that in Rac1wt switch‐I undergoes an opening/closing motion with respect to the protein core (Figure 5; Movies [Link], [Link]) side view picture is shown in Figure S19. Such opening/closing movement partially involves switches‐I and also the insert region (Figure 5a). The switch‐I motion is perturbed in all mutants. Only in Rac1P29Q and Rac1P29S, the opening/closing movement also involves switch‐II. A previous study on frequent KRas isoforms showed that the A146T mutation induced an unusual β2–β3 interactions, destabilizing switch‐II and altering its interactions with the Mg2+ ion, thus inducing faster nucleotide dissociation (Poulin et al., 2019), we inspected if the mutation‐induced conformational remodeling of the protein and its interaction‐network detailed above could affect the strength of Mg2+ ion binding. The distribution of the positions visited by the Mg2+ ion along all MD simulations trajectories reveals that, besides altering the motion of switch‐II and the β2‐β3 connector loop, Rac1P29Q and Rac1P29S isoforms make the Mg2+ ion more mobile than in Rac1wt (Figure 5e), consistently with the loss of the water‐mediated interaction with Thr58 (Figure S15). The fact that the Mg2+ ions have larger mobility in the mutant forms is also supported by an analysis of the RMSF (Figure S20).
FIGURE 5.
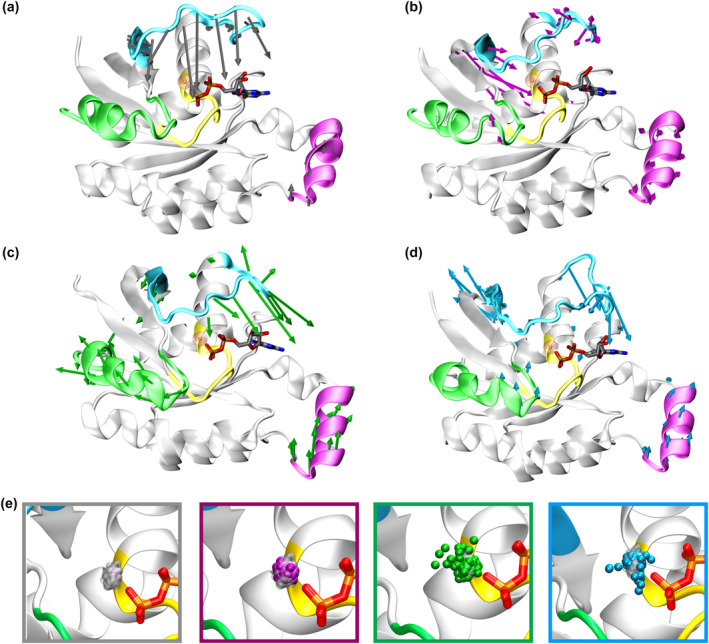
Essential dynamics of Rac1 in the GDP‐bound state. Eigenvectors of the first principal component extracted from PCA are shown as arrows whose direction and size represent the direction and amplitude of motion for (a) Rac1wt, (b) Rac1P29L, (c) Rac1P29Q, and (d) Rac1P29S. For clarity, we only report the arrows indicating a motion larger than 1 Å. (e) Density distribution of the positions visited by the Mg2+ ion plotted considering 4500 frames along the MD simulations trajectories. The gray square shows the population density of Mg2+ ion in Rac1wt (silver transparent spheres). The magenta, green, and cyan squares show the position of the Mg2+ ion in Rac1P29L, Rac1P29Q, and Rac1P29S, respectively. The image was generated by centering the MD trajectory with respect to the protein C‐alpha after verifying that the protein back‐bone fluctuations are less marked than those of the Mg2+ ion (Figure S20). The protein and GDP substrate are kept fixed in the visualization to enhance the clarity of the Mg2+ ion movement. However, the interaction between this ion and beta‐phosphate group is maintained throughout the MD simulation trajectory (Table S2).
2.2. GTP binding affinities and relative residence time of the GDP
We next investigated the impact of the mutation over binding affinity of GTP and GDP to Rac1 by computing the binding free energy (∆G° bind) of the GTP and GDP substrate to the protein. While no significant differences were observed when computing the binding free energy (∆G° bind) of GTP of the wt and cancer‐related variants (Table S6), we computed a smaller (less‐negative) ∆G°bind for GDP in all cancer related‐variants, reaching a ∆∆G° bind = +4.2 ± 1.9 kcal mol−1 for P29Q (Table S6). This suggests that the fast‐cycling of Rac1 may be due to a decreased GDP binding affinity in the cancer‐related variants.
Therefore, since the Mg2+ ion appears more mobile and the GDP ∆G° bind is lower in all mutants, we monitored if the mutations may facilitate GDP release. To this end, we computed the relative residence time (τ) of Racwt and RacP29Q via τ‐Random Acceleration Molecular Dynamics (τ‐RAMD) simulations (see Supporting Information for a detailed description). This method allows to efficiently sample ligand dissociation, while providing an estimate of the residence time (Kokh et al., 2019; Kokh & Wade, 2021; Nunes‐Alves et al., 2021). For this calculation, we selected RacP29Q isoform since it showed more marked structural and dynamical changes as compared to the wt. As detailed in the method section and in the Supporting Information, in τ‐RAMD simulations, three different replicas were done for each system, and from each replica 15 GDP‐dissociation trajectories were generated (Figures S23 and S24). The resulting average residence times are: τ = 0.50 ± 0.08 ns for Rac1wt, and τ = 0.23 ± 0.08 for Rac1P29Q (Figure 6a,c). We remark that we applied this method only to provide a ranking of the relative GDP residence times in the wt and cancer‐related Rac1 isoforms.
FIGURE 6.
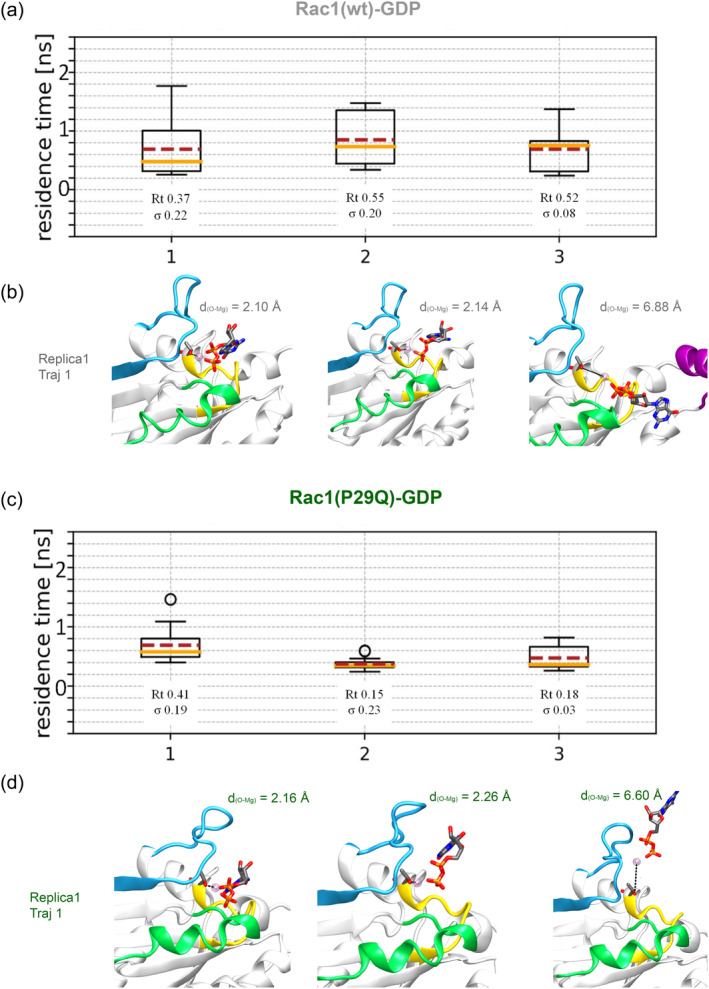
Bar plots showing on the y‐axes the GDP residence time (ns) and on the x‐axes are reported the values for the three replicas of each system. The residence time was computed for (a) Rac1wt and (c) Rac1P29Q. The boxes represent the calculated residence time values, whiskers indicate the range of the data. The dots represent outliers values of τ, while median and mean are shown by orange and dashed red lines, respectively. The outliers are indicated, but they are not removed from the computation of the residence time. The mechanism of GDP dissociation along trajectory 1 for replica 1 is exemplified for (b) Rac1wt and (d) Rac1P29Q. The first snapshot represents reference state. The distance (Å) between Thr17 side‐chain oxygen and Mg2+ is reported to highlight Mg2+ ion dissociation along with that of the GDP.
Interestingly, the τ‐RAMD simulations revealed that the P29Q mutation enhances the GDP release rate. Notably, in all τ‐RAMD trajectories, the GDP release occurs along with that of the Mg2+ ion (Figure 6b,d). Therefore, the increased mobility of Mg2+ ion in the active site of the cancer‐related variants may contribute the faster GDP dissociation rate.
3. DISCUSSION
Our comprehension of the Rac1 function, and their implications in cancer progression has significantly improved over the last decade. However, the investigation of cancer‐related mutations in Rac1 has been overlooked. Their importance is, however, witnessed by the identification of a UV‐induced oncogenic mutation in melanoma (Krauthammer et al., 2012). This Rac1P29S mutation has the ability to enhance downstream signaling pathways (Uribe‐Alvarez et al., 2021). Later, Rac1P29S, Rac2P29Q, and Rac2P29L mutations were identified in triple‐negative breast cancer cell lines (Kawazu et al., 2013), chronic myeloid leukemia (Thomas et al., 2008), endometrial (Chang et al., 2016), head and neck cancers (Hwang et al., 2004). Due to the urgency of finding cancer‐selective therapies finely tuned on patients genetic profile, here we aimed to elucidate the mechanisms through which these mutations hyperactivate Rac1 and contribute to cancer progression. By performing extensive MD simulations of Rac1 in its wt and P29S/Q/L pathological isoforms, we observed a change in flexibility of key functional regions similarly to other studies (Matsumoto et al., 2016). Namely, we observed that switch‐I of GTP‐bond Rac1P29Q and Rac1P29S exhibited an increased flexibility as compared to the wt and the P29L mutant.
More marked structural and dynamical differences emerged for GDP‐bound states of the protein. A structural analysis of the GDP‐bound Rac1 isoforms revealed that while Rac1wt and the Rac1P29L maintain a closed switch‐II conformation, Rac1P29S and Rac1P29Q predominantly adopt an open state. Instead, in all P29 isoforms, the switch‐I maintains a closed conformation. The switches conformational remodeling of the switches as induced by mutation may have consequences on the interactions between Rac1 and various GTPase regulatory proteins. These may include the Rho GDIs, GAPs, and GEFs, as well as downstream effectors. The findings of Davis et al. (2013) indicate that Rac1P29S undergoes spontaneous nucleotide exchange even without the presence of a nucleotide exchange factor in GEF‐mediated exchange. Additionally, it is tempting to suggest that some downstream effectors may exhibit an affinity for Rac1 GDP‐bound mutants due to the closed conformation of switch‐I, potentially impacting specific signaling pathways.
Although the interaction‐network of the GDP is similar in both wild type and cancer‐associated isoforms, in the latter we observed a difference in the orientation of key active site residues. Namely, the carboxyl group of Asp57, which hydrogen bonds to the hydroxyl group of Thr17, to the amide backbone of Thr58 amide backbone in Rac1wt, and instead interacts only with a water molecule, which belongs to the Mg2+ coordination sphere, and Thr17 hydroxyl in the mutants. As a result of this remodeled set of interactions the Mg2+ ions anchorage in the catalytic site is weakened in the P29Q/S isoforms. This, along with the enhanced opening‐closing motions of switch‐II and β2‐β3 structural motifs, triggers an accelerated GDP release, as demonstrated by the smaller residence time of the Rac1P29Q calculated via τRAMD simulations.
This finding aligns with a recent investigation of GDP dissociation from Cdc42 induced by the GEF protein DOCK9 (Kang et al., 2019). This study revealed that a remodeling of specific Cdc42 residues (Lys16, Thr17, Cys18, Phe28, Pro34, and Asp57) upon DOCK9 binding trigger faster GDP release. Similarly, the cancer‐related mutations investigated here reshape Rac1 secondary structure, functional motion and its interaction‐network resembling the effect of DOCK on GDP dissociation. In fact, DOCK employs a sensor valine residue, which remodels and weakens the Mg2+ ion binding (Yang et al., 2009) to facilitate GDP release from small GTPase catalytic site.
Despite its significance as a drug target, Rac1, similarly to all small‐GTPases, drug‐discovery failed over the last decades due to the lack of cavities suitable for binding small‐molecule inhibitors. Only in 2021, the covalent small‐molecule inhibitor Sotorasib, specifically targeting the G12C isoform of K‐Ras, was approved (Research C for DE, 2021). In the last 2 years, drug discovery studies aimed at targeting small Rho GTPases with covalent inhibitors, also aided by MD simulations, have been done. For example, Shang et al. (2012) by conformational flexibility of RhoA via all‐atom simulations, successfully pinpointed a pocket in close proximity to the conserved residue Cys107 (corresponding to Cys105 in Rac1). Their in vitro study also demonstrated that DC‐Rhoin successfully disrupted the interaction between Rho GTPases (RhoA, Rac1, and Cdc42) and their GEF by forming a covalent bond with this conserved cysteine residues. Notably, DC‐Rhoin exerted inhibitory effect of Rac1 activity albeit at high concentrations (100 μM). Our investigation of potentially druggable cysteines (see Supplementary Results) revealed that Cys105 may be amenable for mutant‐specific drug‐discovery in Rac1P29Q and Rac1P29S isoforms. Further studies are, however, needed to confirm its druggability.
4. CONCLUSION
Extensive MD simulations were performed here to assess cancer‐related mutations of Rac1. We reveal that the Rac1P29Q and Rac1P29S mutants exert the largest impact on Rac1 function. Shifting the conformational equilibrium of the switch‐II toward the open state, weakening the binding of the catalytic Mg2+ ion, and triggering an accelerated GDP release. These features resemble the effect of the GEF protein DOCK9 on GDP dissociation. This study also supplies valuable information on the druggability of cysteine residues to be employed in drug‐discovery studies of covalent inhibitors. Overall, these findings highlight the importance of understanding the mechanisms through which Rac1 mutations contribute to cancer progression and provide key insights for future drug‐discovery campaigns specificality tuned on patients' genetic profiles.
5. MATERIALS AND METHODS
5.1. MD simulations set‐up
Model systems were built on the crystal structure of human wt Rac1 bound to the GDP substrate (PDB id: 5N6O at 2.6 Å resolution) (off‐state). The GTP‐bound state was instead modeled on the crystallographic structure of Rac1 bound to the chemically inactive GNP (Phosphoaminophosphonic acid guanylate ester), an amino guanosine triphosphate analogue, which contains a nitrogen atom bridging Pγ and Pβ atoms (PDB id: 3TH5, 2.3 Å resolution). To obtain the natural Rac1 substrate, this nitrogen was replaced by an oxygen atom. Hence, few missing residues have been added and we determined the protonation states of ionisable residues at physiological pH, considering a salt concentration of 0.15 M, using Maestro program (Maestro, 2023). Substrates have been considered in their fully deprotonated form as suggested by Mann and coworkers (Mann et al., 2018). The investigated cancer associated mutations were built with the leap module of the Amber22 program (Case et al., 2023). In the MD simulations, the protein was described with ff14SB amber force field and solvated into a 14 Å layer of TIP3P orthorhombic water molecules box.
5.2. MD simulations
The topology of the system was built with leap module of the AmberTool22 (Case et al., 2023). The protein was described with ff14SB (Maier et al., 2015) amber force field and solvated into a 14 Å layer of TIP3P orthorhombic water molecules box. The GDP and GTP parameters were obtained by adopting AMBER94 force field data of monophosphate guanidine, and parameters for the terminal phosphate groups of adenosine di‐ and tri‐phosphate in the AMBER parameter database. To reach charge neutrality, the GDP‐ and the GTP‐bound proteins required the addition of two and three Na+ ions, respectively. Then, the catalytic Mg2+ ion was described with Li et al. parameters (Li et al., 2015). It is well known that classical force field parameters for magnesium ions are object of strong polarization and charge transfer effects in the presence of negative phosphate group (Casalino et al., 2017). We refined the Mg2+ point charges parameters to calculate the substrate's relative residence time in the active site, as detailed in the next subsection.
The solvated structures were first minimized by applying harmonic restraints on all atoms of the enzyme (50 kcal mol−1 Å2), using 5000 steps of the steepest descent algorithm, followed by 5000 steps of the conjugate gradient algorithm. In the second minimization step, the restraint on hydrogen atoms were released, while the third and fourth minimizations were performed with and without restraints on the protein backbone atoms, respectively. A progressive heating phase from 0 to 310 K for 3 ns using the Langevin thermostat (Liu et al., 2016) in the NVT ensemble with a time step of 0.002 ps was carried out. Then, 2 ns simulations coupling SHAKE algorithm (Andersen, 1983) with the NPT ensemble at 1 bar pressure using the Berendsen barostat (Berendsen et al., 1998) was done. The particle mesh Ewald summation method (Darden et al., 1993) was employed for the electrostatic potential using a real space cut‐off distance of 12 Å. During the heating and equilibration procedures, harmonic restraints, with a force constant 20.0 kcal mol−1 Å, were applied to the distances between Mg2+ and the c three coordinated water molecules. 1 μs‐long classical MD simulations were performed for the wt and Rac1P29S, Rac1P29L, and Rac1P29Q systems in their GDP‐ and GTP‐bound states. Finally, to assess the statistically significance and reproducibility of our results two additional replicas (each 1 μs‐long) were performed.
5.3. τ‐RAMD protocol
In the present study, the Random Acceleration Molecular Dynamics (τ‐RAMD) approach (Kokh & Wade, 2021), which is an enhanced sampling method based on the random acceleration MD implemented in the GROMACS code (Abraham et al., 2015) was used to calculate the substrate residence times of the GDP within the active site. Due to the coordination of the GDP to Mg2+ ion in order to dissociate it from the active site we reduced the over binding artifacts caused by the standard parametrization display by scaling the partial charges of the Mg2+ and its coordinated ligands (Barbosa et al., 2022; Ishizuka & Matubayasi, 2016; Zolghadr et al., 2016). To this end, we performed density functional theory (DFT) calculations at B3LYP/6‐311+G* level of theory. More in detail, 10 frames were extracted from the 1 μs‐long MD trajectory of Rac1‐GDP. Each frame has been cropped into a model of 69 atoms, including GDP, Mg2+, three water molecules and a truncated Thr17 saturated with hydrogens (Figure 7). The ESP (Bayly et al., n.d.) partial charge of the atoms in the 10 frames were calculated by using the software Gaussian16 (Gaussian 16, Revision C.01, et al., 2016). The resulting charge distributions over 10 conformations are reported in Table S8.
FIGURE 7.
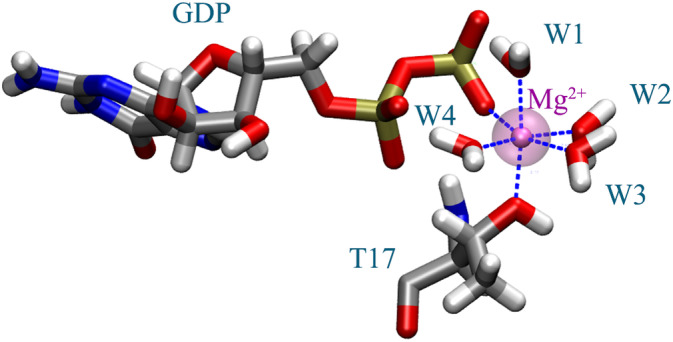
Representation of the cropped model used for the density functional theory calculations, including GDP, Threonine 17, four water molecules and the magnesium ion.
For each atom in the first Mg2+ coordination shall, the refined charge was obtained with the formula:
where Q i is the atom charge used in our τ‐RAMD calculations, and q i is the RESP atom charge obtained from each QM calculations.
These refined parameters (Supporting Information) were then used to perform the τ‐RAMD, simulations. The Rac1WT, Rac1P29Q systems were first minimized and heated with the software Amber18 (Case et al., 2018). A combination of steepest descent and conjugate gradient minimization, consisting of 500 and 1000 steps, respectively, was used. The systems were gradually heated to 310 K over 1 ns, during which harmonic restraints with a force constant of 50 kcal mol−1 Å−2 were applied to non‐hydrogen atoms. Equilibration of the system was achieved through a five‐step process, 1 ns each, in which the restraints force constant has been decreased from 50 to 0.5 kcal mol−1 Å−2. Then, one more 10 ns simulation without restraints was carried out with Amber18, during which the temperature was kept at 310 K using a Langevin thermostat (Liu et al., 2016) and the pressure at 1 atm via Berendsen barostat (Berendsen et al., 1998). The so obtained equilibrated atomic coordinates were utilized as input to generate initial replicas. Then, three replicas were generated using a Maxwell distribution of velocities in the NPT ensemble employing Nose‐Hoover thermostat (Evans & Holian, 1985) and the Parrinello‐Rahman barostat (Parrinello & Rahman, 1981) to maintain the system at 310 K and 1 atm. GROMACS‐RAMD version 2.0 was used for τ‐RAMD simulations. A set of 15 trajectories was generated for each replica. A 25 kcal mol−1 Å−1 random‐direction force was applied to the substrate. Force magnitude was selected after an appropriate benchmark. Simulations were stopped when the GDP’ center of mass reaches further than 40 Å from its original position.
5.4. Molecular mechanics Poisson–Boltzmann surface area (MM‐PBSA)
Binding free energies (ΔG b ) between Rac1 and GTP/GDP, were calculated using the molecular mechanics‐Poisson–Boltzmann surface area (MM‐PBSA) method (Wang et al., 2016) using MMPBSA.py program (Miller et al., 2012). Errors are reported as their corresponding standard error of mean. A salt concentration of 0.15 M was used. While maintaining the external dielectric constant at default value of 80, we assigned a value of 4 for the internal dielectric constant of the protein, as successfully employed in other studies (Parise et al., 2022; Rozza et al., 2023). We applied the interaction entropy approach (Duan et al., 2016) to compute the entropic contribution term (−TΔS) at 310 K. MM‐PBSA calculations were performed on 1000 frames, excluding the first 100 ns of production.
5.5. MD analysis
The 1 μs long trajectories of Rac1WT, Rac1P29S, Rac1P29L, and Rac1P29Q were used to analyze structural properties as function of time of the systems.
The Root Main Square Deviation (RMSD), the Root Main Square Fluctuation (RMSF), DSSP‐tool to assign the secondary structure in a protein and RMSD‐based clustering analysis were performed using the cpptraj module of Ambertools22 (Case et al., 2023). Using the same module, PCA was carried out to detect the collective motions on a larger scale that occur in biological molecules during MD simulations of Rac1 cancer isoforms. The PCA simplifies data by extracting correlated biologically meaningful motions from MD simulations. To this end we first constructed the mass‐weighted covariance matrix for the Cα atoms was computed from the MD trajectories, after removing the rotational and translational movements. By diagonalizing the matrix, a group of eigenvectors and eigenvalues were identified. The motion along the first eigenvector (essential dynamics), that is the vector corresponding to the largest eigenvalue, represents the most relevant motion of the system. This was visualized with the VMD program, and arrows highlighting the direction and the amplitude of motion were drawn using the Normal Wizard plugin (Bakan et al., 2011) of the VMD program (Humphrey et al., 1996).
The open‐source Python package Key Interactions Finder (KIF) has been applied to identify non‐covalent interactions (hydrogen bond, salt bridge, hydrophobic and van der Waals interactions) strongly associated with conformational changes (Crean et al., 2023).
The analyses have been performed on three different replicas. While the first replica is the most discussed in the main text, the results of the additional replicas are reported in Figures S2, S3, S11, S14, and S20. These additional analyses assess the significance and reproducibility of our findings.
AUTHOR CONTRIBUTIONS
Angela Parise: Conceptualization; investigation; funding acquisition; writing – original draft; formal analysis; visualization. Alessandra Magistrato: Conceptualization; funding acquisition; writing – review and editing; resources; supervision; project administration.
CONFLICT OF INTEREST STATEMENT
The authors declare no conflict of interest.
Supporting information
Data S1: Supporting Information.
Data S2: Supporting Information.
Movie S1: The essential dynamics’ first principal component of Rac1wt‐GDP extracted from PCA.
Movie S2: The essential dynamics' first principal component of Rac1P29L‐GDP extracted from PCA.
Movie S3: The essential dynamics’ first principal component of Rac1P29Q‐GDP extracted from PCA.
Movie S4: The essential dynamics' first principal component of Rac1P29S‐GDP extracted from PCA.
ACKNOWLEDGMENTS
Alessandra Magistrato thanks the Italian Association for Cancer research (AIRC) for financial support (AIRC IG 24514). Angela Parise thanks AIRC for the three‐years fellowship Love Design 2021. The authors thank CINECA, the Italian super‐computing center, for computational resources via the “IsCa4_sGTP‐I” project.
Parise A, Magistrato A. Assessing the mechanism of fast‐cycling cancer‐associated mutations of Rac1 small Rho GTPase . Protein Science. 2024;33(4):e4939. 10.1002/pro.4939
Review Editor: Lynn Kamerlin
REFERENCES
- Abraham MJ, Murtola T, Schulz R, Páll S, Smith JC, Hess B, et al. GROMACS: high performance molecular simulations through multi‐level parallelism from laptops to supercomputers. SoftwareX. 2015;1–2:19–25. [Google Scholar]
- Al‐Koussa H, Atat OE, Jaafar L, Tashjian H, El‐Sibai M. The role of Rho GTPases in motility and invasion of glioblastoma cells. Anal Cell Pathol. 2020;45:1–99274016. [DOI] [PMC free article] [PubMed] [Google Scholar]
- Andersen HC. Rattle: a “velocity” version of the shake algorithm for molecular dynamics calculations. J Comput Phys. 1983;52:24–34. [Google Scholar]
- Bakan A, Meireles LM, Bahar I. ProDy: Protein dynamics inferred from theory and experiments. Bioinformatics. 2011;27(11):1575–1577. Available from: https://academic.oup.com/bioinformatics/article/27/11/1575/217006 [DOI] [PMC free article] [PubMed] [Google Scholar]
- Barbosa GD, Liu X, O'Harra KE, Bara JE, Turner CH. Charge scaling parameter evaluation for multivalent ionic liquids with fixed point charge force fields. J Ionic Liq. 2022;2:100020. [Google Scholar]
- Bayly CI, Cieplak P, Cornell W, Kollman PA. A well‐behaved electrostatic potential based method using charge restraints for deriving atomic charges: the RESP model. 12.
- Berendsen HJC, Postma JPM, van Gunsteren WF, DiNola A, Haak JR. Molecular dynamics with coupling to an external bath. J Chem Phys. 1998;81:3684–3690. [Google Scholar]
- Carlos Amor J, Harrison DH, Kahn RA, Ringe D. Structure of the human ADP‐ribosylation factor 1 complexed with GDP. Nature. 1994;372:704–708. [DOI] [PubMed] [Google Scholar]
- Casalino L, Palermo G, Abdurakhmonova N, Rothlisberger U, Magistrato A. Development of site‐specific Mg2+–RNA force field parameters: a dream or reality? Guidelines from combined molecular dynamics and quantum mechanics simulations. J Chem Theory Comput. 2017;13:340–352. [DOI] [PubMed] [Google Scholar]
- Casalino L, Palermo G, Spinello A, Rothlisberger U, Magistrato A. All‐atom simulations disentangle the functional dynamics underlying gene maturation in the intron lariat spliceosome. Proc Natl Acad Sci. 2018;115:6584–6589. [DOI] [PMC free article] [PubMed] [Google Scholar]
- Case ADA, Aktulga HM, Belfon K, Ben‐Shalom IY, Berryman JT, Brozell SR, et al. Amber 2023. San Francisco: University of California; 2023. [Google Scholar]
- Case D, Ben‐Shalom I, Brozell S, Cerutti D, Cheatham T III, Cruzeiro V, et al. AMBER 18. San Francisco: University of California; 2018. [Google Scholar]
- Chang MT, Asthana S, Gao SP, Lee BH, Chapman JS, Kandoth C, et al. Identifying recurrent mutations in cancer reveals widespread lineage diversity and mutational specificity. Nat Biotechnol. 2016;34:155–163. [DOI] [PMC free article] [PubMed] [Google Scholar]
- Crean RM, Slusky JSG, Kasson PM, Kamerlin SCL. KIF—Key Interactions Finder: a program to identify the key molecular interactions that regulate protein conformational changes. J Chem Phys. 2023;158:144114. [DOI] [PubMed] [Google Scholar]
- Crosas‐Molist E, Samain R, Kohlhammer L, Orgaz JL, George SL, Maiques O, et al. Rho GTPase signaling in cancer progression and dissemination. Physiol Rev. 2022;102:455–510. [DOI] [PubMed] [Google Scholar]
- Darden T, York D, Pedersen L. Particle mesh Ewald: an N ·log(N) method for Ewald sums in large systems. J Chem Phys. 1993;98:10089–10092. [Google Scholar]
- Davis MJ, Ha BH, Holman EC, Halaban R, Schlessinger J, Boggon TJ. RAC1P29S is a spontaneously activating cancer‐associated GTPase. Proc Natl Acad Sci U S A. 2013;110:912–917. [DOI] [PMC free article] [PubMed] [Google Scholar]
- De P, Aske JC, Dey N. RAC1 takes the lead in solid tumors. Cell. 2019;8:382. [DOI] [PMC free article] [PubMed] [Google Scholar]
- DerMardirossian C, Bokoch GM. GDIs: central regulatory molecules in Rho GTPase activation. Trends Cell Biol. 2005;15:356–363. [DOI] [PubMed] [Google Scholar]
- Dharmaiah S, Tran TH, Messing S, Agamasu C, Gillette WK, Yan W, et al. Structures of N‐terminally processed KRAS provide insight into the role of N‐acetylation. Sci Rep. 2019;9:10512. [DOI] [PMC free article] [PubMed] [Google Scholar]
- Duan L, Liu X, Zhang JZH. Interaction entropy: a new paradigm for highly efficient and reliable computation of protein–ligand binding free energy. J Am Chem Soc. 2016;138:5722–5728. [DOI] [PubMed] [Google Scholar]
- Evans DJ, Holian BL. The Nose–Hoover thermostat. J Chem Phys. 1985;83:4069–4074. [Google Scholar]
- FDA grants accelerated approval to sotorasib for KRAS G12C mutated NSCLC. FDA; 2021. https://www.fda.gov/drugs/resources-information-approved-drugs/fda-grants-accelerated-approval-sotorasib-kras-g12c-mutated-nsclc [Google Scholar]
- Ferrandez Y, Zhang W, Peurois F, Akendengué L, Blangy A, Zeghouf M, et al. Allosteric inhibition of the guanine nucleotide exchange factor DOCK5 by a small molecule. Sci Rep. 2017;7:14409. [DOI] [PMC free article] [PubMed] [Google Scholar]
- Freeman JL, Abo A, Lambeth JD. Rac “insert region” is a novel effector region that is implicated in the activation of NADPH oxidase, but not PAK65*. J Biol Chem. 1996;271:19794–19801. [DOI] [PubMed] [Google Scholar]
- Gaussian 16, Revision C.01 , Frisch MJ, Trucks GW, Schlegel HB, Scuseria GE, Robb MA, et al. Gaussian, Inc., Wallingford, CT, 2016. [Google Scholar]
- Grosshans BL, Ortiz D, Novick P. Rabs and their effectors: achieving specificity in membrane traffic. Proc Natl Acad Sci U S A. 2006;103:11821–11827. [DOI] [PMC free article] [PubMed] [Google Scholar]
- Hakoshima T, Shimizu T, Maesaki R. Structural basis of the rho GTPase signaling. J Biochem. 2003;134:327–331. [DOI] [PubMed] [Google Scholar]
- Hirshberg M, Stockley RW, Dodson G, Webb MR. The crystal structure of human rac1, a member of the rho‐family complexed with a GTP analogue. Nat Struct Biol. 1997;4:147–152. [DOI] [PubMed] [Google Scholar]
- Hodis E, Watson IR, Kryukov GV, Arold ST, Imielinski M, Theurillat J‐P, et al. A landscape of driver mutations in melanoma. Cell. 2012;150:251–263. [DOI] [PMC free article] [PubMed] [Google Scholar]
- Humphrey W, Dalke A, Schulten K. VMD: visual molecular dynamics. J Mol Graph. 1996;14(33–38):27–28. [DOI] [PubMed] [Google Scholar]
- Hwang SL, Hong YR, Sy WD, Lieu AS, Lin CL, Lee KS, et al. Rac1 gene mutations in human brain tumours. Eur J Surg Oncol. 2004;30:68–72. [DOI] [PubMed] [Google Scholar]
- Ingólfsson HI, Neale C, Carpenter TS, Shrestha R, López CA, Tran TH, et al. Machine learning–driven multiscale modeling reveals lipid‐dependent dynamics of RAS signaling proteins. Proc Natl Acad Sci. 2022;119:e2113297119. [DOI] [PMC free article] [PubMed] [Google Scholar]
- Ishizuka R, Matubayasi N. Self‐consistent determination of atomic charges of ionic liquid through a combination of molecular dynamics simulation and density functional theory. J Chem Theory Comput. 2016;12:804–811. [DOI] [PubMed] [Google Scholar]
- Kang N, Liu J, Zhao Y. Dissociation mechanism of GDP from Cdc42 via DOCK9 revealed by molecular dynamics simulations. Proteins. 2019;87:433–442. [DOI] [PubMed] [Google Scholar]
- Kaushik AC, Wang Y‐J, Wang X, Wei D‐Q. Irinotecan and vandetanib create synergies for treatment of pancreatic cancer patients with concomitant TP53 and KRAS mutations. Brief Bioinform. 2021;22:bbaa149. [DOI] [PubMed] [Google Scholar]
- Kawazu M, Ueno T, Kontani K, Ogita Y, Ando M, Fukumura K, et al. Transforming mutations of RAC guanosine triphosphatases in human cancers. Proc Natl Acad Sci. 2013;110:3029–3034. [DOI] [PMC free article] [PubMed] [Google Scholar]
- Kokh DB, Kaufmann T, Kister B, Wade RC. Machine learning analysis of τRAMD trajectories to decipher molecular determinants of drug‐target residence times. Front Mol Biosci. 2019;6:36. 10.3389/fmolb.2019.00036 [DOI] [PMC free article] [PubMed] [Google Scholar]
- Kokh DB, Wade RC. G protein‐coupled receptor–ligand dissociation rates and mechanisms from τRAMD simulations. J Chem Theory Comput. 2021;17:6610–6623. [DOI] [PubMed] [Google Scholar]
- Krauthammer M, Kong Y, Ha BH, Evans P, Bacchiocchi A, McCusker JP, et al. Exome sequencing identifies recurrent somatic RAC1 mutations in melanoma. Nat Genet. 2012;44:1006–1014. [DOI] [PMC free article] [PubMed] [Google Scholar]
- Leng R, Liao G, Wang H, Kuang J, Tang L. Rac1 expression in epithelial ovarian cancer: effect on cell EMT and clinical outcome. Med Oncol. 2015;32:28. [DOI] [PubMed] [Google Scholar]
- Li P, Song LF, Merz KM Jr. Parameterization of highly charged metal ions using the 12‐6‐4 LJ‐type nonbonded model in explicit water. J Phys Chem B. 2015;119:883–895. [DOI] [PMC free article] [PubMed] [Google Scholar]
- Lin Y, Fu F, Lv J, Wang M, Li Y, Zhang J, et al. Identification of potential key genes for HER‐2 positive breast cancer based on bioinformatics analysis. Medicine. 2020;99:e18445. [DOI] [PMC free article] [PubMed] [Google Scholar]
- Lionarons DA, Hancock DC, Rana S, East P, Moore C, Murillo MM, et al. RAC1P29S induces a mesenchymal phenotypic switch via serum response factor to promote melanoma development and therapy resistance. Cancer Cell. 2019;36:68–83.e9. [DOI] [PMC free article] [PubMed] [Google Scholar]
- Liu J, Li D, Liu X. A simple and accurate algorithm for path integral molecular dynamics with the Langevin thermostat. J Chem Phys. 2016;145:024103. [DOI] [PubMed] [Google Scholar]
- López‐Cortés A, Paz‐Y‐Miño C, Guerrero S, Cabrera‐Andrade A, Barigye SJ, Munteanu CR, et al. OncoOmics approaches to reveal essential genes in breast cancer: a panoramic view from pathogenesis to precision medicine. Sci Rep. 2020;10:5285. [DOI] [PMC free article] [PubMed] [Google Scholar]
- Lu S, Jang H, Zhang J, Nussinov R. Inhibitors of Ras‐SOS interactions. ChemMedChem. 2016;11:814–821. [DOI] [PubMed] [Google Scholar]
- Maestro . Anon Schrödinger Release 2023–2. New York, NY: Maestro, Schrödinger, LLC; 2023. [Google Scholar]
- Maier JA, Martinez C, Kasavajhala K, Wickstrom L, Hauser KE, Simmerling C. ff14SB: Improving the Accuracy of Protein Side Chain and Backbone Parameters from ff99SB. J Chem Theory Comput. 2015;11:3696–3713. 10.1021/acs.jctc.5b00255 [DOI] [PMC free article] [PubMed] [Google Scholar]
- Mann D, Güldenhaupt J, Schartner J, Gerwert K, Kötting C. The protonation states of GTP and GppNHp in Ras proteins. J Biol Chem. 2018;293:3871–3879. [DOI] [PMC free article] [PubMed] [Google Scholar]
- Matsumoto S, Miyano N, Baba S, Liao J, Kawamura T, Tsuda C, et al. Molecular mechanism for conformational dynamics of Ras·GTP elucidated from in‐situ structural transition in crystal. Sci Rep. 2016;6:25931. [DOI] [PMC free article] [PubMed] [Google Scholar]
- Miller BRI, TDJr MG, Swails JM, Homeyer N, Gohlke H, Roitberg AE. MMPBSA.py: an efficient program for end‐state free energy calculations. J Chem Theory Comput. 2012;8:3314–3321. [DOI] [PubMed] [Google Scholar]
- Mishra AK, Lambright DG. Small GTPases and their GAPs. Biopolymers. 2016;105:431–448. [DOI] [PMC free article] [PubMed] [Google Scholar]
- Nassar N, Horn G, Herrmann C, Scherer A, McCormick F, Wittinghofer A. The 2.2 A crystal structure of the Ras‐binding domain of the serine/threonine kinase c‐Raf1 in complex with Rap1A and a GTP analogue. Nature. 1995;375:554–560. [DOI] [PubMed] [Google Scholar]
- Nunes‐Alves A, Kokh DB, Wade RC. Ligand unbinding mechanisms and kinetics for T4 lysozyme mutants from τRAMD simulations. Curr Res Struct Biol. 2021;3:106–111. [DOI] [PMC free article] [PubMed] [Google Scholar]
- Ogunlana AT, Kehinde Oyedele A‐Q, Boyenle ID, Ayoola SO, Ajibare AC, Adeyemi AO, et al. Computer‐aided drug design of some KRAS G12C inhibitors: targeting the covalent and allosteric binding site for cancer therapy. Inform Med Unlocked. 2022;32:101032. [Google Scholar]
- Parise A, Ciardullo G, Prejanò M, de la Lande A, Marino T. On the recognition of natural substrate CTP and endogenous inhibitor ddhCTP of SARS‐CoV‐2 RNA‐dependent RNA polymerase: a molecular dynamics study. J Chem Inf Model. 2022;62:4916–4927. [DOI] [PMC free article] [PubMed] [Google Scholar]
- Parrinello M, Rahman A. Polymorphic transitions in single crystals: a new molecular dynamics method. J Appl Phys. 1981;52:7182–7190. [Google Scholar]
- Poulin EJ, Bera AK, Lu J, Lin Y‐J, Strasser SD, Paulo JA, et al. Tissue‐specific oncogenic activity of KRASA146T. Cancer Discov. 2019;9:738–755. [DOI] [PMC free article] [PubMed] [Google Scholar]
- Rajendran V, Gopalakrishnan C, Purohit R. Impact of point mutation P29S in RAC1 on tumorigenesis. Tumor Biol. 2016;37:15293–15304. [DOI] [PubMed] [Google Scholar]
- Ridley AJ, Hall A. The small GTP‐binding protein rho regulates the assembly of focal adhesions and actin stress fibers in response to growth factors. Cell. 1992;70:389–399. [DOI] [PubMed] [Google Scholar]
- Rozza R, Janoš P, Magistrato A. Monovalent ionic atmosphere modulates the selection of suboptimal RNA sequences by splicing factors' RNA recognition motifs. J Chem Inf Model. 2023;63:3086–3093. [DOI] [PubMed] [Google Scholar]
- Saltalamacchia A, Casalino L, Borišek J, Batista VS, Rivalta I, Magistrato A. Decrypting the information exchange pathways across the spliceosome machinery. J Am Chem Soc. 2020;142:8403–8411. [DOI] [PMC free article] [PubMed] [Google Scholar]
- Sayyed‐Ahmad A, Prakash P, Gorfe AA. Distinct dynamics and interaction patterns in H‐ and K‐Ras oncogenic P‐loop mutants. Proteins. 2017;85:1618–1632. [DOI] [PMC free article] [PubMed] [Google Scholar]
- Schaefer A, Reinhard NR, Hordijk PL. Toward understanding RhoGTPase specificity: structure, function and local activation. Small GTPases. 2014;5:6. [DOI] [PMC free article] [PubMed] [Google Scholar]
- Scheffzek K, Klebe C, Fritz‐Wolf K, Kabsch W, Wittinghofer A. Crystal structure of the nuclear Ras‐related protein Ran in its GDP‐bound form. Nature. 1995;374:378–381. [DOI] [PubMed] [Google Scholar]
- Schwartz MA, Shattil SJ. Signaling networks linking integrins and rho family GTPases. Trends Biochem Sci. 2000;25:388–391. [DOI] [PubMed] [Google Scholar]
- Senyuz S, Jang H, Nussinov R, Keskin O, Gursoy A. Mechanistic differences of activation of Rac1P29S and Rac1A159V. J Phys Chem B. 2021;125:3790–3802. [DOI] [PMC free article] [PubMed] [Google Scholar]
- Shang X, Marchioni F, Sipes N, Evelyn CR, Jerabek‐Willemsen M, Duhr S, et al. Rational design of small molecule inhibitors targeting RhoA subfamily Rho GTPases. Chem Biol. 2012;19:699–710. [DOI] [PMC free article] [PubMed] [Google Scholar]
- Song S, Cong W, Zhou S, Shi Y, Dai W, Zhang H, et al. Small GTPases: structure, biological function and its interaction with nanoparticles. Asian J Pharm Sci. 2019;14:30–39. [DOI] [PMC free article] [PubMed] [Google Scholar]
- Spinello A, Janos P, Rozza R, Magistrato A. Cancer‐related mutations Alter RNA‐driven functional cross‐talk underlying premature‐messenger RNA recognition by splicing factor SF3b. J Phys Chem Lett. 2023;14:6263–6269. [DOI] [PubMed] [Google Scholar]
- Strassheim D, Gerasimovskaya E, Irwin D, Dempsey EC, Stenmark K, Karoor V. RhoGTPase in vascular disease. Cells. 2019;8:551. [DOI] [PMC free article] [PubMed] [Google Scholar]
- Sun Z, Zhang H, Zhang Y, Liao L, Zhou W, Zhang F, et al. Covalent inhibitors allosterically block the activation of Rho family proteins and suppress cancer cell invasion. Adv Sci. 2020;7:2000098. [DOI] [PMC free article] [PubMed] [Google Scholar]
- Thomas E, Cancelas J, Zheng Y, Williams D. Rac GTPases as key regulators of p210‐BCR‐ABL‐dependent leukemogenesis. Leukemia. 2008;22:898–904. [DOI] [PMC free article] [PubMed] [Google Scholar]
- Toma‐Fukai S, Shimizu T. Structural insights into the regulation mechanism of small GTPases by GEFs. Molecules. 2019;24:3308. [DOI] [PMC free article] [PubMed] [Google Scholar]
- Tu G, Liu Q, Qiu Y, Leung EL‐H, Yao X. In silico study of the acquired resistance caused by the secondary mutations of KRAS G12C protein using long time molecular dynamics simulation and Markov state model analysis. Int J Mol Sci. 2022;23:13845. [DOI] [PMC free article] [PubMed] [Google Scholar]
- Uribe‐Alvarez C, Guerrero‐Rodríguez SL, Rhodes J, Cannon A, Chernoff J, Araiza‐Olivera D. Targeting effector pathways in RAC1P29S‐driven malignant melanoma. Small GTPases. 2021;12:273–281. [DOI] [PMC free article] [PubMed] [Google Scholar]
- Vatansever S, Erman B, Gümüş ZH. Oncogenic G12D mutation alters local conformations and dynamics of K‐Ras. Sci Rep. 2019;9:11730. [DOI] [PMC free article] [PubMed] [Google Scholar]
- Venugopal SV, Caggia S, Gambrell‐Sanders D, Khan SA. Differential roles and activation of mammalian target of rapamycin complexes 1 and 2 during cell migration in prostate cancer cells. Prostate. 2020;80:412–423. [DOI] [PMC free article] [PubMed] [Google Scholar]
- Wang C, Nguyen PH, Pham K, Huynh D, Le T‐BN, Wang H, et al. Calculating protein‐ligand binding affinities with MMPBSA: method and error analysis. J Comput Chem. 2016;37:2436–2446. [DOI] [PMC free article] [PubMed] [Google Scholar]
- Wennerberg K, Rossman KL, Der CJ. The Ras superfamily at a glance. J Cell Sci. 2005;118:843–846. [DOI] [PubMed] [Google Scholar]
- Wu Y, Zhao Y, Huan L, Zhao J, Zhou Y, Xu L, et al. An LTR retrotransposon‐derived long noncoding RNA lncMER52A promotes hepatocellular carcinoma progression by binding p120‐catenin. Cancer Res. 2020;80:976–987. [DOI] [PubMed] [Google Scholar]
- Xia L, Lin J, Su J, Oyang L, Wang H, Tan S, et al. Diallyl disulfide inhibits colon cancer metastasis by suppressing Rac1‐mediated epithelial‐mesenchymal transition. Onco Targets Ther. 2019;12:5713–5728. [DOI] [PMC free article] [PubMed] [Google Scholar]
- Yang J, Zhang Z, Roe SM, Marshall CJ, Barford D. Activation of Rho GTPases by DOCK exchange factors is mediated by a nucleotide sensor. Science. 2009;325:1398–1402. [DOI] [PubMed] [Google Scholar]
- Zhang B, Zhang Y, Wang Z, Zheng Y. The role of Mg2+ cofactor in the guanine nucleotide exchange and GTP hydrolysis reactions of Rho family GTP‐binding proteins. J Biol Chem. 2000;275:25299–25307. [DOI] [PubMed] [Google Scholar]
- Zolghadr AR, Ghatee MH, Moosavi F. The effect of various quantum mechanically derived partial atomic charges on the bulk properties of chloride‐based ionic liquids. Chem Phys. 2016;475:23–31. [Google Scholar]
Associated Data
This section collects any data citations, data availability statements, or supplementary materials included in this article.
Supplementary Materials
Data S1: Supporting Information.
Data S2: Supporting Information.
Movie S1: The essential dynamics’ first principal component of Rac1wt‐GDP extracted from PCA.
Movie S2: The essential dynamics' first principal component of Rac1P29L‐GDP extracted from PCA.
Movie S3: The essential dynamics’ first principal component of Rac1P29Q‐GDP extracted from PCA.
Movie S4: The essential dynamics' first principal component of Rac1P29S‐GDP extracted from PCA.