

Abstract
Background:
Geenius HIV 1/2 Supplemental Assay (Geenius; Bio-Rad Laboratories) is the only Food and Drug Administration–approved HIV-1/HIV-2 antibody differentiation test for the second step in the HIV laboratory testing algorithm. We characterized the occurrence of true HIV-1 and HIV-2 infections as well as false results in 6 US clinical laboratories using Geenius.
Methods:
We examined routine HIV testing outcome data from the time the laboratories began using the algorithm with Geenius until September 30, 2017. We calculated the positive predictive value for Geenius HIV-1 and HIV-2 reactivity separately.
Results:
Of 5,046,684 specimens tested, 41,791 had reactive antigen/antibody test results. Most specimens with reactive antigen/antibody results were HIV-1 antibody–positive established infections (n = 32,421), 1,865 of which also had indeterminate HIV-2 bands present. Ninety-three specimens were HIV-2 antibody positive or untypable for HIV-1/HIV-2 antibody. Acute HIV-1 infections were found in 528 specimens; 881 specimens lacked the nucleic acid test to determine the possibility of acute HIV-1 infection. False-positive antigen/antibody test results were present in 7505 specimens. Few specimens (n = 363) had false-positive antigen/antibody results with indeterminate Geenius and negative HIV-1 nucleic acid test results. The positive predictive values of Geenius reactivity were 99.4% for HIV-1 and 4.3% for HIV-2.
Conclusions:
Routine testing using the laboratory testing algorithm with Geenius resulted in most specimens resolving as HIV negative or HIV-1 positive. The occurrence of indeterminate HIV-2 bands with a Geenius final assay interpretation of HIV-1 positive was more common than true HIV-2 infections. Reporting indeterminate HIV-2 results in this situation may cause confusion with interpreting HIV infection status.
Geenius HIV 1/2 Supplemental Assay (Geenius; Bio-Rad Laboratories, Redmond, WA) is the only US Food and Drug Administration (FDA)–approved test available for use in the second step of the laboratory testing algorithm recommended by the Centers for Disease Control and Prevention (CDC) and the Association of Public Health Laboratories.1 It is used after a reactive antigen/antibody screening test result to differentiate HIV-1 from HIV-2 antibody reactivity. Most evaluations of laboratory algorithm testing outcomes occurred with its predecessor, the Multispot HIV-1/HIV-2 Rapid Test (Multispot; Bio-Rad Laboratories), which is no longer manufactured. Relative to Multispot, Geenius has 3 additional test results: HIV-2 positive with HIV-1 cross-reactivity, HIV indeterminate, and HIV-2 indeterminate.2,3
Quantifying the occurrence of true HIV-2 reactivity relative to false reactivity will help to determine the value of differentiating HIV-1 from HIV-2 at the second step in the algorithm with the available differentiation test. A recent evaluation of national surveillance data indicates that even with the widespread implementation of differentiation testing in the algorithm, true HIV-2 infections are exceedingly rare in the United States.4
There is not a FDA–approved diagnostic HIV-2 test to corroborate results that are HIV-2 positive or HIV-2 positive with HIV-1 cross-reactivity using Geenius. Therefore, persons with these results are referred for medical care and treatment, and are presumed to have true HIV-2 infections. Specimens with HIV-positive but untypable Geenius results are positive for HIV-1 and HIV-2 antibodies and are also referred for care, although they may receive additional testing to rule out dual infection. Geenius results for which HIV-2 is indeterminate may be less likely to indicate actual HIV-2 infection, particularly when only the gp140 band is present.5 In fact, the algorithm indicates that specimens with results that are Geenius HIV indeterminate or repeatedly HIV-2 indeterminate should be tested first with an HIV-1 nucleic acid test (NAT) to rule out acute HIV-1 infection.2 If the HIV-1 NAT is not detectable, the specimens should be tested with a different HIV-2 supplemental test, if one is available. A reference laboratory conducting HIV-2 NAT testing as part of the laboratory algorithm for 2 years for more than 30 public health laboratories did not identify any detectable HIV-2 RNA results.6 Another result that does not indicate true HIV-2 reactivity is the final Geenius assay interpretation of HIV-1 positive in which the HIV-2 result is indeterminate. This likely occurs because of cross-reactivity of HIV-1 antibodies on HIV-2 antigens and does not require confirmation of HIV-2.7
We examined routine HIV testing outcomes at 6 US clinical laboratories using Geenius as the differentiation test in the laboratory algorithm to characterize the occurrence of true HIV-1 and HIV-2 infections and false results, and to describe laboratory test result reporting challenges.
MATERIALS AND METHODS
Routine HIV testing data were collected at 6 clinical laboratories from the time they began using the recommended laboratory algorithm with Geenius through September 30, 2017, except for one laboratory that collected data until August 30, 2017. The laboratories included were ARUP Laboratories, Children’s Hospital of Philadelphia, Grady Health System, Johns Hopkins Hospital, Laboratory Corporation of America, and Mayo Clinic Laboratories. Data from specimens screened at another laboratory and then tested at one of these laboratories were not included. Testing data were collected before the cutoff intensity of the Geenius gp140 HIV-2 envelope band was increased by the assay manufacturer.7 We examined final algorithm results by laboratory and in total across all of the laboratories. Results were anonymized for the laboratories.
Final algorithm results were categorized as negative antigen/antibody screening test results, or if the antigen/antibody screening test was reactive, as (1) HIV-1–positive established infections, including a subset with that were Geenius HIV-1 positive and HIV-2 indeterminate; (2) acute HIV-1 infections; (3) Geenius negative or indeterminate without an HIV-1 NAT; (4) HIV-2 positive; (5) HIV positive, untypable; (6) antigen/antibody test false positive; or (7) false antigen/antibody test results with indeterminate Geenius and negative HIV-1 NAT results. Test results included in each category are listed in Table 1. We describe Geenius results for the following categories: (1) acute HIV-1 infection; (2) HIV-2 positive; (3) HIV positive, untypable; and (4) false antigen/antibody positive with indeterminate Geenius and negative HIV-1 NAT results. For the HIV-positive, untypable category, we describe the results of supplemental testing, when available.
TABLE 1.
Final Laboratory Testing Algorithm Results in 6 US Clinical Laboratories From the Date They Began Using the Algorithm With Geenius Until September 2017
| Laboratory 1 | Laboratory 2 | Laboratory 3 | Laboratory 4 | Laboratory 5 | Laboratory 6 | Overall | ||||||||
|---|---|---|---|---|---|---|---|---|---|---|---|---|---|---|
| n | % | n | % | n | % | n | % | n | % | n | % | n | % | |
| Total specimens tested | 28,968 | 2507 | 43,533 | 19,294 | 4,909,380 | 43,002 | 5,046,684 | |||||||
| Negative Ag/Ab screening test result* | 28,507 | 98.41 | 2470 | 98.52 | 42,593 | 97.84 | 18,300† | 94.85 | 4,870,351 | 99.21 | 42,672 | 99.23 | 5,004,893 | 99.17 |
| Repeatedly reactive Ag/Ab test result | 461 | 1.59 | 37 | 1.48 | 940 | 2.16 | 994 | 5.15 | 39,029 | 0.80 | 330 | 0.77 | 41,791 | 0.83 |
| HIV-1-positive established infection‡ | 421 | 1.45 | 12 | 0.48 | 710 | 1.63 | 845 | 4.38 | 30,150 | 0.61 | 283 | 0.66 | 32,421 | 0.64 |
| Subset HIV-1 positive; HIV-2 indeterminate band§ | 22 | 0.08 | 0 | 0 | 12 | 0.03 | 29 | 0.15 | 1778 | 0.04 | 24 | 0.06 | 1865 | 0.04 |
| Acute HIV-1 infection¶ | 3 | 0.01 | 1 | 0.04 | 0 | 0 | 27 | 0.14 | 487 | 0.01 | 10 | 0.02 | 528 | 0.01 |
| Geenius negative/indeterminate; no HIV-1 NAT|| | 0 | 0 | 4 | 0.16 | 220 | 0.51 | 73 | 0.38 | 584 | 0.01 | 0 | 0 | 881 | 0.02 |
| HIV-2 positive** | 1 | 0.003 | 0 | 0 | 0 | 0 | 0 | 0 | 27 | 0.001 | 2 | 0.01 | 30 | 0.001 |
| HIV positive, untypable†† | 0 | 0 | 0 | 0 | 3 | 0.01 | 2 | 0.01 | 57 | 0.001 | 1 | 0.002 | 63 | 0.001 |
| Ag/Ab test false positive‡‡ | 29 | 0.10 | 14§§ | 0.56 | 4 | 0.01 | 44 | 0.23 | 7380 | 0.15 | 34 | 0.08 | 7505 | 0.15 |
| False Ag/Ab positive, Geenius indeterminate¶¶ | 7 | 0.02 | 6|||| | 0.24 | 3 | 0.01 | 3 | 0.02 | 344 | 0.007 | 0 | 0 | 363 | 0.01 |
Discrepancies attributed to rounding.
Ag/Ab-negative or Ag/Ab-reactive, but not repeatedly reactive results.
Estimated number of negative Ag/Ab screening test results.
Repeatedly reactive Ag/Ab test and Geenius HIV-1 positive.
Subset of HIV-1–positive established infections with a Geenius HIV-2 indeterminate band.
Repeatedly reactive Ag/Ab test, Geenius negative or Geenius indeterminate (i.e., HIV indeterminate, HIV-1 indeterminate, or HIV-2 indeterminate), and HIV-1 NAT positive.
Repeatedly reactive Ag/Ab test, Geenius-negative or Geenius-indeterminate (i.e., HIV indeterminate, HIV-1 indeterminate, or HIV-2 indeterminate), and HIV-1 NATwas not conducted.
Repeatedly reactive Ag/Ab test and Geenius HIV 2 positive or HIV 2 positive with HIV-1 cross-reactivity.
Repeatedly reactive Ag/Ab test and Geenius HIV positive but untypable. Antibodies to HIV-1 and HIV-2 were confirmed in the sample.
Repeatedly reactive Ag/Ab test and Geenius HIVAb negative and HIV-1 NAT negative.
Eleven Ag/Ab false positives in children younger than 18 months.
Repeatedly reactive Ag/Ab test, Geenius indeterminate (i.e., HIV indeterminate, HIV-1 indeterminate, or repeatedly HIV-2 indeterminate), and HIV-1 NAT negative.
Six Ag/Ab false Ag/Ab positives with Geenius-indeterminate results in children younger than 18 months.
Ab indicates antibody; Ag, antigen.
We calculated the positive predictive value (PPV) for Geenius HIV-1 and HIV-2 reactivity separately. We also recalculated the PPV for Geenius HIV-2 reactivity when we removed those classified as HIV-1 infected with an HIV-2 indeterminate band.
We collected information on how laboratories reported HIV-1–positive results with HIV-2 indeterminate bands to providers.
This collection of routine aggregate data was approved as research not involving identifiable human subjects by the National Centers for HIV, Viral Hepatitis, STD, and TB Prevention at the CDC and was approved by participating center institutional review boards as needed according to center policies.
RESULTS
The antigen/antibody tests used for screening were ARCHITECT HIV Ag/Ab Combo (Abbott Laboratories, Abbott Park, IL; n = 4 laboratories) and ADVIA Centaur HIV Ag/Ab Combo (CHIV) assay (Siemens, Tarrytown, NY; n = 2 laboratories). One of the laboratories that switched to the Siemens assay was initially using the GS HIV Combo Ag/Ab EIA (Bio-Rad Laboratories) during the evaluation period. Three laboratories used the APTIMA HIV-1 RNA Qualitative Assay (APTIMA; Hologic, Inc., San Diego, CA) as their HIV-1 NAT. One used the Abbott RealTime HIV-1 assay (Abbott Molecular, Inc., Des Plaines, IL). One used Cobas AmpliPrep/Cobas TaqMan HIV-1 Test, version 2.0, and another used Cobas HIV-1 assay for the 6800/8800 Systems (Roche Molecular Systems, Branchburg, NJ). Validation of quantitative HIV-1 NAT for this off-label use was the responsibility of individual laboratories. Quantitative results were reported as part of the overall algorithm result from these laboratories.
Slightly more than 5 million specimens were tested for HIV in total (Table 1); 99.17% (5,004,893/5,046,684) had negative antigen/antibody test results. Reactive antigen/antibody test results were observed in 0.83% (41,791/5,046,684) of the total tested. Most of those with reactive antigen/antibody test results were HIV-1 antibody–positive established infections (n = 32,421), 1,865 of which had indeterminate HIV-2 bands present. Among all specimens tested, acute HIV-1 infections were found in 0.01% (528/5,046,684), and 0.02% (881/5,046,684) of all specimens tested lacked the NAT needed to determine the possibility of acute HIV-1 infection. Less than 0.01% (93/5,046,684) of all specimens tested were HIV-2 antibody positive or HIV positive but untypable. False-positive antigen/antibody test results were present in 0.15% (7505/5,046,684) of all specimens tested. A small proportion of specimens tested (0.01%; 363/5,046,684) had false-positive antigen/antibody results with indeterminate Geenius and negative HIV-1 NAT results.
Of the 528 total specimens classified as acute HIV-1 infection, 424 (80.3%) had Geenius results that were HIV negative, 86 (16.3%) were HIV-1 indeterminate, 13 (2.5%) were HIV-2 indeterminate, and 5 (1%) were HIV indeterminate. Of 30 specimens categorized as HIV-2 positive, 20 (66.7%) had results that were HIV-2 positive with HIV-1 cross-reactivity and 10 (33.3%) were HIV-2 positive. Of 63 specimens with HIV-positive but untypable Geenius results, 52 (82.5%) had supplemental test results documented. Of the 52, 47 (90.4%) had detectable HIV-1 NAT results, 2 (3.9%) had undetectable results, and 3 (5.8%) were tested with the INNO-LIA HIV I/II Score test (Research Use Only; Fujirebio Diagnostics, Inc., Malvern, PA), and were also positive for HIV antibodies but untypable based on that test. Of the 363 specimens classified as false antigen/antibody positive with indeterminate Geenius and negative HIV-1 NAT results, 178 (49.0%) were HIV-2 indeterminate, 155 (42.7%) were HIV-1 indeterminate, and 30 (8.3%) were HIV indeterminate.
The PPV of Geenius HIV-1 reactivity was 99.4% (Fig. 1); HIV-1–positive established infections accounted for most of the true HIV-1 reactivity, along with a small number of acute infections and untypable HIV infections. The PPV of Geenius HIV-2 reactivity was 4.3%; true HIV-2 reactivity was either Geenius HIV-2 positive or untypable. HIV-1 infections with Geenius HIV-2 indeterminate reactivity accounted for most of the false HIV-2 reactivity. When we assessed the PPVof Geenius HIV-2 reactivity after removing those with an HIV-2 indeterminate band that were HIV-1 positive, the PPV for Geenius HIV-2 reactivity was 29.2%.
Figure 1.
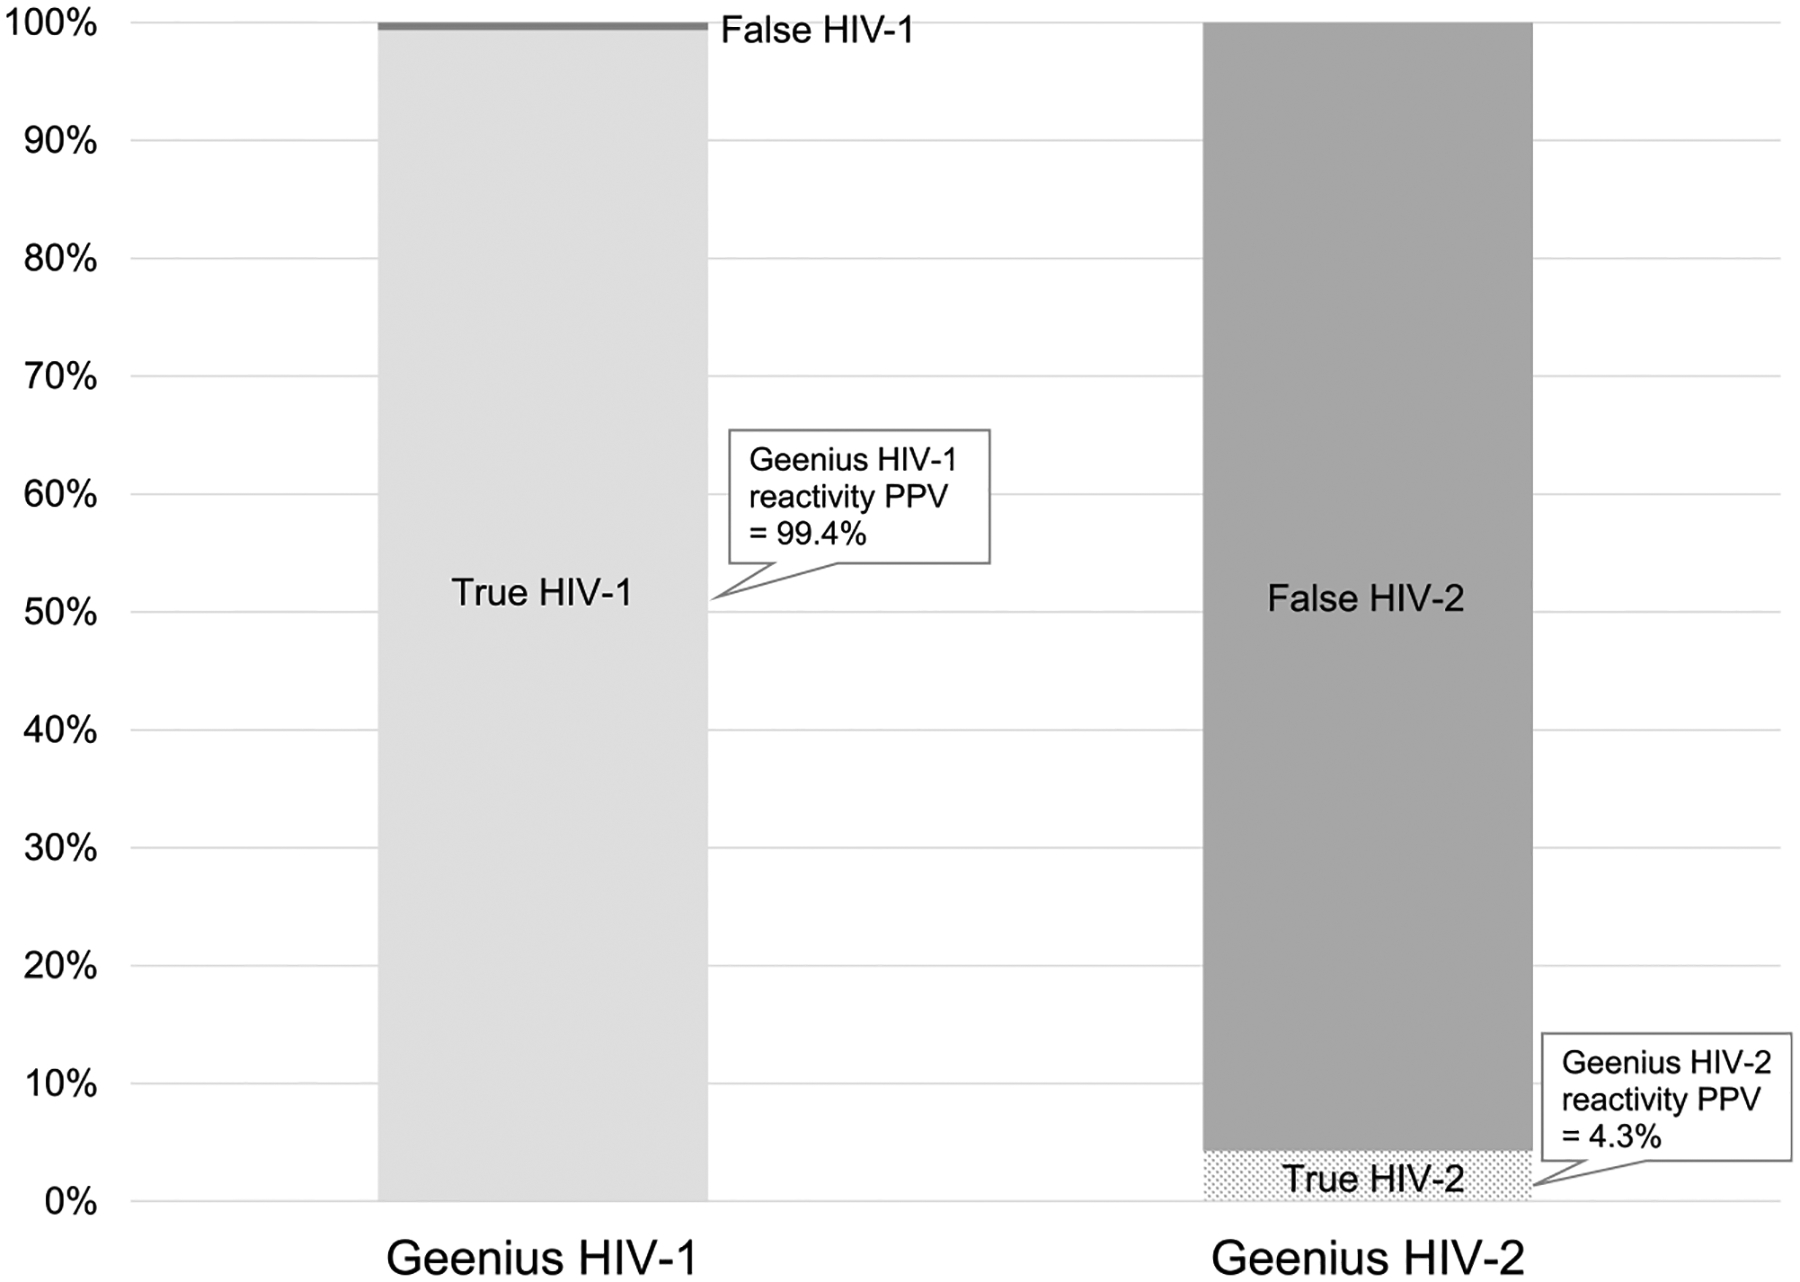
Positive predictive value of Geenius HIV-1 reactivity compared with Geenius HIV-2 reactivity. Positive predictive value of HIV-1 was considered the proportion of Geenius HIV-1 reactivity that was true HIV-1 infection. It was calculated as [(32,421 HIV-1 positive established infections + 91 acute HIV-1 infections with an HIV-1 or HIV indeterminate Geenius + 63 HIV positive, untypable)/(the numerator + 155 false Ag/Ab positive with HIV-1 indeterminate Geenius + 30 false Ag/Ab positive with HIV indeterminate Geenius + 20 HIV-2 positive with HIV-1 cross-reactivity)]. Positive predictive value of HIV-2 was considered the proportion of any Geenius HIV-2 reactivity that was true HIV-2 infection. It was calculated as [(30 HIV-2 positive + 63 HIV positive, untypable)/(numerator + 1865 HIV-1 positive with an HIV-2 indeterminate band + 18 acute HIV-1 infections with HIV-2 or HIV indeterminate Geenius bands + 30 false Ag/Ab positive with HIV indeterminate Geenius + 178 false Ag/Ab positive with HIV-2 indeterminate Geenius)].
Reporting Results to the Provider
Four laboratories reported the Geenius final assay interpretation of HIV-1 positive that also had an HIV-2 indeterminate band as HIV-1 positive. One reported it as HIV-1 positive and HIV-2 indeterminate, and indicated that HIV-1 RNA testing was not needed. Another also reported both results and indicated that further HIV-2 RNA or DNA testing was needed if the person was at risk for HIV-2.
DISCUSSION
In this sample of more than 5 million HIV specimens tested at 6 US clinical laboratories, HIV-1/HIV-2 antibody differentiation testing as part of the CDC/APHL-recommended laboratory algorithm resulted in very few HIV-2 antibody–positive or HIV untypable results (<0.01%). As a result, the probability of any HIV-2 reactivity on the Geenius test identifying true HIV-2 infection was very low and considerably lower than for HIV-1. Several of the specimens with Geenius HIV-positive but untypable results had supplemental testing indicating that HIV-1 was detected, so the number of possible HIV-2 infections identified may be overestimated. The low number of HIV-2–positive results suggests that requiring an HIV-1/HIV-2 differentiation test at the second step in the algorithm may not be justified. Most antigen/antibody tests detect HIV-1 and HIV-2, but do not distinguish between them. If an HIV-1–specific test, such as a NAT, was used as the second step in the algorithm and it did not detect virus, then a test that detects HIV-2 might be considered as a third step.
Differentiating HIV-1 and HIV-2 at the second step in the algorithm seems to complicate the algorithm, in part due to the number of Geenius outcomes. In addition, false-positive antigen/antibody test results coupled with indeterminate Geenius results, though rare, require additional testing to resolve infection status, including HIV-1 and HIV-2 NATs or repeating the algorithm using a follow-up specimen. Most laboratories did not proceed with HIV-2–specific testing. Given the low prevalence of HIV-2 infections in the United States, it is unlikely that these test results would be resolved as true infections. The proportion of all tests yielding false HIV-2 reactivity may decrease with the higher gp140 cutoff implemented by the assay manufacturer in 2018.7 The laboratory with the highest rate of these results suggested that they may be due to maternal antibody, as all false-reactive Geenius results occurred in specimens from children younger than 18 months. That laboratory validated the use of the antigen/antibody and Geenius tests in children younger than 2 years. The ages of persons with false-reactive Geenius results from other laboratories were unknown because demographic data were not collected for this evaluation.
The occurrence of HIV-2 indeterminate bands in specimens with a final Geenius assay interpretation of HIV-1 positive was more common than true HIV-2 infections. If HIV-1 and HIV-2 results are reported to the provider without the final assay interpretation, the HIV-2 indeterminate result may lead to unnecessary testing for HIV-2. Providers may also be confused when the final assay interpretation of Geenius is HIV-2 indeterminate. An initial HIV-2 indeterminate typically prompts a repeat test with Geenius, which may result in an HIV-negative result, although some laboratories in this study did not conduct repeat testing.
As expected, most specimens with reactive antigen/antibody screening tests were from persons with established HIV-1 infection. One laboratory had a much higher rate of established infections, almost 4% compared with 0.6% for all laboratories combined. The occurrence of acute HIV-1 infection varied by laboratory from 0.01% to 0.14%, with the laboratory reporting the highest prevalence of established infections also reporting a high rate of acute HIV-1 infections. Acute HIV-1 infections occurred among specimens with HIV-2 indeterminate results as well as HIV indeterminate results, verifying the need for further HIV-1 NAT testing of specimens with those results.3 Almost 900 specimens did not have the NAT needed as part of the algorithm to distinguish false-positive screening test results from results indicating acute HIV-1 infections. The 2 laboratories with the highest rates of missing NAT request a separate plasma sample to conduct this test in addition to serum for serology testing. Alternative specimen procurement strategies may improve the likelihood that a suitable specimen is available to complete the critical NAT step that identifies acute infection. For example, in the current study, one laboratory ran the entire algorithm using plasma and another accepted serum specimens for the entire algorithm, including APTIMA testing.
After the study period, one laboratory changed from APTIMA to a quantitative NAT after validating it for diagnostic use so they did not have to use separate qualitative and quantitative NATs, and a second laboratory planned to do the same.8 Quantitative NATs with a diagnostic claim are needed, like those available for HCV RNA.9 Ideally, both a qualitative and quantitative result would be reported with one run of the test, obviating the need to conduct the test twice to obtain a qualitative and quantitative result.
This analysis is subject to some limitations. Follow-up HIV test results for specimens with ambiguous results were not available because the analysis was conducted by specimen and not person. A single person may be represented in more than one testing outcome, as we were not able to deduplicate by person. However, deduplication would still likely lead to a low rate of HIV-2–positive test results.
Overall, the laboratory testing algorithm has been implemented successfully with Geenius in the clinical laboratories included in this study, and most specimens were resolved correctly by the algorithm as HIV-1 negative or HIV-1 positive. However, few HIV-2 infections were identified as a result of HIV-1 and HIV-2 differentiation occurring at the second step in the algorithm, and most observed HIV-2 reactivity did not indicate true HIV-2 infection. Furthermore, Geenius’ numerous outcomes have the potential to result in provider confusion. Alternative strategies that would expedite identification of infections with HIV-1, while still allowing for HIV-2 diagnosis in the rare cases where it is observed, need to be developed.
Conflict of Interest and Sources of Funding:
A.M. Cárdenas is now employed by Becton, Dickinson and Company. A. Valsamakis is now employed by Roche Molecular Systems, Inc. J.D. Yao received clinical research grants from and serves as a member of scientific advisory boards for Roche Molecular Systems, Inc., and Bio-Rad Laboratories, Inc., whose assays were investigated in this multicenter study. No other authors reported conflicts of interest. The authors declared no sources of funding.
Disclosure of relationship:
The CDC and our content experts wish to disclose that they have no financial interests or other relationships with the manufacturers of commercial products, suppliers of commercial services, or commercial supporters. Trade names are used for identification purposes only. Their use does not imply endorsement by CDC.
Footnotes
Disclaimer: The findings and conclusions in this report are those of the authors and do not necessarily represent the views of the Centers for Disease Control and Prevention (CDC).
REFERENCES
- 1.Centers for Disease Control and Prevention and Association of Public Health Laboratories. 2014. Laboratory testing for the diagnosis of HIV infection: Updated recommendations. Available at: http://stacks.cdc.gov/view/cdc/23447. Accessed August 11, 2019.
- 2.Centers for Disease Control and Prevention. 2018. Quick reference guide: Recommended laboratory HIV testing algorithm for serum or plasma specimens. Available at: https://stacks.cdc.gov/view/cdc/50872. Accessed August 11, 2019.
- 3.Association of Public Health Laboratories. 2019. Suggested reporting language for the HIV laboratory diagnostic testing algorithm. Available at: https://www.aphl.org/aboutAPHL/publications/Documents/ID-2019Jan-HIV-Lab-Test-Suggested-Reporting-Language.pdf. Accessed August 11, 2019.
- 4.Peruski AH,Wesolowski LG, Delaney KP, et al. Trends in HIV-2 diagnoses and use of the HIV-1/HIV-2 differentiation test—National HIV Surveillance System, United States and six dependent areas, 2010–2017. MMWR Morb Mortal Wkly Rep 2020; 69:63–66. [DOI] [PMC free article] [PubMed] [Google Scholar]
- 5.Wesolowski LG, Parker MM, Delaney KP, et al. Highlights from the 2016 HIV Diagnostics Conference: The new landscape of HIV testing in laboratories, public health programs and clinical practice. J Clin Virol 2017; 91:63–68. [DOI] [PMC free article] [PubMed] [Google Scholar]
- 6.Styer LM, Gaynor AM, Parker MM, et al. Three years of shared service HIV nucleic acid testing for public health laboratories: Worthwhile for HIV-1 but not for HIV-2. Sex Transm Dis 2020; 47(Suppl 1):S8–S12. [DOI] [PMC free article] [PubMed] [Google Scholar]
- 7.Bio-Rad Laboratories Inc. Geenius HIV 1/2 supplemental assay: Instructions for use. Ref. 16003787, for use with Geenius Reader APF v1.3 Available at: https://www.mycts.org/Portals/0/Assay_PI/Confirmatory/HIV%201_2Geenius.pdf. Accessed August 11, 2019.
- 8.Winters A, Cardenas AM, Stekler J, et al. 2019. Opportunities created by diagnostic HCV and HIV nucleic acid tests. Available at: https://hivtestingconference.org/wp-content/uploads/2019/04/DP_NAT_FINAL.pdf. Accessed August 12, 2019.
- 9.Association of Public Health Laboratories. 2018. Commercially available HIV, HCV, and STD tests by manufacturer and platform. Available at: https://www.aphl.org/programs/infectious_disease/Documents/HIV-VH-STD-Assays_byManufacturer_Platform.pdf. Accessed August 12, 2019.