Abstract
Multivalent viral epitopes induce rapid, robust and T cell-independent humoral immune responses, but the biochemical basis for such potency remains incompletely understood. We take advantage of a set of liposomes of viral size engineered to display affinity mutants of the model antigen (Ag) hen egg lysozyme. Particulate Ag induces potent ‘all-or-none’ B cell responses that are density dependent but affinity independent. Unlike soluble Ag, particulate Ag induces signal amplification downstream of the B cell receptor by selectively evading LYN-dependent inhibitory pathways and maximally activates NF-κB in a manner that mimics T cell help. Such signaling induces MYC expression and enables even low doses of particulate Ag to trigger robust B cell proliferation in vivo in the absence of adjuvant. We uncover a molecular basis for highly sensitive B cell responses to viral Ag display that is independent of encapsulated nucleic acids and is not merely accounted for by avidity and B cell receptor cross-linking.
Multivalent antigens (Ags), including viral structures, produce robust B cell responses that can engage, but do not require, T cell help, and design of virus-like particle (VLP) vaccines is predicated, in part, on this observation1,2. Particulate human immunodeficiency virus (HIV) immunogens with high valency can recruit precursor B cells expressing rare and low-affinity germline-encoded B cell receptors (BCRs) into both the extrafollicular and germinal center responses3–5. Indeed, highly organized epitope display on the surface of viral particles has long been proposed to function as an immunogenic signal of ‘foreignness’ and can trigger robust T cell-independent antibody responses that may not require Toll-like receptor (TLR) engagement1,2,6–9. This may in turn accelerate and amplify a subsequent T cell-dependent phase in a race against rapidly replicating viral pathogens1.
Although the structural basis for BCR triggering by various forms of Ag continues to be debated10, potent cellular responses to multivalent viral epitopes are assumed to reflect optimal cross-linking of Ag receptors7,11. However, studies of the molecular basis for B cell responses to Ag presented on the surface of cells suggest a qualitatively unique mode of B cell triggering that is not purely a function of avidity12–16. Membrane-associated Ag dramatically reduces the threshold for B cell activation relative to soluble Ag and impacts affinity discrimination17–21. Membrane Ags have been postulated to achieve such potency by reorganizing the membrane structure following contact with B cells to initially generate BCR microclusters and subsequently an immune synapse (IS)-like contact interface12,13,17,20. This is associated with recruitment of the CD19 co-receptor into the IS and exclusion of inhibitory co-receptors such as CD22 and FcγRIIb along with the phosphatase (PTPase) SHP1 (refs. 17,22,23). However, cell membranes presenting Ag to B cells and free virus-sized particles bound directly by B cells differ from one another not only in interface size but also in fundamental biophysical properties, such as actin dynamics, pulling force and BCR internalization. Direct encounter between B cells and viruses (as well as multivalent VLP vaccines) occurs in vivo at early time points, and the nature of this interaction can define the trajectory of the subsequent immune response1,24–30.
To understand how B cells signal in response to Ag display on viruses, here, we take advantage of a set of virus-sized liposomes that are engineered to display affinity mutants of the model Ag hen egg lysozyme (HEL) but lack nucleic acid cargo31. These liposomes display a programmable range of HEL epitope density (ED) on their surface that mimics the spectrum observed on naturally occurring viruses32. We show that Ag display on these synthetic particles induces potent, digital and remarkably prolonged B cell responses that are density dependent but affinity independent. Signaling in response to these particles requires SYK, BTK and phosphoinositide-3 kinase (PI3K) enzyme activity and also induces phosphatidylinositol 4,5-bisphosphate (PI(4,5)P2) hydrolysis, implicating the canonical BCR signaling pathway; yet, it is not dependent on CD19 (unlike membrane-bound Ag). In contrast to soluble Ag, particulate Ag triggers signal amplification downstream of the BCR by evading LYN-dependent inhibitory pathways. Particulate Ag also triggers maximal NF-κB activation, MYC expression, cell growth and survival and reduces the activation threshold for B cell proliferation in a manner that mimics T cell help. Consequently, low-dose and low-affinity particulate Ag induces robust B cell expansion in vivo even in the absence of adjuvant and is sufficient to overcome anergy. This work reveals a new mechanism by which B cells recognize virus-like Ag display as a stand-alone danger signal (independent of nucleic acid cargo) that does not rely exclusively on avidity and BCR cross-linking. This in turn helps explain how extremely rapid, protective and T cell-independent B cell responses to low doses of virus or VLPs are mounted.
Results
B cells sense particulate Ag density but not affinity
We constructed a library of neutral liposomes of viral size (≅120 nm in diameter) conjugated to the well-characterized model Ag HEL (Fig. 1a and Extended Data Fig. 1a,b)31. These liposomes display HEL protein in a specific orientation and at a programmable density that mimics the range of epitope display on bona fide viruses32. Importantly, these synthetic virus-like structures (SVLS) lack any interior nucleic acids such that conjugated surface Ag is the only immunogenic component. We further took advantage of previously characterized amino acid substitutions in the HEL protein that reduce its affinity for the Hy10 BCR relative to native HEL33. The HELD mutant carries two mutations R73E and D101R (Ka = 8.0 × 10⁷ M−1), and the HELT mutant carries three mutations R21Q, R73E and D101R (Ka = 1.5 × 10⁶ M−1; Extended Data Fig. 1a)33. Importantly, the affinity of HELT for the Hy10 BCR is comparable to typical germline-encoded naive B cell affinities for polyclonal Ags3, enabling us to probe physiologically relevant interactions. We confirmed that the soluble HEL (sHEL) mutants triggered responses in an affinity- and concentration-dependent manner in naive MD4 B cells that express the Hy10 IgM/IgD BCR transgene and coexpress the NUR77–green fluorescent protein (NUR77–GFP) transgenic reporter of BCR signaling34,35 (Fig. 1b)31,33.
Fig. 1 |. SVLS induce highly potent B cell responses that depend on ED but not affinity.
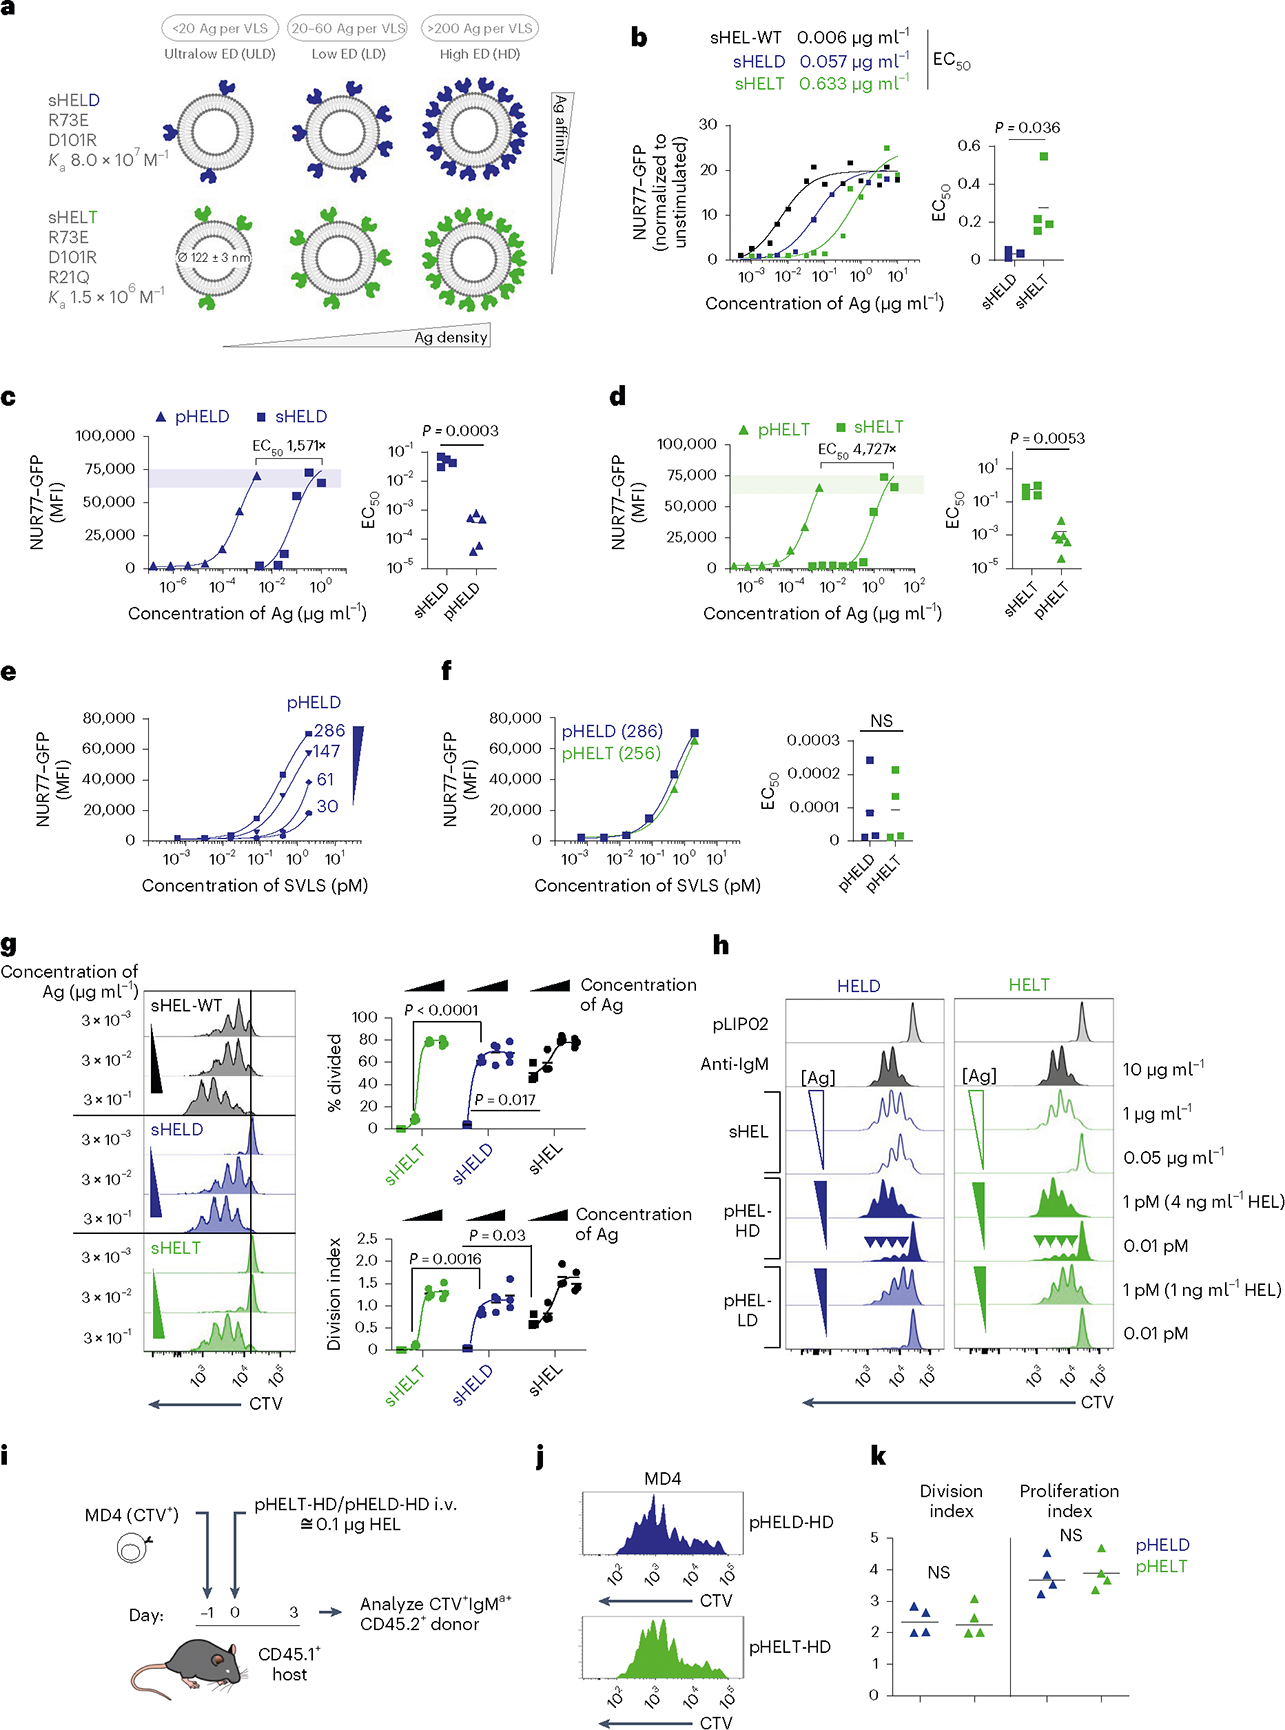
a, Schematic of the SVLS library. b, MD4 lymphocytes with the NUR77–GFP transgenic reporter were stimulated with native wild-type sHEL (sHEL-WT) or affinity mutants sHELD and sHELT and analyzed to detect GFP MFI in B220+ cells at 24 h. Curves fit a three-parameter non-linear regression against the mean of three biological replicates per stimulus, and EC50 values correspond to these curves (left). EC50 values were also interpolated for individual biological replicates (n = 3 sHELD and n = 4 sHELT) and compared by paired two-tailed parametric t-test (right). c, Pooled splenocytes and lymphocytes from MD4 NUR77–GFP reporter mice were stimulated with either sHELD or pHELD (ED of 286) and analyzed 24 h later. Data from a representative experiment (left) were fitted with a three-parameter non-linear regression. EC50 values were interpolated from n = 4 (sHELD) and n = 5 (pHELD) biological replicates (right). d, As in c, but cells were stimulated with sHELT and pHELT (ED of 256; n = 4 sHELT and n = 6 pHELT). Data in c and d were analyzed by unpaired two-tailed parametric t-test. e, As in c, but cells were stimulated with titrated densities of HELD per particle. f, pHELT and pHELD curves from c and d are overlaid (left). EC50 values (in micrograms per milliliter) of HEL protein were interpolated from four biological replicates and compared by paired two-tailed parametric t-test (right). Data in c–f are representative of seven independent experiments; NS, not significant. g, MD4 lymphocytes were loaded with CTV vital dye and cultured with sHEL stimuli + BAFF. Representative histograms depict the CTV dilution in B220+ cells after 72 h (left). Graphs depict mean percent divided and division index calculated for three biological replicates (right) compared by parametric two-way analysis of variance (ANOVA) with a Tukey post hoc test. h, Representative histograms depict CTV dilution in live B220+ lymphocytes after 72 h with sHEL or pHEL. Inset arrowheads mark a small fraction of highly proliferated B cells. Histograms are representative of seven independent experiments. i, Experimental schematic; i.v., intravenous. j, Representative histograms depicting B220+IgMa+ donor lymphocytes in immunized hosts. k, Graphs depict division and proliferation indices for four biological replicates compared by a paired two-tailed parametric t-test.
By combining engineered liposomes with recombinant HEL proteins, we can vary both density and affinity of conjugated surface epitopes (Fig. 1a and Extended Data Fig. 1a,b). We decorated liposomes with either the moderate-affinity mutant (HELD) or the low-affinity mutant (HELT) at matched densities between 3 and 500 epitopes per liposomal particle (60 to 10,000 molecules per μm2); these HEL-engineered SVLS are referred to herein as particulate HEL (pHEL), in contrast to sHEL (Fig. 1a and Extended Data Fig. 1b).
The concentrations of HELD and HELT proteins required to upregulate NUR77–GFP expression in MD4 reporter B cells were reduced by over three orders of magnitude when tethered to SVLS at an ED of approximately 250–290 epitopes per liposome (Fig. 1c,d). For example, the half-maximal effective concentration (EC50) value for sHELT in this assay was on the order of 500 ng ml−1, consistent with prior reports31,33,36, but was nearly 5,000-fold lower when tethered to SVLS. Polyclonal NUR77–GFP reporter B cells admixed with MD4 reporter B cells in culture failed to upregulate GFP expression in response to pHEL, confirming that Ag-specific BCRs were required (Extended Data Fig. 1c). Similarly, ‘naked’ liposomes (pLIP02) without conjugated HEL protein also failed to induce NUR77–GFP expression (Extended Data Fig. 1c). Impressively, SVLS were stable for long periods of time following synthesis without loss of potency (Extended Data Fig. 1d).
B cells were highly sensitive to ED of pHELD and upregulated NUR77–GFP expression in a density-dependent manner (Fig. 1e). Interestingly, B cell activation did not scale continuously with ED for low-affinity pHELT (Extended Data Fig. 1e), indicating that there may be an optimum ED that is not simply the highest. Moreover, particles with as few as three conjugated HELT molecules could trigger NUR77–GFP upregulation at low doses (Extended Data Fig. 1f), suggesting that tethering of Ag to SVLS even in the absence of extensive BCR cross-linking confers many orders of magnitude higher potency than soluble Ag (Fig. 1b). Similar results were obtained with an orthogonal readout of B cell activation: surface CD69 upregulation (Extended Data Fig. 1g). B cell sensitivity to ED was also observed in vivo37.
Prior work has demonstrated that conjugating similar HEL Ags to large cell-surface membranes can override affinity discrimination18,19, although B cells still exhibit affinity-sensing behavior in response to Ag presented on cells20,21. Here, we show that conjugating HEL affinity mutants to SVLS also bridges affinity gaps; SVLS bearing either HELD or HELT Ag at matched ED induced equivalent levels of NUR77–GFP expression despite a reproducible gap in potency measured for these proteins in soluble form (Fig. 1b,f and Extended Data Fig. 1f).
To directly detect SVLS capture, we cultured MD4 B cells with pHEL encapsulating AlexaFluor 594 (pHELD(AF594)). As expected, AF594 fluorescence among B cells detected by flow cytometry scaled linearly with particle concentration (Extended Data Fig. 1h,i). At ultralow doses equivalent to ≅20 average particles per B cell, subgating according to AF594 fluorescence enables us to identify B cells with either minimal or maximal CD69 upregulation, from which we infer that even a very low number of pHEL particles may be sufficient to fully activate a B cell.
Low doses of SVLS drive robust B cell proliferation
We next sought to compare the effect of soluble and particulate Ag display on B cell proliferation in vitro using ‘equipotent’ concentrations of pHEL and sHEL as defined by our NUR77 reporter assays. Throughout this manuscript, 1 pM doses of pHEL (≅4 ng ml−1 HEL protein for a higher ED of 250–290; ≅1 ng ml−1 HEL protein for a lower ED of 61–64) were compared to much higher, maximally potent sHEL concentrations of 1 μg ml−1 (≅64 nM HEL protein) except where dose is explicitly titrated. Such doses drive similar NUR77–GFP expression at 24 h and enable us to dissect differences in upstream and downstream B cell responses between pHEL and sHEL at fixed potencies. B cells proliferated robustly to both sHEL and pHEL equipotent stimuli when cocultured with B cell activating factor (BAFF), as assessed by vital dye dilution (Fig. 1g,h). Proliferation in response to sHEL was highly dependent on both dose and affinity of Ag (Fig. 1g). By contrast, proliferation driven by pHELD/pHELT was concentration and density dependent but affinity independent (Fig. 1h). Immunization of congenic hosts with very low doses of pHEL (≅0.1 μg of HEL protein) following adoptive transfer of CellTrace Violet (CTV)-loaded MD4 B cells yielded vigorous B cell proliferation irrespective of epitope affinity, even in the absence of adjuvant (Fig. 1i–k). By contrast, prior studies showed that sHEL caused abortive proliferation and rapid apoptosis of MD4 B cells by the same time point38,39.
Interestingly, we found that reducing the concentration of high-ED SVLS allowed us to visualize a small fraction of B cells that had undergone many rounds of division in vitro (Fig. 1h, arrowheads). This outcome was not evident when the ED was reduced nor when B cells were stimulated with sHEL (Fig. 1g,h). These data reinforce that even a small number of pHEL particles might be sufficient for maximal B cell activation; reducing pHEL concentration lowers the number of cells engaged but not the extent of activation on a single-cell level, conferring an all-or-none response.
Importantly, potent B cell proliferation in vitro and in vivo in response to pHEL is not attributable to engagement of innate-like marginal zone (MZ) B cells (which exhibit unique biology and play a critical role in early responses to T cell-independent multivalent Ags in vivo40), because these assays are performed with lymph node tissue rather than spleen tissue as a source of exclusively follicular B cells.
SLVS trigger robust downstream BCR signaling
To define the biochemical basis for such robust B cell responses to viral Ag display, we selected ‘equipotent’ concentrations of soluble and particulate stimuli, as described above, to compare how signaling after BCR engagement differed between these modes of Ag display. We compared these stimuli to anti-IgM F(ab′)2 as a reference because antibody-mediated BCR cross-linking is very well characterized. At early time points after stimulation, pHELD and sHELD induced comparable Erk phosphorylation (pErk), but subsequent signaling induced by pHELD was much more robust, peaking at 20 min (Fig. 2a). Unlike sHELD, sHELT was largely unable to trigger detectable pErk at any time point assayed (Fig. 2b,c). Importantly, pErk levels were comparable when B cells were stimulated with either pHELT or pHELD of matched high ED (Fig. 2c), suggesting that even early BCR signaling events do not discriminate affinity when Ag is presented on particles of viral size, and this was true across titration of pHEL concentration (Fig. 2d). Similar results were obtained by assessing S6 phosphorylation (pS6; Extended Data Fig. 2a–c).
Fig. 2 |. pHEL triggers robust signaling downstream of the BCR that is insensitive to epitope affinity.
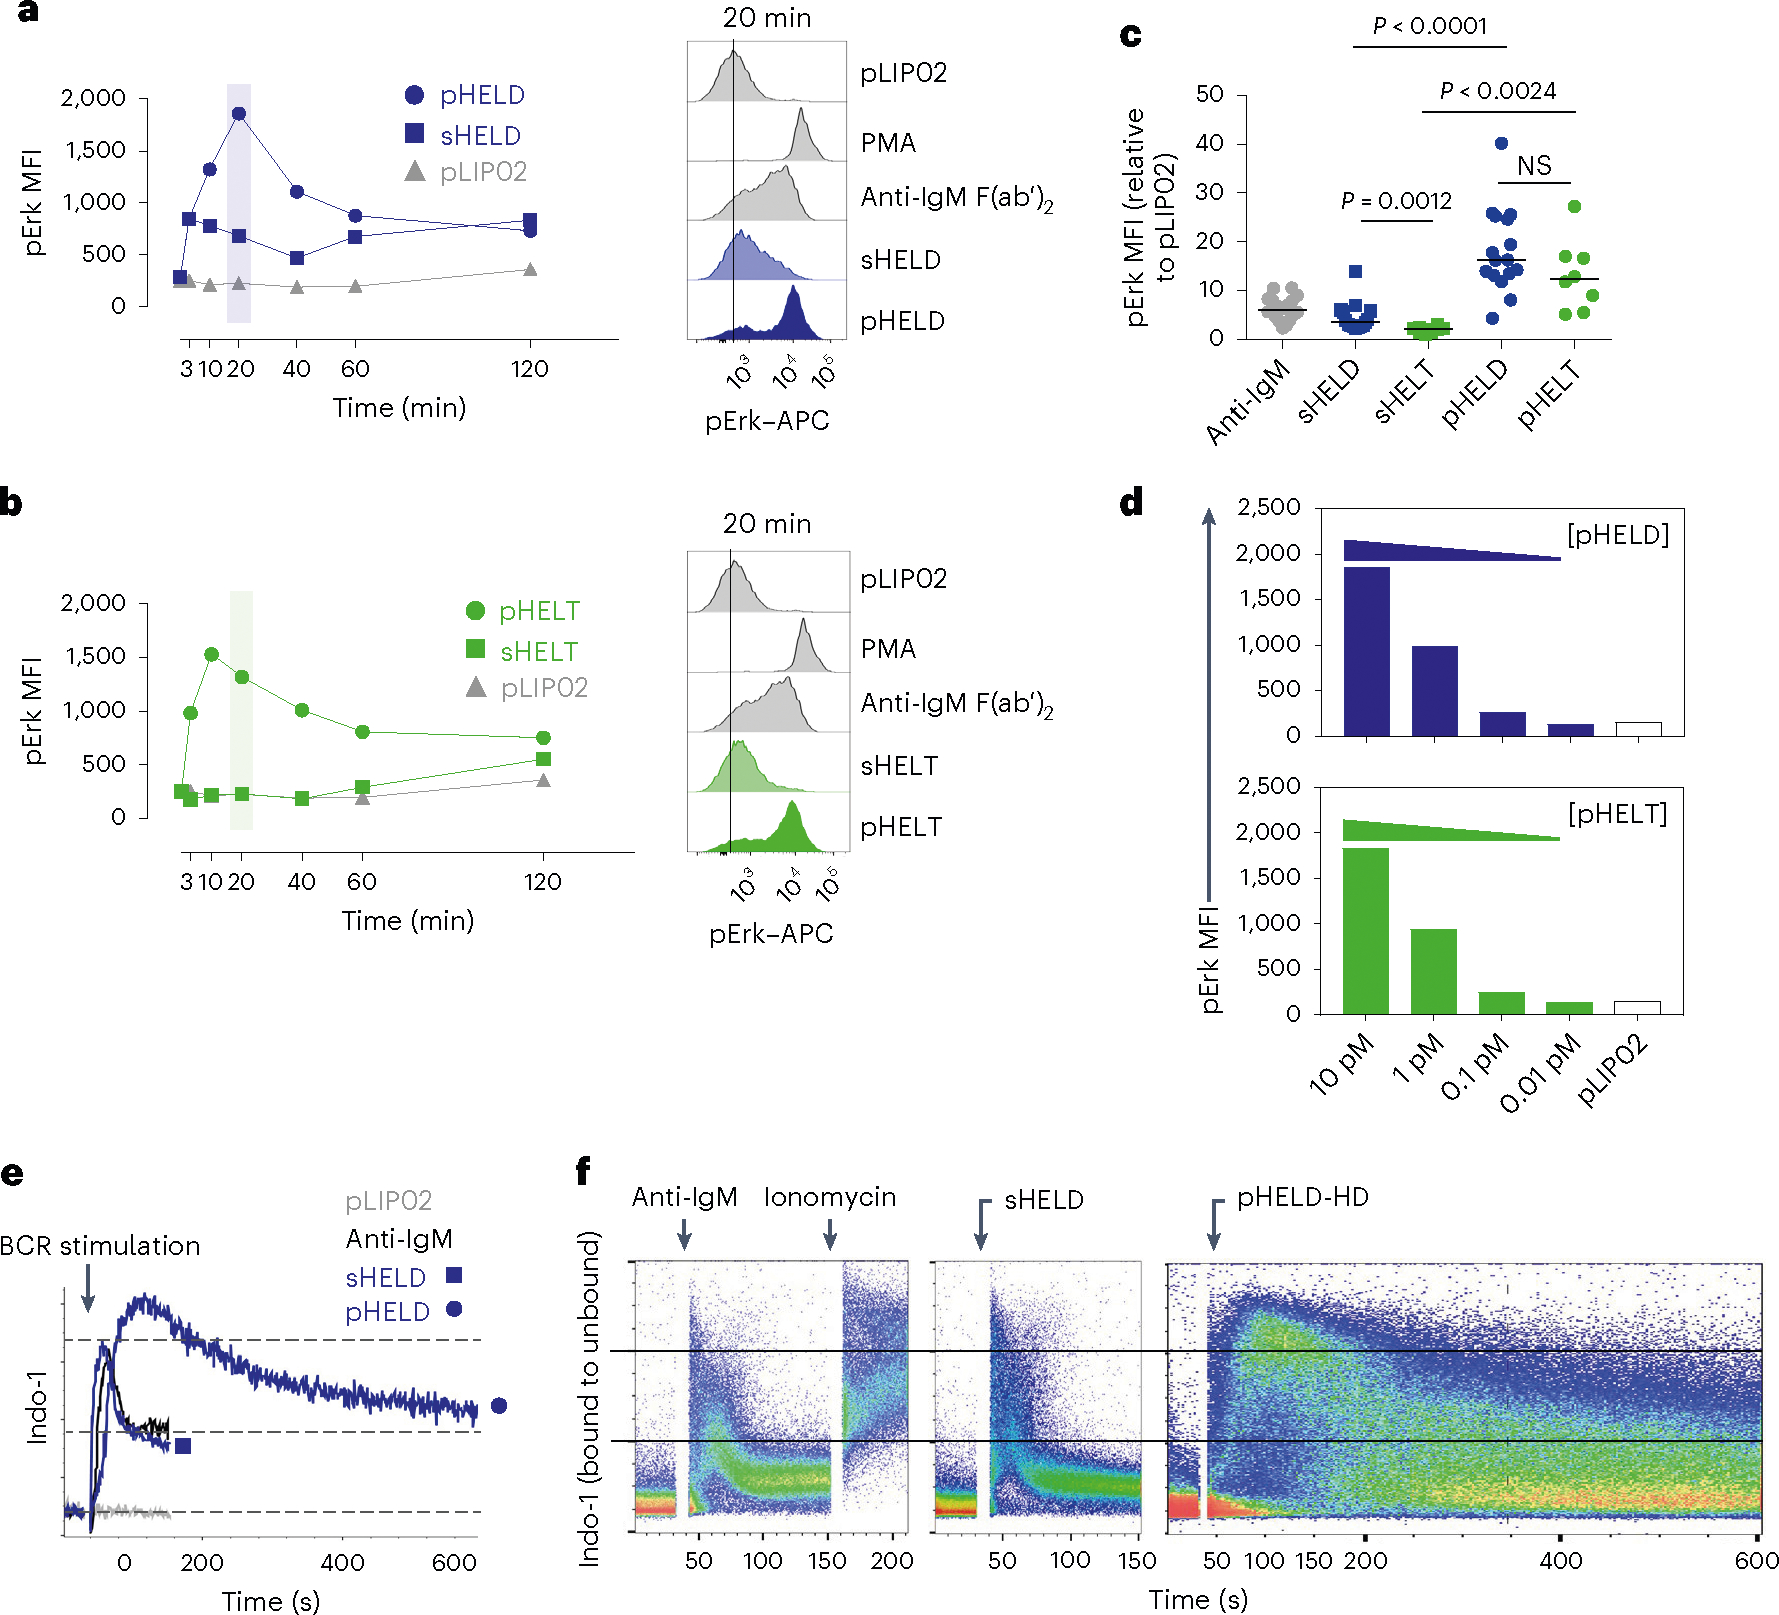
a,b, MD4 splenocytes were stimulated over a time course of 120 min, fixed and permeabilized, and intracellular pErk was measured by flow cytometry (left). Stimuli included 10 pM pLIP02 (naked liposome), 10 μg ml−1 anti-IgM, pHELD (a) or pHELT (b) (EDs of 286 and 256, respectively; 1 pM liposome ≅ 4 ng ml−1 HEL protein) and 1 μg ml−1 sHELT or sHELD. The selected doses of sHEL and pHEL were equipotent for the induction of NUR77–GFP at 24 h (see Fig. 1c,d). Graphs (left) and histograms (right) depict pErk in B220+ cells from a single time course and are representative of three independent experiments; PMA, phorbol 12-myristate 13-acetate. c, B cell pErk MFI after 20 min of stimulation; each point represents an independent experiment, and data are pooled from 16 (pHELD) or 8 (pHELT) experiments depending on stimulus. Separate groups are depicted in a single graph for convenience. Prespecified groups were compared by a paired two-tailed parametric t-test. The mean is depicted. d, As in a and b, but splenocytes were stimulated with decreasing concentrations of either pHELT or pHELD for 20 min. Data plotted are from a single experiment and are representative of four independent experiments. e,f, Splenocytes and lymphocytes from MD4 mice were pooled, loaded with Indo-1 calcium indicator dye, stained to detect B220+ B cells and stimulated as in a. Calcium entry was detected in real time by flow cytometric detection of bound and unbound Indo-1 fluorescence for 2–10 min (e). The ratio of bound to unbound Indo-1 fluorescence over time is plotted as population mean or for individual cells (f). Data are representative of eight independent experiments.
We next measured cytosolic calcium following particulate or soluble BCR stimulation by loading MD4 B cells with the calcium indicator Indo-1 and analyzing cells by flow cytometry. Although the response to pHELD was slower to reach peak intracellular calcium concentrations than for soluble stimuli (by almost 60 s), responding cells ultimately achieved a much higher peak that was comparable to ionomycin stimulation, suggesting that it was maximal within the dynamic range of this assay (Fig. 2e,f). Maximal doses of either anti-IgM or sHELD induced rapid but very short-lived (60 s) intracellular calcium increases with uniform kinetics across the entire B cell population. In contrast, pHELD exhibited delayed but remarkably prolonged (exceeding 10 min) calcium increases among a subset of cells (Fig. 2e,f). Although we cannot exclude the possibility that capture of additional pHEL by unoccupied BCRs prolongs calcium signaling, we do not interpret the prolonged kinetics as inhomogeneous B cell activation in response to SVLS because all B cells at the population level could exhibit maximal intracellular calcium levels by 90 s.
Robust signaling triggered by pHEL was not due to selective responses by MZ B cells because lymph node samples lacking MZ B cells or splenic B cells gated for follicular and MZ compartments independently revealed robust signaling in both B cell subsets (Extended Data Fig. 2d–i).
SLVS, but not soluble Ag, trigger bimodal signaling
Strikingly, single-cell resolution of pErk responses afforded by Phosflow revealed that even very low concentrations of pHEL could induce maximal levels of pErk in a small fraction of B cells (Fig. 3a). Reducing ED also reduced pErk mean fluorescence intensity (MFI) but in a bimodal manner, suggesting ‘all-or-none’ digital responses by single B cells (Fig. 3b). Ultralow ED particles were also many orders of magnitude more potent than soluble Ag, inducing robust bimodal pErk responses at 10 pM SVLS (≅0.4 ng of HELT protein; Extended Data Fig. 2j). This reinforced the possibility that pHEL potency was not merely attributable to extensive BCR cross-linking by individual particles.
Fig. 3 |. Particulate Ag triggers bimodal signaling that is sensitive to dose and ED but not epitope affinity.
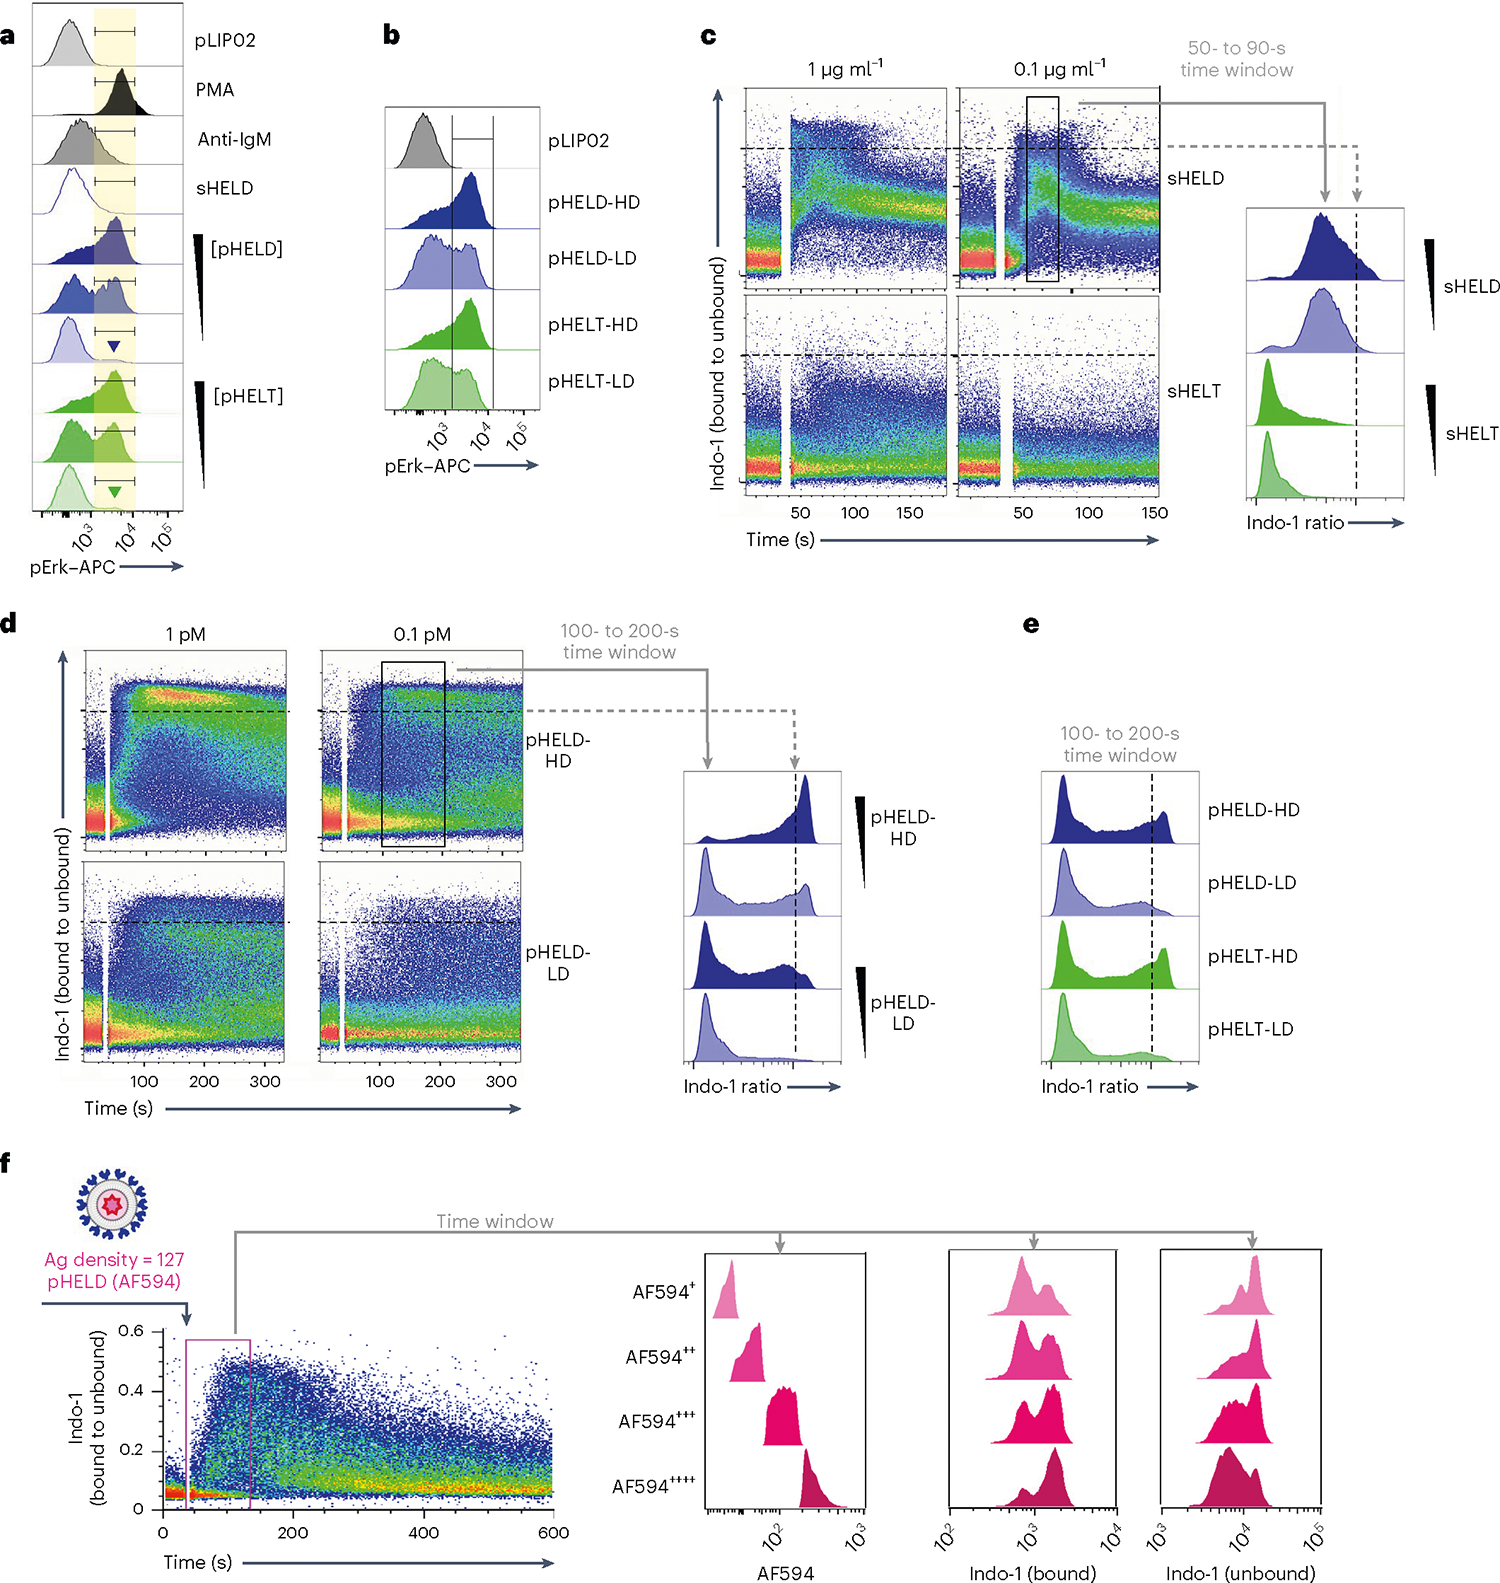
a, As in Fig. 2a,b, but splenocytes were stimulated with decreasing concentrations of either pHELT or pHELD (10 pM, 1 pM and 0.1 pM). Samples correspond to the MFI quantification in Fig. 2d. Inset goal posts gate on a subset of cells with maximal pErk signal. b, As in a, but splenocytes were stimulated with 10 pM SVLS carrying either high-density (HD) or low-density (LD) HELD or HELT (EDs of 286, 256, 61 and 64, respectively). Data in a and b are representative of four independent experiments. c–e, Pooled splenocytes and lymphocytes from MD4 mice were loaded with Indo-1 calcium indicator dye, stained with surface markers to detect B220+ cells and stimulated with sHELD/sHELT (1 and 0.1 μg ml−1; c), 1 or 0.1 pM high- or low-density pHELD (EDs of 286 and 23, respectively; d) or high- or low-density pHELD/pHELT (EDs of 286/256 and 61/64, respectively; e). Calcium entry was assessed by flow cytometry for the indicated times. Plots depict the geometric mean of the fluorescence ratio of bound to unbound Indo-1 in individual cells over time (in seconds) on a log scale. Histograms display the fluorescence ratio of bound to unbound Indo-1 gated on a defined time window to capture peak cytosolic calcium for each type of stimulus. Data in c–e depict the same Indo-1 axis/scale, and dashed black lines mark the corresponding value across dot plots and histograms for comparison. Data are representative of at least three independent experiments depending on stimuli. f, As in Fig. 2f, except that cells were stimulated with 1 pM fluorescent pHELD (AF594), as characterized in Extended Data Fig. 1h,i, and were also gated to detect B cell subsets, as in Extended Data Fig. 2h,i. Right-hand histograms depict CD23+CD21lo B cells subgated according to AF594 fluorescence during an early time window. Bound and unbound Indo-1 fluorescence histograms for each subgate are shown. Data are representative of three independent experiments.
Even at the earliest time points that wecould assess, all pHEL calcium responses were bimodal, in marked contrast to soluble stimuli (Fig. 3c–e); as with pErk, reducing the concentration of pHEL decreased the fraction of responding cells but not intracellular calcium levels among responding cells (Fig. 3a,d). These bimodal calcium responses were sensitive to ED but not affinity, unlike soluble stimuli. We next took advantage of fluorescent pHELD(AF594) to correlate particle capture with the earliest detectable calcium increases (Fig. 3f). This revealed that AF594 fluorescence in the first minute following mixture of B cells and particles correlated with intracellular calcium. Moreover, at every level of AF594 fluorescence, Indo-1-bound and Indo-1-unbound fluorescence was bimodal. Such bimodal single-cell behavior in response to pHEL suggests that particulate Ag triggers signal amplification that may operate at a node upstream of both MAPK and calcium pathways.
SVLS require canonical BCR signaling but not TLR signaling
We next sought to exclude a role for any contaminating nucleic acids that could be delivered via pHEL to endosomal TLRs. To do so, we first took advantage of a highly selective IRAK1/IRAK4 inhibitor, which blocked CpG-induced pErk and pS6 but did not inhibit pHEL signaling (Fig. 4a,b). Similarly, deletion of Myd88 completely suppressed signaling by TLR agonists but not BCR or CD40 stimulation and, importantly, was completely dispensible for pHEL responses in vitro (Fig. 4c,d). Conversely, pHEL responses were fully dependent on the activity of canonical BCR pathway signaling molecules, such as SYK, BTK and PI3K41; small-molecule inhibitors of these enzymes completely eliminated downstream induction of pErk expression in response to pHEL but not CpG (Fig. 4e–h).
Fig. 4 |. pHEL signaling is independent of MYD88/IRAK1/IRAK4 but requires the canonical BCR pathway.
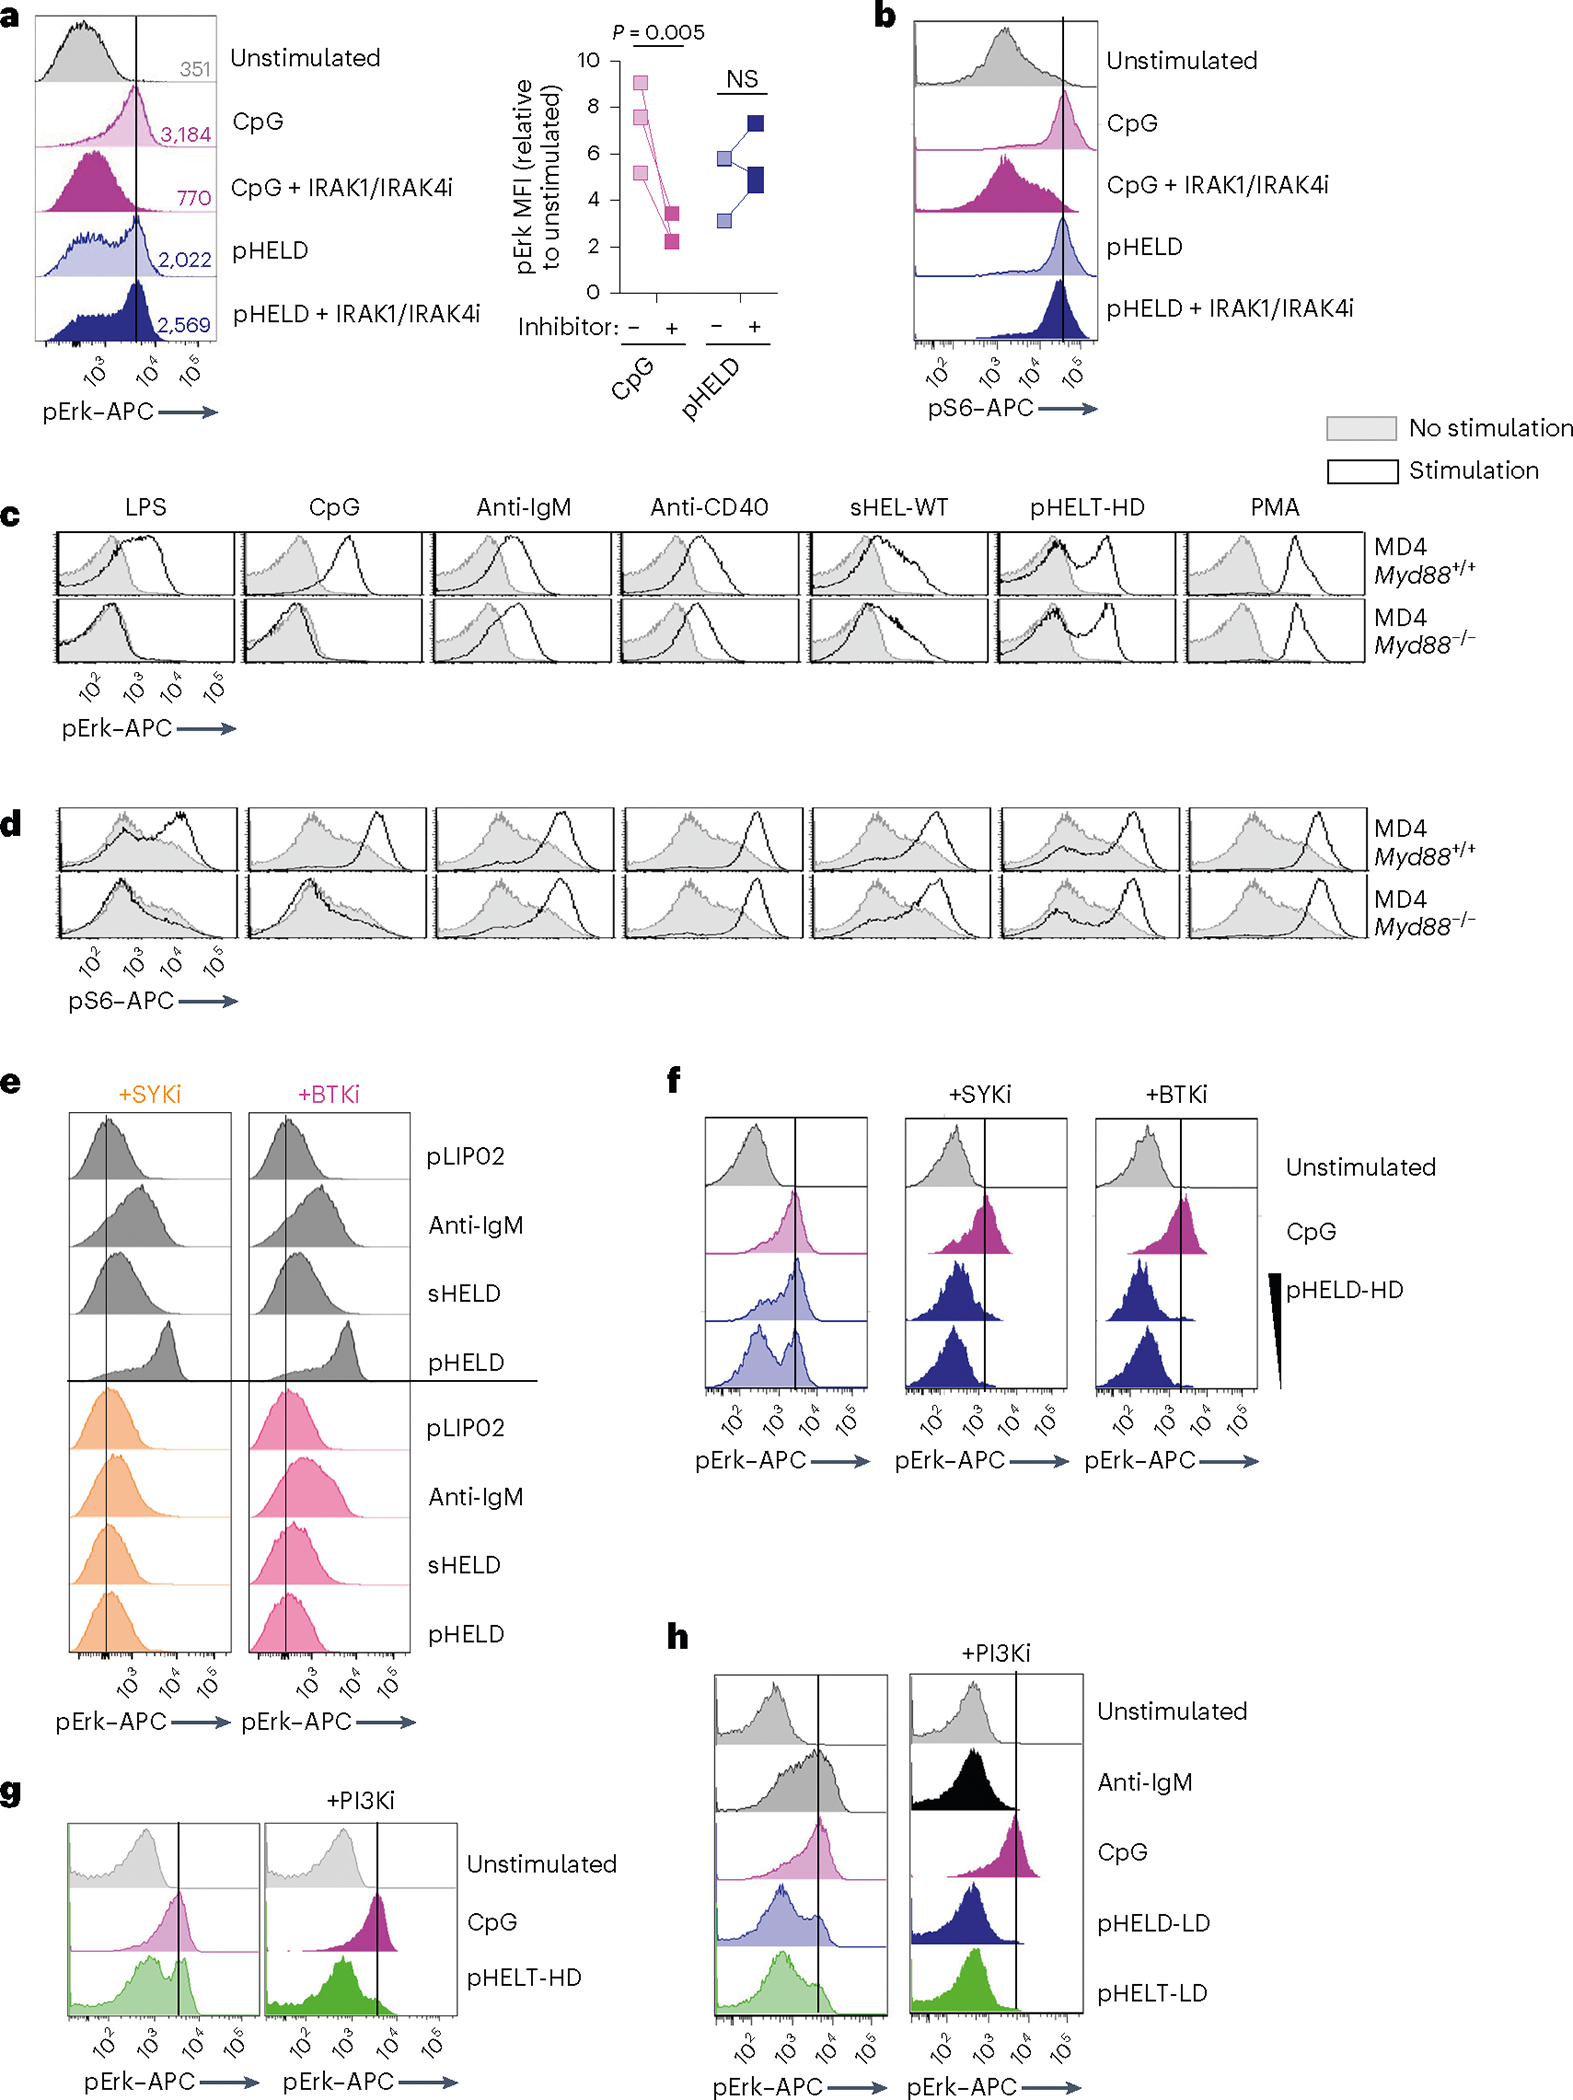
a,b, Pooled splenocytes and lymphocytes from MD4 mice were preincubated at 37 °C for 15 min with Rigel R568 IRAK1/IRAK4 inhibitor (IRAK1/IRAK4i; 1 μM), subsequently incubated for 20 min with the indicated stimuli (2.5 μM CpG and 1 pM pHELD), and then fixed, permeabilized and stained to detect pErk or pS6 as well as B220. Representative histograms depict pErk (a) or pS6 (b) in B220+ B cells. The graph depicts pErk MFI from three independent experiments. Data in b are representative of at least four independent experiments. Data were compared by unpaired two-tailed parametric t-test. c,d, Pooled splenocytes and lymphocytes from MD4 Myd88+/+ and MD4 Myd88−/− mice were stimulated with the indicated stimuli for 20 min and stained to detect pErk or pS6 in B220+ B cells as in a and b (10 μg ml−1 lipopolysaccharide (LPS), 2.5 μM CpG, 10 μg ml−1 anti-IgM, 1 μg ml−1 anti-CD40, 1 μg ml−1 sHEL-WT or 1 pM pHELT-HD (ED of 256)). Histograms depict pErk (c) or pS6 (d) and are representative of four (c) or three (d) independent experiments. e,f, As in a except with pretreatment with SYK inhibitor (SYKi; 1 μM Bay 61–3606) or BTK inhibitor (BTKi; 100 nM ibrutinib), followed by a 20-min incubation with the indicated stimuli: 1 pM and 0.1 pM (f) pHELD-HD (ED of 286), 1 μg ml−1 sHELD, 10 μg ml−1 anti-IgM and 2.5 μM CpG. Histograms are representative of four independent experiments. g,h, As in a except pretreatment with PI3K inhibitor (PI3Ki; 10 μM Ly290049) and stimuli (1 pM pHELT-HD ED = 256 in g; 1 pM pHELD-LD ED = 53 and pHELT-LD ED = 58 in h). Histograms are representative of four independent experiments.
SVLS trigger signal amplification downstream of the BCR
Robust bimodal or digital signaling responses suggest that pHEL may trigger signal amplification downstream of the BCR relative to soluble Ag. To investigate this mechanism, we comprehensively analyzed the most proximal biochemical events triggered in B cells. To our surprise, although downstream Erk and IKK phosphorylation was robustly induced by both sHEL and pHEL at 3 min, and dependent on canonical BCR signaling molecules (Fig. 4e–h), total tyrosine phosphorylation was minimally inducible following pHEL stimulation (Fig. 5a,b). Similarly, tyrosine phosphorylation of the BCR itself (CD79A), SYK, phospholipase C-γ2 (PLCγ2) and PI3K was also robustly induced by soluble stimuli but was virtually undetectable for pHEL stimulation (Fig. 5c,d).
Fig. 5 |. pHEL triggers robust signal amplification downstream of the BCR.
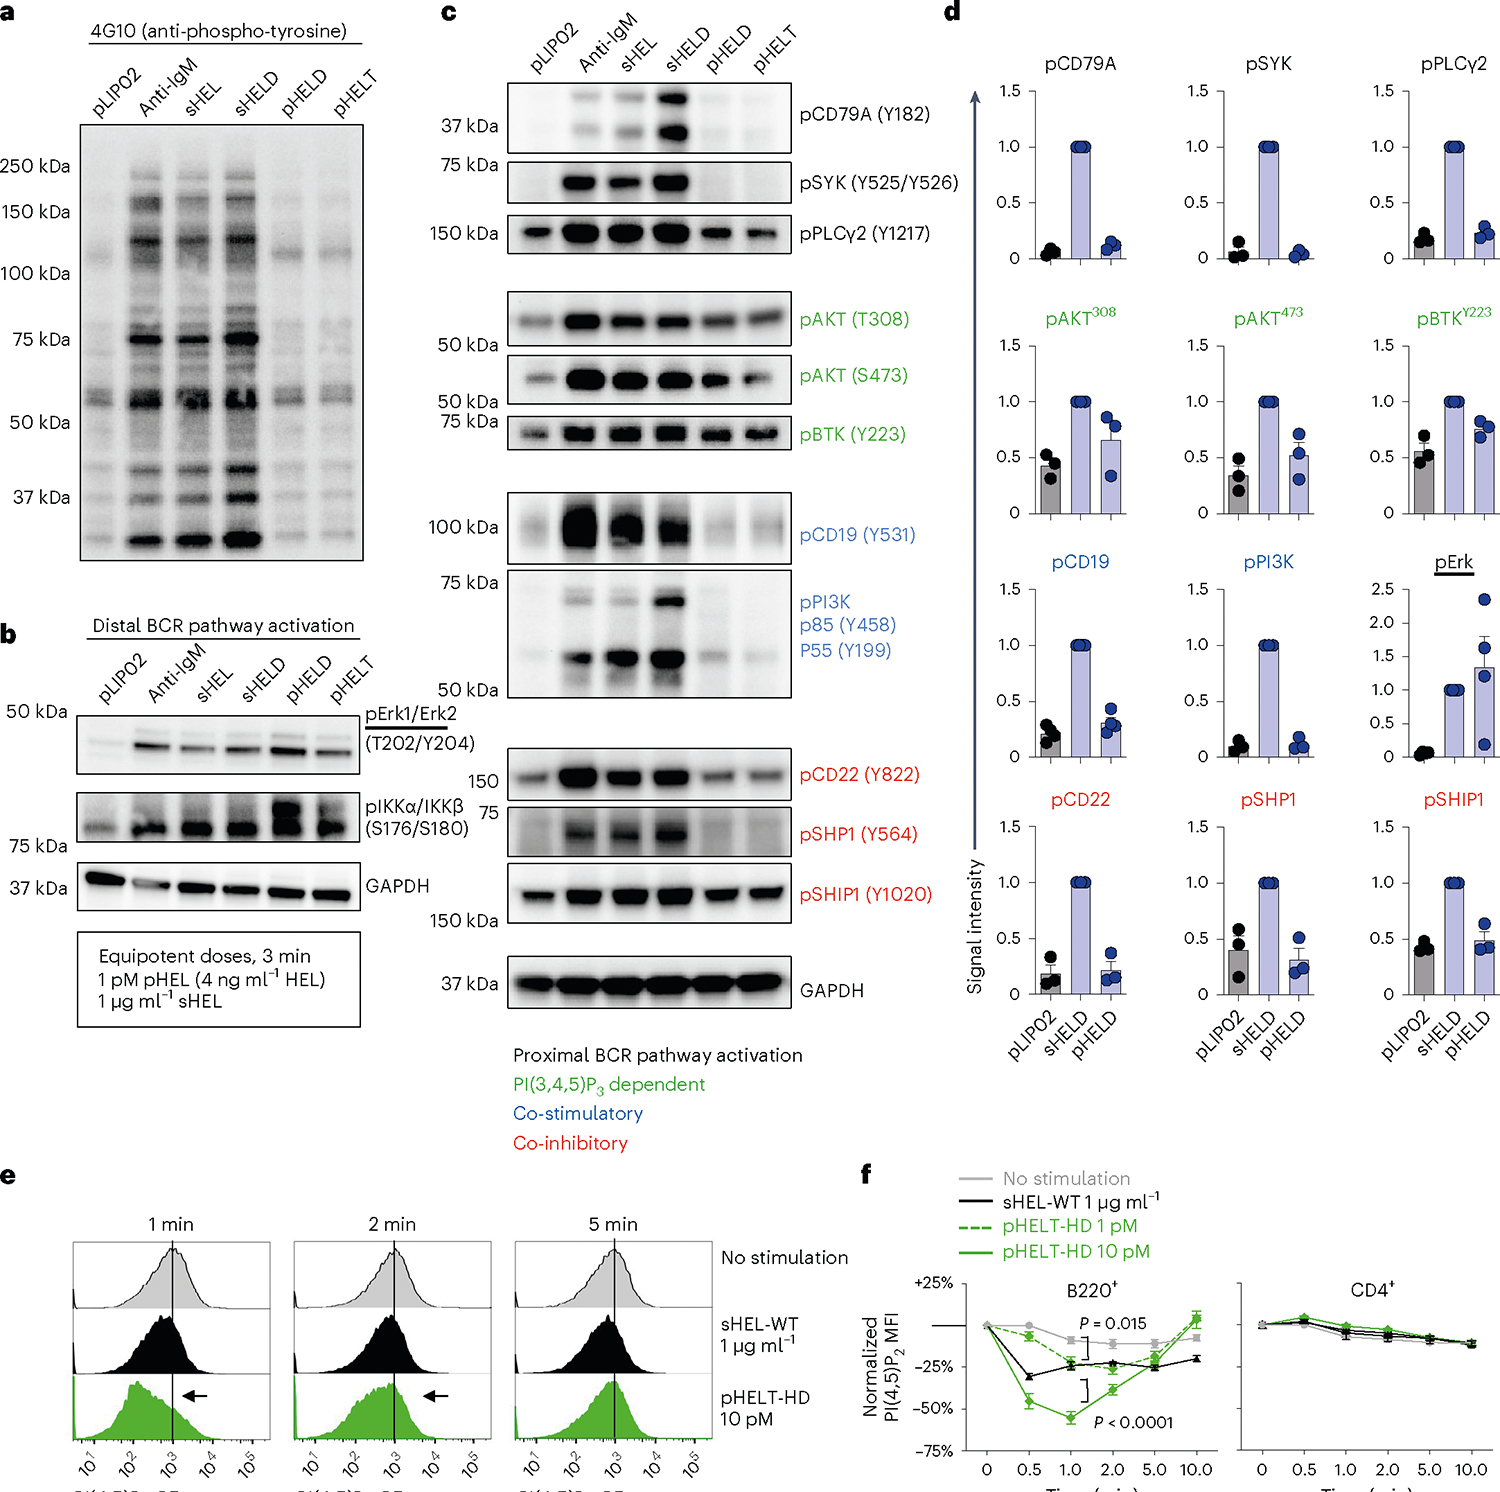
a–c, MD4 splenocytes and lymphocytes were pooled, and B cells were isolated by benchtop negative selection. B cells were stimulated for 3 min at 37 °C with naked liposome (1 pM pLIP02), 10 μg ml−1 anti-IgM, 1 μg ml−1 sHEL-WT/sHELD or 1 pM pHELD/pHELT (high ED of 250–290). Lysates were analyzed by western blotting to detect total phospho-tyrosine (4G10; a) or specific phospho-species in the BCR signaling cascade (b and c). In b and c, GAPDH (bottom) is shown as a loading control because a common pool of cells was used for all stimulation conditions. Images depict blots performed with a single set of lysates representative of three to six independent experiments depending on blotting antibody with corresponding quantification across biological replicates in d. d, Summary data of phosphoprotein quantification from n = 3 independent experiments except for pErk and pCD19 (n = 4). Quantification shows mean band intensity normalized to the sHEL condition for each blot + s.e.m. In each experiment, blots were probed for GAPDH as depicted in b and c to confirm accurate loading. Groups were compared by paired and unpaired two-tailed parametric t-tests applied to raw unnormalized band intensity (see Source Data for statistical analysis and individual P values). e,f, MD4 lymphocytes were stimulated with medium alone, sHEL or pHELT-HD for different time points (0–10 min) and fixed, permeabilized and stained to identify B220+ and CD4+ populations as well as intracellular PI(4,5) P2 abundance. Histograms depict PI(4,5)P2 expression in B220+ B cells in response to distinct stimuli across time points (e). Graphs depict PI(4,5)P2 MFI (normalized to t = 0.5 min condition without stimulation) in B220+ and CD4+ lymphocytes across stimuli and time points from n = 6 biological replicates across three independent experiments (except n = 4 for the 1 pM pHELT dose; f). Graphs show mean ± s.e.m. Samples at the 1- to 10-min time points were compared by two-way ANOVA with a Tukey post hoc correction for multiple comparisons.
Discordance between proximal and distal signaling led us to hypothesize that a small number of BCRs engaged by pHEL induced proximal tyrosine phosphorylation below the limits of detection and triggered subsequent downstream signal amplification. Conversely, these data suggest that potent downstream signaling by pHEL was not merely a consequence of enhanced proximal BCR engagement (that is, extensive BCR cross-linking), as such a mechanism would be anticipated to produce robust phosphorylation at the most proximal signaling nodes such as pCD79A and pSYK. This argues against mere avidity alone as a mechanism for pHEL potency.
Following BCR stimulation, PI(4,5)P2 is hydrolyzed at the plasma membrane by PLCγ2 to generate second messengers diacylglycerol and inositol 1,4,5-trisphosphate (IP3)42. These critical intermediates promote protein kinase C-β (PKCβ), Ras–MAPK activation and store-operated calcium entry. Consistent with highly amplified pErk and calcium signaling triggered by pHEL, we observed dynamic PI(4,5)P2 depletion as early as 30 s following pHEL stimulation (Fig. 5e,f). This suggests that, despite little detectable proximal tyrosine phosphorylation, pHEL stimulation triggers robust recruitment and activation of PLCγ2 at the membrane.
The second messenger phosphatidylinositol 3,4,5-triphosphate (PI(3,4,5)P3) is also dynamically generated from PI(4,5)P2 by PI3K at the plasma membrane following BCR stimulation43. PI(3,4,5)P3 serves as a key signaling intermediate that nucleates the assembly of the BCR ‘signalosome’, including both BTK and PLCγ2, and functions as an important node for tuning BCR signal amplification42,44. AKT T308 is phosphorylated by PDK1 and is highly dependent on PI(3,4,5)P3 for recruitment of both AKT and PDK1 via their PH-binding domains45,46. In contrast to proximal tyrosine phosphorylation, detectable AKT serine/threonine phosphorylation was induced by both sHEL and pHEL at 3 min (Fig. 5c,d). BTK autophosphorylation at Y223 also depends on recruitment to PI(3,4,5)P3 and BTK dimerization47 and is measurably induced by pHEL (Fig. 5c,d). Detectable phosphorylation of these sites following pHEL stimulation suggested that local PI(3,4,5)P3 generation by PI3K at the membrane might serve to amplify signaling in response to pHEL. Importantly, although PI3K phosphorylation is undetectable after pHEL stimulation (Fig. 5c,d), downstream pHEL signaling is nevertheless sensitive to PI3K inhibition (Fig. 4g,h).
CD19-independent signaling by SVLS in vitro but not in vivo
The CD19 co-receptor plays an important role in amplifying PI(3,4,5) P3 production by PI3K in response to BCR stimulation. Moreover, CD19 is coclustered with the BCR following encounter with cell membrane-associated Ags or via complement-coated Ags, and CD19 is required for highly robust responses to such Ags22,48–50; however, it is dispensable for in vitro responses to soluble Ag. CD19 phosphorylation was robustly induced by anti-IgM and sHEL but not pHEL, raising the possibility that CD19 was not engaged by pHEL (Fig. 5c,d). Indeed, CD19-deficient MD4 B cells reveal that CD19 is dispensable for robust signaling by particulate Ag in vitro (Extended Data Fig. 3a).
B cells in vivo encounter Ag captured by dendritic cells and are influenced by complement activation. Therefore, we assessed B cell responses to pHEL following co-adoptive transfer of CD19-deficient and CD19-sufficient MD4 B cells labeled with either CTV or CellTrace yellow (CTY) vital dye (Extended Data Fig. 3b). At 3 d after immunization with pHEL, wild-type MD4 B cells exhibited greater proliferation than CD19-deficient cells, but both were insensitive to particulate Ag affinity (Extended Data Fig. 3c–g). These data suggest that CD19 is dispensible for early signaling events in vitro but is required for in vivo Ag-specific B cell expansion37.
SVLS evade LYN-dependent inhibitory pathways
PI(3,4,5)P3 abundance at the membrane and proximal BCR signaling are negatively regulated by immunoreceptor tyrosine-based inhibitory motif (ITIM)-containing co-receptors and associated inhibitory phosphatases41,44. We observed robust phosphorylation of CD22, SHP1 and SHIP1 in response to anti-IgM and sHEL but not pHEL (Fig. 5c,d). This raised the possibility that particulate Ag circumvents engagement of inhibitory co-receptors. Indeed, exclusion of inhibitory co-receptors and associated phosphatases is postulated to contribute to potent responses by cell membrane-associated Ags13,17,22,23. Several Src family kinases (SFK) are expressed in B cells and can all mediate immunoreceptor tyrosine-based activation motif (ITAM)-dependent signaling following BCR engagement. By contrast, the SFK LYN plays a non-redundant role in ITIM-dependent signaling; LYN-deficient B cells therefore fail to engage downstream phosphatases SHP1 and SHIP1 in response to anti-IgM stimulation but can activate BCR signaling (as well as CD19) via other SFKs (Fig. 6a)41,44,51,52.
Fig. 6 |. Soluble but not particulate Ag is restrained by LYN-dependent inhibitory signaling.
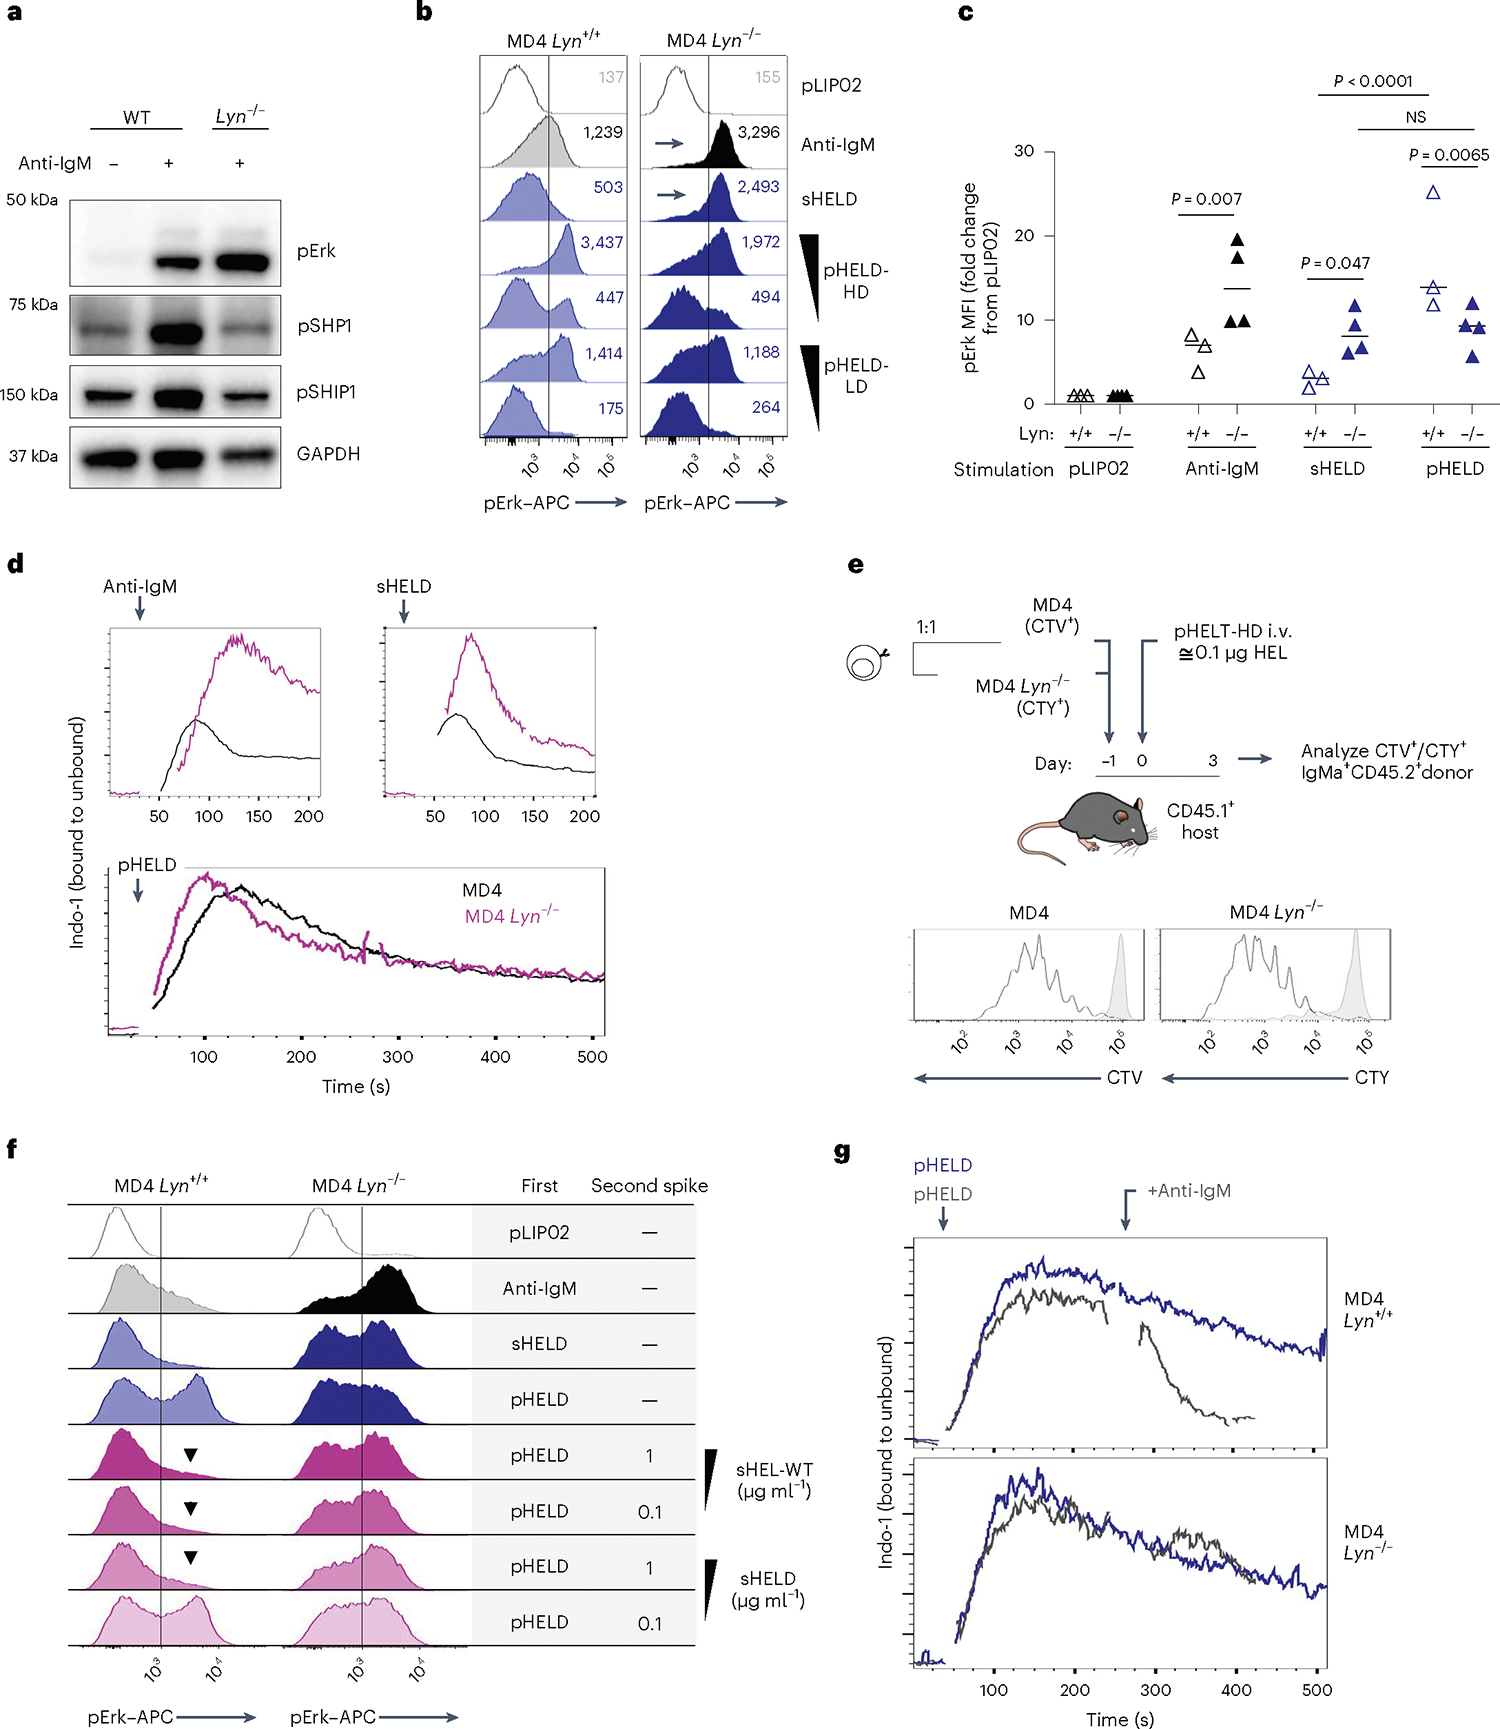
a, Lysates were generated and probed as in Fig. 5a–c except that either wild-type or Lyn−/− polyclonal B cells were stimulated for 3 min with 10 μg ml−1 anti-IgM. The blot is representative of three independent experiments. b, pErk in Lyn+/+ and Lyn−/− MD4 pooled splenocytes and lymphocytes at 20 min after stimulation with control 1 pM pLIP02, 10 μg ml−1 anti-IgM, 1 μg ml−1 sHELD or pHELD (HD/LD 286 and 61 ED, respectively, at 1 pM and 0.1 pM doses). The inset values represent MFI. Histograms depict CD23+ B cells and are representative of eight independent experiments. c, Data in b pooled from three (MD4) or four (MD4 Lyn−/−) independent experiments. Groups were compared by one-way ANOVA with uncorrected Fisher’s least significant difference test. Mean values are shown. d, Lyn+/+ and Lyn−/− MD4 pooled lymphocytes and splenocytes were loaded with Indo-1 calcium indicator dye and stained to detect B cell subsets, and stimuli as in b were added except pHELD-HD (ED of 289, 1 pM). Calcium entry was assessed by flow cytometry for the indicated times as in Fig. 2e,f. Plots depict the geometric mean of the ratio of bound to unbound Indo-1 fluorescence over time in CD23+ B cells. Data are representative of five independent experiments. e, As in Extended Data Fig. 3b–g, MD4 lymphocytes were loaded with CTV and MD4 Lyn−/− lymphocytes were loaded with CTY and co-transferred at a 1:3 ratio followed by pHEL immunization. Representative histograms depict IgMa+ donor B cells at 72 h overlayed on IgMa+ donor B cells from unimmunized hosts (gray-shaded histograms). See Extended Data Fig. 4e–h for gating and quantification. f, Splenocytes from Lyn+/+ and Lyn−/− MD4 mice were incubated with the first stimulus at 4 °C for 15 min, followed by a second add-in stimulus (or medium) for another 15 min at 4 °C. Cells were then incubated for 20 min at 37 °C and assessed for pErk. First stimuli were as in b except with 5 pM pHELD (ED of 289). The second stimulus is as noted. Histograms depict B220+ cells and are representative of four independent experiments. g, As in d except with the addition of 10 μg ml−1 anti-IgM following pHEL stimulation at the indicated times (gray kinetic curve). Data are representative of three independent experiments.
To test the hypothesis that pHEL evades engagement of inhibitory co-receptors, we generated MD4 B cells deficient for LYN to selectively eliminate all ITIM-dependent signaling. In the absence of LYN, anti-IgM- and sHEL-induced pErk and calcium entry was markedly amplified (Fig. 6b–d). By contrast, no amplification of pHEL signals could be detected in the absence of LYN, irrespective of affinity, ED or dose titration (Fig. 6b–d and Extended Data Fig. 4a–d). Unlike soluble stimuli, pHEL signaling is rather dampened in MD4 Lyn−/− B cells relative to MD4 cells, suggesting that LYN kinase itself is engaged by particulate Ag, but inhibitory substrates are selectively evaded (Fig. 6c and Extended Data Fig. 4a–d). LYN constrained the duration of sHEL-induced calcium signaling but did not alter prolonged kinetics following pHEL stimulation (Fig. 6d). This indicates that the evasion of LYN-dependent inhibitory tone by pHEL (but not sHEL) accounts, in large part, for the remarkable potency and prolonged kinetics of pHEL in LYN-sufficient B cells.
Next, we explored whether LYN-dependent pathways constrain B cell responses to pHEL in vivo. We observed highly robust expansion of both LYN-sufficient and LYN-deficient MD4 B cells with modestly enhanced expansion of LYN-deficient B cells by approximately one additional cell division 3 d after immunization (Fig. 6e and Extended Data Fig. 4e–h).
Soluble Ag dominantly suppresses SVLS signaling via LYN
Our data suggest that LYN-dependent inhibitory pathways are evaded by pHEL but not soluble stimuli. We next sought to test whether forced engagement of LYN-dependent inhibitory pathways by soluble stimuli is sufficient to suppress pHEL signaling. We developed an assay in which pHEL was prebound to MD4 B cells at 4 °C (to forestall signaling), followed by subsequent introduction of soluble stimuli. Treatment of pHEL-bound cells with sHEL was sufficient to suppress pErk, and this suppression required LYN (Fig. 6f and Extended Data Fig. 5a). Such suppression by sHEL was both affinity and dose dependent. Importantly, this suppression was not merely due to competition for receptor binding as anti-IgM treatment also suppressed pHEL, yet neither engages IgD BCRs nor competes with HEL epitope for binding of the Hy10 IgM BCR (Extended Data Fig. 5a).
We next sought to determine whether soluble stimuli (via LYN engagement) could terminate signaling after initiation. We adapted a flow-based calcium assay to trigger cytosolic calcium increases with pHELD and subsequently add soluble stimulus once the response has peaked (Fig. 6g and Extended Data Fig. 5b,c). Indeed, following pHEL stimulation, cytosolic calcium remained at maximal levels in a fraction of MD4 B cells, but this signal was rapidly terminated with the addition of soluble stimuli. Importantly, this was completely LYN dependent in the case of anti-IgM and partially LYN dependent for sHELD. These data suggest that signal termination is neither due to displacement of pHEL from BCRs nor due to internalization of BCRs because anti-IgM treatment neither blocks nor removes IgD BCRs from the B cell surface. Instead, we conclude that dominant engagement of LYN-dependent inhibitory signaling by soluble stimuli suppresses B cell responses to particulate Ag.
SVLS induce NF-κB activation that mimics co-stimulation
We noted that NF-κB activation was disproportionately enhanced by pHEL (Figs. 5b and 7a). Either sHEL or anti-IgM only resulted in weak phosphorylation of IKKβ, the catalytic subunit required for its kinase activity and downstream NF-κB translocation to the nucleus53. However, IKKβ was highly phosphorylated in response to pHEL, and, correspondingly, IκBα (the substrate of IKK catalytic activity) was rapidly and robustly degraded in response to pHEL but not soluble stimuli (Fig. 7a–d). This was independent of pHEL Ag affinity but sensitive to ED and dose (Fig. 7b and Extended Data Fig. 6a). Because the degradation of IκBα is required to release p65 to translocate to the nucleus, we isolated nuclei from stimulated B cells and confirmed robust nuclear translocation of p65 following pHEL stimulation (Fig. 7f).
Fig. 7 |. pHEL triggers highly robust NF-κB signaling that mimics co-stimulation.
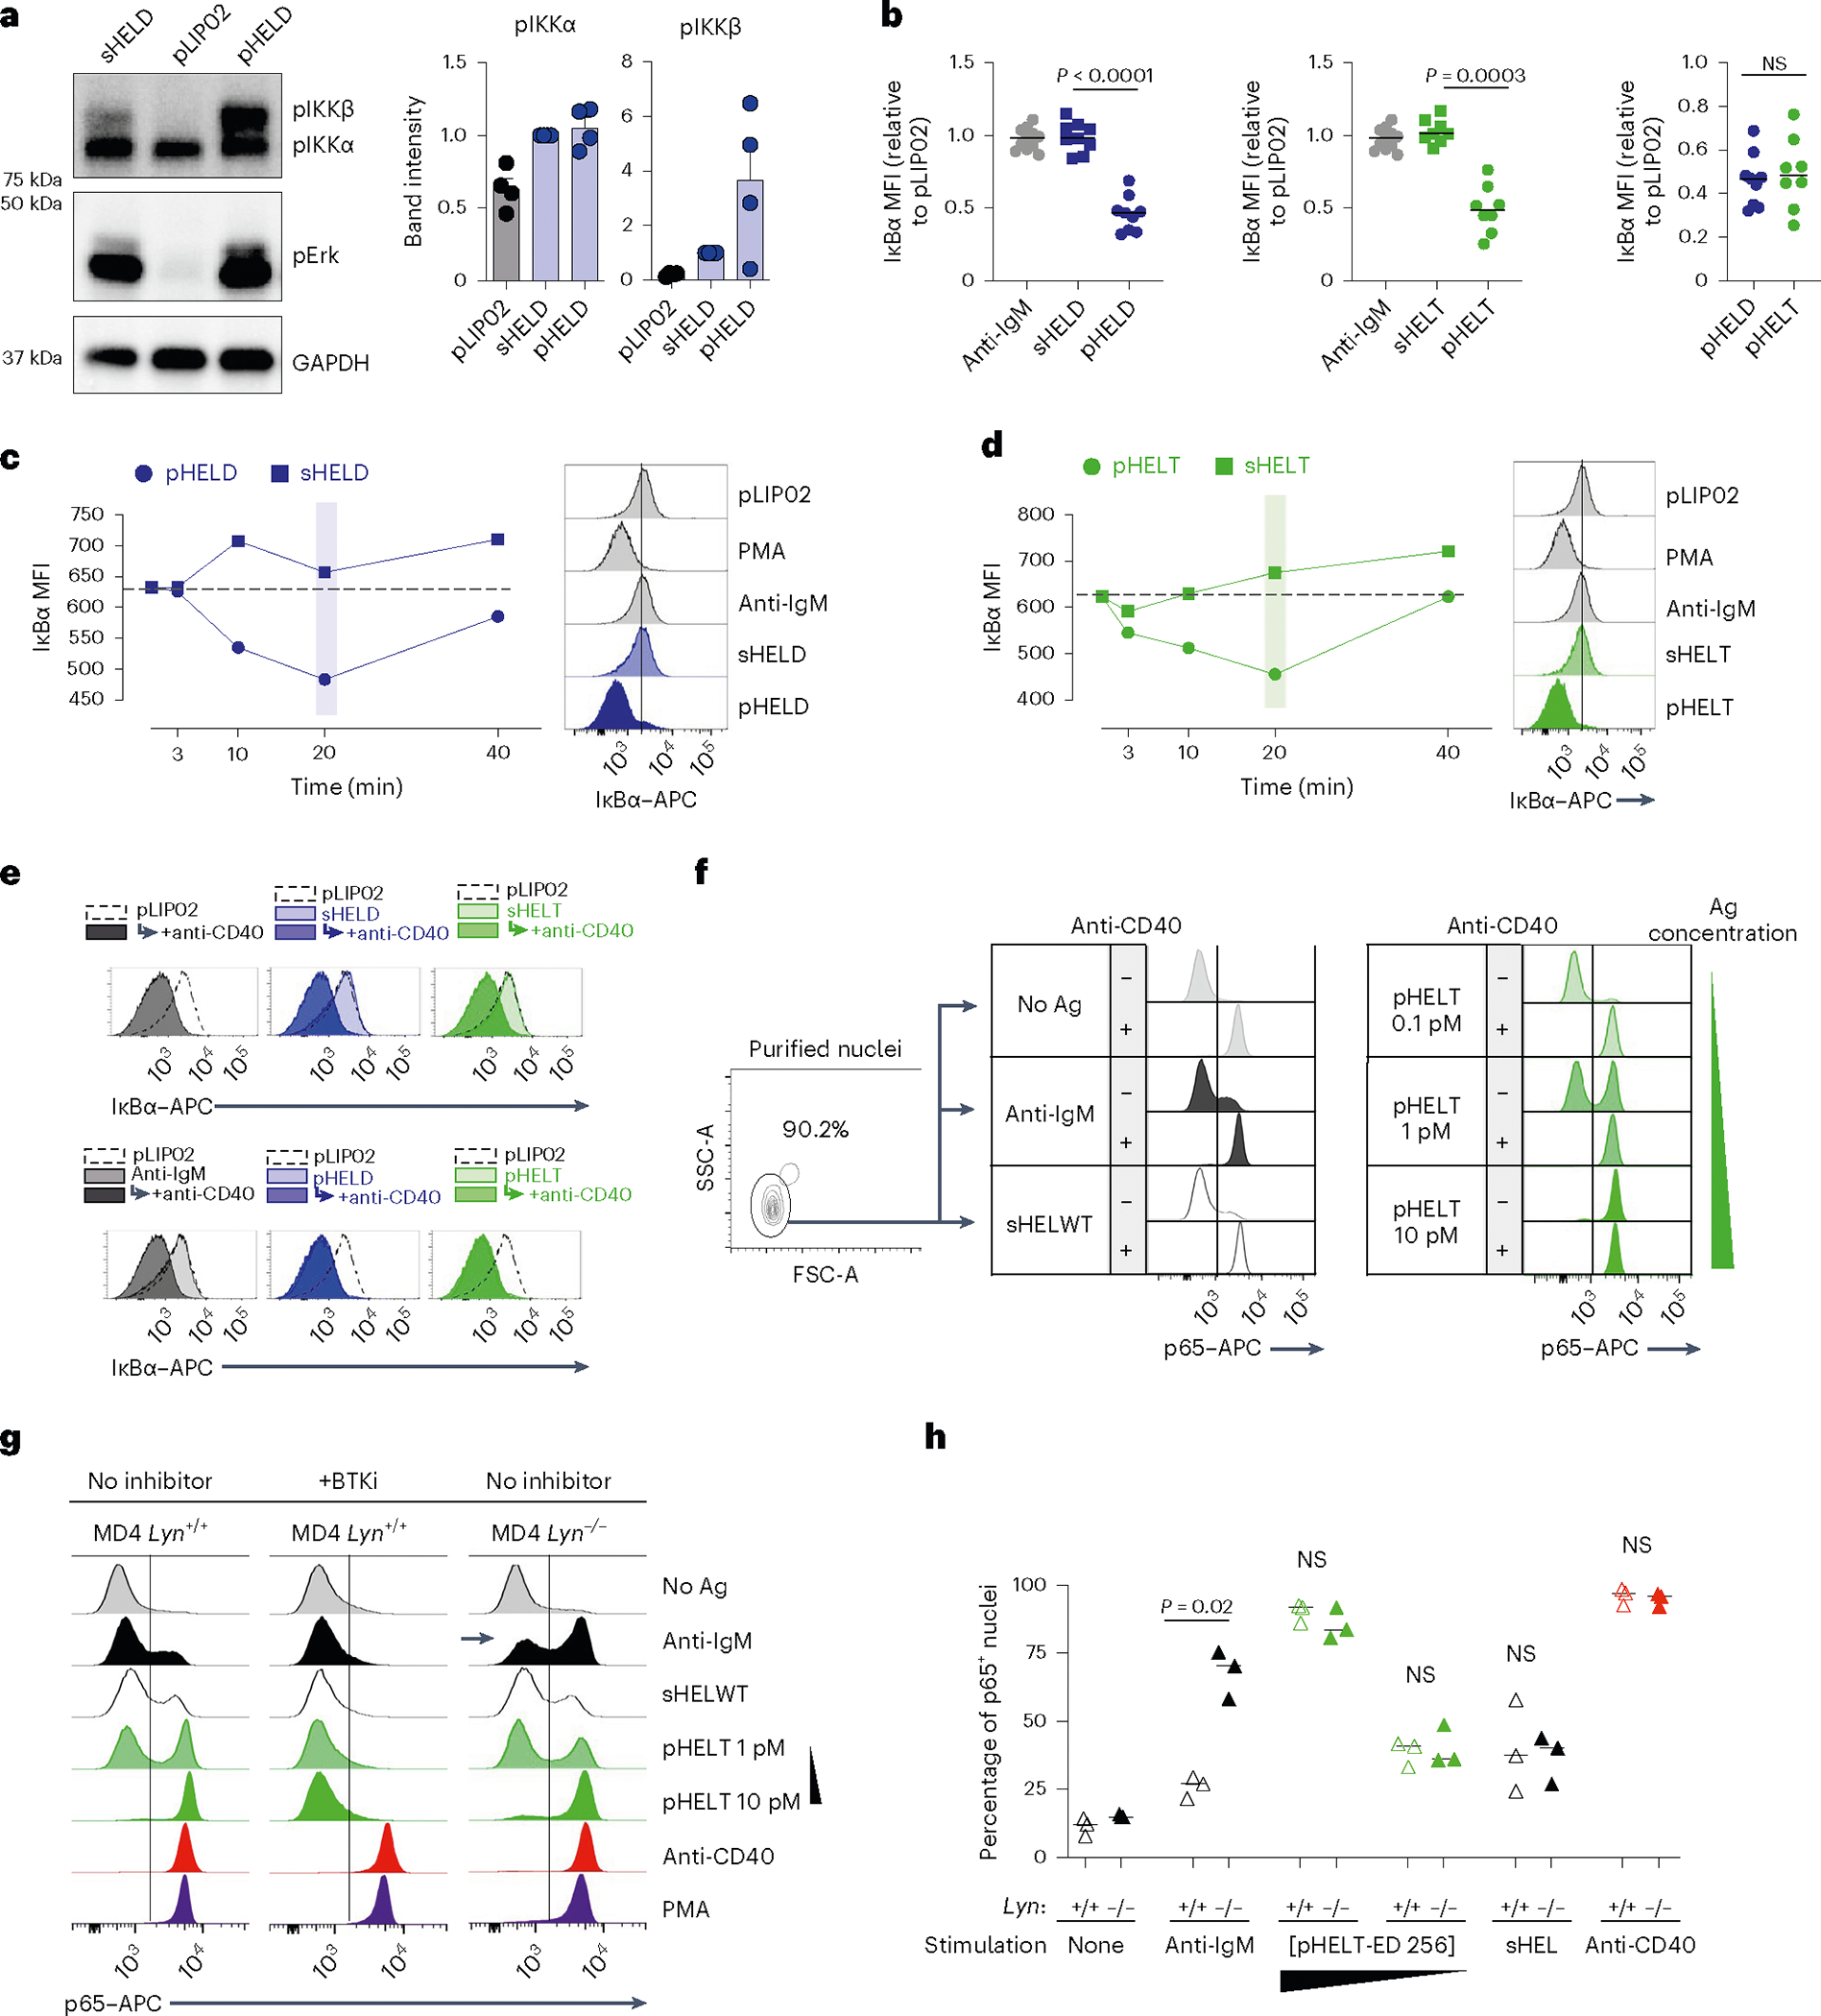
a, Lysates were prepared as in Fig. 5 and were probed for pIKKα/IKKβ, pErk and GAPDH loading control as shown in Fig. 5b. Representative western blot images are shown. Quantification (right) shows band intensity normalized to sHEL for pIKKα and pIKKβ and depicts mean + s.e.m. for n = 4 independent experiments. Groups were compared by paired and unpaired two-tailed parametric t-tests applied to raw unnormalized band intensity (see Source Data for statistical analysis and individual P values). b–d, As in Fig. 2a,b, MD4 splenocytes were stimulated and analyzed by Phosflow for IκBα degradation. Graphs (b) and histograms (c and d) depict IκB MFI in B220+ cells at 20 min. Each data point represents an individual experiment pooled from n = 11 (anti-IgM), n = 9 (HELD) or n = 8 (HELT) independent experiments. Groups were compared by a two-tailed paired parametric t-test. Mean values are depicted. e, B cells purified by negative selection were stimulated for 20 min in the presence or absence of anti-CD40 (1 μg ml−1) as well as anti-IgM (10 μg ml−1), sHELD/sHELT (1 μg ml−1) or pHELD-HD/pHELT-HD (1 pM), and IκBα was measured. The dashed overlay on the histogram shows the internal negative control. Light-shaded histograms show the BCR stimulus condition alone, and dark-shaded histograms show the BCR stimulus condition + anti-CD40. f, As in e, but nuclei were purified following stimulation and interrogated for p65 nuclear translocation. Data in e and f are representative of three independent experiments. g, Nuclear p65 translocation was assessed in stimulated B cells as in f except either MD4 or MD4 Lyn−/− B cells were studied. In addition, stimuli were applied for 20 min following a 15-min preincubation with or without BTK inhibitor (100 nM ibrutinib). Data are representative of two independent experiments for BTK inhibitor pretreatment and for three independent experiments for the MD4 Lyn−/− comparison. h, Data in g are graphed to depict the percentage of p65+ nuclei as gated in g. The graph depicts data from three independent experiments; data were compared by two-tailed paired parametric t-test. Mean values are depicted; [pHELT-ED 256], concentration of pHELT (ED of 256).
To mount an immune response, B cells activated with soluble BCR stimuli require a second signal, such as CD40 ligation delivered by T cells, which strongly activates NF-κB. Because pHEL readily drives highly robust NF-κB activation, we hypothesized that viral Ag display might mimic co-stimulation and bypass the requirement for T cell help. Indeed, immunization with pHEL is sufficient to produce antibody in the absence of T cell help and without adjuvant37. We therefore stimulated B cells with either sHEL or pHEL ± CD40 ligation. As expected, CD40 stimulation triggered robust IκBα degradation and nuclear translocation of p65 both independently and in combination with soluble BCR stimuli (Fig. 7e,f). However, CD40 stimulation produced no additional increase in NF-κB activation when combined with pHEL. Rather, pHEL drives IκBα degradation and p65 nuclear accumulation that is comparable in magnitude to that induced by CD40 cross-linking and is sufficient to convey co-stimulatory-like information. Moreover, pHEL exhibited highly bimodal p65 nuclear translocation in a dose-dependent manner such that even low doses of pHEL induced maximal signal in a subset of cells (Fig. 7f). Interestingly, unlike for pErk and calcium entry (Fig. 6b–d), the genetic absence of LYN did not rescue defects in IκB degradation or p65 nuclear translocation by sHEL but did so in response to anti-IgM (Fig. 7g,h and Extended Data Fig. 6b,c). Conversely, either sHEL or anti-IgM could suppress p65 nuclear translocation in response to pHEL, but only anti-IgM-mediated suppression required LYN (Extended Data Fig. 6d). Importantly, NF-κB activation in response to pHEL was completely dependent on BTK and was independent of MYD88 (Fig. 7g and Extended Data Fig. 6e).
SVLS drive B cell growth, MYC induction and survival
We next analyzed the downstream cellular outcomes of qualitatively distinct signaling by particulate Ag. We found that cell growth was enhanced in response to pHEL relative to sHEL (Fig. 8a). Consistent with the association between cell growth and cMYC upregulation54, we found that pHELT induced higher intracellular MYC expression than maximally potent doses of soluble stimuli and sustained its expression disproportionately to NUR77–GFP upregulation at the same time point (Fig. 8b and Extended Data Fig. 7a). Consistent with robust NF-κB activation and MYC induction, we found that B cell survival was enhanced by pHEL relative to sHEL even with addition of the B cell survival factor BAFF (Fig. 8c) and could be dominantly suppressed by soluble stimuli (Extended Data Fig. 7b). Importantly, pHEL responses were independent of MYD88 (Fig. 8d,e and Extended Data Fig. 7c).
Fig. 8 |. pHEL triggers robust proliferation with a lower NUR77–GFP threshold than soluble stimuli.
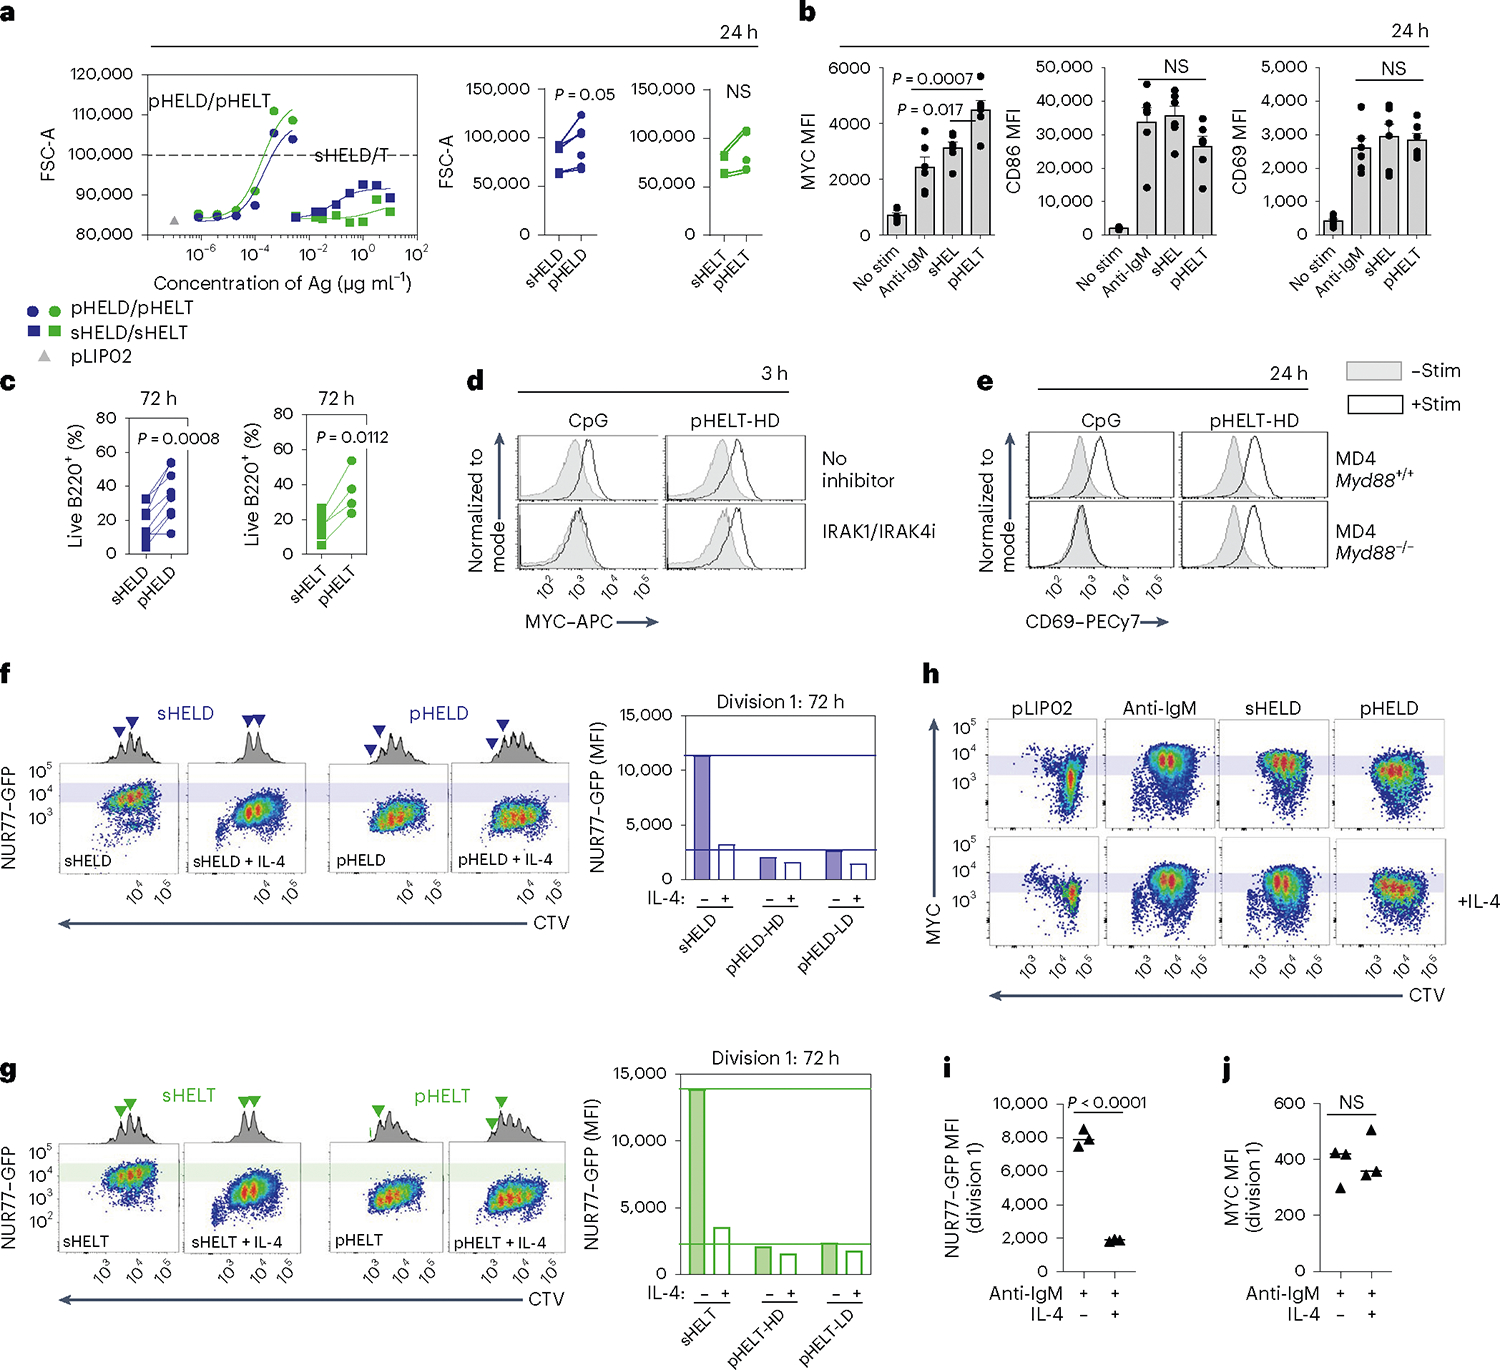
a,b, Pooled splenocytes and lymphocytes from MD4 mice were stimulated for 24 h. a, Dose–response curves for FSC-A MFI of B220+ cells (left) are representative of four independent experiments. Summary data depict 1 μg ml−1 sHELD/sHELT and 1 pM pHELD-HD/pHELT-HD from n = 6 experiments (n = 5 for sHELT) and are compared by two-tailed paired parametric t-test. b, Mean MFI + s.e.m. of intracellular MYC and surface expression of CD69 and CD86 in B220+ cells pooled from six independent experiments and compared by one-way ANOVA with Tukey’s multiple comparisons test; stim, stimulation. c, Viable frequencies of MD4 lymph node B cells in culture at 72 h with BCR stimuli (as in a) + BAFF. Data are pooled from n = 8 independent experiments (n = 7 for sHELT and n = 4 for pHELT) and are compared by two-tailed paired parametric t-test. d, As in Fig. 4a, but cells were treated with IRAK1/IRAK4 inhibitor and the indicated stimuli (2.5 μM CpG and 1 pM pHELT-HD) for 3 h and stained to detect intracellular MYC. Histograms are representative of two independent experiments. e, As in b, except either Myd88+/+ or Myd88−/− MD4 cells were cultured. Histograms are representative of three independent experiments. f,g, MD4 NUR77–GFP reporter lymph node cells were labeled with CTV and cultured as in c with HELD (f) or HELT (g) with stimuli (as in c) for 72 h with BAFF ± IL-4. Histograms show division peaks, and arrowheads denote changes in division peak intensity between IL-4-treated and untreated B220+ cells. Shaded bars in plots reference NUR77–GFP levels in dividing B cells stimulated with soluble Ag. Right, quantification of NUR77–GFP levels in the first division peak. Data are representative of four independent experiments. h, As in f, but cells were stained to detect intracellular MYC. Plots are representative of three independent experiments. i,j, Quantification of NUR77–GFP levels (i) and MYC (j) in the first division peak of polyclonal NUR77–GFP reporter B cells cultured with anti-IgM (6.4 μg ml−1) ± IL-4 as in Extended Data Fig. 7e,h. The graph shows the mean values of three biological replicates compared by two-tailed unpaired parametric t-tests. Data are representative of six independent experiments.
SVLS reduce an NUR77 signaling threshold for division
We previously showed that the NUR77–GFP reporter reveals a sharp T cell antigen receptor signaling threshold required for cell division55. Here, we show that the reporter reflects an analogous threshold in B cells stimulated through the BCR, and this is not altered by dose or affinity of soluble BCR stimuli (Extended Data Fig. 7d). Instead, this threshold can be markedly lowered by the addition of a co-stimulatory signal like interleukin-4 (IL-4; Extended Data Fig. 7e). Consistent with the hypothesis that pHEL may mimic co-stimulation, we found that the NUR77–GFP level among dividing B cells stimulated with pHEL was tenfold lower than in cells stimulated with sHEL (Fig. 8f,g and Extended Data Fig. 7f). Indeed, the addition of IL-4 co-stimulation does not synergize with pHEL stimulation (Fig. 8f,g), suggesting that the pHEL BCR signal alone is sufficient to mimic the effect of co-stimulation.
MYC imposes a minimal invariant threshold for B cell proliferation54,56 that is unaltered by co-stimulation (Fig. 8h–j and Extended Data Fig. 7g,h). Efficient and sustained induction of MYC relative to NUR77 by pHEL (Extended Data Fig. 7a), even in the absence of co-stimulation, may contribute to the T cell independence of this mode of Ag display. By contrast, we propose that soluble Ag stimuli require co-stimulatory second signals to sustain MYC protein expression.
SVLS can partially activate anergic B cells
We next took advantage of a well-studied model of B cell tolerance; Hy10 BCR transgenic B cells that develop in hosts expressing sHEL as a self-Ag (MD4.ML5) exhibit canonical features of anergy, including IgM downregulation and suppressed proximal BCR signal transduction35,57. Both soluble stimuli and pHEL triggered dampened responses in anergic MD4.ML5 B cells relative to naive MD4 B cells (Extended Data Fig. 8a). However, bimodal calcium increases triggered by pHEL in anergic B cells were nevertheless more robust and considerably more prolonged than maximal soluble stimulation of naive MD4 B cells (Extended Data Fig. 8a,b). Indeed, increased amplitude and duration of cytosolic calcium increases can in turn activate transcriptional pathways such as NF-κB that are normally suppressed in anergic B cells58,59. Consistent with this, we found that MYC induction and cell growth triggered by pHEL were relatively more robust (Extended Data Fig. 8c,d) coupled with markedly enhanced survival and proliferation (Extended Data Fig. 8e–g). This suggested that a fraction of even deeply anergic B cells could be ‘reawakened’ by virus-like Ag display (Extended Data Fig. 9).
Discussion
It remains widely accepted that multivalent Ags induce potent B cell responses by virtue of a high-avidity interaction and receptor cross-linking. We reveal that this does not fully explain remarkable sensitivity of B cells to virus-like Ag display. Rather, we show that SVLS trigger signal amplification downstream of the BCR that is due, at least in part, to complete evasion of inhibitory co-receptor engagement but does not require CD19, in contrast to membrane Ag48,49.
Evasion of inhibitory signaling by particulate Ag lowers the threshold for activation relative to soluble Ag, enabling B cells to sense and respond to low-affinity epitopes. Reducing the dose of SVLS decreases the fraction of B cells that signal, but the amplitude of response is unaltered. This observation suggests that even a small number of particles with virus-like Ag display may be sufficient to trigger maximal signaling in a single B cell and implies signal amplification downstream of BCR engagement by particulate Ag. It will be interesting to rigorously identify the minimal number of SVLS required to activate a B cell and to test whether signal amplification indeed occurs at the level of PI(3,4,5)P3 accumulation at the membrane, as biochemical evidence suggests.
Many biologically relevant Ags, including particulate Ag, are captured on antigen-presenting cells (APCs) and are presented directly to B cells in vivo24–30. Ag presented on a cell membrane dramatically reduces the threshold of B cell activation in vitro, enabling responses to very low-affinity Ags16–19. Nevertheless, B cells can discriminate ligand affinity in this context12,15,20,21,60. By contrast, we find no evidence of affinity discrimination to SVLS in vitro at the level of any signaling readout. Indeed, maximal ‘all-or-none’ responses on a single-cell level to virus-like Ag display would be expected to preclude affinity discrimination. Moreover, such discrimination very early in the B cell response to bona fide virus is undesirable61. Rather, subsequent capture of virus by germinal center follicular dendritic cells promotes affinity discrimination of membrane Ag62.
Soluble Ag stimuli are highly constrained by LYN-dependent inhibitory pathways, but we show that SVLS entirely evade LYN-dependent inhibitory tone, resulting not only in heightened amplitude but also in markedly prolonged kinetics of signaling. Exclusion of CD22, FcγRIIb and SHP1 has been visualized at the immune synapse of B cells interacting with cell membrane-associated Ag, and enforced FcγRIIb engagement is sufficient to prevent BCR clustering in response to membrane Ag17,22,23. Yet, it remains to be determined whether these pathways are normally engaged at early time points by membrane Ag and may still function to constrain signaling.
Importantly, we show that superimposed stimulation with soluble antigenic stimuli is sufficient to prevent and/or terminate SVLS-induced signaling, and this is at least partly LYN dependent. This shows that forced engagement of LYN-dependent inhibitory signaling pathways can dominantly suppress pHEL responses. One candidate substrate of LYN that may mediate this effect is CD22, which can interact with the IgM BCR and mediates inhibition by recruiting SHP1 (refs. 41,44,52). Indeed, engineered expression of CD22 ligands on HEL-conjugated lipid nanoparticles can fully abrogate BCR signaling63. Whether CD22 alone or other ITIM-containing inhibitory co-receptors also account for LYN-dependent suppression by soluble, but not SVLS, stimuli remains to be determined, along with required effector PTPases.
Notably, surface proteins of viruses are often heavily glycosylated (for example, HIV gp120 or influenza hemagglutinin)64. Because viruses co-opt host glycosylation machinery, the viral glycan shield may mimic self and directly engage inhibitory Siglecs, such as CD22. Ebola virus directs infected host cells to produce a secreted form of its surface glycoprotein in large amounts through transcriptional editing65. We speculate that engagement of inhibitory receptors on B cells by this soluble Ag may dominantly suppress B cell responses to Ebola virus analogous to our model system.
How do SVLS evade LYN-dependent inhibitory co-receptor engagement? Mature naive B cells coexpress IgM and IgD BCRs, which form separate preexisting nanoclusters on resting cells before Ag encounter49,66. Estimates for the size of these nanoclusters (60–240 nm)49,66 overlap with the diameter of viruses found in nature. Such BCR nanoclusters harbor 30–120 molecules of IgD per cluster (corresponding to 6,000–24,000 molecules per μm2) and less densely packed IgM at the lower end of this range49. We postulate that aligning particle size and spacing of epitopes with that of preexisting BCR nanoclusters may maximize BCR engagement and also physically evade inhibitory co-receptor engagement. Naturally occurring viruses have epitope densities that range from 200 to 30,000 molecules per μm2; HIV occupies the lowest end of this spectrum, and this may facilitate its immune evasion32. Conversely, pHELD-HD has 6,000 epitopes per μm2, which in turn corresponds roughly to 10-nm optimal hapten spacing described in the classic ‘immunon’ model and triggers maximally potent B cell responses by even a small number of particles7.
Due to its uniquely flexible hinge region, IgD is more sensitive to multivalent than monovalent Ag, unlike IgM. High IgD expression on mature follicular B cells and on anergic B cells that downregulate IgM may depress responses to soluble Ag but sensitize these populations to viral epitope display34,35,67. Differential IgM and IgD engagement by soluble and particulate Ag could also confer different co-receptor association (for example, CD22 and CD19)14,49,68. Both possibilities should be explored in future work.
Multivalent Ags (and viral Ag display in particular) can trigger T cell-independent B cell responses1. We show that multivalent Ag display on SVLS, independent of MYD88 or T cell co-stimulation, triggers robust NF-κB activation (comparable to that induced by CD40 engagement), sustained MYC expression and enhanced cell growth, survival and proliferation. Highly robust and bimodal NF-κB activation by SVLS may reflect signal amplification downstream of PI(3,4,5)P3 at the level of BTK dimerization and trans-autophosphorylation (Y322)47 as well as positive feedback over CARMA1/IKKβ69. In addition, strong and prolonged calcium signals can activate IKK58,70. Soluble Ag, by contrast, drives much less robust NF-κB activation, triggers apoptosis and exhibits a much higher NUR77–GFP threshold for MYC-dependent proliferation, suggesting not only a quantitative difference but also a qualitative difference in the B cell response to soluble and particulate Ag. Robust and sustained NF-κB and MYC expression may be sufficient to support pHEL-stimulated B cells to grow, survive and proliferate in the absence of T cell input. Conversely, soluble stimuli render B cells highly dependent on T cell help. Similarly, STIM-deficient B cells with reduced calcium signaling exhibit impaired NF-kB signaling and MYC induction that can be compensated for by CD40 signaling71. Importantly, robust responses to SVLS are not restricted to MZ B cells, which play critical roles in early responses to T cell-independent multivalent model Ags40. Rather, the biology we have uncovered is a general property of naive follicular B cells.
Autoreactive BCRs are common in the mature B cell repertoire, and one teleological explanation for their retention is to preserve a reservoir of protective specificities that can respond to cross-reactive viral epitopes under pressure to evolve toward self (near-self hypothesis72). However, such B cells are constrained by anergy to limit the induction of autoimmunity in vivo35,57,59. Yet, self-Ag arrayed on viruses and VLPs can indeed break tolerance8,73–75. How does epitope display on VLPs activate anergic B cells even in the absence of co-stimulation? The BCR signaling circuitry that enforces B cell anergy and dependence on ‘signal 2’ (T cell input) relies on ITIM-dependent inhibitory pathways44. We propose that SVLS may break tolerance by selective evasion of LYN-dependent inhibitory tone. Differential engagement of such inhibitory tone may represent a fundamental mechanism by which self-reactive naive B cells can accurately discriminate the same Ag presented in different forms, enabling anergic cells to remain unresponsive in the face of soluble self-Ag until recruited into an immune response by bona fide viral encounter.
Together, these molecular insights reveal that epitope display on particles of viral size, independent of other viral features such as encapsulated nucleic acids, serves as a stand-alone danger signal by triggering a unique mode of BCR signaling that differs from both typical soluble and membrane-associated Ags. We identify a role for evasion of LYN-dependent inhibitory co-receptors that confers potency to such particles independent of avidity. Our data suggest that mature B cells are intrinsically ‘built’ as a sensor for virus-like supramolecular structures and are poised to mount rapid, potent and initially T cell-independent responses to viral threats to counteract a rapidly dividing foe in the earliest time window before cognate T cell help becomes available.
Online content
Any methods, additional references, Nature Portfolio reporting summaries, source data, extended data, supplementary information, acknowledgements, peer review information; details of author contributions and competing interests; and statements of data and code availability are available at https://doi.org/10.1038/s41590-023-01597-9.
Methods
Mice
NUR77–GFP and IgHEL (MD4) mice were previously described34,35. C57BL/6 and CD45.1+ BoyJ mice were originally from The Jackson Laboratory. Lyn−/− mice were previously described51. Myd88tm1.Defr (Myd88−/−; The Jackson Laboratory, 009088) mice encode a deletion of exon 3 (ref. 76). Cd19tm1(Cre)Cgn (Cd19−/−; The Jackson Laboratory, 006785) mice have the gene encoding Cre recombinase inserted into the first exon of the Cd19 gene, thus abolishing Cd19 gene function77. ML5 mice (The Jackson Laboratory, 002599) that express the sHEL transgene were previously described35. All strains were fully backcrossed to the C57BL/6J genetic background for at least six generations. Mice of both sexes were used at 6–9 weeks of age for all functional and biochemical experiments. All mice were housed in a specific pathogen-free facility at University of California, San Francisco, according to the University Animal Care Committee and National Institutes of Health (NIH) guidelines. The study received ethical approval from the University of California, San Francisco, Institutional Animal Care and Use Program (protocol number AN185859).
SVLS synthesis and quantification
All SVLS used throughout this study were prepared following protocols previously described by us31. In brief, SVLS were constructed using non-immunogenic lipids, with phosphatidylcholine and cholesterol comprising ≥95% of all lipids. We prepared unilamellar liposomes using a mixture of 1,2-distearoyl-sn-glycero-3-phosphocholine (DSPC), 1,2-distearoyl-sn-glycero-3-phosphoethanolamine-N-[maleimide (polyethylene glycol)-2000] ammonium salt (DSPE−PEG maleimide) and cholesterol (Avanti lipids). Empty liposomes were generated using PBS and extruded membrane with a pore size of 100 nm. HEL recombinant proteins with free engineered cysteines were conjugated to the surface of liposomes via maleimide-thiol chemistry at specific engineered cysteine and programmable ED by modulating the molar percentage of admixed DSPE–PEG maleimide (0.5–5%). A large excess of free cysteines was added at the end of a 1-h cross-linking reaction to quench all of the available maleimide groups that remained on the liposomal surface. After this conjugation, the liposomes were purified away from free excess HEL proteins by running through a size-exclusion column. ED was quantified using methods that we established previously31,78 that were also validated by single-molecule fluorescence79,80. Independent batches of SVLS were compared for biological potency to older batches of matched ED using pErk induction and activation marker upregulation. Control SVLS (pLIP02) had no surface protein conjugation. Recombinant HEL-WT, HELD (R73E and D101R) and HELT (R73E, D101R and R21Q) proteins were overexpressed in Escherichia coli and purified to >95% purity following our established protocols31 and are used throughout except soluble HEL-WT from Sigma (1 μg ml−1) used in Figs. 4c,d, 5e,f, 7g,h and 8b and Extended Data Figs. 2f, 6c,d and 7b.
Fluorescent SVLS synthesis
To prepare pHEL encapsulating fluorophores, the lipid thin film was hydrated using a solution of 0.4 mM AF594 NHS ester in PBS that was pretreated with 1.67 mM glycine. After extrusion, the liposomes encapsulating AF594 dye molecules were loaded onto a Sepharose CL-4B gel filtration column to purify liposomes away from excess fluorescent dyes. The eluted liposomal fractions were concentrated by centrifugation through Amicon Ultra-4 centrifugation units (100-kDa cutoff) and mixed with purified HELD protein for conjugation at 20 °C for 1 h. The free protein was removed by running the conjugate mixture through the Sepharose CL-4B gel filtration column a second time. Characterization and validation was performed as described above. In addition, biological potency was assessed by comparing CD69 and NUR77–GFP induction to non-fluorescent pHELD of comparable ED.
Antibodies and reagents
Antibodies for surface markers.
Streptavidin and antibodies to B220 (RA3–6B2), CD19 (1D3), CD21 (7G6), CD23 (B3B4), CD86 (GL-1), CD69 (H1.2F3), CD45.1 (A20), CD45.2 (104) and IgMa (MA-69) were conjugated to biotin or fluorophores (BioLegend, eBiosciences, BD or Tonbo). All commercial surface antibodies were used at a dilution of 1:200.
Antibodies for intracellular staining.
pErk1/Erk2 T202/Y204 monoclonal antibody (clone 194G2, 4377S), pS6 S235/236 monoclonal antibody (clone 2F9, 4856S), IκBα antibody (9242S), NF-κB p65 monoclonal antibody (clone D14E12, 8242S) and cMYC monoclonal antibody (clone D84C12, 5605S) were from Cell Signaling Technologies. Anti-PI(4,5) P2 biotinylated antibody (Z-B045) was from Echelon Biosciences. AffiniPure F(ab′)2 fragment donkey anti-rabbit IgG (H+L) secondary antibody conjugated to allophycocyanin (APC) was from Jackson Immunoresearch.
Antibodies for immunoblotting.
cMYC monoclonal antibody (clone D84C12), pErk T202/Y204 monoclonal antibody (clone 197G2, 4377S), GAPDH antibody (clone 14C10, 3683s), pCD19 Y531 antibody (3571S), pSHP1 Y564 monoclonal antibody (clone D11G5, 8849S), pSHIP1 Y1020 antibody (3941S), pPLCγ2 Y1217 antibody (3871S), pCD79A Y182 antibody (5173S), pSYK Y525/Y526 monoclonal antibody (clone C87C1, 2710S), pBTK Y223 monoclonal antibody (clone D9T6H, 87141S), pPI3K (p85 Y458, p55 Y199) monoclonal antibody (clone E3U1H, 17366S), pAKT T308 monoclonal antibody (clone D25E6, 13038S), pAKT S473 antibody (9271S) and pIKKα/IKKβ S176/S180 monoclonal antibody (clone 16A6, 2697S) were from Cell Signaling Technology. Anti-phospho-tyrosine clone 4G10 was made from a hybridoma and was a gift from the laboratory of A. Weiss (University of California, San Francisco). pCD22 Y822 (mouse Y837) monoclonal antibody (clone Y506, ab32123) was from Abcam. Anti-mouse- and anti-rabbit horseradish peroxidase-conjugated secondary antibodies were from Southern Biotech.
Stimulatory antibodies and reagents.
The following antibodies and reagents were used: goat anti-mouse IgM F(ab′)2 (10 μg ml−1 unless otherwise noted; Jackson Immunoresearch), mouse IL-4 (10 ng ml−1; 214–14, Peprotech), anti-CD40 (1 μg ml−1; clone hm40–3, BD Pharmingen), recombinant mouse BAFF (20 ng ml−1; 2106-BF, R&D), lipopolysaccharide (10 μg ml−1 O26:B6, Sigma) and CpG (2.5 μM ODN 1826, InvivoGen).
Media.
Complete culture medium was prepared with RPMI-1640 + l-glutamine (Corning-Gibco), penicillin–streptomycin l-glutamine (PSG; Life Technologies), 10 mM HEPES buffer (Life Technologies), 55 mM β-mercaptoethanol (Gibco), 1 mM sodium pyruvate (Life Technologies), non-essential amino acids (Life Technologies) and 10% heat-inactivated fetal bovine serum (FBS; Omega Scientific). This medium was used for all in vitro culture and stimulations except for calcium signaling experiments. Calcium flux medium was prepared with RPMI, HEPES, penicillin, streptomycin and l-glutamine (PSG) as described above and 5% fetal calf serum.
Inhibitors.
SYK inhibitor (Bay 61–3606, 1 μM) and PI3K inhibitor (Ly290049, 10 μM) were from Calbiochem, BTK inhibitor (ibrutinib, 100 nM) was from J. Taunton (University of California, San Francisco) and IRAK1/IRAK4 inhibitor (R568, 1 μM) was a gift from Rigel.
Flow cytometry and data analysis
After staining, cells were analyzed on a Fortessa (Becton Dickinson). Data analysis was performed using FlowJo (v9.9.6 and v10) software (Treestar). Proliferative indices ‘division index’, ‘proliferation index’ and ‘percent divided’ were calculated using FlowJo to generate cell division gates using formulas from FlowJo software. Statistical analysis was performed and graphs were generated using Prism v6 (GraphPad Software). Statistical tests used throughout are listed in each figure legend. Student’s paired or unpaired t-tests (two tailed and parametric) were used to calculate P values for all comparisons of two prespecified groups depending on experimental design. An ANOVA was performed when more than two groups were compared to one another. Mean values are plotted, and error bars in graphs represent s.e.m. All statistical tests were two sided. Source Data contain all specific P values and statistical tests used throughout the manuscript.
Intracellular staining to detect pERK, pS6, IκB and cMYC
Stimulations for these assays were performed with 1 × 10⁶–2 × 10⁶ cells per 100 μl final volume. Following in vitro stimulation for different times, 1 × 10⁶–2 × 10⁶ cells per well were resuspended in 96-well plates, stained with fixable LIVE/DEAD dye as described above for overnight time points, fixed in 2% paraformaldehyde (PFA) for 10 min, washed in fluorescence-activated cell sorting (FACS) buffer and permeabilized with ice-cold 90% methanol at −20 °C overnight or for at least 30 min on ice. Cells were then washed in FACS buffer (1× PBS with 2% FCS, 0.5M EDTA and PSG), stained with intracellular antibody (1:80 for all except 1:100 for MYC) for 40 min, washed in FACS buffer and stained for 40 min with APC AffiniPure F(ab′)2 fragment donkey anti-rabbit IgG (H+L) at a dilution of 1:100 along with directly conjugated antibodies to detect lineage and/or subset markers. Samples were washed and refixed with 2% PFA for 15 min.
Intracellular calcium flux
Pooled splenocytes and lymphocytes were loaded with 5 μg ml−1 Indo-1 AM per the manufacturer’s instructions (Life Technologies) and stained with lineage markers B220, CD23 and CD21 for 15 min. Cells were rested at 37 °C for 3 min, and Indo-1 fluorescence was measured by FACS immediately before and after stimulation to determine intracellular calcium. Stimulation was performed with 2.5 × 10⁶ cells per 500 μl final volume.
LIVE/DEAD staining
LIVE/DEAD Fixable Near-IR Dead Cell Stain kit (Invitrogen) reagent was reconstituted as per the manufacturer’s instructions and diluted 1:1,000 in PBS, and cells were stained at a concentration of 2 × 10⁶ cells per 100 μl on ice for 10 min.
Vital dye loading
Cells were loaded with CTV (Invitrogen) as per the manufacturer’s instructions except at 5 × 10⁶ cells per ml rather than 1 × 10⁶ cells per ml. CTY (Invitrogen) was used at the same concentrations for co-adoptive transfer experiments to facilitate tracking of mixed donor genotypes.
In vitro B cell culture and stimulation
Splenocytes or lymphocytes were collected into single-cell suspensions through a 40-μm cell strainer, subjected to red cell lysis using ammonium chloride potassium buffer in the case of splenocytes, with or without CTV loading as described above, and plated at a concentration of 2.5 × 10⁵–10 × 105 cells per 100–200 μl (depending on the specific assay) in round-bottom 96-well plates in complete RPMI medium with stimuli for 1–3 d. In vitro cultured cells were stained to exclude dead cells, as described above, and were stained for surface or intracellular markers for analysis by flow cytometry depending on the assay. Where noted, fixed numbers of counting beads were added to each sample before cytometer collection to calculate absolute number of live B cells.
Adoptive transfer and immunization
Lymphocytes from MD4 lines were collected into single-cell suspensions through a 40-μm cell strainer, loaded with CTV or CTY as noted and either transferred directly or following mixture of CTV- and CTY-loaded genotypes (1:1 mixture for MD4 Cd19+/+ and MD4 Cd19−/−; 1:3 mixture for MD4 Lyn+/+ and MD4 Lyn−/−). Cells (5 × 10⁶) were transferred via tail vein injection into CD45.1+ hosts. The following day, 200 μl of 0.125 nM pHELD-HD or pHELT-HD (EDs of 290 and 243, respectively) in PBS (~0.1 μg of HEL protein) was administered with no adjuvant via tail vein injection. Unimmunized hosts with transferred cells served as controls. Host splenocytes were collected for FACS analysis with LIVE/DEAD indicator and surface marker staining 3 d later.
Immunoblotting
Purified splenic/lymph node B cells (protocol described below) were collected from mice, prewarmed for 15 min at 37 °C and mixed with stimuli in RPMI medium for 3 min at 37 °C. Following stimulation, cells were lysed with 1% NP-40 lysis buffer with protease and phosphatase inhibitors for 15 min at 4 °C and centrifuged for 10 min at 20,000g to remove cellular debris. The supernatants were denatured at 95 °C for 5 min in SDS sample buffer with 2.5% β-mercaptoethanol. Lysates were run on Tris-Bis thick gradient (4–12%) gels (Invitrogen) in MOPS buffer and transferred to PVDF membranes with a Mini-Protean Tetra cell (Bio-Rad). Membranes were blocked for 1 h with 3% bovine serum albumin in Tris-buffered saline with 0.1% Tween 20 detergent (TBST) and probed with the primary antibodies listed above overnight at 4 °C. The next day, membranes were washed three times with TBST for 10 min and incubated with horseradish peroxidase-conjugated secondary antibodies. Blots were developed using a chemiluminescent substrate (Western Lightning Plus ECL, PerkinElmer) and visualized with a ChemiDoc Touch Imaging System (Bio-Rad). Quantification of western blots was performed with Image Lab Software (Bio-Rad).
B cell purification
B cell purification was performed using MACS separation as per the manufacturer’s instructions. In short, pooled spleens and/or lymph nodes were prepared using the B cell isolation kit (Miltenyi) and were purified by negative selection through an LS column (Miltenyi).
Nuclei isolation/nuclear staining
The nuclei isolation protocol was based on a previously published report81.
Nuclei isolation.
In brief, purified splenic/lymph node B cells (protocol described below) were collected from mice and prewarmed in a 96-well plate for 10 min at 37 °C with 1.5 × 10⁶ cells per 100 μl per well in complete medium (RPMI with 10% FBS, penicillin, streptomycin, glutamine, HEPES, β-mercaptoethanol, sodium pyruvate and non-essential amino acids). Cells were stimulated with 100 μl of 2× stimuli for 20 min at 37 °C. Stimulated cells were spun at 300g and 4 °C, and the pellets were immediately resuspended in 250 μl of ice-cold Buffer A (320 mM sucrose, 10 mM HEPES (Life Technologies), 8 mM MgCl2, 1× Roche EDTA-free complete protease inhibitor and 0.1% (vol/vol) Triton X-100 (Sigma-Aldrich)). After 15 min on ice, the plate was spun at 2,000g and 4 °C for 5 min. This was followed by two 250-μl washes with Buffer B (Buffer A without Triton X-100) and centrifugation at 2,000g and 4 °C for 5 min. After the final wash, pellets were resuspended with 200 μl of Buffer B containing 4% PFA (electron microscopy grade; Electron Microscopy Sciences), and nuclei were rested on ice for 30 min for fixation. The nuclei were spun at 2,000g and 4 °C for 5 min, followed by two washes and resuspension in FACS buffer and centrifugation at 1,000g and 4 °C for 5 min to sufficiently pellet nuclei.
Nuclei staining.
Isolated nuclei were washed with 200 μl of Perm buffer (FACS buffer with 0.3% Triton X-100) and spun at 1,000g and 4 °C for 5 min. Isolated nuclei were stained with 50 μl of purified rabbit anti-mouse NF-κB p65 (Cell Signaling, 8242S) diluted 1:100 in Perm buffer for 30 min on ice. The 96-well plate was spun at 1,000g and 4 °C for 5 min and washed with 200 μl of FACS buffer. The nuclei were then stained with 50 μl of anti-rabbit IgG–APC (Jackson Immunoresearch, 711-136-152) diluted 1:100 in Perm buffer for 30 min on ice in the dark. The nuclei were spun at 1,000g and 4 °C for 5 min and washed with 200 μl of FACS buffer. Nuclei were resuspended in 200 μl of FACS buffer and analyzed immediately on a BD Fortessa cytometer.
Dual stimulation
To evaluate the impact of soluble stimuli on pHEL-stimulated lymphocytes (pErk, nuclear p65 or survival), cells were incubated on ice with primary stimulus (pHEL) for 15 min, followed by the addition of a secondary stimulus (sHEL or anti-IgM) for 15 min. The rationale for this approach is to ensure BCR engagement by high-ED pHEL (which is expected to bind with high avidity) before application of soluble stimuli. Cells were then transferred to 37 °C for various durations (20 min; 48 h), followed by further processing for flow-based readouts, as described earlier. Incubation on ice was performed in a volume of 100 μl.
PI(4,5)P2 intracellular staining
Lymphocytes from MD4 mice (1.5 × 10⁶ cells in a 100-μl volume) were rested at 37 °C for 45 min and stimulated with medium, sHEL (1 μg ml−1) or pHEL-HD (10 pM) over a time course ranging from 0.5 to 20 min. Following stimulation, one volume of 2× Cytofix/Perm/Wash buffer (4% PFA + BD Biosciences Perm/Wash buffer) was added to the cells and incubated on ice for 30 min. Cells were washed with Perm/Wash buffer and stained for 45 min with biotinylated IgM antibodies to PI(4,5)P2 (Echelon Biosciences, clone 2C11, Z-B045) diluted 1:50 in Perm/Wash buffer. Cells were then washed with Perm/Wash buffer and subsequently stained for 45 min with streptavidin–PE (1:200) and surface markers (anti-CD4 and anti-B220) in Perm/Wash buffer. Finally, cells were resuspended in FACS buffer for subsequent analysis by flow cytometry. This method was based on prior publications and the manufacturer’s protocol82,83.
Reporting summary
Further information on research design is available in the Nature Portfolio Reporting Summary linked to this article.
Extended Data
Extended Data Fig. 1 |. pHEL SVLS library and in vitro potency.
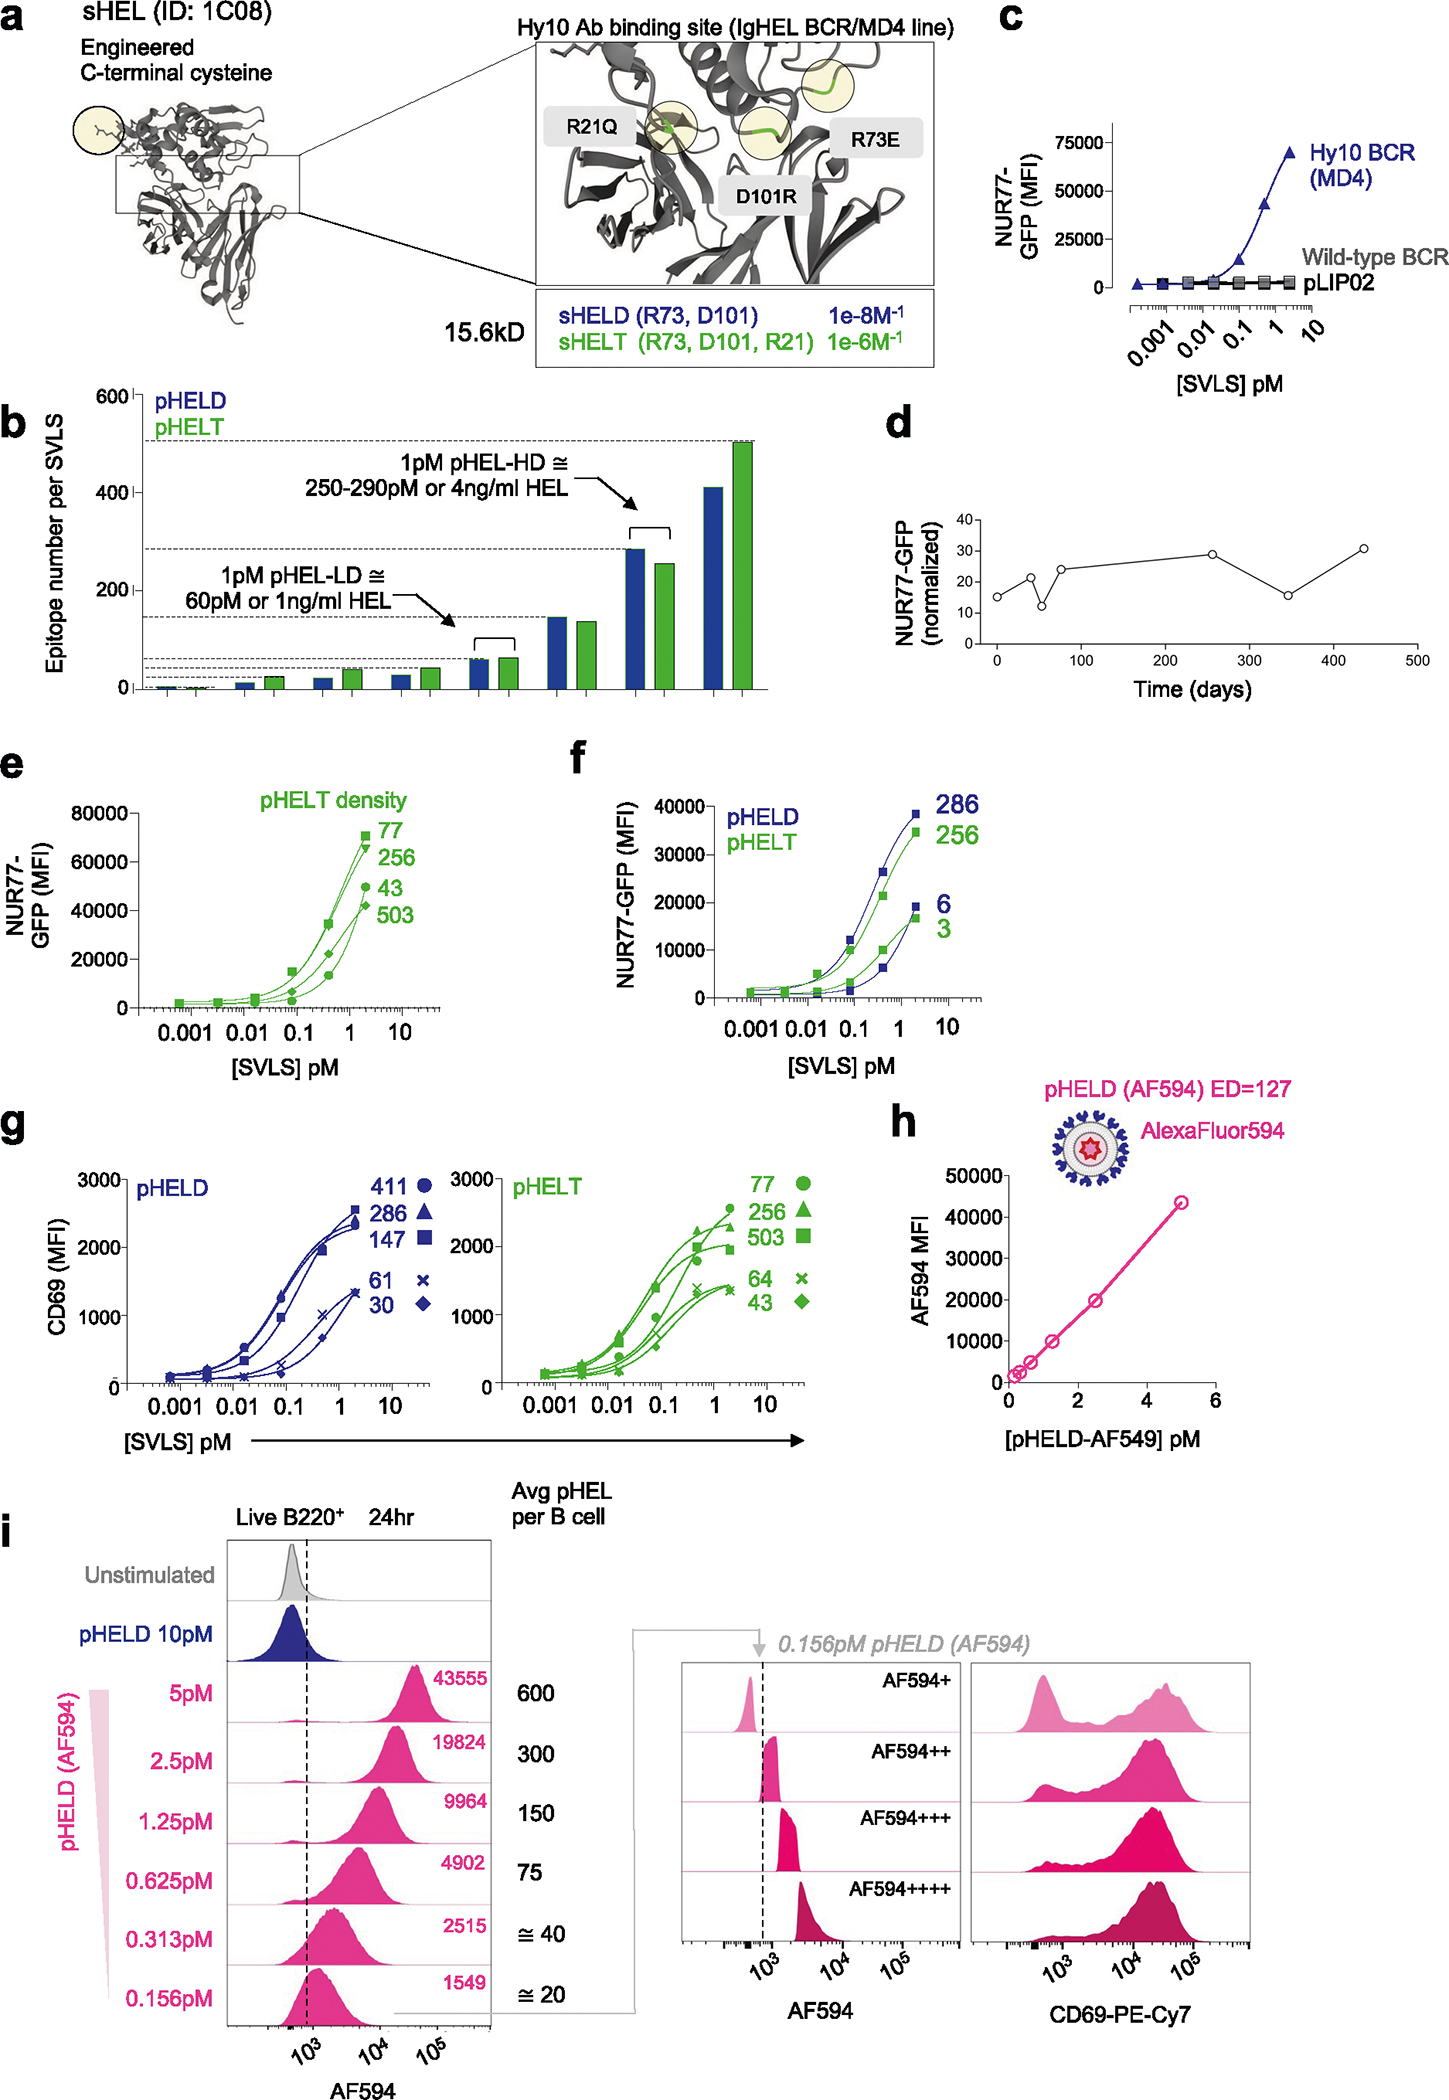
a. Hen egg lysozyme (HEL) engineered with c-terminal cysteine residue and point mutations (zoomed box) described to reduce binding affinity to Hy10 BCR38. b. Schematic of SVLS library constructed with varying densities of HELD or HELT conjugated to liposomes yielding pHELD/T particles (3–500 epitope density/particle, calculated as [HEL]/[lip] in M). Each bar represents a single pHEL preparation to illustrate range. c. Congenically-marked NUR77-GFP reporter MD4 (Hy10) mixed with wild-type splenocytes and stimulated with pHELD or naked control liposome (pLIP02) for 24 hr. GFP was analysed in B220+ cells of each gt as in Main Fig. 1c. d. NUR77-GFP expression was analysed in MD4 B cells at 24 hr post-stimulation with the same batch of pHELD at various times post-synthesis, normalized to the pLIP02 condition in each experiment. e. As in main Fig. 1e but with pHELT at varying ED. Data is from a single experiment and representative of 3 independent experiments. f. As in E, but stimulated with high or ultra-low density pHELD/T. Data is from a single experiment. g. As in E, but depicting CD69 after 24 hr with pHELD/T. Data are from a single experiment and representative of 3 independent experiments. Curves were modelled with three-parameter nonlinear regression (C, E, F, G). h, i. SVLS with HELD conjugated at ED 124 and encapsulated AF594, herein termed pHELD(AF594), mixed at serial dilutions with MD4 cells for 24 hr and analyzed by flow cytometry. H. Quantification of AF594 fluorescence in B220+ lymphocytes. I. Representative histograms (left) depict AF594 fluorescence in B220+ cells. Inset values: AF594 MFI. Average particles/B cell in culture based on concentrations of each. Right-hand histograms depict 0.156pM-stimulated B cells sub-gated according to AF594 fluorescence to represent capture of particles. Data are from a single experiment and representative of 3 independent experiments.
Extended Data Fig. 2 |. pHEL signaling is sensitive to ED but not affinity and is potent in both follicular and MZ B cells.
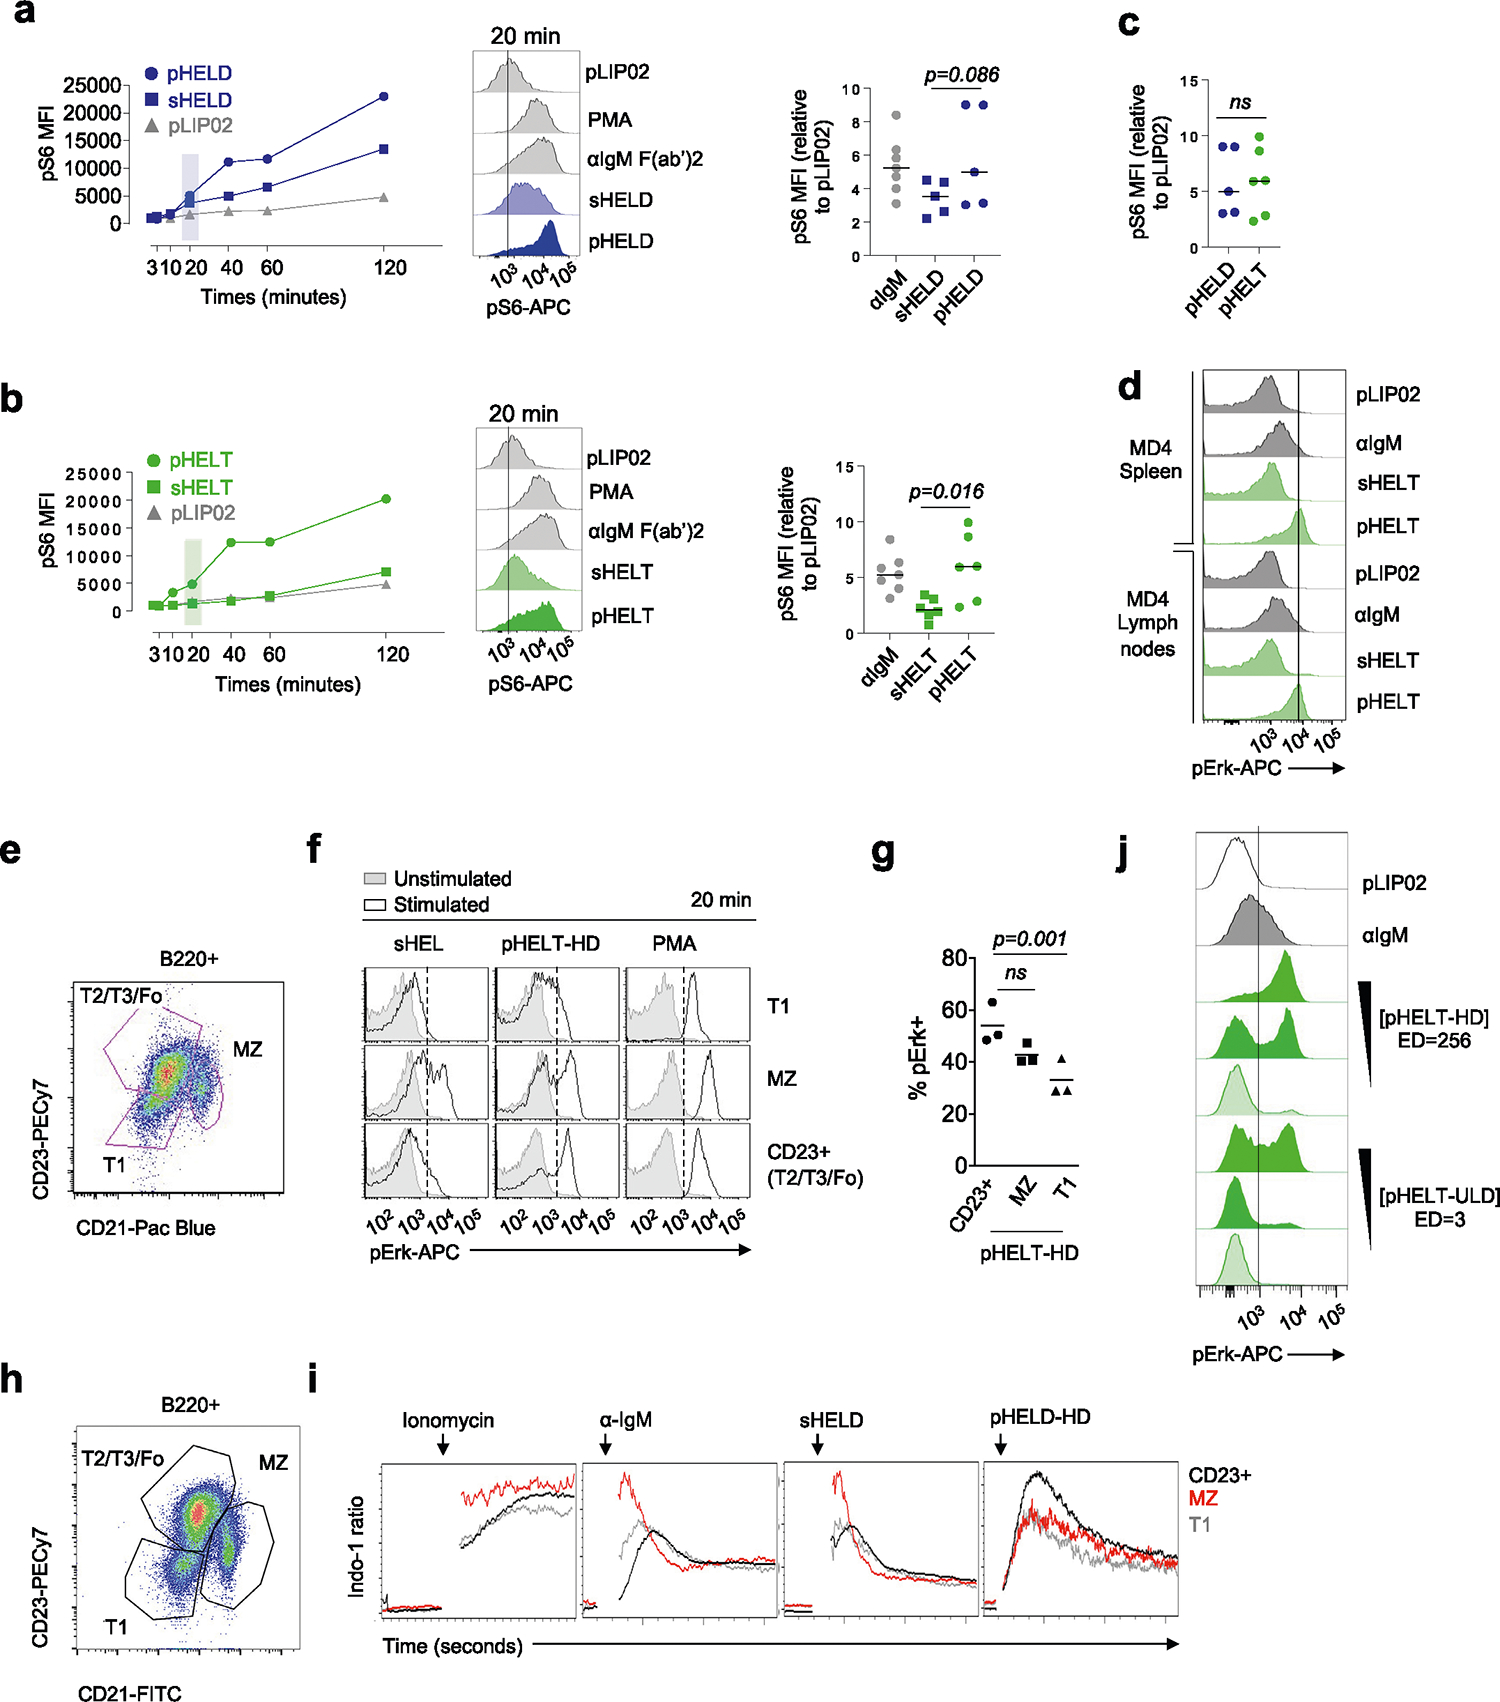
a-c. MD4 splenocytes and lymphocytes were stimulated as in Main Fig. 2A,B but assessed for intra-cellular pS6 over a time course. Graphs (left) and histograms (middle) depict pS6 in B220+ cells from a single time course and is representative of 2 independent experiments. Graphs (right) depict B cell pS6 MFI after 20 min. Data are pooled from n = 5 (HELD), n = 6 (HELT) experiments. C. Graph depicts pHELT and pHELD data from A, B graphed together for comparison. A-C were compared by two-tailed paired parametric T-test, with mean depicted. d. As in 2 A, B but comparing pErk in stimulated B220+ splenocytes and lymph node cells separately at 20 mins. Histograms are representative of 2 independent experiments. e-g. As in 2 A, but splenocytes were stained with B220, CD21, and CD23 to identify pErk expression in subsets. Representative histograms show pErk in gated subsets following sHEL-WT 1 μg/ml, 1pM pHELT-HD (ED 256), or PMA stimulation. F. Quantification and mean of %pErk+ cells from three independent experiments (G). Groups were compared by one-way ANOVA. Data in E-G are representative of 8 independent experiments. h, i. Pooled MD4 splenocytes and lymphocytes were loaded with Indo-1 calcium indicator dye, stained with surface markers to detect B220+ subsets (H) as in S2E, and stimulated with anti-IgM (10 μg/ml), sHELD (1 μg/ml), or pHELD-HD (1pM). Calcium entry was assessed by flow cytometry for >= 3 minutes. MFI of bound/unbound Indo-1 fluorescence over time is plotted (I). Data are representative of 4 independent experiments. J. As in Main Fig. 3a,b except CD23+ B cells stimulated with 10, 1, or 0.1pM doses of either pHELT-HD (ED 256) or pHELT (ED 3). Data are representative of 4 independent experiments.
Extended Data Fig. 3 |. CD19 is dispensable in vitro but promotes B cell expansion in response to particulate Ag in vivo.
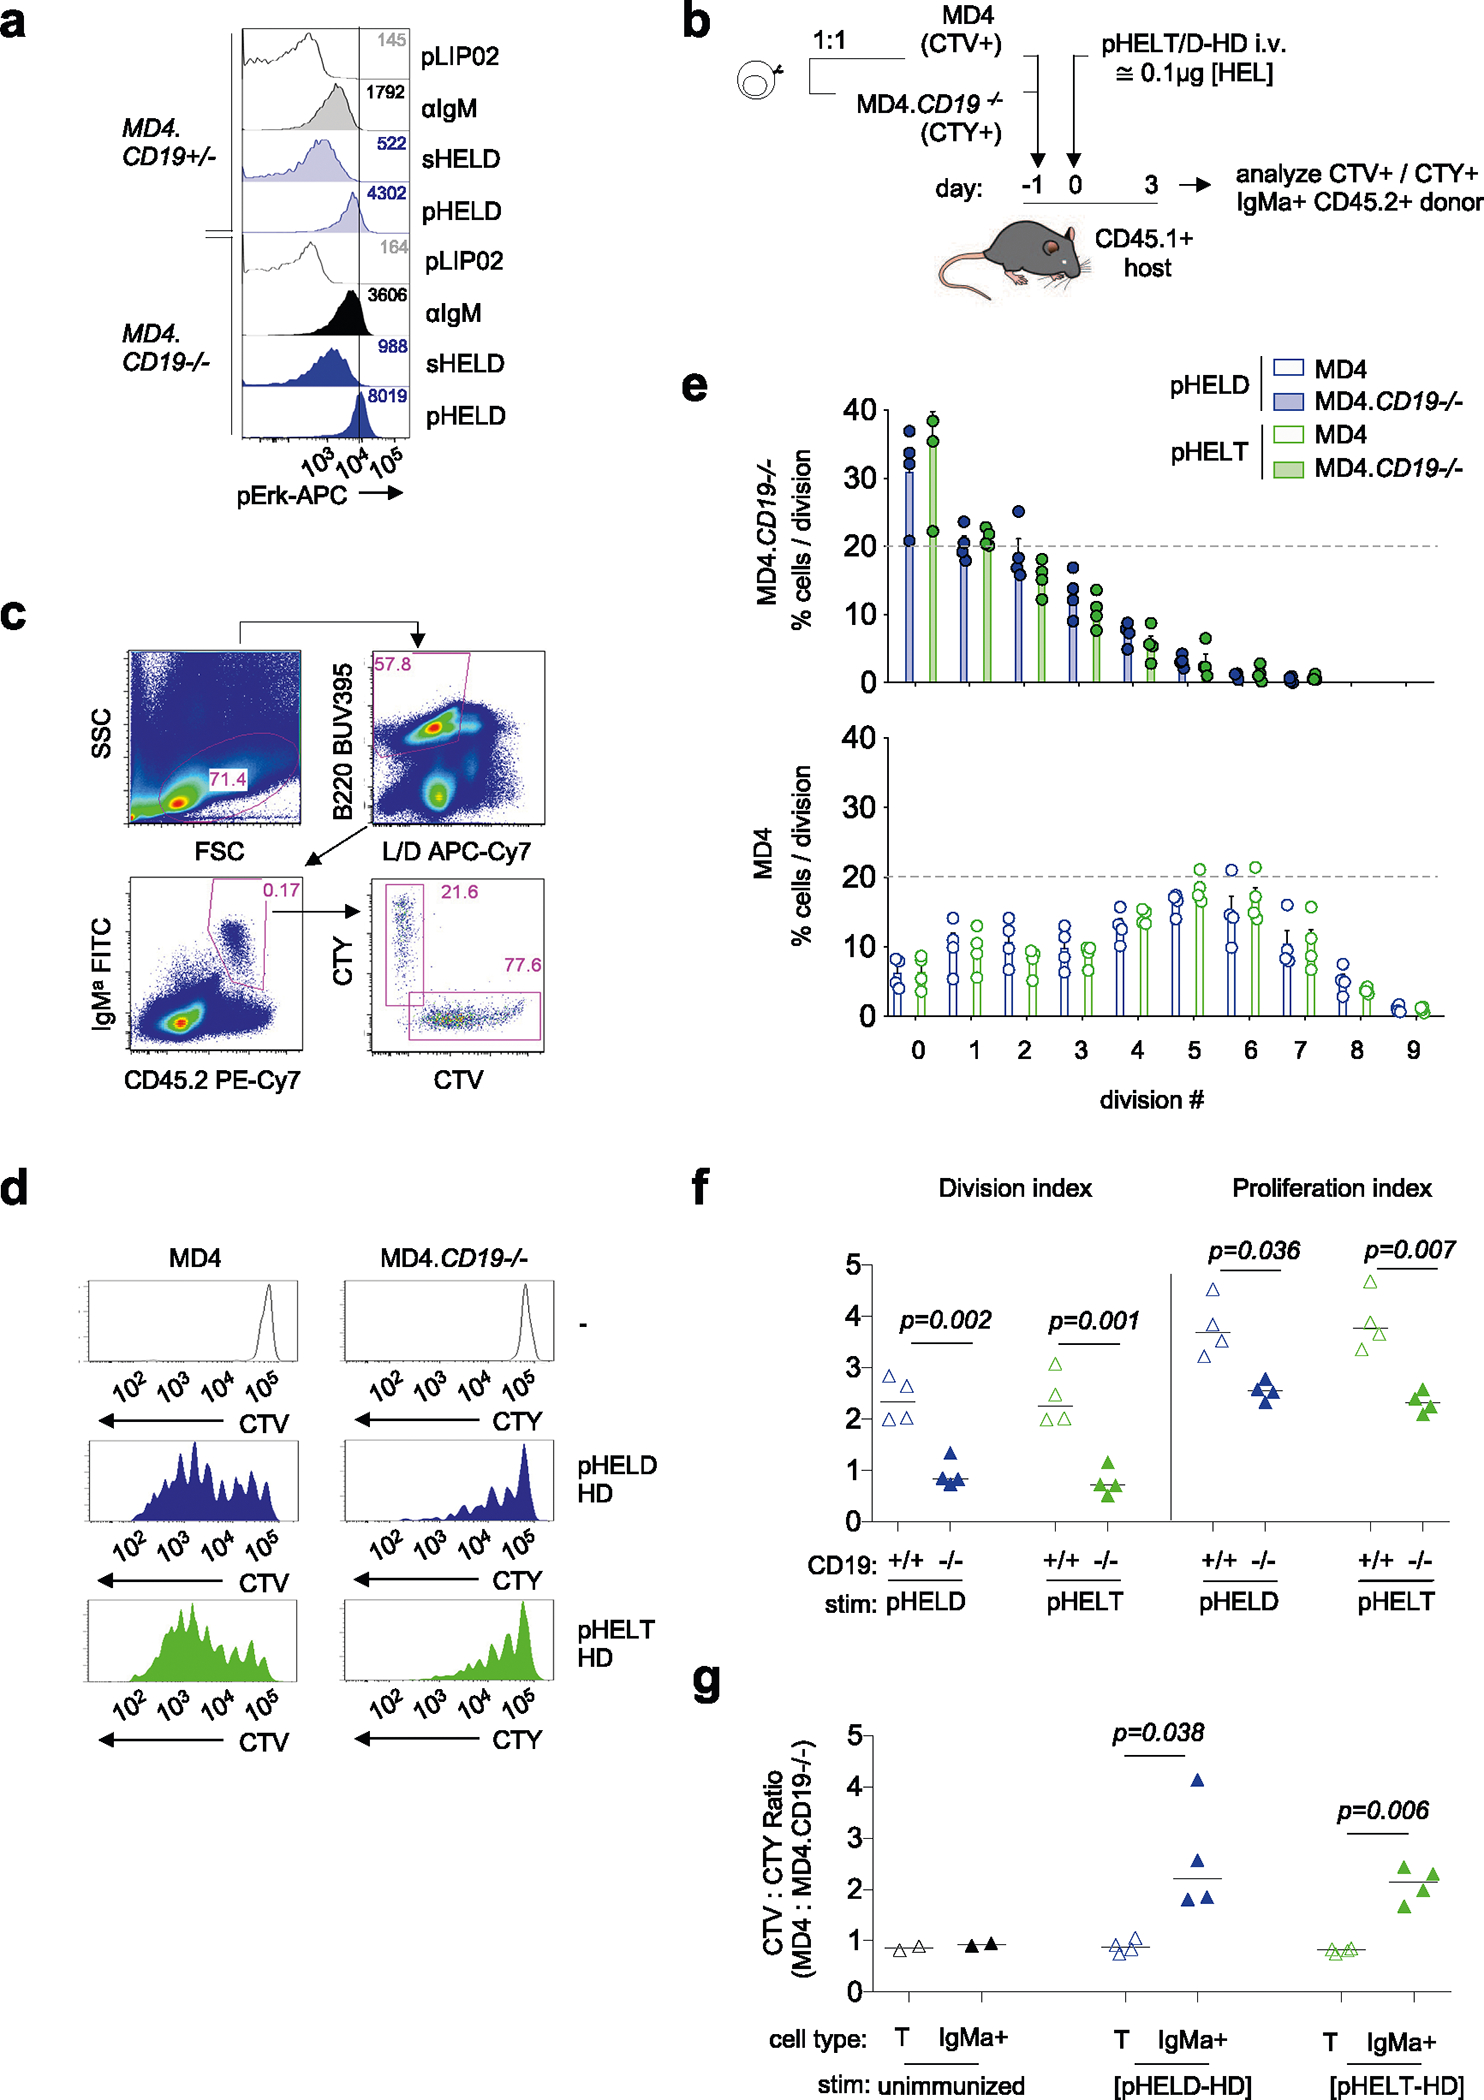
a. 20’ Phosflow assay to detect pErk in Cd19+/– or Cd19–/– MD4 splenocytes after stimulation with either control pLIP02 1pM, 10 μg/ml anti-IgM, 1 mg/ml sHELD, or 1pM pHELD-HD. Samples were co-stained with B220, CD23, and CD21 to detect B cell subsets. Histograms depict CD23+ B cells and are representative of 4 independent experiments. b-g. As in Main Fig. 1i, lymphocytes from MD4 mice were loaded with CTV and those from MD4.CD19−/− mice were loaded with CTY. Cells were mixed at a 1:1 ratio prior to adoptive transfer i.v. of 5 × 10⁶ cells into CD45.1 hosts. Time course, immunization, and d3 harvest as in Fig. 1i. MD4 data correspond to those displayed in Main Fig. 1i–k. b. Experimental schematic. c. Representative gating scheme to identify donor IgM[a]+ B cells with either CTV or CTY fluorescence; L/D, LIVE/DEAD stain. d. Representative histograms depict live IgM[a]+ donor lymphocytes in unimmunized (top) or immunized hosts. e. Graph depicts mean + SEM for % distribution of IgM[a]+ donor B cells of each genotype across cell divisions. Statistical analysis by Two-way ANOVA in supplement. f. Graphs depict division and proliferation indices. g. Ratio of CTV/CTY for donor T cells and IgM[a]+ donor B220+ B cells are plotted for each host according to immunization condition. Data in F and G depict mean of 4 biological replicates and were compared by a two-tailed paired parametric T-test.
Extended Data Fig. 4 |. pHEL evades LYN-dependent inhibition.
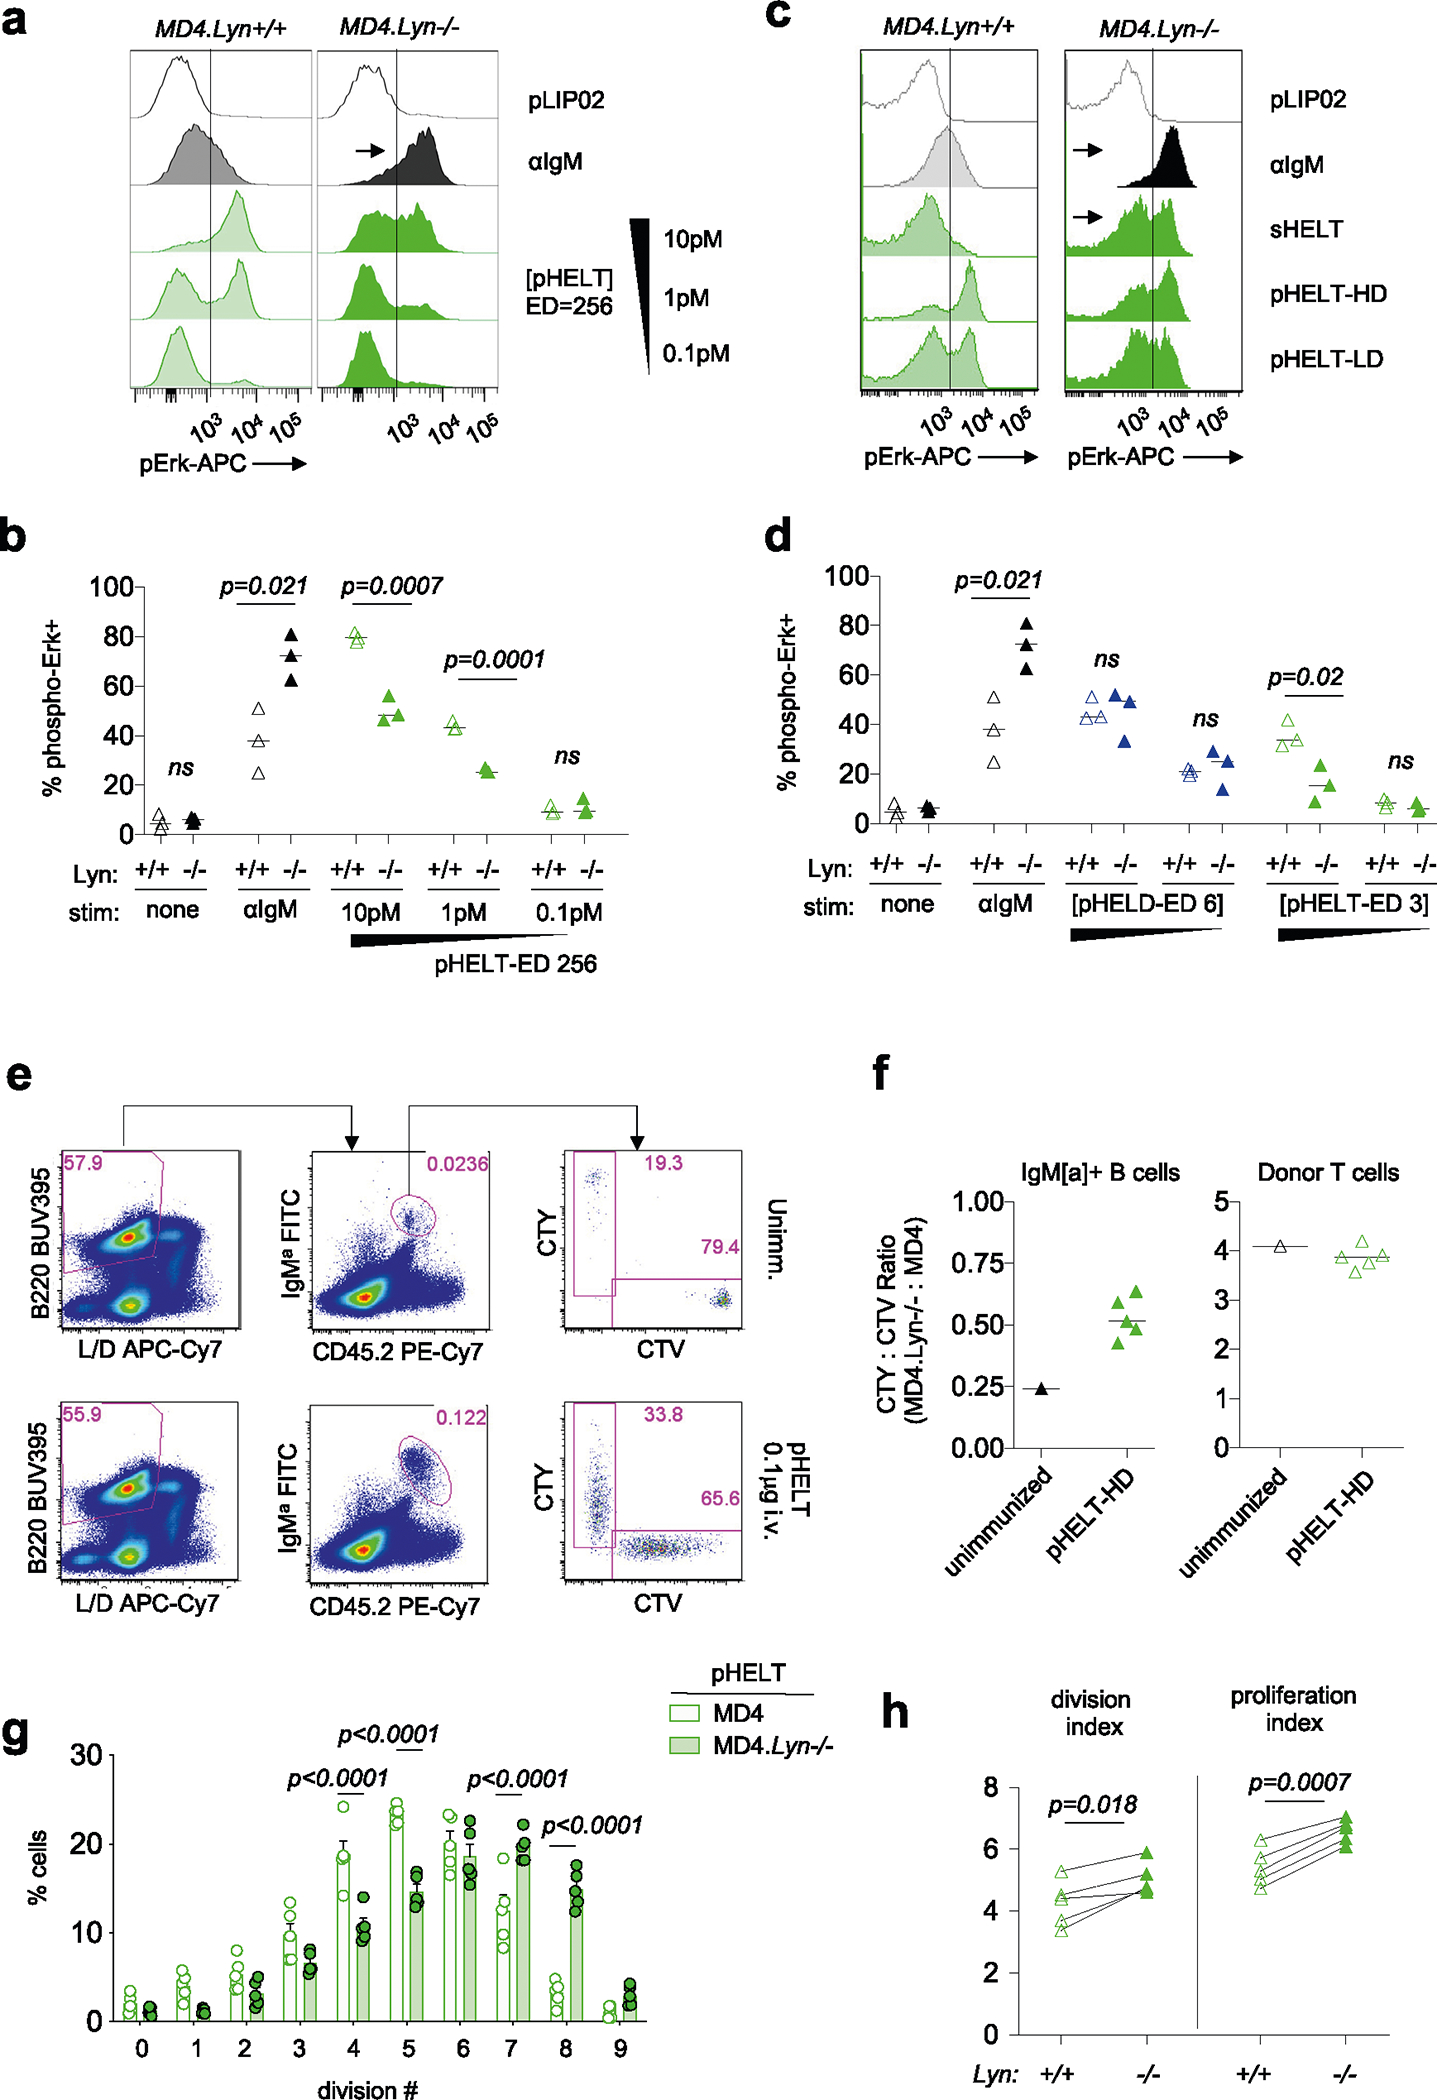
a, b. As in Main Fig. 6b,c but with broader titration of pHELT-HD (ED 256) dose from 0.1–10 pM. Histograms depict pErk in CD23+ B220+ cells. MD4 histograms in A correspond to those depicted in Extended Data Fig. 2j and are representative of 3 independent experiments. c. As in Main Fig. 6b, but with sHELT and pHELT (HD/LD 256, 64) stimuli to compare varied epitope density. Data are representative of 4 independent experiments. d. As in Main Fig. 6b,c, except pHELD ultra-low ED 6 and pHELT ultra-low ED 3 are used at 10 pM and 1 pM doses. Data from unstimulated and anti-IgM conditions are re-plotted from panel B for ease of comparison. Graphs in B and D each depict data from 3 independent experiments with mean. Pre-specified groups were compared by two-tailed unpaired parametric T-tests. e-h. corresponding to Main Fig. 6e, lymphocytes from MD4 mice were loaded with CTV and those from MD4.Lyn−/− mice were loaded with CTY and mixed at a 1:3 ratio for adoptive transfer of 5 × 10⁶ cells into CD45.1 hosts prior to immunization one day later with pHELT-HD ~ 0.1 μg. e. Representative gating scheme to identify live donor IgM[a]+ B220+ cells with either CTV or CTY fluorescence; L/D, LIVE/DEAD stain. f. Ratio of CTV/CTY in donor T cells and IgM[a]+ donor B220+ cells are plotted for each host according to immunization condition with mean depicted. g. Graph depicts mean + SEM for % distribution of IgM[a]+ donor B cells of each genotype across cell divisions and data was compared by two-way ANOVA with Holm-Sidak correction for multiple comparisons. h. Graphs depict division and proliferation indices. Lines connecting samples indicate donor cells of each genotype from an individual host. Groups in H were compared by a two-tailed parametric paired T-test. Data in E-H represents 5 biological replicates.
Extended Data Fig. 5 |. Soluble stimuli dominantly suppress pHEL signaling.
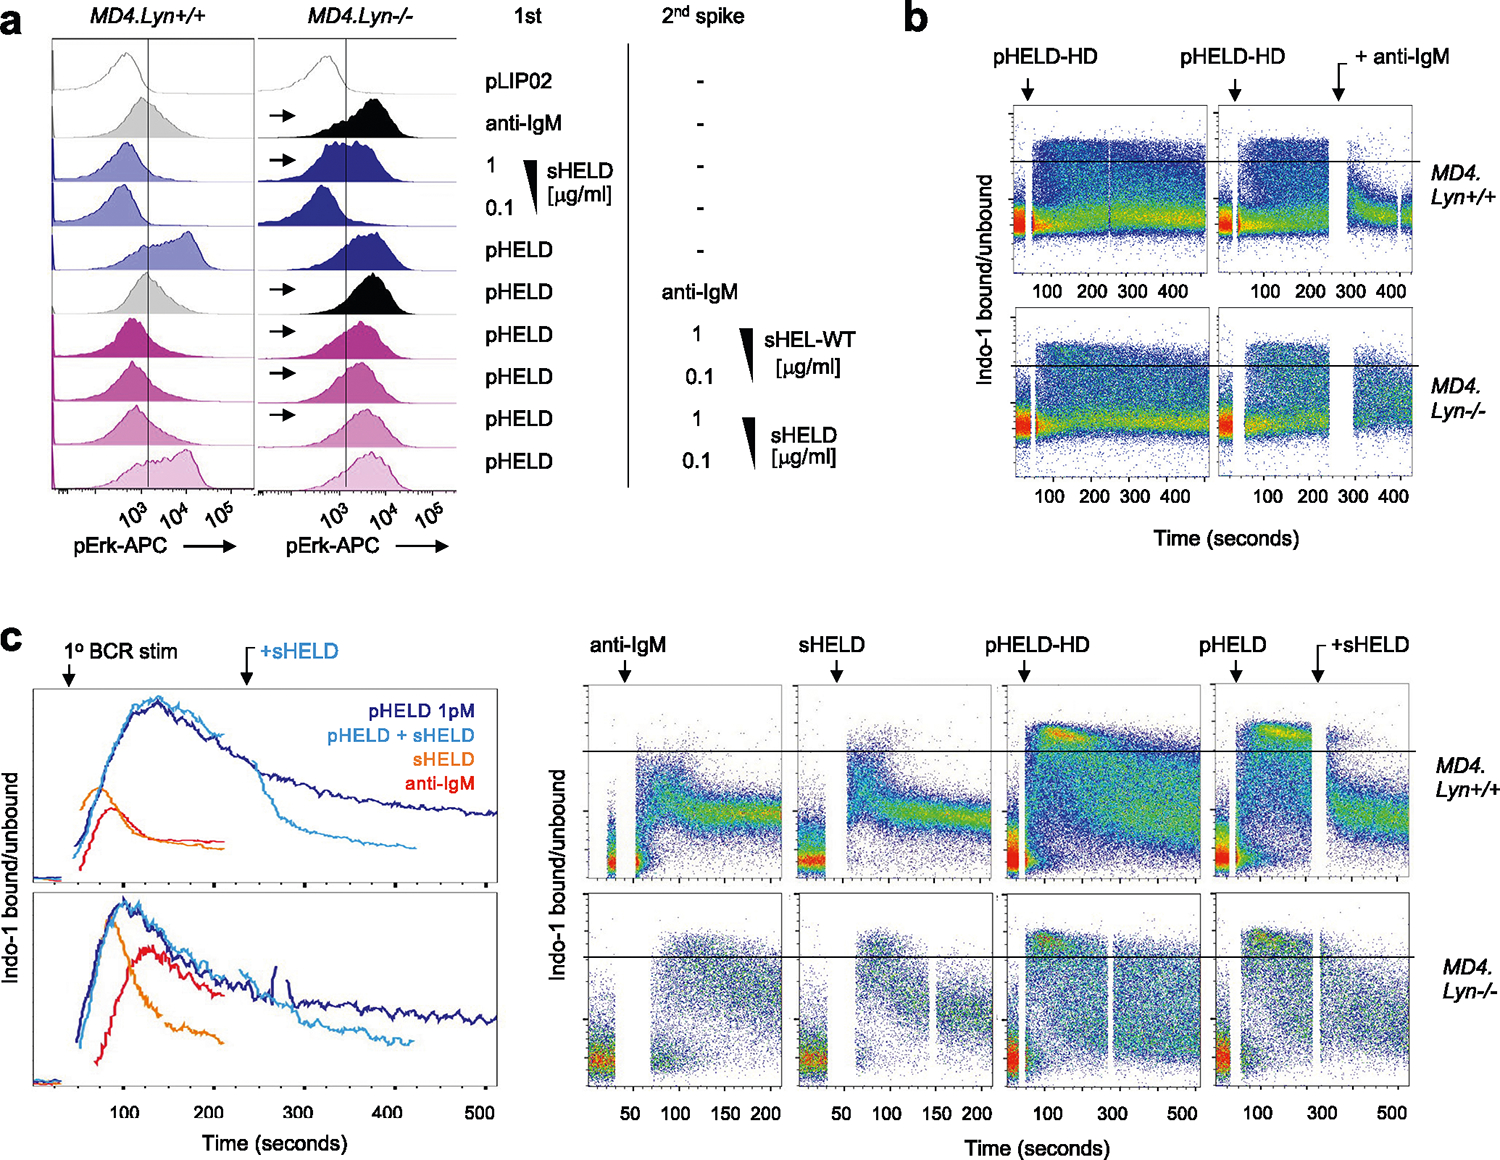
a. As in Main Fig. 6f, but with inclusion of anti-IgM 10 μg/ml as second stimulus following pHELD pre-treatment. Data are representative of 4 independent experiments. b. Data correspond to Main Fig. 6g but depict same samples with single cell resolution. c. As in Main Fig. 6g but with sHEL 1 μg/ml added at peak calcium response following pHEL stimulation. Data are representative of 3 independent experiments.
Extended Data Fig. 6 |. pHEL robustly trigger NF-κB independently of MYD88.
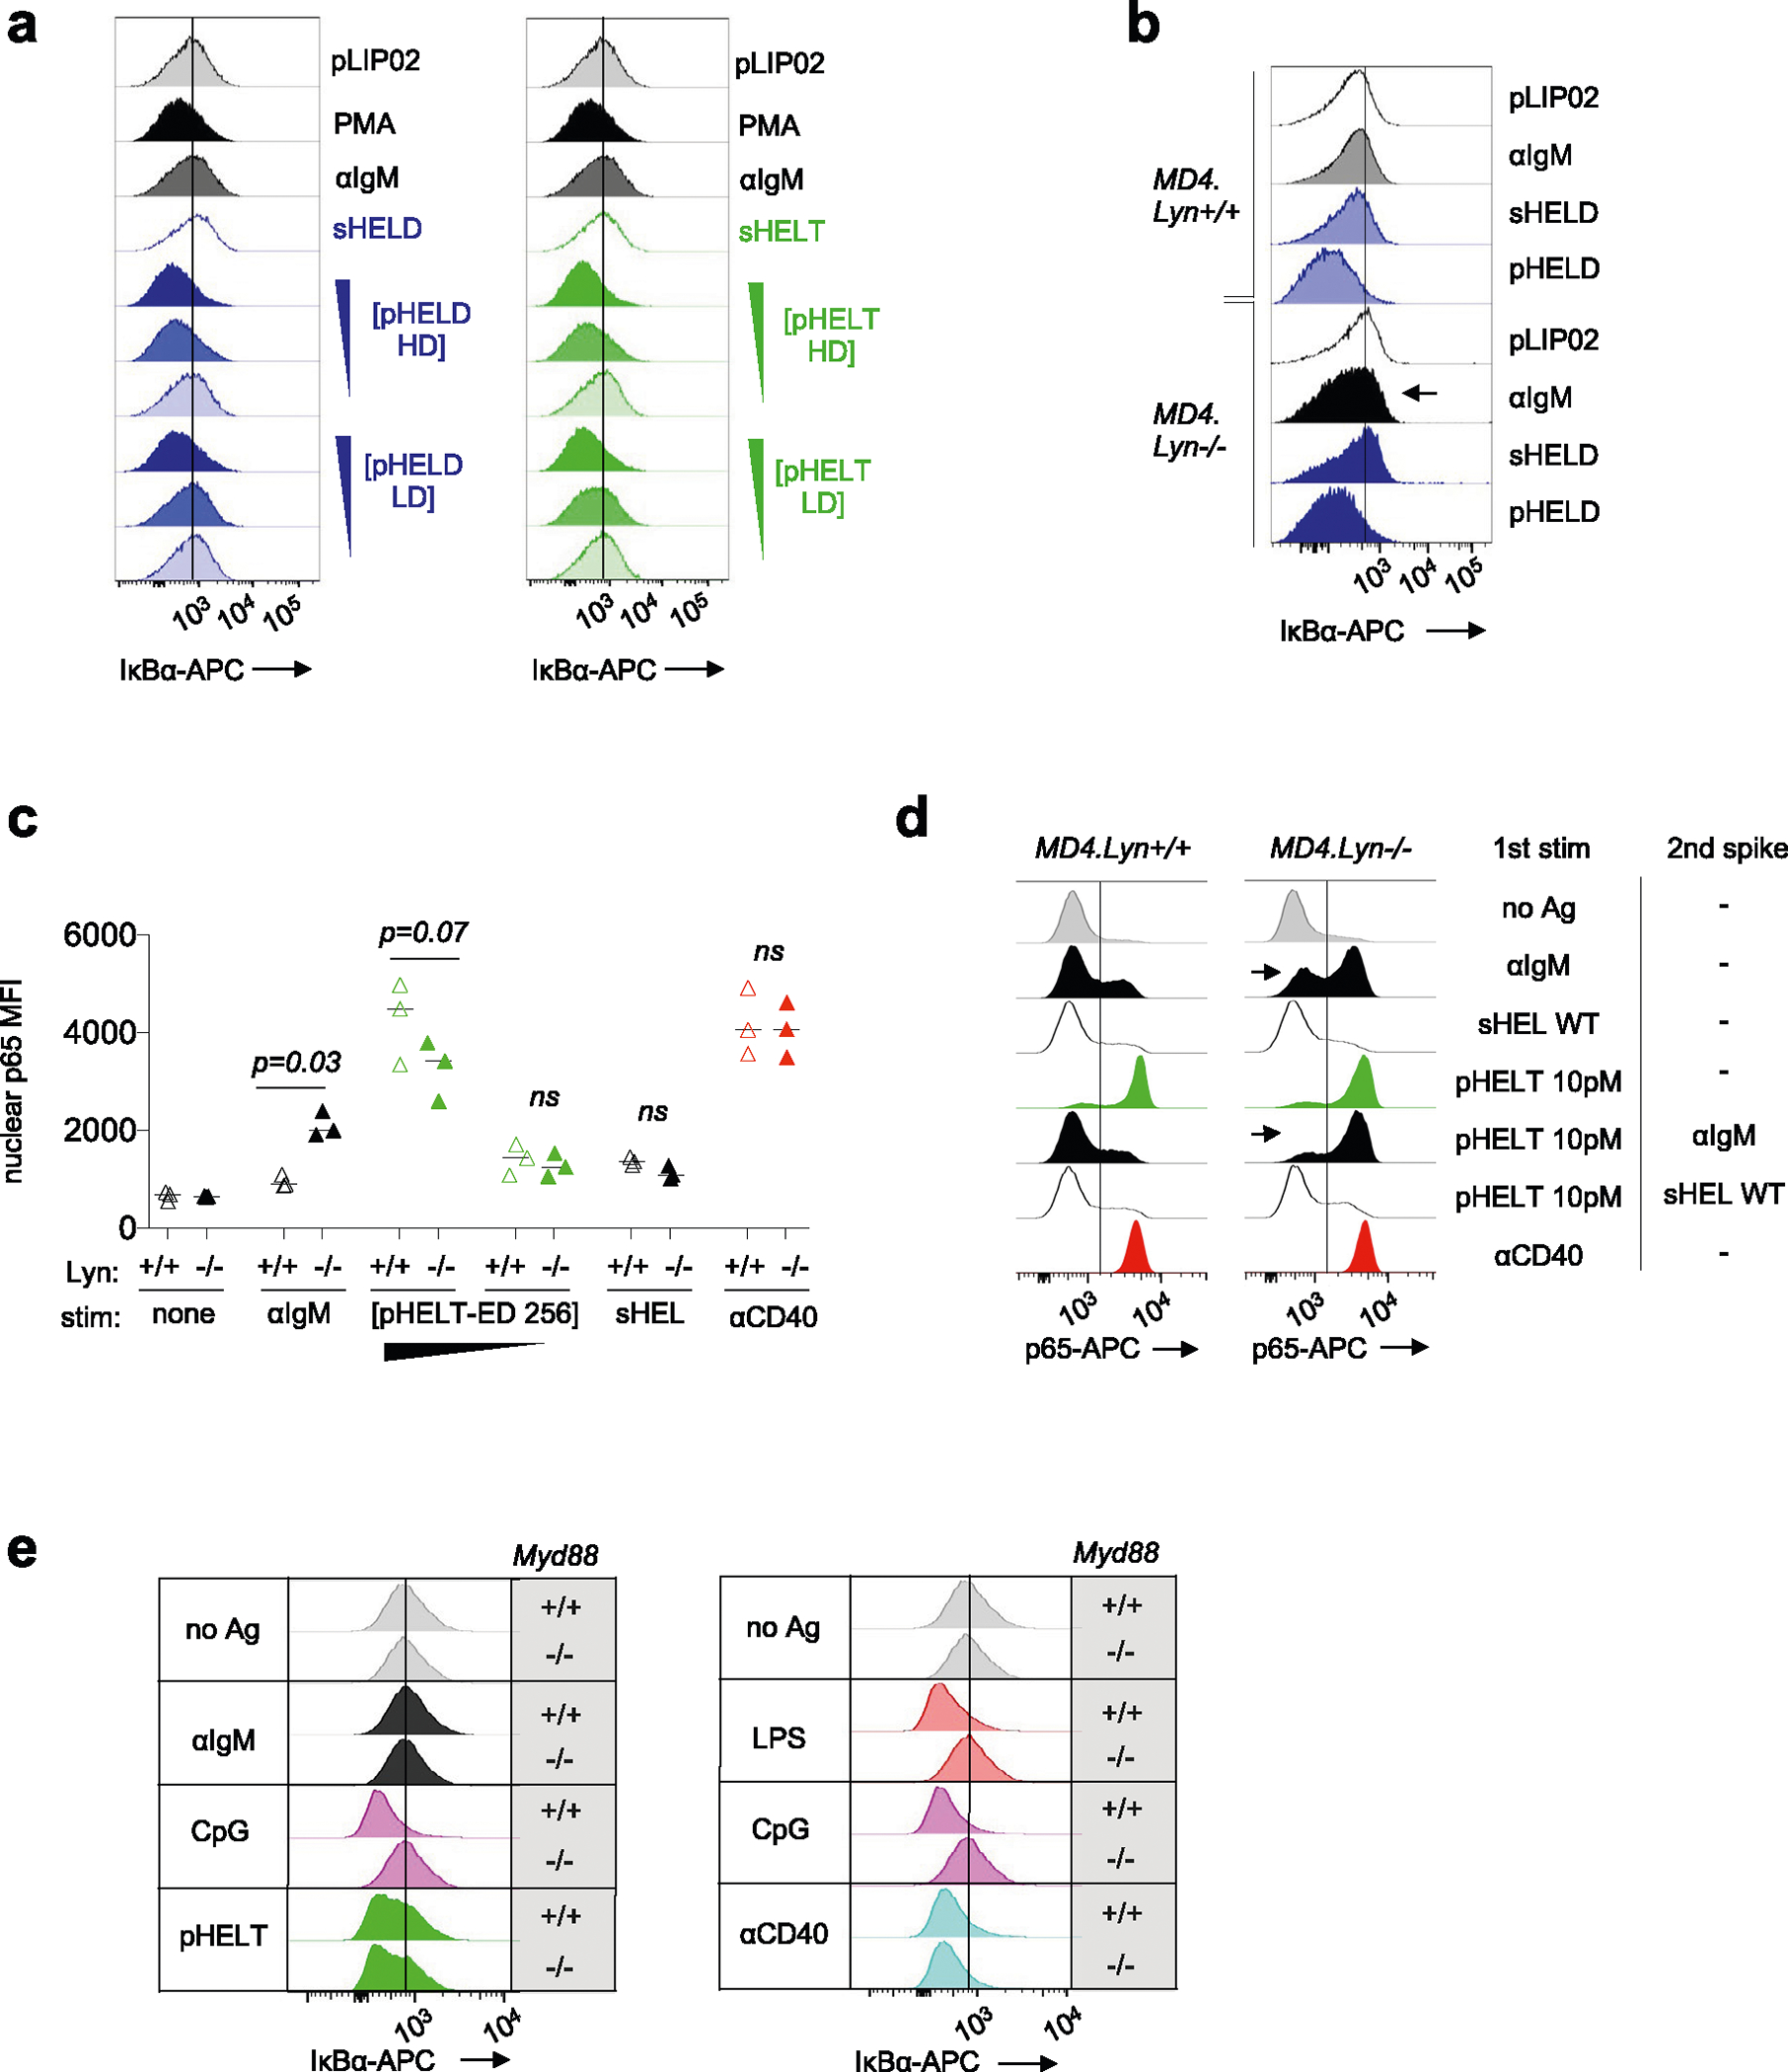
a. As in Main Fig. 7b-d except histograms showing IκBα degradation at 20 minutes post-stimulation for soluble stimuli sHELD/T and pHELT/D with high or low ED (HD vs. LD). Inset triangles represent decreasing concentration of pHEL (10, 1, 0.1 pM). Data are representative of >= 4 independent experiments. b. As in Main Fig. 6b, except splenocytes from Lyn+/+ and Lyn–/– MD4 mice were stained to detect intracellular IκB in CD23+ B cells at 20 minutes. Data are representative of 3 independent experiments. c. Graph corresponds to data in Main Fig. 7g,h except nuclear p65 MFI rather than % p65 positive nuclei are quantified. Graph depicts data with mean from 3 independent experiments. Groups were compared by paired two-tailed parametric T-tests. d. Nuclear p65 translocation is detected as in Fig. 7f except stimuli are applied on ice for 15 min each, first 10pM pHELT-HD +/− superimposed soluble stimuli (anti-IgM 10 μg/ml or sHEL-WT 1 μg/ml), followed by 20 min 37 C incubation as in Main Fig. 6f. e. As in Main Fig. 4c,d except stained to detect intracellular IκB in CD23 + B cells at 20 minutes. Data are representative of 3 independent experiments. In panels A, B and E, line in offset histograms references internal negative control.
Extended Data Fig. 7 |. pHEL reduces NUR77-GFP threshold for B cell division.
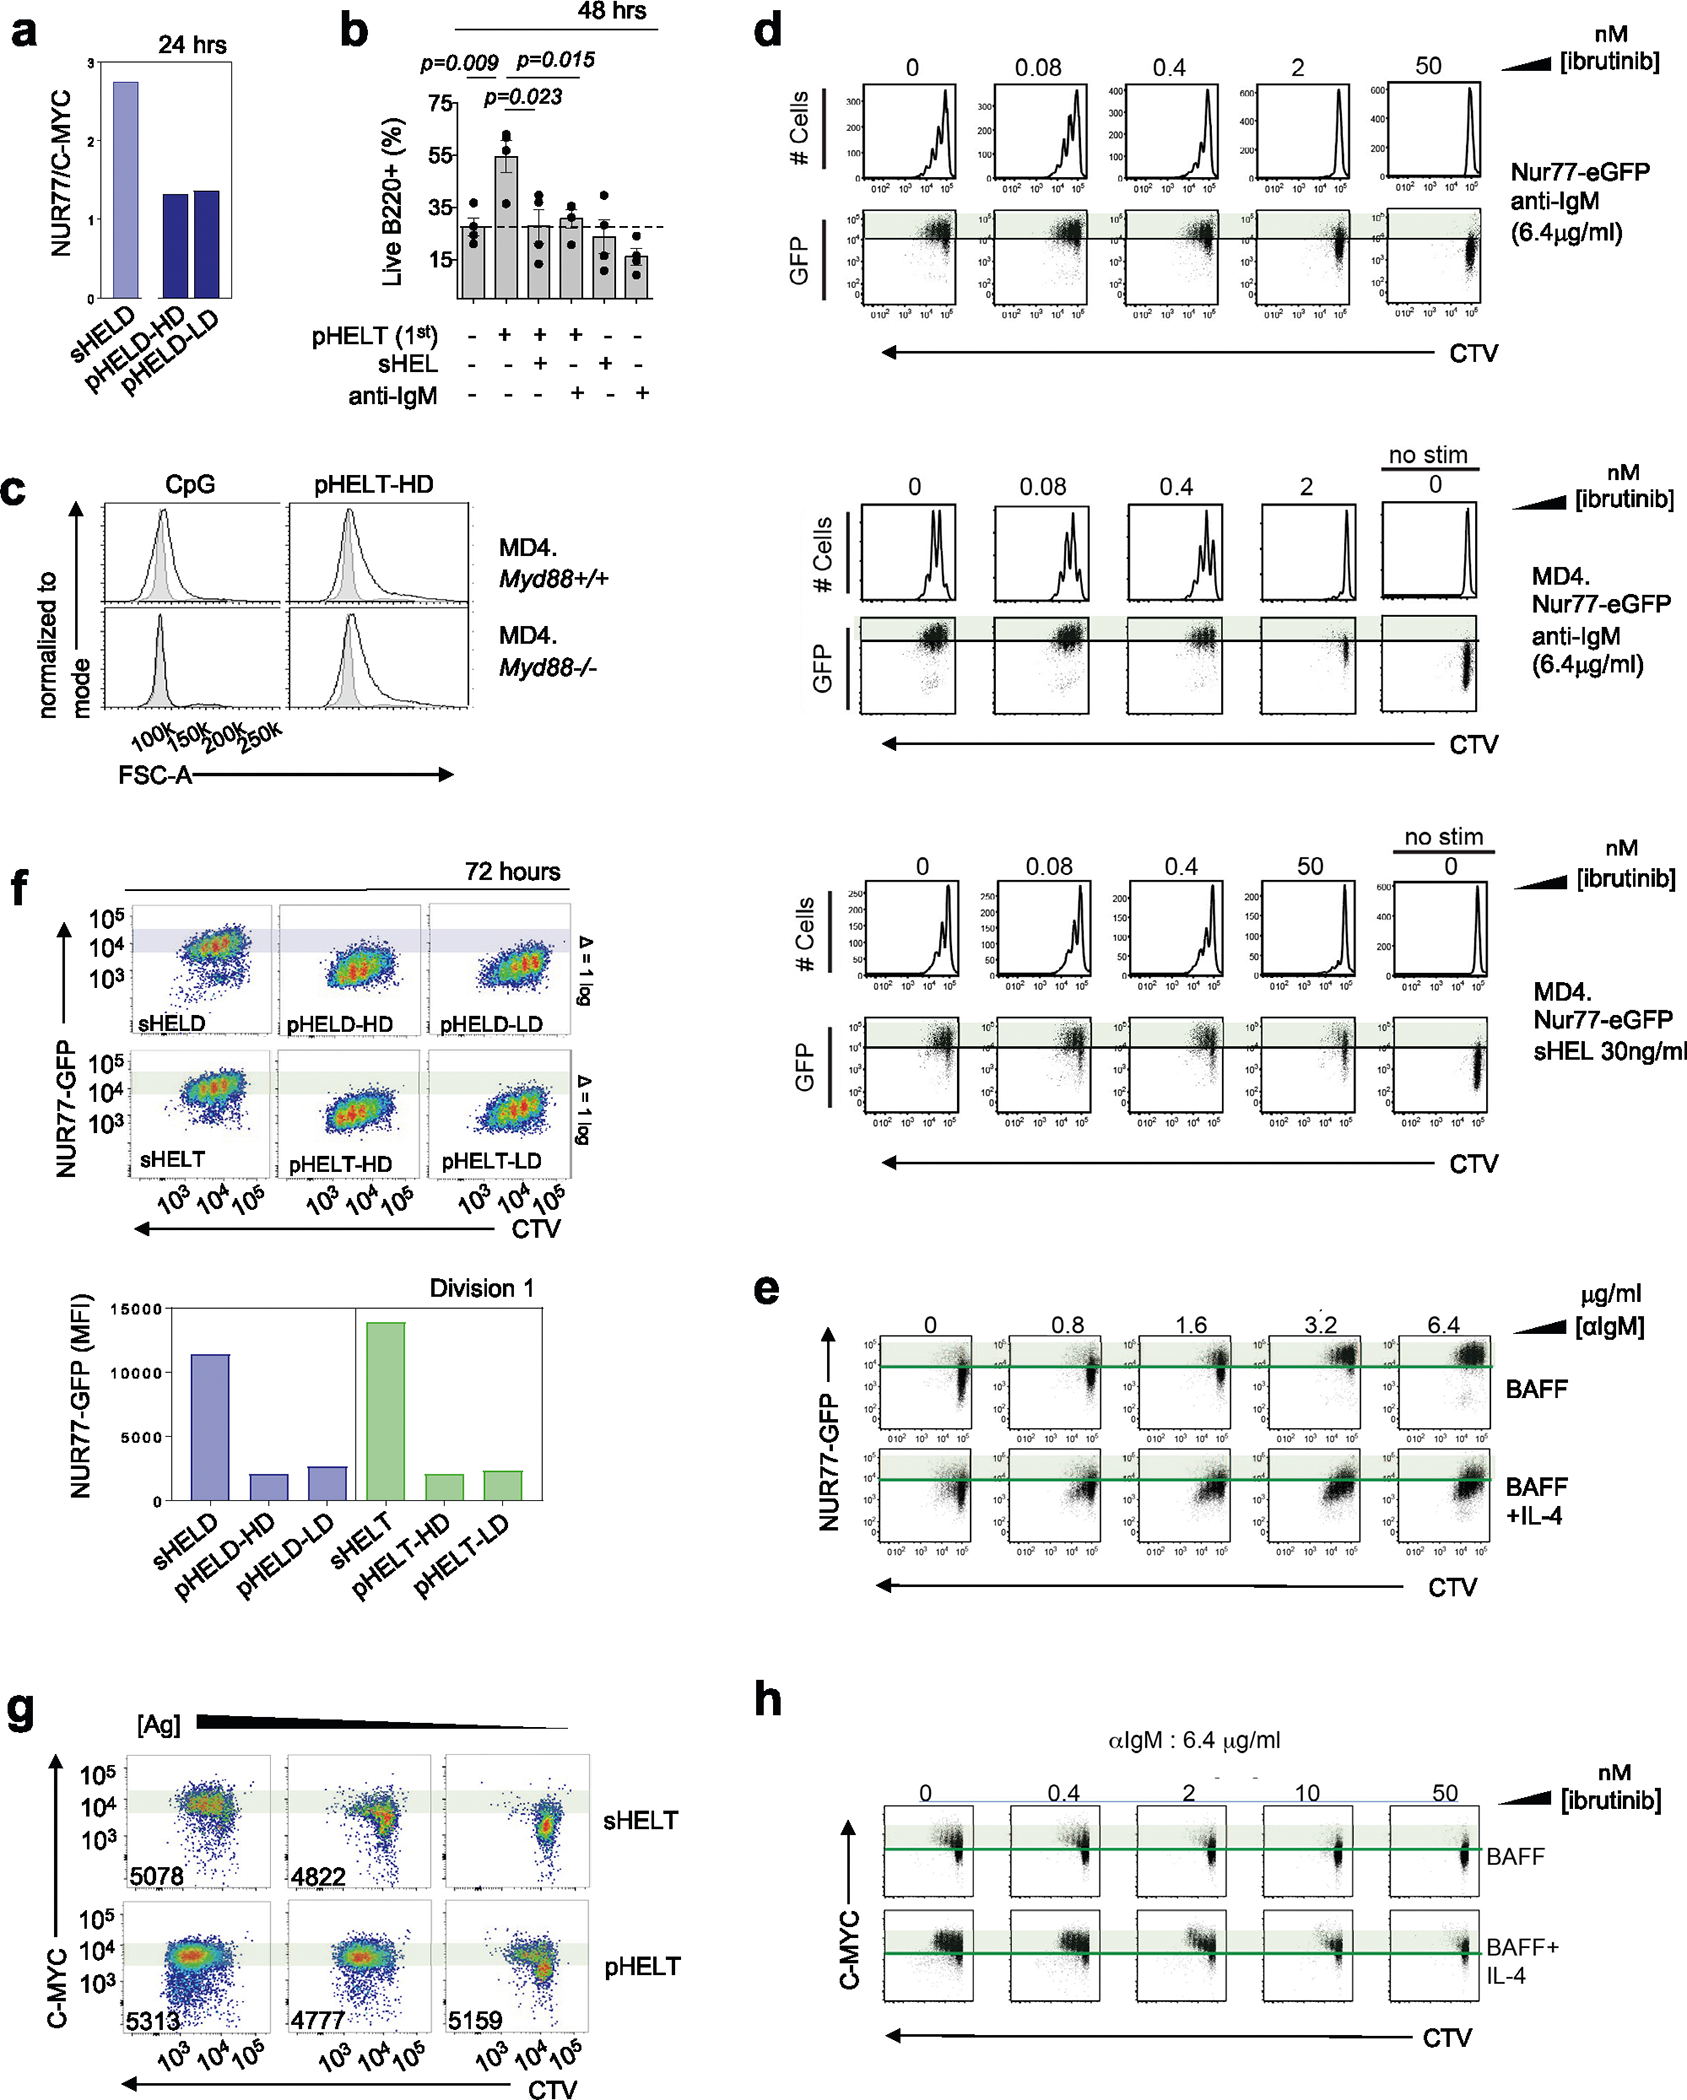
a. MD4.NUR77-GFP lymphocytes were cultured for 24 hr with sHELD 1 μg/ml or 1pM pHEL. Ratio of NUR77-GFP and intra-cellular MYC among B220+ cells from a single experiment, representative of 3 independent experiments. b. MD4 lymphocytes incubated at 4 C with 1st stimulus (1pM pHELT-HD) for 15 min, followed by 2nd stimulus (or media) for 15 min. Soluble stimuli: 1 μg/ml anti-IgM or 0.1 μg/ml sHEL-WT. After 48 hr culture at 37 C without BAFF, viable frequencies of B220+ cells are plotted from 4 independent experiments, compared by a two-tailed unpaired parametric T-test. c. As in Main Fig. 8e except histograms depict B220 + FSC-A, representative of 4 independent experiments. d. CTV-loaded NUR77-GFP splenocytes (+/−MD4 Tg) cultured for 72 hr with 20 ng/ml BAFF + either 6.4 μg/ml anti-IgM or 30 ng/ml sHEL, and ibrutinib titration (0–50 nM). Plots depict CTV and GFP expression in B220+ cells, representative of 3 independent experiments. e. NUR77-GFP splenocytes cultured with 20 ng/ml BAFF as in D except with anti-IgM +/−10ng/ml IL-4. Plots depict CTV and GFP expression in B220+ cells, representative of 6 independent experiments. f. As in Main Fig. 8f,g MD4.NUR77-GFP lymphocytes were cultured with stimuli +20 ng/ml BAFF for 72 hrs: 1 μg/ml sHELD/T, 1pM pHELD/T-HD/LD. These data correspond to Fig. 8f,g but include plots and quantification for pHELD/T-LD for comparison. Shaded bars reference NUR77-GFP levels in dividing B cells stimulated with sHELD/sHELT. (Bottom) Quantification of NUR77-GFP levels in the first division. Data are representative of 5 independent experiments. g. As in Main Fig. 8h, but comparing intra-cellular MYC among CTV-loaded B220+ cells after 72 hr culture: pHELT (1, 0.1, 0.01pM) and sHELT (500, 50, 5 ng/ml). Inset values: MFI of division 1 cells. Data are representative of 3 independent experiments. h. As in E, but cultured with anti-IgM(6.4 μg/ml) and titration of ibrutinib, comparing MYC among CTV-loaded B220+ cells after 72 hr culture. Data are representative of 6 independent experiments.
Extended Data Fig. 8 |. pHEL partially activates anergic B cells.
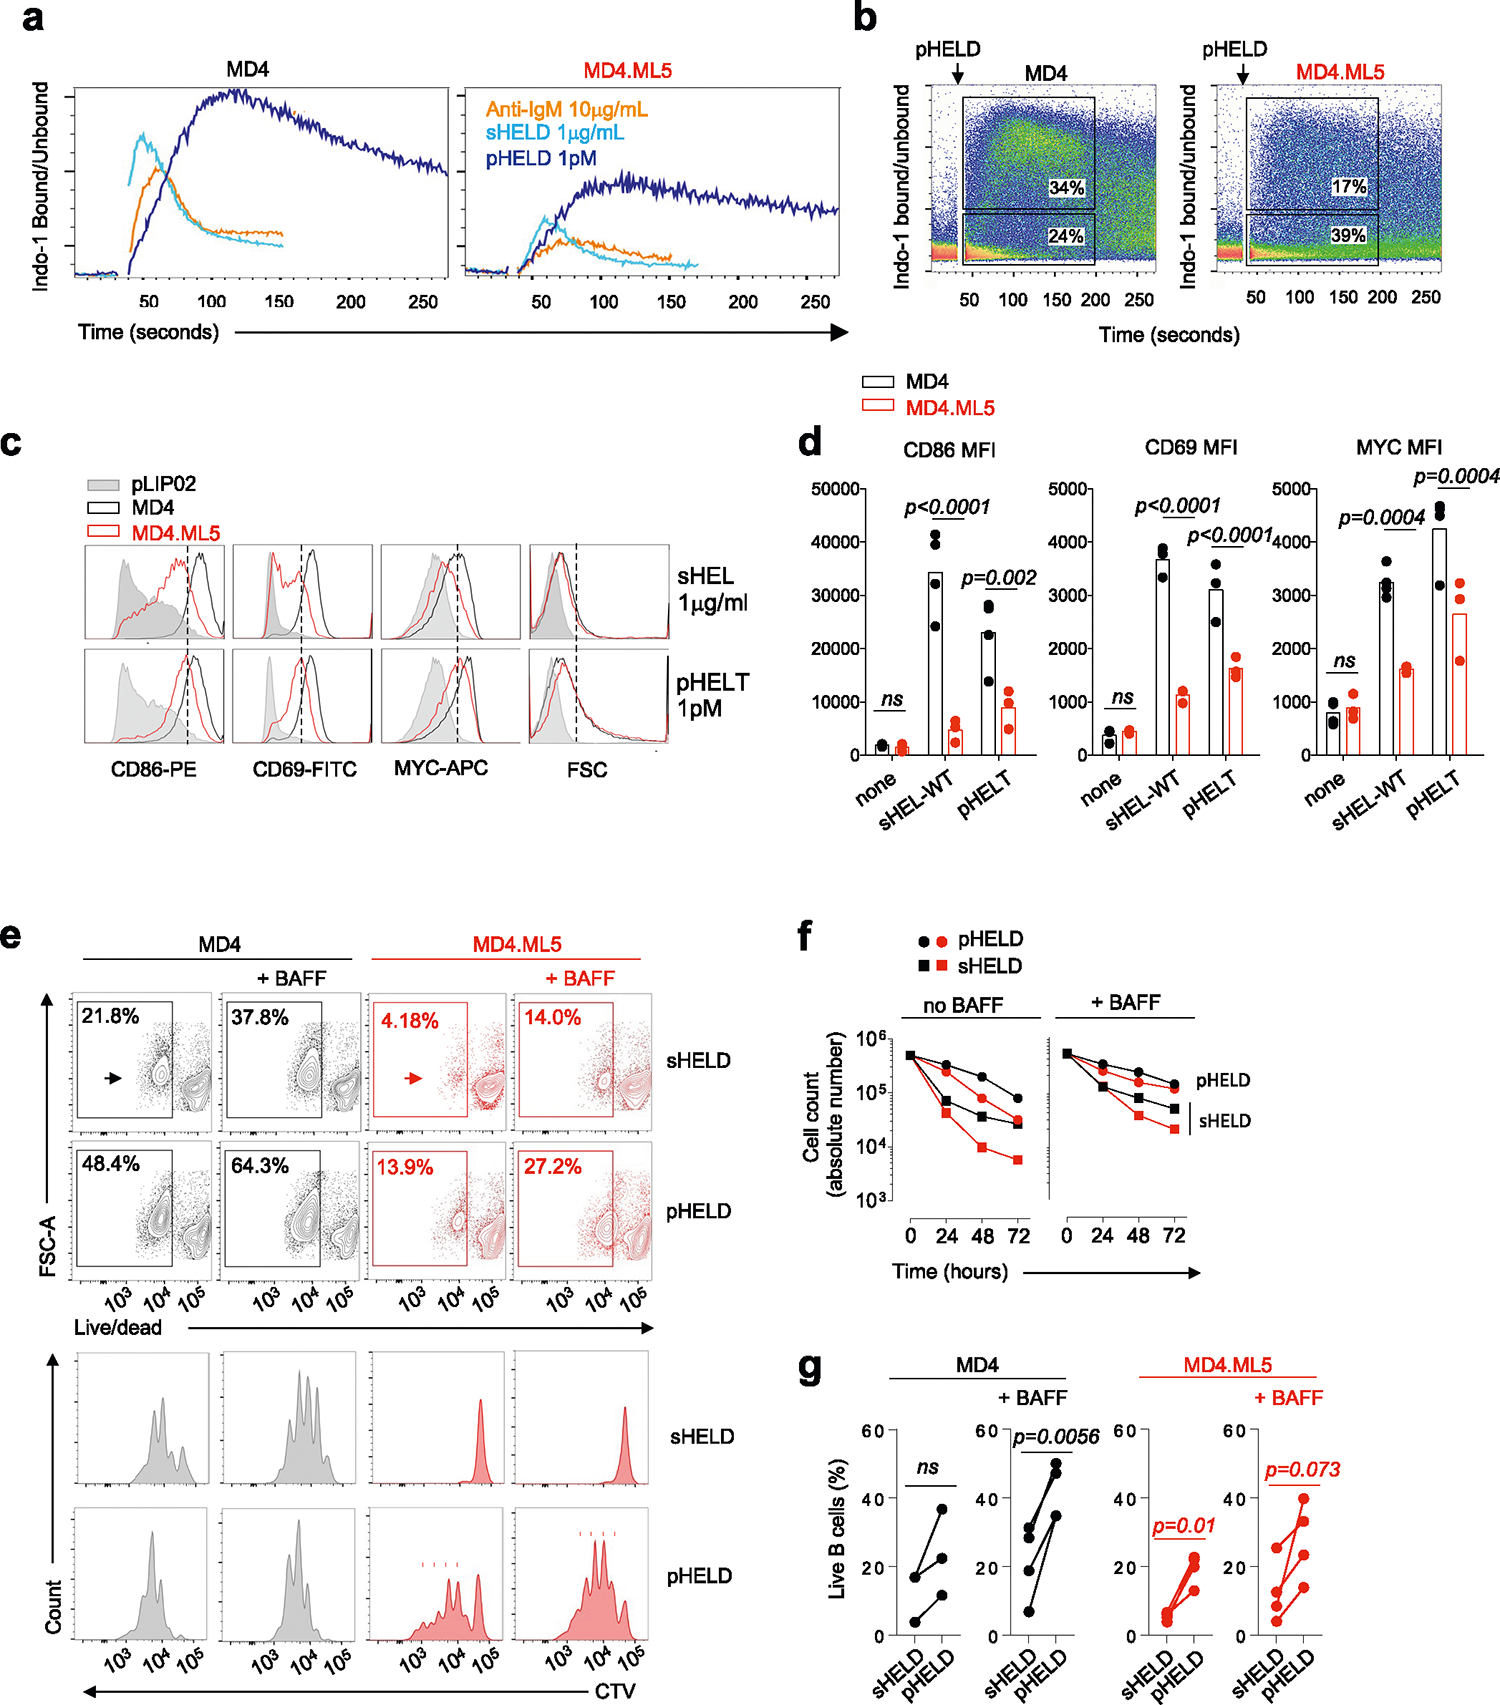
a, b. As in Main Figs. 2e,f and 3c except cells from MD4 or MD4.ML5 mice were stimulated with indicated reagents: anti-IgM 10 μg/ml, sHELD 1 μg/ml, or pHELD-HD (ED 286) 1 pM. Indo-1 ratio is shown on a linear scale. Gated in B are corresponding time gates to capture fraction of responding or non-responding B cells. Data are representative of 3 independent experiments. c, d. As in 8 A, B except pooled splenocytes and lymphocytes from MD4 (naïve) or MD4.ML5 (anergic) mice were incubated with indicated stimuli for 24 hours (sHEL-WT 1 μg/ml or pHELT-HD 1pM). Histograms and graphs depict MFI of CD86, CD69, or intra-cellular MYC in live B220 B cells. Graphs depict data and mean from and histograms are representative of 3 (MD4/ML5) or 4 (MD4) independent experiments. MD4 data in graphs corresponds to a subset of data plotted in Fig. 8b. Data were compared by two-tailed unpaired parametric t-test with Holm-Sidak correction. e-g. Viable frequencies of CTV-loaded MD4 (naïve) or MD4.ML5 (anergic) lymph node B cells in culture at 72-hours post-stimulation with sHELD/T and pHELD/T in the presence or absence of 20 ng/ml BAFF assessed via live/dead indicator dye. E. Representative plots depict gating to identify live B cells from total B220+ cells at 72 hr with corresponding histograms below depicting vital dye dilution of live B220+ cells at the same time point. Data are representative of 4 independent experiments. F. Absolute live B cell counts at sequential time points assessed using counting beads from a single experiment. G. Graphs depict %live B220 + B cells from total lymphocyte gate. Each datapoint is a sample from 4 independent experiments (except N = 3 for MD4 with no BAFF) independent experiments; lines connect samples from the same experiment. Groups were compared by a two-tailed paired parametric T-test.
Extended Data Fig. 9 |. Model.
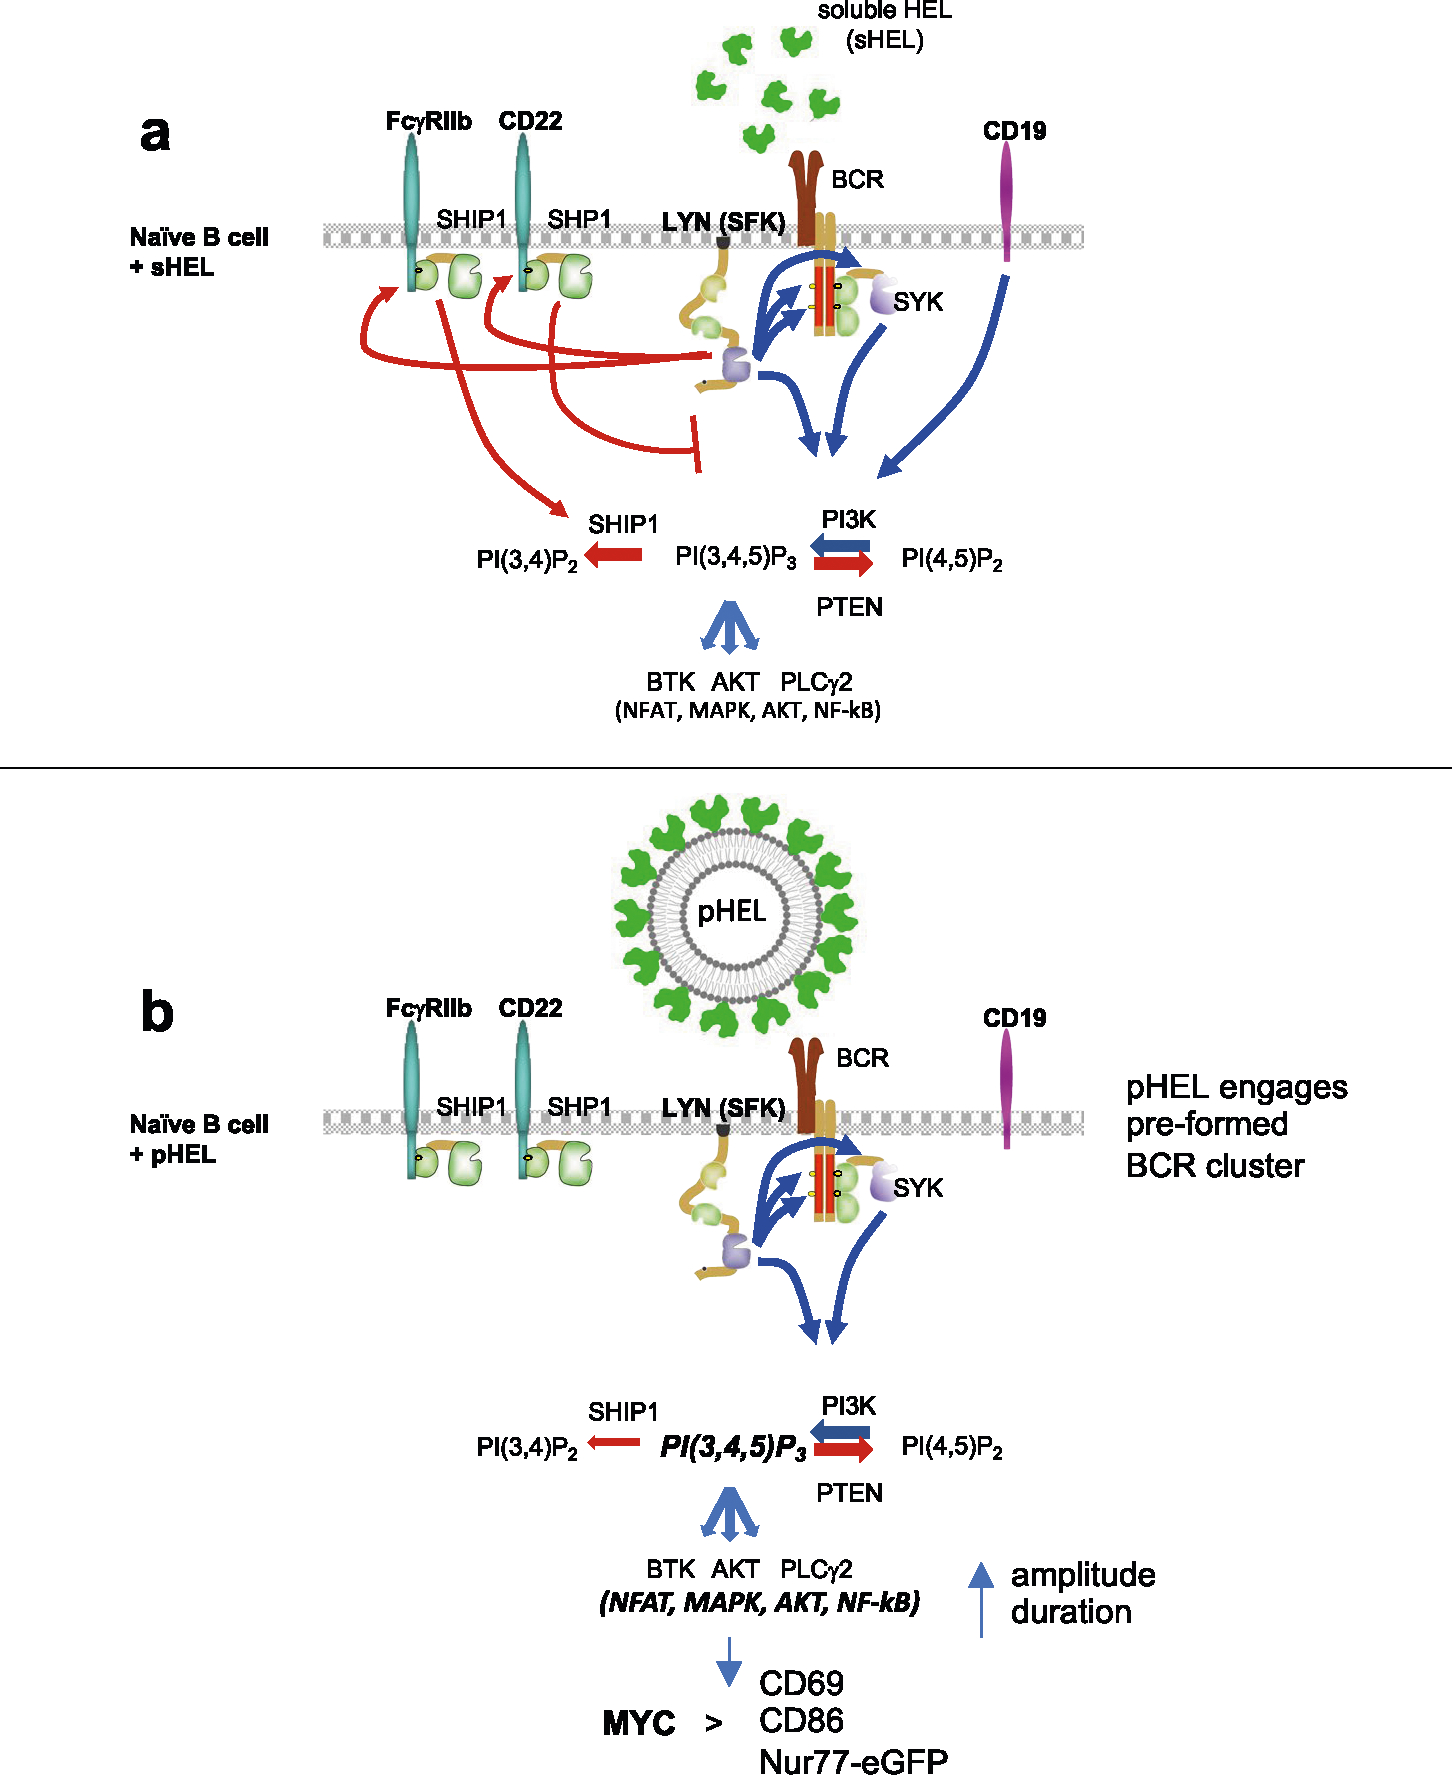
a. Signalosome assembly in naïve B cells upon BCR stimulation by soluble Ag. BCR signal transduction requires sequential action of Src family kinases (SFKs) and SYK kinase. CD19 engagement amplifies PI3K activation and production of PI(3,4,5)P3. While multiple SFKs can mediate ITAM signaling downstream of the BCR, the SFK LYN plays a non-redundant role in phosphorylating ITIM-containing inhibitory coreceptors which in turn recruit PTPases SHP1 and SHIP1 that suppress PIP3. Dynamic regulation of PIP3 at the plasma membrane controls amplitude of signaling by recruiting downstream mediators including AKT, BTK, and PLCγ2 to orchestrate transcriptional programs mediated by NFAT, NF-κB and other factors. b. SVLS with appropriately spaced epitopes robustly engage pre-existing BCR nanoclusters but evade co-inhibitory receptors and results in downstream signal amplification. SVLS do not rely upon CD19 engagement for signal amplification in vitro. In the absence of inhibitory PTPase engagement via ITIM-containing inhibitory receptors, PIP3 accumulates at the plasma membrane leading to enhanced and prolonged signalosome assembly and activity downstream of SVLS stimulation. Robust NFAT and NF-κB accumulation in the nucleus and AKT-dependent signals mimic co-stimulation and promote MYC expression, resulting in T-independent cell growth, survival, and proliferation.
Supplementary Material
Acknowledgements
We thank the following funders: R01AI155653 (W.C. and J.Z.), R01AI148487 (J.Z.) and R01AR069520 (J.Z.), an AAI Postdoctoral Fellowship (J.F.B. and J.Z.), NIH Training Grants T32 AI007334 (J.R. and H.V.N.) and T32 AR079068 (H.V.N.) and Rheumatology Research Foundation Scientist Development Award A138750 (H.V.N.). We thank A. Weiss for helpful discussions and critical reading of the manuscript. We thank A. Roque for help with mouse husbandry.
Footnotes
Competing interests
J.Z. serves as a scientific consultant for Walking Fish Therapeutics. W.C. has a patent pending on SVLSs. All other authors have no competing interests.
Additional information
Extended data is available for this paper at https://doi.org/10.1038/s41590-023-01597-9.
Supplementary information The online version contains supplementary material available at https://doi.org/10.1038/s41590-023-01597-9.
Springer Nature or its licensor (e.g. a society or other partner) holds exclusive rights to this article under a publishing agreement with the author(s) or other rightsholder(s); author self-archiving of the accepted manuscript version of this article is solely governed by the terms of such publishing agreement and applicable law.
Data availability
No large data sets were generated for this manuscript. All data generated or analyzed during this study are included in the published article or are available upon request. Source data depicting unprocessed western blots and all statistical analyses are provided with this paper.
References
- 1.Bachmann MF & Zinkernagel RM Neutralizing antiviral B cell responses. Annu. Rev. Immunol. 15, 235–270 (1997). [DOI] [PubMed] [Google Scholar]
- 2.Feldmann M & Easten A The relationship between antigenic structure and the requirement for thymus-derived cells in the immune response. J. Exp. Med. 134, 103–119 (1971). [DOI] [PMC free article] [PubMed] [Google Scholar]
- 3.Abbott RK et al. Precursor frequency and affinity determine B cell competitive fitness in germinal centers, tested with germline-targeting HIV vaccine immunogens. Immunity 48, 133–146 (2018). [DOI] [PMC free article] [PubMed] [Google Scholar]
- 4.Kato Y et al. Multifaceted effects of antigen valency on B cell response composition and differentiation in vivo. Immunity 53, 548–563 (2020). [DOI] [PMC free article] [PubMed] [Google Scholar]
- 5.Dosenovic P et al. Anti-HIV-1 B cell responses are dependent on B cell precursor frequency and antigen-binding affinity. Proc. Natl Acad. Sci. USA 115, 4743–4748 (2018). [DOI] [PMC free article] [PubMed] [Google Scholar]
- 6.Desaymard C & Howard JG Role of epitope density in the induction of immunity and tolerance with thymus-independent antigens. II. Studies with 2,4-dinitrophenyl conjugates in vivo. Eur. J. Immunol. 5, 541–545 (1975). [DOI] [PubMed] [Google Scholar]
- 7.Dintzis HM, Dintzis RZ & Vogelstein B Molecular determinants of immunogenicity: the immunon model of immune response. Proc. Natl Acad. Sci. USA 73, 3671–3675 (1976). [DOI] [PMC free article] [PubMed] [Google Scholar]
- 8.Bachmann MF et al. The influence of antigen organization on B cell responsiveness. Science 262, 1448–1451 (1993). [DOI] [PubMed] [Google Scholar]
- 9.Ingale J et al. High-density array of well-ordered HIV-1 spikes on synthetic liposomal nanoparticles efficiently activate B cells. Cell Rep. 15, 1986–1999 (2016). [DOI] [PMC free article] [PubMed] [Google Scholar]
- 10.Tolar P & Pierce SK Unveiling the B cell receptor structure. Science 377, 819–820 (2022). [DOI] [PMC free article] [PubMed] [Google Scholar]
- 11.Veneziano R et al. Role of nanoscale antigen organization on B-cell activation probed using DNA origami. Nat. Nanotechnol. 15, 716–723 (2020). [DOI] [PMC free article] [PubMed] [Google Scholar]
- 12.Pierce SK & Liu W The tipping points in the initiation of B cell signalling: how small changes make big differences. Nat. Rev. Immunol. 10, 767–777 (2010). [DOI] [PMC free article] [PubMed] [Google Scholar]
- 13.Mattila PK, Batista FD & Treanor B Dynamics of the actin cytoskeleton mediates receptor cross talk: an emerging concept in tuning receptor signaling. J. Cell Biol. 212, 267–280 (2016). [DOI] [PMC free article] [PubMed] [Google Scholar]
- 14.Gold MR & Reth MG Antigen receptor function in the context of the nanoscale organization of the B cell membrane. Annu. Rev. Immunol. 37, 97–123 (2019). [DOI] [PubMed] [Google Scholar]
- 15.Kwak K, Akkaya M & Pierce SK B cell signaling in context. Nat. Immunol. 20, 963–969 (2019). [DOI] [PubMed] [Google Scholar]
- 16.Tolar P, Hanna J, Krueger PD & Pierce SK The constant region of the membrane immunoglobulin mediates B cell-receptor clustering and signaling in response to membrane antigens. Immunity 30, 44–55 (2009). [DOI] [PMC free article] [PubMed] [Google Scholar]
- 17.Batista FD, Iber D & Neuberger MS B cells acquire antigen from target cells after synapse formation. Nature 411, 489–494 (2001). [DOI] [PubMed] [Google Scholar]
- 18.Batista FD & Neuberger MS B cells extract and present immobilized antigen: implications for affinity discrimination. EMBO J. 19, 513–520 (2000). [DOI] [PMC free article] [PubMed] [Google Scholar]
- 19.Batista FD & Neuberger MS Affinity dependence of the B cell response to antigen: a threshold, a ceiling, and the importance of off-rate. Immunity 8, 751–759 (1998). [DOI] [PubMed] [Google Scholar]
- 20.Fleire SJ et al. B cell ligand discrimination through a spreading and contraction response. Science 312, 738–741 (2006). [DOI] [PubMed] [Google Scholar]
- 21.Liu W, Meckel T, Tolar P, Sohn HW & Pierce SK Antigen affinity discrimination is an intrinsic function of the B cell receptor. J. Exp. Med. 207, 1095–1111 (2010). [DOI] [PMC free article] [PubMed] [Google Scholar]
- 22.Ambegaonkar AA et al. Expression of inhibitory receptors by B cells in chronic human infectious diseases restricts responses to membrane-associated antigens. Sci. Adv. 6, eaba6493 (2020). [DOI] [PMC free article] [PubMed] [Google Scholar]
- 23.Sohn HW, Pierce SK & Tzeng SJ Live cell imaging reveals that the inhibitory FcγRIIB destabilizes B cell receptor membrane–lipid interactions and blocks immune synapse formation. J. Immunol. 180, 793–799 (2008). [DOI] [PubMed] [Google Scholar]
- 24.Carrasco YR & Batista FD B cells acquire particulate antigen in a macrophage-rich area at the boundary between the follicle and the subcapsular sinus of the lymph node. Immunity 27, 160–171 (2007). [DOI] [PubMed] [Google Scholar]
- 25.Pape KA, Catron DM, Itano AA & Jenkins MK The humoral immune response is initiated in lymph nodes by B cells that acquire soluble antigen directly in the follicles. Immunity 26, 491–502 (2007). [DOI] [PubMed] [Google Scholar]
- 26.Aung A et al. Low protease activity in B cell follicles promotes retention of intact antigens after immunization. Science 379, eabn8934 (2023). [DOI] [PMC free article] [PubMed] [Google Scholar]
- 27.Junt T et al. Subcapsular sinus macrophages in lymph nodes clear lymph-borne viruses and present them to antiviral B cells. Nature 450, 110–114 (2007). [DOI] [PubMed] [Google Scholar]
- 28.Gonzalez SF et al. Trafficking of B cell antigen in lymph nodes. Annu. Rev. Immunol. 29, 215–233 (2011). [DOI] [PubMed] [Google Scholar]
- 29.Phan TG, Grigorova I, Okada T & Cyster JG Subcapsular encounter and complement-dependent transport of immune complexes by lymph node B cells. Nat. Immunol. 8, 992–1000 (2007). [DOI] [PubMed] [Google Scholar]
- 30.Cyster JG B cell follicles and antigen encounters of the third kind. Nat. Immunol. 11, 989–996 (2010). [DOI] [PubMed] [Google Scholar]
- 31.Wholey WY et al. Synthetic liposomal mimics of biological viruses for the study of immune responses to infection and vaccination. Bioconjug. Chem. 31, 685–697 (2020). [DOI] [PMC free article] [PubMed] [Google Scholar]
- 32.Cheng W The density code for the development of a vaccine. J. Pharm. Sci. 105, 3223–3232 (2016). [DOI] [PMC free article] [PubMed] [Google Scholar]
- 33.Paus D et al. Antigen recognition strength regulates the choice between extrafollicular plasma cell and germinal center B cell differentiation. J. Exp. Med. 203, 1081–1091 (2006). [DOI] [PMC free article] [PubMed] [Google Scholar]
- 34.Zikherman J, Parameswaran R & Weiss A Endogenous antigen tunes the responsiveness of naive B cells but not T cells. Nature 489, 160–164 (2012). [DOI] [PMC free article] [PubMed] [Google Scholar]
- 35.Goodnow CC et al. Altered immunoglobulin expression and functional silencing of self-reactive B lymphocytes in transgenic mice. Nature 334, 676–682 (1988). [DOI] [PubMed] [Google Scholar]
- 36.Tan C et al. NR4A nuclear receptors restrain B cell responses to antigen when second signals are absent or limiting. Nat. Immunol. 21, 1267–1279 (2020). [DOI] [PMC free article] [PubMed] [Google Scholar]
- 37.Wholey W-Y et al. Initiation of neutralizing antibody response probed using synthetic virus-like structures. Preprint at bioRxiv 10.1101/2023.02.20.529089 (2023). [DOI] [Google Scholar]
- 38.Cyster JG & Goodnow CC Antigen-induced exclusion from follicles and anergy are separate and complementary processes that influence peripheral B cell fate. Immunity 3, 691–701 (1995). [DOI] [PubMed] [Google Scholar]
- 39.Chou MY, Liu D, An J, Xu Y & Cyster JG B cell peripheral tolerance is promoted by cathepsin B protease. Proc. Natl Acad. Sci. USA 120, e2300099120 (2023). [DOI] [PMC free article] [PubMed] [Google Scholar]
- 40.Martin F & Kearney JF Marginal-zone B cells. Nat. Rev. Immunol. 2, 323–335 (2002). [DOI] [PubMed] [Google Scholar]
- 41.Dal Porto JM et al. B cell antigen receptor signaling 101. Mol. Immunol. 41, 599–613 (2004). [DOI] [PubMed] [Google Scholar]
- 42.Lowe J, Joseph RE & Andreotti AH Conformational switches that control the TEC kinase–PLCγ signaling axis. J. Struct. Biol. X 6, 100061 (2022). [DOI] [PMC free article] [PubMed] [Google Scholar]
- 43.Dickson EJ & Hille B Understanding phosphoinositides: rare, dynamic, and essential membrane phospholipids. Biochem. J. 476, 1–23 (2019). [DOI] [PMC free article] [PubMed] [Google Scholar]
- 44.Getahun A Role of inhibitory signaling in peripheral B cell tolerance. Immunol. Rev. 307, 27–42 (2022). [DOI] [PMC free article] [PubMed] [Google Scholar]
- 45.Stokoe D et al. Dual role of phosphatidylinositol-3,4,5-trisphosphate in the activation of protein kinase B. Science 277, 567–570 (1997). [DOI] [PubMed] [Google Scholar]
- 46.Alessi DR et al. Characterization of a 3-phosphoinositide-dependent protein kinase which phosphorylates and activates protein kinase Bα. Curr. Biol. 7, 261–269 (1997). [DOI] [PubMed] [Google Scholar]
- 47.Chung JK et al. Switch-like activation of Bruton’s tyrosine kinase by membrane-mediated dimerization. Proc. Natl Acad. Sci. USA 116, 10798–10803 (2019). [DOI] [PMC free article] [PubMed] [Google Scholar]
- 48.Depoil D et al. CD19 is essential for B cell activation by promoting B cell receptor–antigen microcluster formation in response to membrane-bound ligand. Nat. Immunol. 9, 63–72 (2008). [DOI] [PubMed] [Google Scholar]
- 49.Mattila PK et al. The actin and tetraspanin networks organize receptor nanoclusters to regulate B cell receptor-mediated signaling. Immunity 38, 461–474 (2013). [DOI] [PubMed] [Google Scholar]
- 50.Fearon DT & Carroll MC Regulation of B lymphocyte responses to foreign and self-antigens by the CD19/CD21 complex. Annu. Rev. Immunol. 18, 393–422 (2000). [DOI] [PubMed] [Google Scholar]
- 51.Chan VW, Meng F, Soriano P, DeFranco AL & Lowell CA Characterization of the B lymphocyte populations in Lyn-deficient mice and the role of Lyn in signal initiation and down-regulation. Immunity 7, 69–81 (1997). [DOI] [PubMed] [Google Scholar]
- 52.Xu Y, Harder KW, Huntington ND, Hibbs ML & Tarlinton DM Lyn tyrosine kinase: accentuating the positive and the negative. Immunity 22, 9–18 (2005). [DOI] [PubMed] [Google Scholar]
- 53.Shinohara H & Kurosaki T Comprehending the complex connection between PKCβ, TAK1, and IKK in BCR signaling. Immunol. Rev. 232, 300–318 (2009). [DOI] [PubMed] [Google Scholar]
- 54.Finkin S, Hartweger H, Oliveira TY, Kara EE & Nussenzweig MC Protein amounts of the MYC transcription factor determine germinal center B cell division capacity. Immunity 51, 324–336 (2019). [DOI] [PMC free article] [PubMed] [Google Scholar]
- 55.Au-Yeung BB et al. A sharp T-cell antigen receptor signaling threshold for T-cell proliferation. Proc. Natl Acad. Sci. USA 111, E3679–E3688 (2014). [DOI] [PMC free article] [PubMed] [Google Scholar]
- 56.Heinzel S et al. A Myc-dependent division timer complements a cell-death timer to regulate T cell and B cell responses. Nat. Immunol. 18, 96–103 (2017). [DOI] [PubMed] [Google Scholar]
- 57.Tan C, Noviski M, Huizar J & Zikherman J Self-reactivity on a spectrum: a sliding scale of peripheral B cell tolerance. Immunol. Rev. 292, 37–60 (2019). [DOI] [PMC free article] [PubMed] [Google Scholar]
- 58.Dolmetsch RE, Lewis RS, Goodnow CC & Healy JI Differential activation of transcription factors induced by Ca2+ response amplitude and duration. Nature 386, 855–858 (1997). [DOI] [PubMed] [Google Scholar]
- 59.Healy JI et al. Different nuclear signals are activated by the B cell receptor during positive versus negative signaling. Immunity 6, 419–428 (1997). [DOI] [PubMed] [Google Scholar]
- 60.Natkanski E et al. B cells use mechanical energy to discriminate antigen affinities. Science 340, 1587–1590 (2013). [DOI] [PMC free article] [PubMed] [Google Scholar]
- 61.Kalinke U et al. The role of somatic mutation in the generation of the protective humoral immune response against vesicular stomatitis virus. Immunity 5, 639–652 (1996). [DOI] [PubMed] [Google Scholar]
- 62.Nowosad CR, Spillane KM & Tolar P Germinal center B cells recognize antigen through a specialized immune synapse architecture. Nat. Immunol. 17, 870–877 (2016). [DOI] [PMC free article] [PubMed] [Google Scholar]
- 63.Macauley MS et al. Antigenic liposomes displaying CD22 ligands induce antigen-specific B cell apoptosis. J. Clin. Invest. 123, 3074–3083 (2013). [DOI] [PMC free article] [PubMed] [Google Scholar]
- 64.Scanlan CN, Offer J, Zitzmann N & Dwek RA Exploiting the defensive sugars of HIV-1 for drug and vaccine design. Nature 446, 1038–1045 (2007). [DOI] [PubMed] [Google Scholar]
- 65.de La Vega MA, Wong G, Kobinger GP & Qiu X The multiple roles of sGP in Ebola pathogenesis. Viral Immunol. 28, 3–9 (2015). [DOI] [PMC free article] [PubMed] [Google Scholar]
- 66.Maity PC et al. B cell antigen receptors of the IgM and IgD classes are clustered in different protein islands that are altered during B cell activation. Sci. Signal 8, ra93 (2015). [DOI] [PubMed] [Google Scholar]
- 67.Ubelhart R et al. Responsiveness of B cells is regulated by the hinge region of IgD. Nat. Immunol. 16, 534–543 (2015). [DOI] [PubMed] [Google Scholar]
- 68.Gasparrini F et al. Nanoscale organization and dynamics of the siglec CD22 cooperate with the cytoskeleton in restraining BCR signalling. EMBO J. 35, 258–280 (2016). [DOI] [PMC free article] [PubMed] [Google Scholar]
- 69.Shinohara H et al. Positive feedback within a kinase signaling complex functions as a switch mechanism for NF-κB activation. Science 344, 760–764 (2014). [DOI] [PubMed] [Google Scholar]
- 70.Berry CT, May MJ & Freedman BD STIM- and Orai-mediated calcium entry controls NF-κB activity and function in lymphocytes. Cell Calcium 74, 131–143 (2018). [DOI] [PMC free article] [PubMed] [Google Scholar]
- 71.Berry CT et al. BCR-induced Ca2+ signals dynamically tune survival, metabolic reprogramming, and proliferation of naive B cells. Cell Rep. 31, 107474 (2020). [DOI] [PMC free article] [PubMed] [Google Scholar]
- 72.Forsdyke DR Two signal half-century: from negative selection of self-reactivity to positive selection of near-self-reactivity. Scand. J. Immunol. 89, e12746 (2019). [DOI] [PubMed] [Google Scholar]
- 73.Chackerian B, Durfee MR & Schiller JT Virus-like display of a neo-self antigen reverses B cell anergy in a B cell receptor transgenic mouse model. J. Immunol. 180, 5816–5825 (2008). [DOI] [PMC free article] [PubMed] [Google Scholar]
- 74.Chackerian B, Lowy DR & Schiller JT Conjugation of a self-antigen to papillomavirus-like particles allows for efficient induction of protective autoantibodies. J. Clin. Invest. 108, 415–423 (2001). [DOI] [PMC free article] [PubMed] [Google Scholar]
- 75.Chen Z et al. Self-antigens displayed on liposomal nanoparticles above a threshold of epitope density elicit class-switched autoreactive antibodies independent of T cell help. J. Immunol. 204, 335–347 (2020). [DOI] [PMC free article] [PubMed] [Google Scholar]
- 76.Hou B, Reizis B & DeFranco AL Toll-like receptors activate innate and adaptive immunity by using dendritic cell-intrinsic and -extrinsic mechanisms. Immunity 29, 272–282 (2008). [DOI] [PMC free article] [PubMed] [Google Scholar]
- 77.Rickert RC, Roes J & Rajewsky K B lymphocyte-specific, Cre-mediated mutagenesis in mice. Nucleic Acids Res. 25, 1317–1318 (1997). [DOI] [PMC free article] [PubMed] [Google Scholar]
- 78.Wholey WY, Yoda ST & Cheng W Site-specific and stable conjugation of the SARS-CoV-2 receptor-binding domain to liposomes in the absence of any other adjuvants elicits potent neutralizing antibodies in BALB/c mice. Bioconjug. Chem. 32, 2497–2506 (2021). [DOI] [PMC free article] [PubMed] [Google Scholar]
- 79.DeSantis MC, Kim JH, Song H, Klasse PJ & Cheng W Quantitative correlation between infectivity and Gp120 density on HIV-1 virions revealed by optical trapping virometry. J. Biol. Chem. 291, 13088–13097 (2016). [DOI] [PMC free article] [PubMed] [Google Scholar]
- 80.Pang Y, Song H, Kim JH, Hou X & Cheng W Optical trapping of individual human immunodeficiency viruses in culture fluid reveals heterogeneity with single-molecule resolution. Nat. Nanotechnol. 9, 624–630 (2014). [DOI] [PMC free article] [PubMed] [Google Scholar]
- 81.Gallagher MP, Conley JM & Berg LJ Peptide antigen concentration modulates digital NFAT1 activation in primary mouse naive CD8+ T cells as measured by flow cytometry of isolated cell nuclei. Immunohorizons 2, 208–215 (2018). [DOI] [PMC free article] [PubMed] [Google Scholar]
- 82.Lu W et al. The phosphatidylinositol-transfer protein Nir3 promotes PI(4,5)P2 replenishment in response to TCR signaling during T cell development and survival. Nat. Immunol. 24, 136–147 (2023). [DOI] [PMC free article] [PubMed] [Google Scholar]
- 83.Prado DS et al. Synergistic and additive interactions between receptor signaling networks drive the regulatory T cell versus T helper 17 cell fate choice. J. Biol. Chem. 297, 101330 (2021). [DOI] [PMC free article] [PubMed] [Google Scholar]
Associated Data
This section collects any data citations, data availability statements, or supplementary materials included in this article.
Supplementary Materials
Data Availability Statement
No large data sets were generated for this manuscript. All data generated or analyzed during this study are included in the published article or are available upon request. Source data depicting unprocessed western blots and all statistical analyses are provided with this paper.


