

Abstract
Riboswitches are mRNA segments that regulate gene expression in response to ligand binding. The Class I preQ1 riboswitch consists of a stem-loop and an adenine-rich single-stranded tail (“L3”), which adopt a pseudoknot structure upon binding of the ligand preQ1. We inserted 2-aminopurine (2-AP), a fluorescent analogue of adenine (A), into the riboswitch at six different positions within L3. Here, 2-AP functions both as a spectroscopic probe and as a “mutation” that reveals how alteration of specific A residues impacts the riboswitch. Using fluorescence and circular dichroism spectroscopy, we found that 2-AP decreases the affinity of the riboswitch for preQ1 at all labeling positions tested, though modified and unmodified variants undergo the same global conformational changes at sufficiently high preQ1 concentration. 2-AP substitution is most detrimental to ligand binding at sites proximal to the ligand-binding pocket, while distal labeling sites exhibit the largest impacts on the stability of the L3 domain in the absence of ligand. Insertion of multiple 2-AP residues does not induce significant additional disruptions. Our results show that interactions involving the A residues in L3 play a critical role in ligand recognition by the preQ1 riboswitch, and that 2-AP substitution exerts complex and varied impacts on this riboswitch.
Graphical Abstract

Fluorescent nucleic acid base analogues are popular probes of RNA and DNA structure. We placed the adenine analogue 2-aminopurine (2-AP) at various positions within a bacterial regulatory RNA and investigated its response to binding of a small molecule. Distinct local environments within this “riboswitch” yield distinct spectral properties of the probe and distinct changes upon ligand binding. 2-AP substitution reduces ligand affinity, highlighting the significance of interactions involving the native adenines.
INTRODUCTION
Riboswitches are mRNA segments that regulate gene expression in response to environmental cues, and are most commonly found in bacteria (1). A riboswitch contains an aptamer domain, which binds to a ligand, and an expression platform, which re-folds in response to ligand binding to regulate downstream genes in cis. Riboswitches typically control the transcription or translation step of gene expression, although other mechanisms have also been observed (2–4). Since their discovery, riboswitches have been the subjects of intensive study due to their utility as molecular sensors (5, 6) and antibiotic targets (7, 8).
The structures and dynamics of riboswitches are intimately linked to their biological functions. As a result, many techniques have been used to probe riboswitch structure and dynamics, including x-ray crystallography (9), NMR (10, 11), single-molecule Förster resonance energy transfer (smFRET) (12–15) and bulk fluorescence spectroscopy (4, 16). For studies utilizing bulk fluorescence spectroscopy, a powerful approach is to replace a base within the riboswitch with a fluorescent base analogue (FBA), with the most commonly used FBA being the adenine (A) analogue 2-aminopurine (2-AP; Fig. 1) (17). Fluorescence from 2-AP is modulated by its structural context, with stacking on neighboring bases typically inducing quenching (18), and changes in polarity additionally inducing spectral shifts (19). While FBAs are designed to preserve the Watson-Crick base pairing properties of the corresponding native bases, 2-AP has been shown to alter the structure and dynamics even of double-stranded DNA (20). FBAs may impact structural features that rely on non-Watson-Crick interactions to an even greater degree, and such interactions are common in the complex 3-dimensional structures that riboswitches and other RNAs can adopt (21). Some FBAs have been reported that preserve both the Watson-Crick and Hoogsteen faces of adenine, providing effective surrogates in a wide range of structural and enzymatic contexts (22–24), but lack of commercial availability has significantly limited their uptake. Due to this factor and its decades-long record as a useful probe, 2-AP remains by far the most widely used FBA despite having suboptimal structural and photophysical properties.
Figure 1.

2-Aminopurine and the preQ1 riboswitch. (a) Chemical structure of a Watson-Crick base pair between adenine and uracil. (b) Chemical structure of a Watson-Crick base pair between 2-AP and uracil. The re-positioned amine group is shown in purple. (c) The preQ1 riboswitch in its docked pseudoknot conformation, shown in Leontis-Westof notation (32). The P1, P2 and L3 domains are indicated in blue, green and red, respectively, and preQ1 is shown in cyan. Adenosine residues in L3 are numbered according to the color scheme used in subsequent figures.
To minimize structural perturbations, 2-AP is ideally placed at locations containing non-conserved nucleotides whose hydrogen bonding interactions are not altered by 2-AP substitution. It has been noted that these criteria are satisfied by as many as 10–15% of nucleotides in various riboswitches (25, 26). However, certain sites may be of interest precisely because of their high degree of conservation and non-canonical hydrogen bonding interactions. In these circumstances, 2-AP substitution may act as a perturbing “mutation” that serves concurrently as a spectroscopic probe. If its structural impacts are accounted for, 2-AP can be a useful tool even at highly conserved or structurally complex sites. The approach of using an FBA as a concurrent probe and mutation would be particularly valuable for the study of riboswitches for which high-resolution structures are not available. For such riboswitches, the significance of particular residues is typically inferred through mutagenesis and biochemical methods such as chemical secondary structure probing. FBAs such as 2-AP offer a chemical library of potential “mutations” that expands the 3-member library of native base substitutions, and, like the varied reagents used for secondary structure probing (27), different FBAs are sensitive to different aspects of RNA structure (for example, see ref. (28) for a comparison of 2-AP and the cytosine analogue pyrrolocytosine). Combining biochemical and spectroscopic approaches thus offers the potential to expand the level of insight that can be gained in the absence of high-resolution structures.
We utilized 2-AP as a concurrent probe and mutation to study the significance of tertiary interactions involving highly conserved adenosine residues in the Class 1 preQ1 riboswitch from Bacillus subtilis (Bsu; Fig. 1c), which is responsible for regulating genes involved in synthesis of the hypermodified nucleobase queuosine (29). This riboswitch binds to the metabolic intermediate preQ1, causing a conformational change that suppresses expression of genes involved in the production of queuosine by enhancing transcription termination (12). Its aptamer domain contains a stem-loop structure (P1) followed by an A-rich tail (L3), and preQ1 binding stabilizes a pseudoknot-structured “docked” conformation containing a second helix, P2 (9). The L3 domain of this riboswitch contains a stretch of 6 highly conserved A residues that participate in a complex network of hydrogen bonding with the minor groove of the P1 helix and the ligand-binding pocket (Fig. 1c) (9–11). 2-AP has been utilized extensively in Class I preQ1 riboswitches, particularly those from Thermoanaerobacter tengcongensis (Tte) (30, 31) and Fusobacterium nucleatum (Fnu) (4), with some prior work in Bsu (16), but L3 residues have gone mostly uninvestigated. The kinetics of structural rearrangements of residue A24 in the Tte preQ1 riboswitch (most closely analogous to A28 in Bsu; Fig. 1c) were investigated using 2-AP, revealing almost no change in fluorescence in response to Mg2+ and a moderate decrease in response to preQ1 (30). However, that base resides in a different sequence context, A(2-AP)C, than the corresponding residue A28 in the Bsu riboswitch, A(2-AP)A, and the L3 domain is one nucleotide longer in Tte.
We investigated riboswitch variants in which 2-AP replaced subsets of the six consecutive A residues in the L3 domain. Rather than pursuing structurally neutral FBA labeling sites, this work uses 2-AP to introduce site-specific disruptions in the structure. We used fluorescence spectroscopy to investigate how ligand binding affects the local environment at each labeling site, and to determine the affinity of each variant for preQ1. These measurements revealed a rich variety of photophysical impacts on 2-AP, which can be attributed to changes in both base stacking and local polarity that occur upon ligand binding (19). Fluorescence lifetime measurements on a subset of variants revealed that 2-AP samples multiple local environments and that ligand binding changes their relative prevalence. We additionally performed absorbance-based measurements that allowed us to directly compare the native riboswitch to the 2-AP-modified variants, which is not possible using fluorescence spectroscopy. Specifically, we used circular dichroism (CD) spectroscopy and thermal denaturation experiments to study the effects of 2-AP and preQ1 on the structure and stability of the riboswitch. We found that at every labeling site tested, 2-AP decreases the affinity of the riboswitch for preQ1, but the riboswitch still undergoes a global conformational change of a similar nature at sufficiently high ligand concentrations. Placing 2-AP distal to the ligand binding pocket makes the riboswitch more susceptible to thermal denaturation in the absence of preQ1, whereas the largest decreases in affinity were observed with 2-AP proximal to the binding pocket. Our results reveal that interactions involving the 6-amino groups of the A residues in L3 are critical for efficient ligand binding by the preQ1 riboswitch, and that the formation of these interactions is coupled to changes in base stacking and polarity.
MATERIALS AND METHODS
RNA oligonucleotides were purchased from Dharmacon (Horizon Discovery) and DNA oligonucleotides were purchased from Integrated DNA Technologies (sequences in Table S1). All modified oligonucleotides were HPLC-purified by the manufacturer, and the 3’ segments were purchased with a 5’ phosphate. Riboswitch samples were prepared by splinted ligation using T4 RNA ligase 2 (New England Biolabs M0239S). 5 nanomoles each of the 5’ and 3’ segments of the riboswitch and the DNA splint were combined and heated to 90 °C for 2 minutes and then allowed to cool to RT over 10 minutes. The manufacturer-provided RNA ligase 2 reaction buffer was added 30 seconds into cooling. After cooling, the mixture was diluted in reaction buffer to a total volume of 150 μL and 60 units of T4 RNA ligase 2 were added. The reactions were incubated at room temperature for 3 hours, then resolved on a 15% polyacrylamide-urea gel. The product band was recovered from the gel by electroelution using a BioRad model 422 electro-eluter followed by ethanol precipitation in the presence of 300 mM NaOAc, pH 5.3. 2-AP riboside was purchased from Tri-Link Biotechnologies.
All spectra were recorded at 20 °C with the sample in a buffer consisting of 20 mM NaiPO4 at pH 7.5 and 100 mM NaCl. Samples were heated to 90 °C for 2 minutes and then crash-cooled in ice water for 10 minutes before measurement in order to allow the RNA to fold without dimerizing. Where noted, MgCl2 was added after cooling to a final concentration of 1 mM. CD spectra and melting curves were recorded on a Jasco J-1500 spectrometer. Melting curves were recorded with the riboswitch at a concentration of 2 μM or AA(2-AP)AC at a concentration of 16 μM. The sample was heated at a rate of 0.75 °C per minute in a 1 cm path-length, low head-space cuvette (Starna 26.160/LHS) while monitoring CD and absorbance at a wavelength of 258 nm. CD spectra were recorded in a 1 cm path-length cuvette (Starna 16.160–10) with the riboswitch at a concentration of 2 μM. Scans were performed from 200 to 350 nm at a rate of 10 nm per minute with an integration time of 4 seconds and an excitation bandwidth of 2 nm, and four sequential scans were averaged together. CD titrations were performed with the riboswitch at a concentration of 50 nM in a 2 cm path-length cuvette. Spectra and melting curves were background-corrected by subtracting off a buffer scan (including preQ1 where appropriate). CD spectra were converted from units of millidegrees to extinction coefficient (L/mol*cm) using the following equation, where CD is the signal in millidegrees, C is the concentration in mol/L and L is the path length in cm:
Finally, they were converted to Δε per nucleotide by dividing by the number of nucleotides in the riboswitch, 38.
A fitting procedure was performed in Mathematica (Wolfram Research) to extract melting temperatures (Tm) and transition widths (ΔT) from melting curves (33). First, a linear fit was performed to the segment of the melting curve recorded between 75 and 80 °C, and was extrapolated to lower temperature. The absorbance vs. temperature curve was then converted to a proxy for the “fraction folded” at temperature T, θ(T), using the following equation:
where L(T) is the value of the linear fit at temperature T, A(T) is the recorded absorbance at temperature T, and A(Tmin) is the recorded absorbance at the lowest temperature. θ(T) was then fit using the following equation:
where a and b are the weights, TM1 and TM2 are the melting temperatures, and ΔT1 and ΔT2 are the widths of unfolding transitions 1 and 2, respectively. Each experimental replicate was fit individually, then the average and standard deviation of the resulting parameter values were determined.
Fluorescence spectra were recorded on an Edinburgh FS5 fluorometer with the RNA at a concentration of 500 nM. After each addition of ligand, the sample was briefly pipette mixed, stirred in the sample holder of the fluorometer for 4 minutes, then allowed to rest for 1 minute before scanning. Scans were performed from 325 to 500 nm with an excitation bandwidth of 5 nm at 305 nm, an emission bandwidth of 2 nm, and an integration time of 1 s. To account for the minor effect of dilution of the RNA due to ligand addition, spectra were corrected according to the following equation:
where Icor is the concentration-corrected intensity, IL is the uncorrected intensity at ligand concentration L, V0 is the initial volume of sample before any ligand was added, and VL is the cumulative volume of ligand that had been added before IL was measured.
The absorption spectrum of a 50 μM solution of preQ1 was recorded and used to correct fluorescence spectra for the inner filter effect using the following equation:
where Icor2 is the concentration- and inner filter effect-corrected intensity and Icor is the concentration-corrected intensity. A305 is the total absorbance of the sample at the excitation wavelength of 305 nm, calculated according to:
where 6000 L/mol*cm is the extinction coefficient of 2-AP, and 2166 L/mol*cm is the extinction coefficient of preQ1 at 305 nm determined from its absorbance spectrum. λmax was extracted by performing a Gaussian fit to the region of the spectrum between 350 and 380 nm.
3 replicates were performed for each fluorescence titration, the corrected fluorescence intensities or λmax values were averaged together, then the resulting curve was converted into fractional saturation (FS; scaled to run between 0 and 1). It was then fit with the following equation to extract an apparent KD, where R is the RNA concentration, L is the ligand concentration, and a is a scaling factor:
Fluorescence lifetime measurements were performed via time-correlated single photon counting on the Edinburgh FS5 in reverse mode using a 320 nm pulsed LED for excitation. Three replicates were performed for each sample, and a reconvolution fit was performed on each replicate in Edinburgh’s Fluoracle software. A 4-exponential model was required to achieve adequate fits for all riboswitch measurements (Table S2), whereas 2-AP riboside required only a single exponential. Average observed lifetimes ⟨τ⟩obs, dark populations α0 and corrected amplitudes of decay components αc were computed from the resulting fitting parameters as previously described (18, 34). One of the four exponential components had a lifetime of <100 ps for all samples tested. Its population and lifetime were considered unreliable due to the ~1 ns full width at half maximum of the instrument response function, so it was subsumed into the dark population in downstream analysis.
RESULTS AND DISCUSSION
The Bsu preQ1 riboswitch contains six consecutive A residues in its L3 domain, making it a natural system in which to employ 2-AP substitution. We prepared an unmodified riboswitch that lacked 2-AP, singly-labeled variants that contained 2-AP in position 27, 28, 29, 30, 31, or 32, as well as doubly-labeled variants containing 2-AP at positions 27 and 28, 30 and 31, or 31 and 32 (Fig. 1c). The bases in L3 are highly conserved (29), suggesting that alteration of them through 2-AP substitution could have detrimental impacts on riboswitch structure and function. Perhaps as a consequence of this, 2-AP labeling sites have been almost entirely limited to other locations in the preQ1 riboswitches from both Bsu (16) and other organisms (4, 30, 31). To account for this fact, we employed absorbance-based measurements that allowed us to directly compare modified and unmodified riboswitch variants, in addition to fluorescence measurements that exploited the sensitivity of 2-AP to local RNA structure.
Fluorescence spectroscopy: ligand affinity and comparison of modified variants
2-AP fluorescence exhibited a variety of behaviors at different labeling sites within L3. All riboswitch variants were quenched at least 4-fold compared to free 2-AP riboside, which is unsurprising given that 2-AP fluorescence is quenched as a result of base-stacking (18, 19, 35). Variants in which 2-AP is flanked by two A residues all exhibited similar fluorescence intensities in the absence of Mg2+ and preQ1, with a 20% difference in intensity between the brightest of them (position 30) and the darkest (position 29) (Fig. 2). Variants with 2-AP flanked by U and A (position 27) or A and C (position 32) both exhibited fluorescence only about half as intense as the other four. A short oligonucleotide containing 2-AP in the same sequence context as A31, AA(2-AP)AC, exhibited a very similar intensity and peak wavelength (λmax) to the position 28–31 variants, suggesting that these spectra are characteristic of 2-AP in a generic oligo(A) context rather than being altered significantly by the structure of the riboswitch. This is consistent with previous NMR measurements, which showed that in the absence of divalent cations (like most of our measurements), the sequence of L3 adopts a single-stranded A-form conformation both in the riboswitch and as an isolated 12-mer (36). In contrast, in the presence of Mg2+, preorganization of L3 has been observed by MD simulations (37) and smFRET (12, 14). To investigate this further, we recorded spectra of the position 29 and 31 variants in the presence of 1 mM MgCl2. While the fluorescence intensity of each variant was nearly unchanged by addition of Mg2+, a small (0.7 nm) but resolvable blueshift was observed for position 31 and a larger one for position 29 (2.5 nm), suggesting that 2-AP is in a more nonpolar environment in the presence of Mg2+ (19).
Figure 2.

Fluorescence measurements. “+Mg” indicates that the measurement was performed in 1 mM MgCl2. (a) Peak fluorescence intensity of each 2-AP-modified riboswitch variant (positions 27–32) at the initial concentration of 0 nM preQ1 (I, red) or the final (highest) concentration measured (F, blue). R = 2-AP riboside. O = oligonucleotide AA(2-AP)AC. The dashed line indicates the fluorescence intensity of AA(2-AP)AC. (b) Imax vs. [preQ1] for each variant over the range of 0 to 30000 nM preQ1 (full ranges shown in Fig. S1–S2). (c) Initial and final peak fluorescence wavelengths of riboswitch variants, 2-AP riboside and AA(2-AP)AC. (d) λmax vs. [preQ1] for each riboswitch variant. In panels b and d, red: position 27; orange: position 28; yellow: position 29; green: position 30; blue: position 31; purple: position 32. Error bars show the standard deviation across measurements on three samples.
Ligand titrations were performed using fluorescence emission spectroscopy to assess the structural changes induced by preQ1 binding and to estimate the affinities of 2-AP-modified variants for preQ1 (Figs. 2, S1 and S2, Table 1). A CD titration was performed on the unmodified riboswitch for comparison (Fig. S3). While binding affinities (KD) can be obtained more directly by methods that detect thermodynamic changes that occur upon binding, such as microscale thermophoresis (38) and isothermal titration calorimetry (39), 2-AP fluorescence has the benefit of simultaneously reporting on changes in the local environment at the labeling site. In the absence of Mg2+, the apparent KD values (Kapp) of 2-AP-labeled variants ranged from 360 nM with 2-AP at position 29 to over 20,000 nM for positions 31 and 32, in stark contrast to the value of 28 nM determined for the unmodified riboswitch via CD. Placing 2-AP at position 28 was quite detrimental (Kapp = 12,800 nM), which is surprising given that that site is the least conserved of the six (29). The fluorescence intensity and spectrum of each variant responded to preQ1 in a distinct manner, though the functional significance of these changes must be considered in light of the dramatic weakening of ligand binding in certain variants. Nevertheless, there was no obvious correlation between the affinity of a variant for preQ1 and the magnitude of the changes in its fluorescence intensity or λmax, showing that even if 2-AP substitution at a particular site decreases affinity, that residue may still undergo significant structural rearrangements at ligand concentrations sufficiently high for binding. Furthermore, our CD and thermal denaturation measurements (detailed below) indicate that the impacts of preQ1 on the global structure and stability of the riboswitch are similar for unmodified and modified variants. These observations suggest that 2-AP fluorescence provides meaningful information about how the local environments of L3 residues differ between the pre-docked and ligand-stabilized docked conformations.
Table 1.
Fluorescence titration results. ΔI: change in maximum intensity from 0 nM preQ1 to the highest concentration measured. ΔI/I0: change in intensity relative to intensity in the absence of ligand. Δλmax: change in maximum wavelength from starting to ending point. Kapp: apparent KD determined by fitting titration curve.
| Variant | ΔI (cts) | ΔI/I0 | Δλmax (nm)1 | Kapp (nM) |
|---|---|---|---|---|
| 27 | +1,800 | +8% | −2.8 | 7,900 (3,700)2 |
| 28 | +19,600 | +36% | −1.6 | 12,800 (9,100)2 |
| 29 | −19,400 | −40% | −4.3 | 360 (730)2 |
| 29+1 mM Mg2+ | −13,600 | −27% | −2.2 | 35 (82)2 |
| 30 | −41,400 | −68% | +0.3 | 4,800 |
| 31 | −7,200 | −12% | +0.1 | 24,900 |
| 31+1 mM Mg2+ | +10,700 | +19% | +0.7 | 19,000 |
| 32 | −7,100 | −25% | +0.4 | 28,400 |
Typical standard deviations in λmax were ±0.2–0.5 nm.
Based on λmax. All other values are based on Imax.
In addition to having the lowest fluorescence intensities in the absence of preQ1, the position 27 and position 32 variants also exhibited the smallest absolute changes in 2-AP fluorescence intensity upon ligand addition, with position 27 exhibiting an increase of only ~1,800 counts (8%). This slight change in intensity was non-monotonic as a function of preQ1 concentration (Fig. S4), leading to a titration curve fit that was significantly poorer (R2=0.982) than all other variants (R2=0.996–0.999). This variant exhibited the second-largest change in λmax upon addition of preQ1, and the concentration-dependence of λmax was much better fit (R2=0.998) than Imax. This yielded a Kapp of 3,700 nM, which is likely to be more reflective of this variant’s ligand binding behavior than the Imax-based value of 7,900 nM. The most significant changes in fluorescence intensity were observed with 2-AP at positions 28 (+36%), 29 (−40%) and 30 (−68%). Interestingly, the equivalents of our positions 29 and 30 are the only sites in L3 that exhibit reduced scission in the presence of preQ1 in in-line probing measurements, indicating an increase in the structural rigidity of the backbone (29). These variants were strongly quenched upon addition of preQ1, indicating that this increase in rigidity is accompanied by more extensive stacking on neighboring bases.
The Tte preQ1 riboswitch was found to tolerate 2-AP substitution at a variety of sites in the presence of 2 mM MgCl2 with only modest changes in KD, though KD was not determined for any A-to-2-AP substitutions in L3 (30). It is possible that the riboswitch is more tolerant of 2-AP substitution in the presence of Mg2+, so we investigated its impact on one strongly binding (position 29) and one weakly binding (position 31) variant. While addition of 1 mM Mg2+ to the position 31 variant only modestly improved its Kapp (from 24,900 to 19,000 nM), it changed the response of 2-AP to preQ1 from a slight decrease in intensity and no spectral shift to a slight redshift and increase in intensity. In contrast, position 29 retained the blueshift and quenching that it had exhibited in the absence of Mg2+, but with a significant improvement of Kapp from 390 nM to <100 nM.
As noted above, spectral shifts upon ligand addition were observed with 2-AP certain sites. Blueshifts in the emission spectrum occurred upon ligand addition with 2-AP at positions 27 (−2.8 nm), 28 (−1.5 nm) and 29 (−4.3 nm in the absence of Mg2+, −2.2 nm in the presence of 1 mM Mg2+) (Fig. 2 and Table 1). The other sites showed shifts no greater than 0.7 nm. Position 29 showed the largest blueshift, in keeping with its large change in fluorescence intensity. In stark contrast, position 30, which showed the largest absolute and relative change in intensity, showed no blueshift. It has been shown previously using deoxynucleosides that changes in base-stacking alone do not lead to spectral shifts in 2-AP fluorescence, while a decrease in solvent polarity causes both blueshifts and quenching (19). In the preQ1 riboswitch, NMR and x-ray crystal structures show that in the presence of ligand, the bases in L3 stack in sets of 2 (9, 11). A27 and 28 form a parallel stack with one another, as do A29 and 30, as do A31 and 32, with changes in angle existing between each set of stacked bases. A29–32 are nearly co-planar with distal bases, including base pairs in P1 in the case of A29 and A30, and U8 and U9 in the case of A31 and A32 (Fig. 1c). A28 is notably displaced and tilted relative to A29, breaking the chain of stacking and potentially explaining the increase in 2-AP fluorescence upon addition of ligand when it is at position 28. A pattern emerges when these stacking partners are considered as units. In the absence of Mg2+, 2-AP fluorescence increases upon addition of ligand in the 27–28 stack, decreases strongly in the 29–30 stack, and decreases slightly in the 31–32 stack. Superimposed on this pattern of fluorescence intensity changes, the three bases distal to the ligand binding pocket (27–29) exhibit blueshifts upon ligand addition while the three proximal bases do not.
The combination of blueshift and de-quenching observed with 2-AP at positions 27 and 28 is surprising, given that increased stacking would appear most likely to accompany a more nonpolar environment, while position 29 exhibits the more intuitive combination of blueshifting and quenching. It is important to note that the preQ1 riboswitch is known to sample multiple conformations under the experimental conditions utilized here (12–14), and steady-state emission spectra provide a population- and intensity-weighted average across this ensemble of structures. To investigate the distribution of structures present in solution, we performed fluorescence lifetime measurements using time-correlated single photon counting (TCSPC), focusing on the two variants that showed the largest spectral shifts upon ligand addition, positions 27 and 29 (Table 2 and Fig. S5). Both variants were investigated in the absence and presence of saturating preQ1, and the position 29 variant was additionally investigated in the presence of 1 mM MgCl2.
Table 2.
Observed average lifetime (⟨τ⟩obs), and populations (αic) and lifetimes (τi) of individual decay components obtained through TCSPC. α0 is a dark population whose decay timescale is not resolved (τ < 100 ps). The populations αic have been corrected to account for the presence of the dark population. Percentages may not add up to 100 due to rounding.
| Sample | Mg2+ | preQ1 | ⟨τ⟩obs (ns) | α0 (%) | α1c | τ1 | α2c | τ2 | α3c | τ3 |
|---|---|---|---|---|---|---|---|---|---|---|
| 2-AP riboside | 0 mM | 0 mM | 8.85 | 0 | 100 | 8.85 | ||||
| Position 27 | 0 mM | 0 uM | 3.4 | 74 | 17 | 2.1 | 8 | 5.2 | 1 | 10.4 |
| Position 27 | 0 mM | 42 uM | 2.4 | 60 | 26 | 1.1 | 13 | 4.3 | 1 | 10.8 |
| Position 29 | 0 mM | 0 uM | 3.6 | 49 | 24 | 1.9 | 21 | 4.3 | 5 | 9.0 |
| Position 29 | 0 mM | 20 uM | 2.3 | 50 | 37 | 1.6 | 10 | 3.5 | 2 | 8.9 |
| Position 29 | 1 mM | 0 uM | 3.4 | 45 | 29 | 1.8 | 20 | 4.1 | 6 | 8.9 |
| Position 29 | 1 mM | 20 uM | 2.6 | 49 | 39 | 1.9 | 11 | 4.7 | 1 | 12.8 |
Four exponential components were required to adequately fit the resulting fluorescence decays, which was unsurprising considering the complex decays observed even for systems as small as di- and trinucleotides (18, 40–42). Under all conditions tested, the decay time constants of both variants fell within the ranges of 10.9±2, 4.5±1, and 1.6±0.5 ns, along with a significant dark population with decay timescales too fast to resolve accurately with our instrumentation (Table 2). In all three cases (position 27 without Mg2+, and position 29 with and without Mg2+), addition of preQ1 increased the weight of the 1.6±0.5 ns component (Table 2). The conformation that exhibits this decay may therefore be responsible for the blueshift in fluorescence that occurs upon ligand addition in all three cases. Supporting this interpretation, the increase in weight of the ~1.6 ns component is most significant for the condition that exhibits the largest blueshift: position 29 in the absence of Mg2+. It has been previously shown that solvent effects alone are sufficient to shorten the fluorescence lifetime of 2-AP free base from >10 ns in neat H2O to ~1.5 ns in neat dioxane (19). The latter value is very similar to the 1.6±0.5 ns lifetime that we attribute to the “bluest” (most nonpolar) of the “bright” conformations that contribute significantly to the fluorescence of 2-AP at positions 27 and 29 in the preQ1 riboswitch (the local polarity of the dark population is not reflected in the steady-state emission spectrum due to its small contribution to the overall fluorescence). Furthermore, the longest decay component of >8 ns is consistent with the lifetimes observed for free 2-AP base and nucleosides in aqueous solution (18, 19, 42, 43). Hence, this low-prevalence component likely originates from an extra-helical conformation of 2-AP (42, 43), which would be the most solvent-exposed and thus the “reddest”.(44)
With 2-AP at position 27, the increase in the weight of the ~1.6 ns component occurs through a shift of population away from the dark conformation, explaining this variant’s increase in fluorescence intensity in the presence of preQ1. This increase in the prevalence of the bluest bright conformation occurs without a concomitant increase in the extra-helical conformation, explaining the observed blueshift upon ligand addition. With 2-AP at position 29, the increase in the ~1.6 ns component occurs through a shift away from the ~4.5 and ~10.9 ns decays in both the presence and absence of Mg2+, explaining this variant’s decrease in fluorescence intensity. The depletion of the extra-helical conformation contributes to the blueshift exhibited by this variant. We conclude that at positions 27 and 29, 2-AP can access a conformation that is protected from solvent but only moderately base-stacked (and thus bright enough to impact the steady-state emission spectrum). This conformation is enhanced upon ligand binding, and the accompanying changes in the emission intensity and spectrum are dictated by which alternative conformations are depleted.
CD spectroscopy and thermal denaturation: comparison of unmodified and modified variants
Absorbance-based measurements provided further insight into the behavior of L3, and into how 2-AP substitution alters the properties of the riboswitch. We recorded CD spectra and melting curves for each variant in the absence and presence of preQ1. While it can be challenging to extract quantitative structural information from the ultraviolet CD spectra of structured RNAs, they allowed us to determine whether different variants adopted similar global structures to one another, and whether their global structures changed in a similar manner upon preQ1 binding. Melting curves, which were recorded by monitoring CD and absorbance at 258 nm during heating, were used to assess the impacts of 2-AP and preQ1 on the structural stability of the riboswitch. Unfolding is typically indicated by an increase in the absorbance signal and a decrease in the CD signal.
CD spectroscopy.
We found that in the absence of preQ1, the unmodified riboswitch exhibits a CD spectrum that is similar to those reported for other RNAs that adopt a pseudoknot structure (45). When preQ1 was added, the CD spectrum exhibited a pronounced shift to more negative values (Fig. 3a), reflecting the shifting of equilibrium from the pre-docked (P2 not intact) to the docked (P2 intact) conformation (12, 13). In the absence of preQ1, the spectra of the modified variants are quite similar to one another and slightly less intense than the spectrum of the unmodified riboswitch (Fig. S6a). This difference indicates that 2-AP substitution causes a change in the electronic coupling between nearby bases that gives rise to the CD signal (46, 47). A decrease in the CD intensity upon 2-AP substitution is expected because of the differences in the electronic transitions of A and 2-AP, and should be most apparent when an AAA segment is replaced with an A(2-AP)A segment. Placing 2-AP at position 27 had the smallest impact on the lineshape and intensity of the CD spectrum, consistent with its position in a UAA context rather than an AAA context. These results suggest that all variants adopt similar global structures in the absence of preQ1. In the longest-wavelength absorption band of 2-AP (centered at 305 nm), the CD spectra of modified and unmodified variants could not be distinguished from one another, so no attempt was made to extract structural information specific to the 2-AP labeling site.
Figure 3.
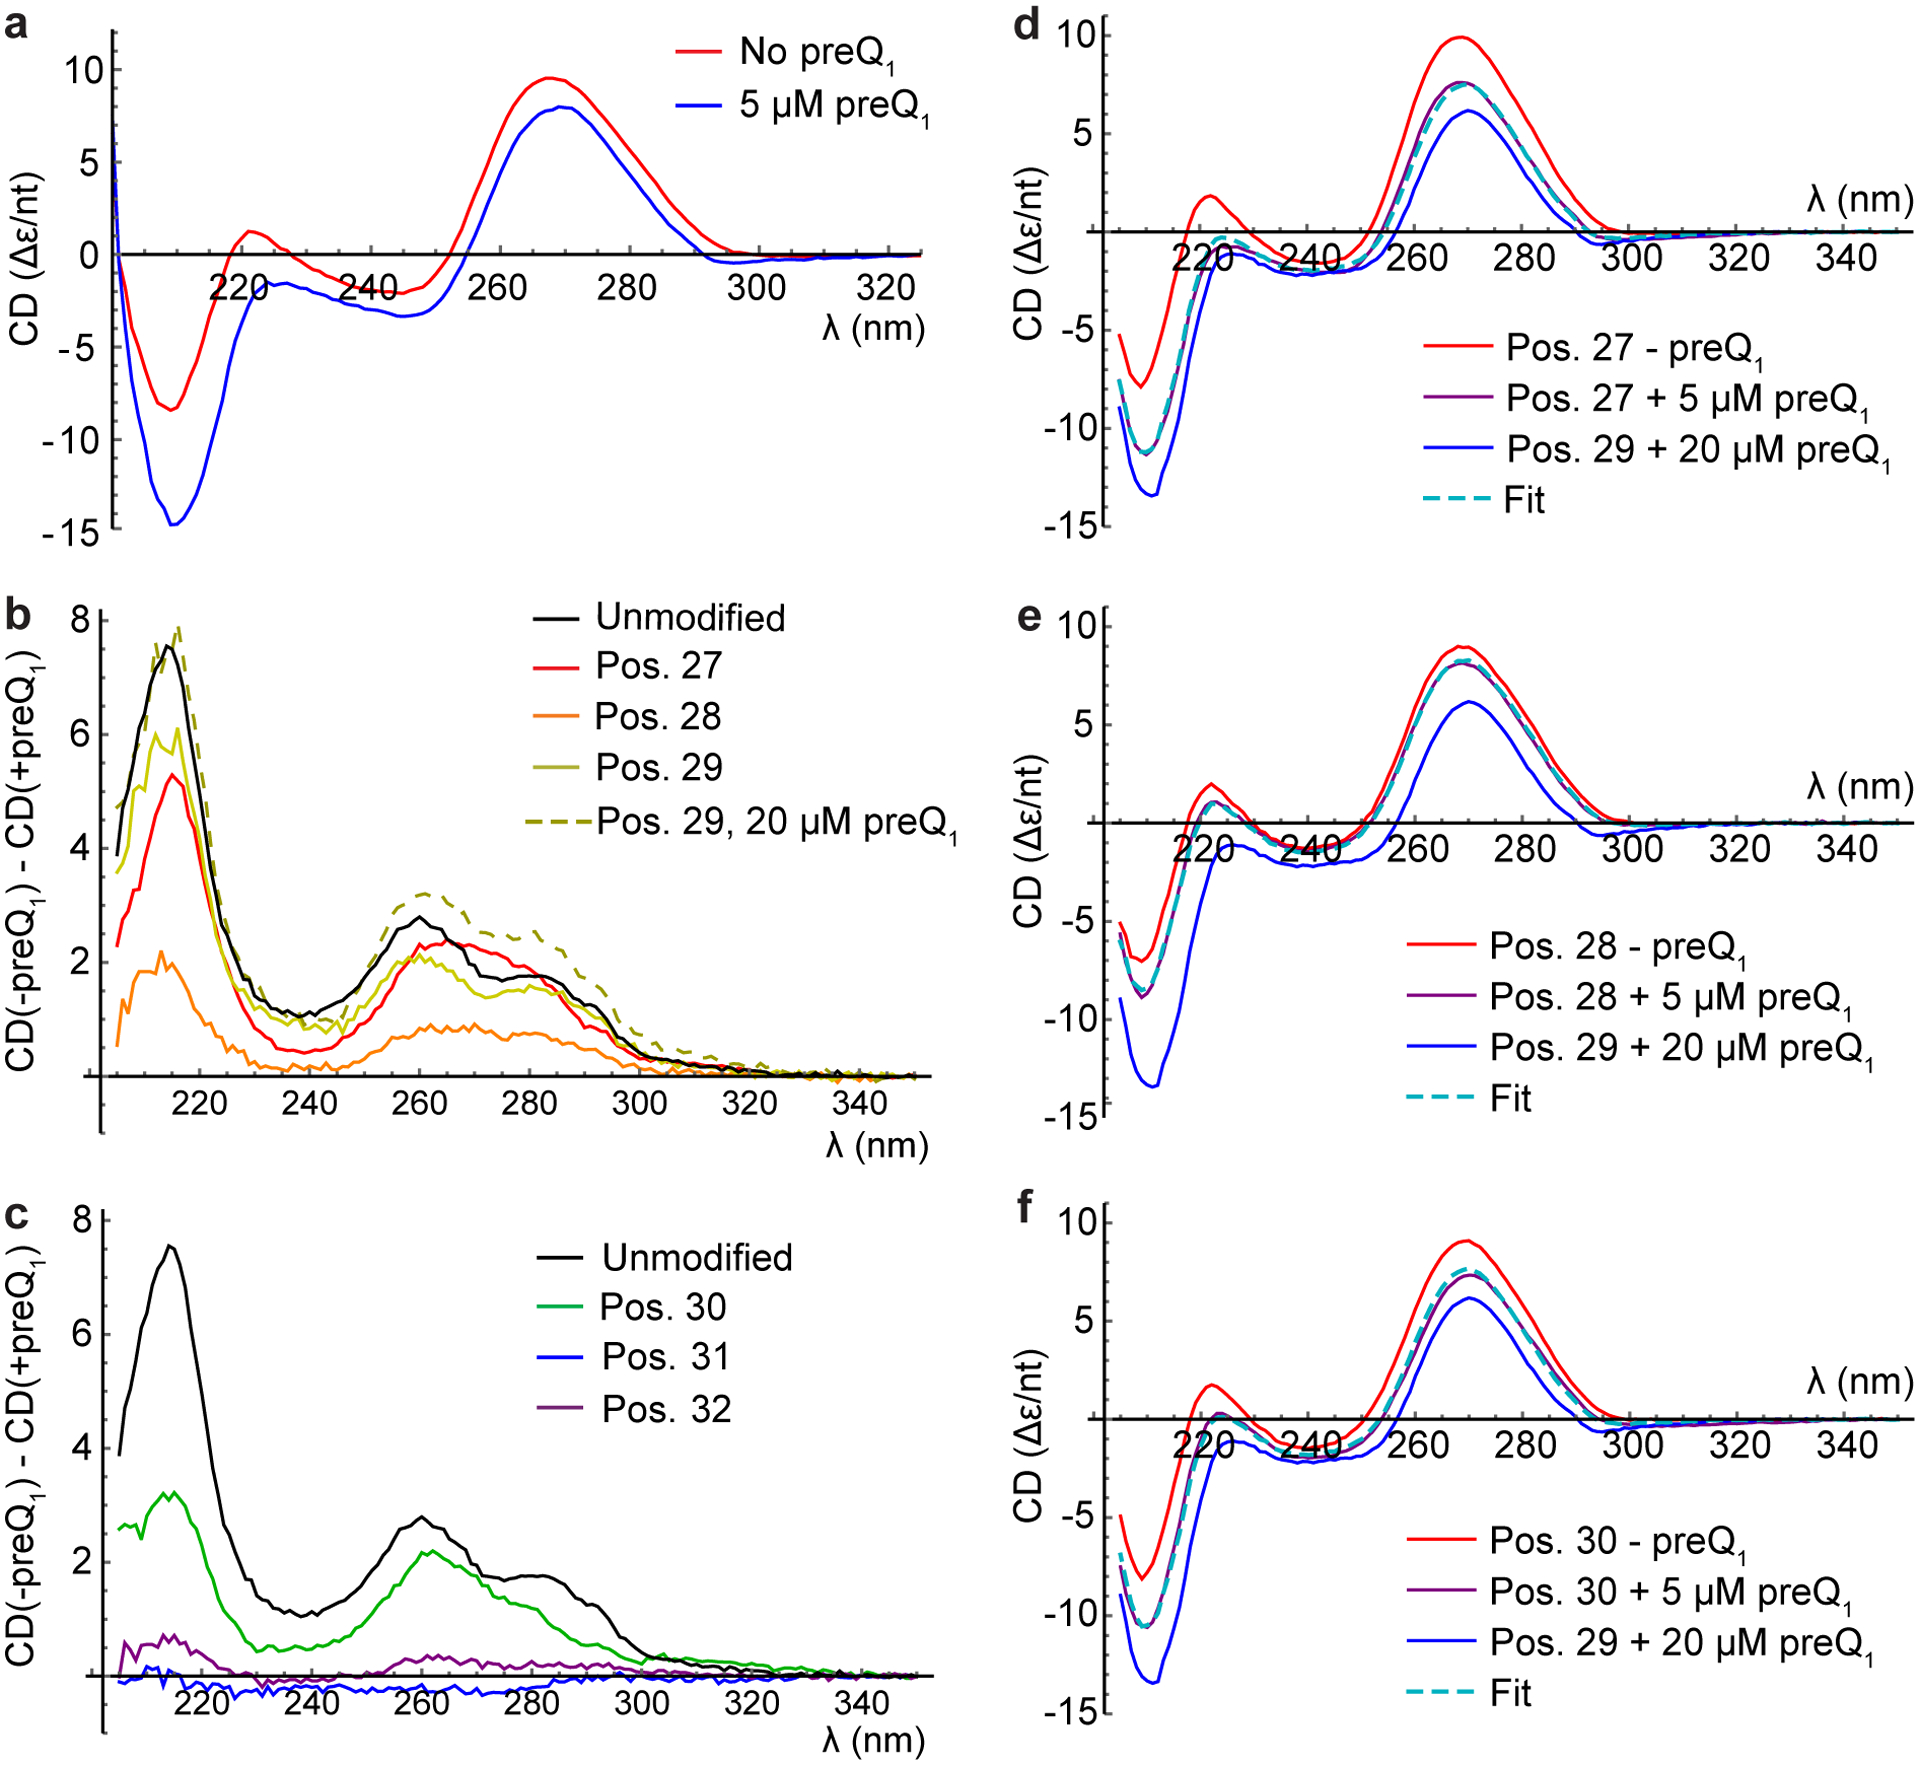
CD analysis of riboswitch variants in the absence of MgCl2. (a) Spectra of unmodified riboswitch in the absence (red) or presence (blue) of 5 μM preQ1. (b-c) Difference spectra where the CD spectrum recorded in the presence of ligand has been subtracted from the CD spectrum recorded in the absence of ligand. (b) Difference spectra for unmodified riboswitch and variants with 2-AP at positions 27, 28 and 29 using 5 μM preQ1, and position 29 using 20 μM preQ1. (c) Difference spectra for unmodified riboswitch and variants with 2-AP at positions 30, 31 and 32, all using 5 μM preQ1. (d-f) CD spectra fit with linear combinations of -preQ1 and Position 29 + 20 μM preQ1 spectra. (d) Position 27+ 5 μM preQ1 (purple) fit as a linear combination (dashed cyan) of position 27-preQ1 (red) and position 29+20 μM preQ1 (blue). (e) Corresponding plots for position 28. (f) Corresponding plots for position 30.
Most absorbance-based experiments in the presence of ligand were done with preQ1 at a concentration of 5 μM, which based on our Kapp measurements is saturating for the unmodified riboswitch and nearly saturating for the position 29 variant. The absorption peak of preQ1 lies at 260 nm, so for most variants, saturating concentrations of preQ1 would have very significant impacts on overall sample absorbance in the UV. For example, for a moderate affinity variant like position 30, a 2 μM RNA sample containing a saturating concentration of 50 μM preQ1 would have a total A260 of >1, half coming from preQ1. Hence, for most variants, we did not attempt to reach saturation in absorbance-based experiments, but instead considered the trends between the absence of preQ1 and partial saturation.
Upon addition of preQ1, the spectra of different variants became more distinct, with most exhibiting a general negative shift that was smaller than that exhibited by the unmodified riboswitch (Figs. 3 and S6). The position 29 variant was additionally measured at a saturating preQ1 concentration of 20 μM, which induced a shift comparable in magnitude to that exhibited by the unmodified riboswitch (Fig. 3b). If this spectrum is characteristic of a fully preQ1-bound riboswitch with a single 2-AP modification, partially saturated riboswitch spectra should be well fit with a linear combination of their respective -preQ1 spectra and the saturated position 29 spectrum. This is indeed what was found for the variants with moderate responses to 5 μM ligand (positions 27, 28 and 30; Fig. 3d–f). The fits predict that positions 27, 28 and 30 are 63%, 24% and 49% bound, respectively, in the presence of 5 μM preQ1, consistent with the trend in their Kapp values (Table 1). Even the weakest binder based on Kapp, the position 32 variant, exhibited negative shifts in the CD upon ligand addition at the same wavelengths as the unmodified riboswitch (Fig. 3c). This suggests that much of the variation in +preQ1 CD spectra is due to incomplete saturation, and that these variants are capable of undergoing conformational changes of a similar nature to the unmodified riboswitch at sufficiently high ligand concentrations. 2-AP modification at positions 27–30 and 32 thus alters the affinity of the riboswitch for preQ1 without altering the fundamental global structures it is capable of adopting.
In contrast, the CD spectrum of the second-weakest binder (position 31) exhibited a small positive shift upon ligand addition (Fig. 3c), suggesting that this variant does not undergo the same global conformational change as the others. We investigated this further by recording CD spectra and fluorescence titrations on this variant in the presence of 1 mM MgCl2, which was expected to counteract the disruptive 2-AP substitution. Indeed, in the presence of 1 mM Mg2+, preQ1 addition induced a small negative shift in the CD spectrum at the same wavelengths as observed in the absence of Mg2+ for all other variants (Fig. 4c). The fluorescence data reported above show that restoration of this “native” global conformational change significantly alters how the local environment of 2-AP at position 31 changes upon ligand binding, while only modestly improving the Kapp value (from 24,900 to 19,000 nM). This indicates that while 1 mM Mg2+ alters the global (based on CD) and local (based on fluorescence) conformations adopted by this variant, it is unable to compensate for the decrease in affinity induced by 2-AP substitution. In contrast, the position 29 variant maintains the same pattern of fluorescence quenching, blueshift in emission spectrum, and negative shift in CD spectrum (Fig. 4b) upon ligand addition regardless of whether 1 mM Mg2+ is present, but with a significant improvement in Kapp in the presence of Mg2+.
Figure 4.

Effects of MgCl2 on unmodified, position 29 and position 31 variants. Red curves are reproduced from Fig. 3 for ease of comparison. (a) Left: CD spectra of unmodified riboswitch in the absence of preQ1 and the absence (red) or presence (blue) of 1 mM MgCl2. Right: CD difference spectra using 5 μM preQ1 for unmodified riboswitch in the absence (red) or presence (blue) of 1 mM MgCl2. (b) Corresponding plots for position 29 variant. (c) Corresponding plots for position 31 variant.
CD and fluorescence both indicate that 2-AP substitution at positions 31 and 32 is particularly detrimental, while substitution at position 28 is surprisingly detrimental given its distance from the ligand-binding pocket. NMR (Fig. 5) and x-ray crystallography structures indicate that A31 normally forms a Hoogsteen base pair with U8, which in turn makes a hydrogen bond with preQ1 (9–11). Relocation of the 6-amino group of A31 through 2-AP substitution removes one of the two hydrogen bonds in this Hoogsteen base pair, destabilizing this network of interactions (Fig. 5b). Relocation of the 6-amino group of A32 is expected to break a hydrogen bond with preQ1 (Fig. 5c). In the crystal structure, A32 additionally makes a Hoogsteen base pair with U9 (9), but this interaction is not observed in the NMR structure which, like our data on this variant, was recorded in the absence of divalent cations (11)
Figure 5.

2-AP disrupts key hydrogen bonds when placed at position 31 or 32. (a) NMR structure of the riboswitch (PDB ID 2L1V) with the locations of preQ1, U8 and A31 indicated. (b) Closeup of the ligand-binding pocket showing interactions between U8, A31 and preQ1. Hydrogen bonds are indicated by blue lines, with dashed lines indicating bonds that are broken when A is replaced by 2-AP. (c) Closeup of the ligand binding pocket viewed from the same perspective showing interactions between A32 and preQ1.
Among the labeling sites that are not immediately adjacent to the ligand-binding pocket (positions 27–30), placing 2-AP at position 28 is particularly detrimental to ligand recognition. NMR and crystal structures indicate that each A residue within L3 makes tertiary interactions with residues in P1 (9–11). However, only in A28 does the 6-amino group make hydrogen bonds with members of two different base pairs in P1: U22, which base-pairs with A5, and G6, which base-pairs with C21. Replacing A28 with 2-AP would break these bridging hydrogen bonds, whereas replacing A27, A29 or A30 with 2-AP breaks hydrogen bonds that do not bridge multiple base pairs in P1. This may explain why substitution at position 28 is more detrimental to the affinity of the riboswitch for preQ1 than might be expected given its position.
Thermal denaturation experiments.
To assess the effects of 2-AP substitution on the stability of the riboswitch structure, thermal denaturation measurements were performed by monitoring CD and absorbance signals at 258 nm as the sample was heated. The melting curves of the riboswitch exhibit two transitions (Fig. 6). Based on its breadth and low temperature of onset, we attribute the first to the helix-to-coil transition within L3 (as observed in ref. (36) for a model oligonucleotide mimicking L3), and the higher-temperature transition to unfolding of the P1 helix. A mutant in which the P2 helix is destabilized, G13U, still exhibits two transitions, indicating that transition 1 is not related to unfolding of P2 (Fig. 6a). Furthermore, the oligonucleotide AA(2-AP)AC (described previously in the context of fluorescence measurements) shows a non-cooperative increase in A258 at low temperatures with a steeper slope than the unmodified or mutant riboswitches, but with a shallower slope than certain 2-AP-modified variants (Fig. 6b). This suggests that 2-AP substitution at certain sites destabilizes the single-stranded helical structure of L3.
Figure 6.

Thermal denaturation measurements. (a) Raw absorbance melting curves of unmodified riboswitch (black) and controls (G13U mutant in brown, AA(2-AP)AC in cyan). (b-c) Absorbance melting curves of unmodified and 2-AP-modified variants recorded at 258 nm in the absence (b) or presence (c) of 5 μM preQ1. For ease of comparison, the curves were shifted and normalized to run from a minimum of 0 to a maximum of 1. (d) Rescaled melting curves of unmodified riboswitch (black) and position 29 variant (yellow solid) in the presence of 5 μM preQ1, and position 29 variant in the presence of 20 μM preQ1 (yellow dashed).
In the absence of preQ1, clear differences between the variants are noticeable at low temperatures and apparent when the curves are fit (Fig. 7 and Fig. S7). Transition 1 occurs at Tm = 24 ± 2°C in the unmodified riboswitch and at a lower temperature in the 2-AP-modified variants, having a value of Tm = 10.2 ± 0.1°C with 2-AP at position 27. Tm 1 increases gradually as 2-AP is moved toward the ligand binding pocket to 22.3 ± 0.4°C with 2-AP at position 32. This indicates that 2-AP disrupts L3 most significantly when it is placed near the “hinge” where the two domains adjoin, and less significantly when it is near the ligand-binding pocket. 2-AP has little effect on Tm 2 (Fig. 7c), which is expected because L3 is already in a random coil conformation at that temperature.
Figure 7.

Fitting parameters extracted from absorbance melting curves. Three experimental replicates were fit individually, and the average and standard deviation of each parameter value are plotted. (a) Melting temperature of transition 1 for the unmodified riboswitch (“Unmod.”), singly-labeled variants (27–32), and doubly-labeled variants (27/28, 30/31, and 31/32). Values in the presence of saturating preQ1 are shown for unmodified (5 μM) and position 29 (20 μM) variants. (b) Width of transition 1. (c) Melting temperature of transition 2. (d) Width of transition 2.
When preQ1 is added to the unmodified riboswitch, transition 1 shifts to a significantly higher temperature, from Tm = 24 ± 2°C to 48 ± 1°C; Fig. 6c and Fig. 7) and narrows from ΔT = 10.4 ± 0.2°C to 5.6 ± 0.6°C. This suggests that the L3-P1 interactions that exist in the ligand-bound structure suppress the low-temperature helix-to-coil transition. The melting temperature of transition 2 changes only slightly (from 55.4 ± 0.6°C to 59 ± 1.2°C, while its width decreases to a smaller extent than seen for transition 1 (from 4.7 ± 0.1°C to 3.5 ± 0.1°C; Fig. 6c–d). Addition of saturating (20 μM) preQ1 to the position 29 variant induces nearly identical changes in the fitting parameters, though transition 1 remains very slightly lower and broader than in the unmodified riboswitch (Fig. 6d). All other variants exhibit intermediate effects of preQ1 that are consistent in magnitude with the effects seen by CD, with 5 μM preQ1 inducing almost no change in the melting curves of the position 31 and 32 variants and moderate changes in the melting curves of the position 27, 28 and 30 variants. As with the CD spectra, this is due at least in part to the fact that these variants are not saturated at 5 μM preQ1.
When the CD signal is monitored at 258 nm in the absence of preQ1, all variants exhibit a monotonic decrease in intensity as the temperature is increased, as expected. In the presence of preQ1, all variants except for position 31 exhibit an increase in CD intensity, followed by a decrease starting around 45 °C (Fig. S8). To investigate this surprising observation, we recorded CD spectra at different temperatures during thermal ramping. We observed that in the presence of preQ1, the lineshape of the CD spectrum changes with temperature in a manner that leads to a transient increase in CD intensity at 258 nm, while the overall intensity of the spectrum decreases monotonically. As a result, the CD signal at 258 nm is not a simple reflection of the fraction of RNA still folded. Above a temperature of 40 °C, the spectra recorded in the absence and presence of preQ1 no longer differ from one another, suggesting that ligand dissociation happens around this temperature.
Multiple 2-AP labeling sites.
We next investigated whether replacement of multiple A residues with 2-AP would have an additive or cooperative effect on riboswitch folding. We recorded CD spectra and melting curves on variants with 2-AP placed at positions 27 and 28, or positions 30 and 31, or positions 31 and 32 (Fig. S9). In general, a second 2-AP substitution had little impact beyond the more influential of the two single substitutions. For example, the CD spectrum of the position 27 variant exhibits a strong response to 5 μM preQ1, while the position 28 variant exhibits a moderate response. When 2-AP is placed at both positions, the response is nearly identical to what is observed in the position 28 variant (Fig. S9a). The same observation is noted when comparing melting curves of singly- and doubly-labeled variants. In the absence of preQ1, the absorbance melting curve of each doubly-labeled variant is indistinguishable by eye from that of the more influential singly-labeled variant (Fig. S9d–f), and fitting of the melting curves supports this observation (Fig. 6). A slight additional impact of the second 2-AP residue is observed in melting curves recorded in the presence of 5 μM preQ1 (Fig. S9g–i).
Conclusions
The work presented here comprises a systematic study of the structural changes in the A-rich tail of the preQ1 riboswitch that occur upon ligand binding, and how chemical modifications within this domain impact the structure and stability of the riboswitch. The significant impairment of ligand affinity by 2-AP substitution shows that strong ligand binding is dependent on interactions involving the 6-amino group of every A residue in L3. While L3 behaves essentially as a single-stranded RNA in the absence of preQ1, ligand binding redistributes the A residues within it between local environments with variable base-stacking and polarity. This work shows that the interactions between L3 and P1 observed in structural studies are critical to high-affinity ligand binding, and that valuable information can be obtained by using FBAs to simultaneously probe and perturb RNA structure.
Supplementary Material
ACKNOWLEDGMENTS:
This work has been supported in part by NIH R00 GM120457.
Footnotes
SUPPLEMENTARY MATERIALS
Tables S1–S2 and Figures S1–S9 can be found at DOI: 10.1562/2006-xxxxxx.s1.
REFERENCES
- 1.Sherwood AV and Henkin TM (2016) Riboswitch-mediated gene regulation: Novel RNA architectures dictate gene expression responses. Annu. Rev. Microbiol 70, 361–374. 10.1146/annurev-micro-091014-104306. [DOI] [PubMed] [Google Scholar]
- 2.Caron M-P, Bastet L, Lussier A, Simoneau-Roy M, Massé E and Lafontaine DA (2012) Dual-acting riboswitch control of translation initiation and mRNA decay. Proc. Natl. Acad. Sci 109, E3444–E3453. 10.1073/pnas.1214024109. [DOI] [PMC free article] [PubMed] [Google Scholar]
- 3.Li S and Breaker RR (2013) Eukaryotic TPP riboswitch regulation of alternative splicing involving long-distance base pairing. Nucleic Acids Res. 41, 3022–3031. 10.1093/nar/gkt057. [DOI] [PMC free article] [PubMed] [Google Scholar]
- 4.Rieder U, Kreutz C and Micura R (2010) Folding of a transcriptionally acting PreQ1 riboswitch. Proc. Natl. Acad. Sci. USA 107, 10804–10809. 10.1073/pnas.0914925107/-/DCSupplemental/pnas.0914925107_SI.pdf. [DOI] [PMC free article] [PubMed] [Google Scholar]
- 5.Harbaugh SV, Goodson MS, Dillon K, Zabarnick S and Kelley-Loughnane N (2017) Riboswitch-based reversible dual color sensor. ACS Synth. Biol 6, 766–781. 10.1021/acssynbio.6b00199. [DOI] [PubMed] [Google Scholar]
- 6.You M, Litke JL and Jaffrey SR (2015) Imaging metabolite dynamics in living cells using a Spinach-based riboswitch. Proc. Natl. Acad. Sci. USA 112, E2756–E2765. 10.1073/pnas.1504354112. [DOI] [PMC free article] [PubMed] [Google Scholar]
- 7.Jia X, Zhang J, Sun W, He W, Jiang H, Chen D and Murchie AIH (2013) Riboswitch control of aminoglycoside antibiotic resistance. Cell 152, 68–81. 10.1016/j.cell.2012.12.019. [DOI] [PubMed] [Google Scholar]
- 8.Blount KF and Breaker RR (2006) Riboswitches as antibacterial drug targets. Nat. Biotechnol 24, 1558–1564. 10.1038/nbt1268. [DOI] [PubMed] [Google Scholar]
- 9.Klein DJ, Edwards TE and Ferré-D’Amaré AR (2009) Cocrystal structure of a class I preQ1 riboswitch reveals a pseudoknot recognizing an essential hypermodified nucleobase. Nat. Struct. Mol. Biol 16, 343–344. 10.1038/nsmb.1563. [DOI] [PMC free article] [PubMed] [Google Scholar]
- 10.Kang M, Peterson R and Feigon J (2009) Structural insights into riboswitch control of the biosynthesis of queuosine, a modified nucleotide found in the anticodon of tRNA. Mol. Cell 33, 784–790. 10.1016/j.molcel.2009.02.019. [DOI] [PubMed] [Google Scholar]
- 11.Zhang Q, Kang M, Peterson RD and Feigon J (2011) Comparison of solution and crystal structures of preQ1 riboswitch reveals calcium-induced changes in conformation and dynamics. J. Am. Chem. Soc 133, 5190–5193. 10.1021/ja111769g. [DOI] [PMC free article] [PubMed] [Google Scholar]
- 12.Widom JR, Nedialkov YA, Rai V, Hayes RL, Brooks CL III, Artsimovitch I and Walter NG (2018) Ligand modulates cross-coupling between riboswitch folding and transcriptional pausing. Mol. Cell 72, 541–552. 10.1016/j.molcel.2018.08.046. [DOI] [PMC free article] [PubMed] [Google Scholar]
- 13.Suddala KC, Rinaldi AJ, Feng J, Mustoe AM, Eichhorn CD, Liberman JA, Wedekind JE, Al-Hashimi HM, Brooks CL III and Walter NG (2013) Single transcriptional and translational preQ1 riboswitches adopt similar pre-folded ensembles that follow distinct folding pathways into the same ligand-bound structure. Nucleic Acids Res. 41, 10462–10475. 10.1093/nar/gkt798. [DOI] [PMC free article] [PubMed] [Google Scholar]
- 14.Suddala KC, Wang J, Hou Q and Walter NG (2015) Mg2+ shifts ligand-mediated folding of a riboswitch from induced-fit to conformational selection. J. Am. Chem. Soc 137, 14075–14083. 10.1021/jacs.5b09740. [DOI] [PMC free article] [PubMed] [Google Scholar]
- 15.Sarkar B, Ishii K and Tahara T (2021) Microsecond folding of preQ1 riboswitch and its biological significance revealed by two-dimensional fluorescence lifetime correlation spectroscopy. J. Am. Chem. Soc 143, 7968–7978. 10.1021/jacs.1c01077. [DOI] [PubMed] [Google Scholar]
- 16.Petrone PM, Dewhurst J, Tommasi R, Whitehead L and Pomerantz AK (2011) Atomic-scale characterization of conformational changes in the preQ1 riboswitch aptamer upon ligand binding. J. Mol. Graph. Model 30, 179–185. 10.1016/j.jmgm.2011.07.006. [DOI] [PubMed] [Google Scholar]
- 17.Ward DC and Reich E (1969) Fluorescence studies of nucleotides and polynucleotides. J. Biol. Chem 244, 1228–1237. 10.1016/S0021-9258(18)91833-8. [DOI] [PubMed] [Google Scholar]
- 18.Widom JR and Hoeher JE (2022) Base-stacking heterogeneity in RNA resolved by fluorescence-detected circular dichroism spectroscopy. J. Phys. Chem. Lett 13, 8010–8018. 10.1021/acs.jpclett.2c01778. [DOI] [PMC free article] [PubMed] [Google Scholar]
- 19.Rachofsky EL, Osman R and Ross JBA (2001) Probing structure and dynamics of DNA with 2-aminopurine: Effects of local environment on fluorescence. Biochemistry 40, 946–956. 10.1021/bi001664o. [DOI] [PubMed] [Google Scholar]
- 20.Dallmann A, Dehmel L, Peters T, Mügge C, Griesinger C, Tuma J and Ernsting NP (2010) 2-Aminopurine incorporation perturbs the dynamics and structure of DNA. Angew. Chem. Int. Ed 49, 5989–5992. 10.1002/anie.201001312. [DOI] [PubMed] [Google Scholar]
- 21.Butcher SE and Pyle AM (2011) The molecular interactions that stabilize RNA tertiary structure: RNA motifs, patterns, and networks. Acc. Chem. Res 44, 1302–1311. 10.1021/ar200098t. [DOI] [PubMed] [Google Scholar]
- 22.Gaied NB, Glasser N, Ramalanjaona N, Beltz H, Wolff P, Marquet R, Burger A and Mély Y (2005) 8-vinyl-deoxyadenosine, an alternative fluorescent nucleoside analog to 2′-deoxyribosyl-2-aminopurine with improved properties. Nucleic Acids Res. 33, 1031–1039. 10.1093/nar/gki253. [DOI] [PMC free article] [PubMed] [Google Scholar]
- 23.Rovira AR, Fin A and Tor Y (2017) Expanding a fluorescent RNA alphabet: synthesis, photophysics and utility of isothiazole-derived purine nucleoside surrogates. Chem. Sci 8, 2983–2993. 10.1039/C6SC05354H. [DOI] [PMC free article] [PubMed] [Google Scholar]
- 24.Rovira AR, Fin A and Tor Y (2015) Chemical mutagenesis of an emissive RNA alphabet. J. Am. Chem. Soc 137, 14602–14605. 10.1021/jacs.5b10420. [DOI] [PMC free article] [PubMed] [Google Scholar]
- 25.Soulière MF, Haller A, Rieder R and Micura R (2011) A powerful approach for the selection of 2-aminopurine substitution sites to investigate RNA folding. J. Am. Chem. Soc 133, 16161–16167. 10.1021/ja2063583. [DOI] [PubMed] [Google Scholar]
- 26.Haller A, Soulière MF and Micura R (2011) The dynamic nature of RNA as key to understanding riboswitch mechanisms. Acc. Chem. Res 44, 1339–1348. 10.1021/ar200035g. [DOI] [PubMed] [Google Scholar]
- 27.Weeks KM (2010) Advances in RNA structure analysis by chemical probing. Curr. Opin. Struct. Biol 20, 295–304. 10.1016/j.sbi.2010.04.001. [DOI] [PMC free article] [PubMed] [Google Scholar]
- 28.Hardman SJO, Botchway SW and Thompson KC (2008) Evidence for a nonbase stacking effect for the environment-sensitive fluorescent base pyrrolocytosine—Comparison with 2-aminopurine. Photochem. Photobiol 84, 1473–1479. 10.1111/j.1751-1097.2008.00368.x. [DOI] [PubMed] [Google Scholar]
- 29.Roth A, Winkler WC, Regulski EE, Lee BWK, Lim J, Jona I, Barrick JE, Ritwik A, Kim JN, Welz R, Iwata-Reuyl D and Breaker RR (2007) A riboswitch selective for the queuosine precursor preQ1 contains an unusually small aptamer domain. Nat. Struct. Mol. Biol 14, 308–317. 10.1038/nsmb1224. [DOI] [PubMed] [Google Scholar]
- 30.Frener M and Micura R (2016) Conformational rearrangements of individual nucleotides during RNA-ligand binding are rate-differentiated. J. Am. Chem. Soc 138, 3627–3630. 10.1021/jacs.5b11876. [DOI] [PMC free article] [PubMed] [Google Scholar]
- 31.Schroeder GM, Dutta D, Cavender CE, Jenkins JL, Pritchett EM, Baker CD, Ashton JM, Mathews DH and Wedekind JE (2020) Analysis of a preQ1-I riboswitch in effector-free and bound states reveals a metabolite-programmed nucleobase-stacking spine that controls gene regulation. Nucleic Acids Res. 48, 8146–8164. 10.1093/nar/gkaa546. [DOI] [PMC free article] [PubMed] [Google Scholar]
- 32.Leontis NB and Westhof E (2003) Analysis of RNA motifs. Curr. Opin. Struct. Biol 13, 300–308. 10.1016/S0959-440X(03)00076-9. [DOI] [PubMed] [Google Scholar]
- 33.Mergny J-L and Lacroix L (2003) Analysis of thermal melting curves. Oligonucleotides 13, 515–537. [DOI] [PubMed] [Google Scholar]
- 34.Greiner VJ, Kovalenko L, Humbert N, Richert L, Birck C, Ruff M, Zaporozhets OA, Dhe-Paganon S, Bronner C and Mély Y (2015) Site-selective monitoring of the interaction of the SRA domain of UHRF1 with target DNA sequences labeled with 2-aminopurine. Biochemistry 54, 6012–6020. 10.1021/acs.biochem.5b00419. [DOI] [PubMed] [Google Scholar]
- 35.Jean JM and Hall KB (2001) 2-Aminopurine fluorescence quenching and lifetimes: Role of base stacking. Proc. Natl. Acad. Sci 98, 37–41. 10.1073/pnas.98.1.37. [DOI] [PMC free article] [PubMed] [Google Scholar]
- 36.Eichhorn CD, Feng J, Suddala KC, Walter NG, Brooks CL III and Al-Hashimi HM (2012) Unraveling the structural complexity in a single-stranded RNA tail: implications for efficient ligand binding in the prequeuosine riboswitch. Nucleic Acids Res. 40, 1345–1355. 10.1093/nar/gkr833. [DOI] [PMC free article] [PubMed] [Google Scholar]
- 37.Gong Z, Zhao Y, Chen C, Duan Y and Xiao Y (2014) Insights into ligand binding to preQ1 riboswitch aptamer from molecular dynamics simulations. PLOS ONE 9, e92247. 10.1371/journal.pone.0092247. [DOI] [PMC free article] [PubMed] [Google Scholar]
- 38.Jerabek-Willemsen M, André T, Wanner R, Roth HM, Duhr S, Baaske P and Breitsprecher D (2014) MicroScale Thermophoresis: Interaction analysis and beyond. J. Mol. Struct 1077, 101–113. 10.1016/j.molstruc.2014.03.009. [DOI] [Google Scholar]
- 39.Bastos M, Abian O, Johnson CM, Ferreira-da-Silva F, Vega S, Jimenez-Alesanco A, Ortega-Alarcon D and Velazquez-Campoy A (2023) Isothermal titration calorimetry. Nat. Rev. Methods Primer 3, 1–23. 10.1038/s43586-023-00199-x. [DOI] [Google Scholar]
- 40.Jean JM and Hall KB (2004) Stacking−unstacking dynamics of oligodeoxynucleotide trimers. Biochemistry 43, 10277–10284. 10.1021/bi049701p. [DOI] [PubMed] [Google Scholar]
- 41.Somsen OJG, Keukens LB, de Keijzer MN, van Hoek A and van Amerongen H (2005) Structural heterogeneity in DNA: Temperature dependence of 2-aminopurine fluorescence in dinucleotides. Chem. Phys. Chem 6, 1622–1627. 10.1002/cphc.200400648. [DOI] [PubMed] [Google Scholar]
- 42.Somsen OJG, Hoek van A. and Amerongen van H. (2005) Fluorescence quenching of 2-aminopurine in dinucleotides. Chem. Phys. Lett 402, 61–65. 10.1016/j.cplett.2004.11.122. [DOI] [Google Scholar]
- 43.Guest CR, Hochstrasser RA, Sowers LC and Millar DP (1991) Dynamics of mismatched base pairs in DNA. Biochemistry, 30, 3271–3279. 10.1021/bi00227a015 [DOI] [PubMed] [Google Scholar]
- 44.Xu D, Evans KO and Nordlund TM (1994) Melting and premelting transitions of an oligomer measured by DNA base fluorescence and absorption. Biochemistry, 33, 9591–9599. 10.1021/bi00198a027 [DOI] [PubMed] [Google Scholar]
- 45.Johnson KH and Gray DM (1992) Analysis of an RNA pseudoknot structure by CD spectroscopy. J. Biomol. Struct. Dyn 9, 733–745. [DOI] [PubMed] [Google Scholar]
- 46.Burin AL, Armbruster ME, Hariharan M and Lewis FD (2009) Sum rules and determination of exciton coupling using absorption and circular dichroism spectra of biological polymers. Proc. Natl. Acad. Sci 106, 989–994. 10.1073/pnas.0808513106. [DOI] [PMC free article] [PubMed] [Google Scholar]
- 47.Ji H, Johnson NP, von Hippel PH and Marcus AH (2019) Local DNA base conformations and ligand intercalation in DNA constructs containing optical probes. Biophys. J 117, 1101–1115. 10.1016/j.bpj.2019.08.006. [DOI] [PMC free article] [PubMed] [Google Scholar]
Associated Data
This section collects any data citations, data availability statements, or supplementary materials included in this article.