

Abstract
Efficient sanitation system management relies on vigilant sewage surveillance to uphold environmental hygiene. The absence of robust monitoring infrastructure jeopardizes unimpeded conduit flow, leading to floods and contamination. The accumulation of harmful gases in sewer chambers, coupled with tampered lids, compounds sewer network challenges, resulting in structural damage, disruptions, and safety risks from accidents and gas inhalation. Notably, even vehicular transit is vulnerable, facing collisions due to inadequately secured manholes. The core objective of this research was to deconstruct and synthesize a prototype blueprint for a live-feed sewer monitoring framework (LSMF). This involves creating a data gathering nexus (DGN) and empirically assessing diverse wireless sensing implements (WSI) for precision. Simultaneously, a geographic information matrix (GIM) was developed with algorithms to detect sewer surges, blockages, and missing manhole covers. Three scrutinized sensors—the LiDar TF-Luna, laser TOF400 VL53L1X, and ultrasonic JSN-SR04T—were evaluated for their ability to measure water levels in sewer vaults. The results showed that the TF-Luna LiDar sensor performed favorably within the 1.0–5.0 m range, with a standard deviation of 0.44–1.15. The TOF400 laser sensor ranked second, with a more variable standard deviation of up to 104 as obstacle distance increased. In contrast, the JSN-SR04T ultrasonic sensor exhibited lower standard deviation but lacked consistency, maintaining readings of 0.22–0.23 m within the 2.0–5.0 m span. The insights from this study provide valuable guidance for sustainable solutions to sewer surveillance challenges. Moreover, employing a logarithmic function, TF-Luna Benewake exhibited reliability at approximately 84.5%, while TOF400 VL53L1X adopted an exponential equation, boasting reliability approaching approximately 89.6%. With this navigational tool, TF-Luna Benewake maintained accuracy within ±10 cm for distances ranging from 8 to 10 m, showcasing its exceptional performance.
Keywords: Sewer monitoring, Sensors, Internet of things, Geographic information system, Sewer chamber
1. Introduction
The urban sewer infrastructure stands as a fundamental pillar of contemporary cityscapes, managing the flow of wastewater and diverse liquid waste. Nonetheless, these sewer networks are not immune to an array of challenges, encompassing obstructions, surges, leaks, and the conspicuous presence of exposed manhole apertures [1]. The repercussions of such predicaments resonate far and wide, casting a shadow of severity. The aftermath of clogs, surges, and leaks extends to the contamination of surroundings, infiltrating water sources and soil, imperiling both human and animal well-being. Such sewer overflows engender property harm, foul odors, and the allurement of pests [2]. The thriving equilibrium of an urban ecosystem also pivots upon the orchestration of waste management protocols. Regrettably, a comprehension deficit spurs people to recklessly discard refuse onto thoroughfares, ushering in soluble detritus like plastics that infiltrate sewer channels, obstructing drainage networks [3]. Discerning the precise congestion point through manual means remains a formidable challenge. Maintenance exacts a heavy temporal toll, financial repercussions, and exacts a poignant human toll. The unguarded manhole covers cast a shadow of peril upon public safety, precipitating accidents and harm to pedestrians, cyclists, and motorists [4]. Moreover, they become conduits for pollutants, detritus, and perilous substances, further exacerbating the preexisting tribulations. To avert these conundrums, the imperative lies in vigilantly monitoring sewer conditions and proactively intervening prior to calamitous episodes. Historically, conventional means involve physical reconnaissance of sewer conduits, manholes, and their accompanying lids. This necessitates descending workers into the subterranean labyrinths for manual inspections, encompassing an assortment of activities, including visual scrutiny, smoke trials, dye assessments, acoustic vigilance, Closed-Circuit Television (CCTV) surveys, Ground-Penetrating Radar, as well as flow measurement. Nevertheless, these methodologies bear the burdens of risk and time, riddled with limitations spanning from peril to inaccuracy, circumscribed coverage, reactive maintenance, data paucity, weather-dependent operability, and accessibility constraints [5,6].
In the present landscape, the evolution of sewer monitoring mechanisms through contemporary technologies has ascended in significance, ushering real-time insights into sewer system dynamics sans human intervention [7]. Notably, the advent of Internet of Things (IoT) technology has manifested as a pragmatic paradigm in our data-centric, automated epoch. Comprising interconnected devices, IoT orchestrates data exchange without human mediation, spanning from vehicles to refrigerators, lighting fixtures, and a gamut of gadgets, thereby furnishing an avenue for streamlined and cost-effective system management [8]. In the contemporary milieu, the surveillance of sewer networks pivots upon sensors. The discerning selection of a fitting sensor constitutes a pivotal facet of sewer monitoring system design, wielding dominion over data accuracy and dependability. The recourse to ill-matched sensors can engender errant data, precipitating suboptimal decision-making and exorbitant rectification undertakings [9,10]. In recent times, there has been a notable endeavor to explore the potential applications of sensors within sewerage systems. For instance, Fernández et al. [11] delved into the assessment of h2s gas sensors, developing a procedural framework for managing sensors in sewer monitoring. Another contribution by See et al. [12] centered around an acoustic sensor designed to monitor the condition of screens in combined sewer overflow situations within drainage infrastructure. Thiyagarajan et al. [13] embarked on a project involving a resilient sensor suite coupled with predictive analytics, resulting in an anomaly detection model for intelligently monitoring moisture conditions on the surfaces of concrete sewer pipes. In a separate investigation, Sambito and Freni [14] engaged in the optimal placement of water quality sensors within sewers during both dry and wet weather scenarios. Their study introduced a Bayesian probabilistic approach to strategically position water quality sensors within urban drainage networks, aimed at detecting unauthorized intrusions in varying weather conditions. Tomperi et al. [15] conducted a study focused on estimating the wastewater flowrate within a gravitational sewer line using an affordable distance sensor. The research explored the application of a soft sensor-based approach to assess inflow and infiltration, providing insights into the sewer line's condition. In comparison to existing literature, the research provides a comprehensive solution that integrates multiple components—DGN, WSI, and GIM—to address a wide range of challenges in sewage surveillance. This holistic approach sets it apart from previous studies that might have focused on specific aspects. Additionally, the evaluation of multiple sensors and their performance characteristics offers valuable insights for selecting the most suitable sensor for different scenarios, which is a distinctive aspect of this work. Overall, the study contributes essential guidance for implementing sustainable solutions to enhance sewage surveillance practices.
The challenging environment within the sewer manhole posed difficulties for ensuring the reliability of distance measurements based on ultrasonic principles. However, through the development of a model-based soft sensor, there appeared to be potential for precise wastewater flowrate estimation. The authors also claimed that, this approach, when combined with supplementary data, could offer the capability to effectively monitor inflows and infiltrations. These studies represent only a small portion of the extensive research conducted in the field, reflecting the collective endeavor to discover viable solutions for addressing challenges within sewer networks through the utilization of sensor technologies. While the potential of employing sensors for sewer system monitoring is acknowledged, the realm of scientific inquiry has yet to fully plumb the depths of their efficacy in anticipating overflows, preempting pipe blockages, and flagging potential breaches in manhole covers. A notable dearth of comprehensive insights persists, leaving the landscape of their practical application relatively uncharted. More disconcerting still is the scant exploration of melding laser and infrared sensors, an Arduino microcontroller, and Geographic Information Systems (GIS) to discern overflows, blockages, and open manhole vulnerabilities. Predominantly, research endeavors have directed their focus toward the dimensions of quality and health in the realm of sewage sensors [14,16,17].
The knowledge frontier in this domain beckons further exploration, given the insufficiency of integrated sensor insights for sewer system monitoring, alongside the prediction of overflows, obstruction discernment, and manhole cover detection bolstered by Geographic Information Systems (GIS). Furthermore, it is noteworthy to highlight that Geographic Information Systems (GIS) have demonstrated significant utility within the realm of sewerage systems, a subject extensively explored across various research undertakings. For instance, Ghavami et al. [18], conducted a study focusing on a proficient strategy for evaluating the risk of failure in urban sewer pipelines. This approach integrated GIS and AHP-DEA methodologies. Lim et al. [19], carried out research that involved a GIS-centered examination of potential sewer blockages within the Western Sydney Region. Likewise, Abebe et al. [20], undertook research exploring the planning of storm sewer pipe renewal, taking into account factors such as deterioration, climate change, and urbanization. This was achieved through the utilization of a dynamic Bayesian network and a GIS framework. The modern paradigm of sewer monitoring systems, as discussed earlier, bestows manifold merits upon the domain, yet it doesn't escape certain drawbacks: steep costs, energy consumption, technical intricacies, and the intricate management of amassed data necessitating specialized expertise. To grapple with these limitations, this study endeavors to incubate an IoT-enabled prototype sewer monitoring system. This envisioned system would harness energy-efficient sensors, an Arduino microcontroller, wireless communication technologies, and accessible APIs. Its purview entails real-time sewer monitoring, engendering the capability to prognosticate overflow events, detect obstructions within pipes, and vigilantly observe the opening and closing of manhole covers, thus preempting potential sewer system quandaries without human intervention. The resultant architecture shall comprise an assembly of wireless sensing devices and a data accumulation hub that channel the gathered insights to a GIS. The dividends of real-time sewer monitoring encompass proactive system management, mitigating or averting sewer backups and street inundations, curtailing sanitary sewer overflows, curbing combined sewer overflows, preempting excessive sediment accumulation, and optimizing cleansing protocols. It also enables the strategic governance of flow rates reaching wastewater treatment facilities, affording mastery during unexpected disruptions, spanning equipment breakdowns to security contingencies. Therefore, the imperative of steadfast drainage system surveillance assumes significance as replacements bear a twofold cost – financial and the disruption of daily life. Most crucially, real-time collection system condition monitoring empowers utilities to safeguard public health while trimming operational and capital expenses. However, it's important to acknowledge the limitations of the proposed method in other IoT-based real-time applications. One significant limitation could be the requirement for substantial infrastructure to support the deployment of wireless sensing implements and data gathering. This might restrict the method's scalability and applicability in areas with limited resources or remote locations especially in low-income countries [21]. Additionally, the reliance on wireless communication for real-time data transmission might introduce concerns about signal interference, reliability, and potential communication failures, which could impact the accuracy and effectiveness of the system.
The study is driven by multifaceted objectives, striving to accomplish diverse milestones. Central to this pursuit is the exploration of a myriad of components, culminating in the inception of a prototype framework for a real-time sewer monitoring system (RTSMS). Integral to this venture is the assembly of a data collection station (DGS), serving as the crucible for gathering pertinent information. Concurrently, a meticulous assessment of assorted wireless sensing devices (WSD) is orchestrated, their precision held under the scrutiny of evaluation. Furthermore, the study endeavors to craft a robust Geographic Information System (GIS) fortified with algorithms of discernment. This GIS stands poised to seamlessly amalgamate functionalities, unfurling the potential to unearth sewer overflow occurrences, pinpoint blockages within conduits, and unveil the presence of manhole covers within its purview.
2. State-of-the-art literature
Efficient sanitation system management is a cornerstone of urban hygiene and public health. A critical aspect of this management is the continuous surveillance of sewage systems to prevent disruptions, contamination, and environmental hazards. Traditional methods of sewer system monitoring have often fallen short in providing real-time insights into water levels, structural integrity, and potential cover tampering within sewer chambers. This gap in monitoring infrastructure has led to numerous challenges, including unimpeded conduit flow disruptions, floods, accumulation of harmful gases, structural damage, and even safety risks due to gas inhalation and accidents. Moreover, inadequately secured manhole covers pose threats not only to the sewage infrastructure but also to vehicular transit. Due to many other challenges associated with sewer networks there have been effeorts in incorporating sensors for real-time monitoring of sewer networks.
Nourinejad, and Berman, and Larson [9] delved into the strategic placement of sensors within sewer networks with the specific goal of detecting emerging cases of the coronavirus. This research endeavor builds upon the findings of a preceding study, encompassing six notable dimensions: (1) the introduction of the concept of in-manhole sensors, aimed at reducing the need for extensive on-site testing of multiple manholes; (2) the presentation of a realistic model of a tree network, elucidating the underlying topology of the sewer pipeline network; (3) the proposal of a method to generate random tree networks for simulation purposes, effectively capturing essential attributes of distinct communities; (4) the empirical validation, through simulations, that the average and median count of manholes necessitating opening during a search adheres to a recognizable logarithmic pattern; (5) the formulation of methodologies to ascertain the optimal count of sensors to be deployed; (6) the translation of the sensor placement conundrum into a challenge of integer nonlinear optimization, complemented by the development of heuristic strategies to tackle it. Realizing the envisioned sensor-manhole system would mandate additional research and development across three critical phases: (a) devising an accurate, cost-effective, and swift SARS-CoV-2 genetic remnants test amenable to execution at the manhole level; (b) conceiving, validating, and manufacturing the sensors; (c) conducting field trials and refining the operational implementation of the system.
Banik et al. [22], embarked on a research pursuit centered around the evaluation of diverse strategies for tactically positioning sensors within sewer systems. Their research publication introduced and juxtaposed multiple methods for optimization, both multiobjective and single-objective in nature, all aimed at attaining the optimal arrangement of sensors within sewer networks. The multiobjective strategies encompassed objective functions associated with information theory (termed as the IT procedure), detection time and reliability (designated as the DR procedure), and a hybrid amalgamation of both considerations (termed as the IT_DR procedure). In parallel, the single-objective approaches included a heuristic-driven objective function (referred to as the GR procedure) and a fused objective function (referred to as the DR_IT_GR procedure). Outcomes derived from the application of these methodologies showcased analogous performance within a limited network context. However, when transposed to practical sewer systems, the findings illuminated that: (1) the IT-based methodology exhibited effectiveness as a filtering mechanism; (2) the DR_IT_GR procedure exhibited superior performance among other multiobjective methods; and (3) the GR procedure efficiently identified Pareto extreme solutions.
Stoianov et al. [23], explored the realm of Sensor Networks for Monitoring Water Supply and Sewer Systems: An Examination Based on the Boston Case Study. Their study delved into the development of a prototype monitoring system that strategically amalgamates the advancements in wireless sensor networks with the advancements in hydraulic and water quality modeling. The culmination of this effort led to the successful deployment of the prototype monitoring system at the Boston Water and Sewer Commission (BWSC) in December 2004. This system adeptly collects and visualizes hydraulic and water quality data in near-real time, along with data pertaining to combined sewer outflows (CSO). A standout feature of this remote monitoring system is its unique functionalities, including the capability for high sampling rates, reaching up to 1000 S/s, meticulous time synchronization at intervals as precise as 1 ms, and the capability for in-network data processing. Such attributes open up new vistas for wireless data collection, enabling various applications like hydraulic pressure transients and remote acoustic leak detection. Additionally, the system accommodates low-duty cycle tasks such as the monitoring of water quality parameters and water levels within CSOs. The field trial conducted with BWSC yielded invaluable insights, contributing to the refinement of both prototype hardware and software tools. Furthermore, it shed light on the challenges inherent in deploying and operating sensor networks to effectively manage and oversee expansive water supply systems.
Tatiparthi et al. [24], delved into the development of radio-frequency identification (RFID) sensors intended for smart monitoring applications within sewer systems. Within this research endeavor, the authors conceptualized sensors based on ultrahigh-frequency radio-frequency identification (UHF RFID) technology, with a specific focus on their suitability for rapid evaluations of sanitary and stormwater conduits. Employing 3D printing techniques, they crafted these sensors to be buoyant at the juncture between water and air, strategically minimizing the impact of water on the communication of RF signals. They also determined the most optimal range for effective detection, a parameter critical for designing and positioning readers at various utility access points. Empirical trials validated the efficacy of the UHF RFID system, showcasing its economic viability, capacity for high-throughput operations, and robust performance in overseeing issues such as obstructions, unauthorized connections, and water flow dynamics within sewer networks.
Kim et al. [25], conducted research on the subject of in-situ sewer gas monitoring with their study titled "sewersnort: a drifting sensor for in-situ sewer gas monitoring." Within the study, they introduced SewerSnort, an autonomous and cost-effective in-sewer gas monitoring system. The innovation entails employing a sensor float that originates from an upstream station and navigates to the terminal pumping station, acquiring gas measurements that are tagged with location information. The data gathered by SewerSnort offers a precise profile of gas exposure, intended for preemptive maintenance or remedial measures. The significant advancements of SewerSnort encompass its comprehensive automated monitoring solution and the energy-efficient self-localization approach. The successful implementation hinges on two pivotal components: the mechanical design of the floating mechanism, tailored to conform to sewer constraints, and the sensor's embedded design, crafted to seamlessly align with the float's physical dimensions and satisfy stringent energy limitations. To validate their concept, the researchers executed experiments utilizing a terrestrial emulator, demonstrating the viability of SewerSnort, particularly in terms of the localization technique and the integration of the embedded sensor design.
The research findings also underscored that among various monitoring approaches, sensory methods exhibit a more favorable balance between benefits and drawbacks. Several of the studies discussed in this section made use of such methods, while others did not opt for them. The primary advantage offered by sensory methods is their cost-effectiveness relative to alternative techniques. However, some of the reviewed papers highlighted a notable drawback in the form of elevated expenses associated with the monitoring equipment. Furthermore, there is a susceptibility of sensor damage when exposed to water, which is not an issue when assessing reflectance and absorbance. Recent advancements in sewer surveillance, as demonstrated by the groundbreaking live-feed sewer monitoring framework and sensor assessment, represent substantial headway in tackling challenges within sanitation systems. These innovative solutions hold the potential to elevate sewer monitoring, offering valuable insights for streamlined sanitary management, heightened environmental cleanliness, and the robustness of urban infrastructure.
3. Materials and methods
The prototype of the Real-Time Sewer Monitoring System (RTSMS) came into existence through the application of the "waterfall model," a sequential and linear methodology (Table 1). This entails a systematic progression encompassing requirement gathering, system architecture design, implementation, and subsequent functionality verification. The prototype embarked on its journey driven by a core set of imperatives encompassing wireless sensing for discerning parameters like sewer overflow, pipe blockages, and manhole cover movements, facilitated by a wireless multisensory apparatus. Complementing this, a dedicated data gathering station assumed importance, aggregating insights from wireless sensing devices. The system's potency was elevated through integration with Geographic Information System (GIS) technology, translating amassed data onto an interactive map. The prototype's stature was further fortified by its inherent ability for real-time surveillance, offering early warnings and foresight into sewer issues. Ensuring user-friendly engagement, the interface was designed for intuitive use across diverse roles. The prototype's sustainability hinged on its cost-efficiency over the long term. The architectural design endeavor included a comprehensive exploration of electronic components, leading to the synthesis and empirical evaluation of distinct permutations of these elements. Elaborated specifications of these components are presented in Table 1, Table 2, Table 3, Table 4, Table 5.
Table 1.
Specification of sensors.
| Characteristics | Sharp GP2Y0A41SK0F [26] | TOF400 VL53L1X [27] | JSN-SR04T [28] | TF-Luna Benewake [29] | FC-28 [30] | YL-63 with LM393 comparator [31] |
|---|---|---|---|---|---|---|
| Manufacturer | ||||||
| Sensor type | Infrared | Laser | Ultrasonic | LiDAR | Analog | Infrared |
| Voltage, V | 4.5–5 | 3–5 | 5 | 5 | 3.3–5 | 3.3–5 |
| Amperage, mA | 30 | 40 | 30 | 70 | 15 | 120 |
| Interface type | analog | digital | digital | digital | analog, digital | analog, digital |
| Connection pins | V0, GND, VCC | VIN, GND, SCL, SDA, XSHUT, GPIO1 | VCC, GND, TRIG, ECHO | VCC, GND, RX, TX | VCC, GND, D0, A0 | VCC, GND, OUT |
| Measurement range, m | Up to 0.3 | Up to 4 | Up to 5 | Up to 8 | – | Up to 0.3 |
| Operating temperature, °C | −10 to 60 | −20 to 70 | −10 to 70 | −20 to 75 | −40 to 60 | −20 to 80 |
| Dimensions, mm | 29.5 × 13.0 × 13.5 | 17 × 18 × 7 | 41 × 28.5 | 30 × 21.25 × 13.5 | 20 × 60 | 43 × 16 × 7 |
| Pricea, USD | 9.68 | 18.15 | 14.04 | 24.90 | 1.23 | 0.65 |
Since the components were purchased locally, the prices were converted according to the exchange rate for the date March 31, 2023 [32], which was 448.05 KZT for 1 USD.
Table 2.
Specification of microcontrollers.
| Characteristics | ATmega328P [33] | ESP8266MOD [34] |
|---|---|---|
| Manufacturer | Microchip Technology/Atmel | Espressif Systems |
| Processor core type | AVR | Tensilica L106 |
| Program memory size, kB | 32 | 50 |
| Maximum clock frequency, MHz | 20 | 160 |
| Data bus width, bit | 8 | 32 |
| Operating voltage, V | 2.7 to 5.5 | 2.5 to 3.6 |
| Amperage, mA | 0.01 to 0.8 | 80 |
| Interface type | I2C, SPI, USART | I2C, SPI, USART, SDIO, I2S, IR |
| ADC | 8 × 10b | 1 channel |
| IEEE 802.11 support | – | b/g/n/d/e/i/k/r |
| Operating temperature, °C | −40 to 125 | −40 to 125 |
| Dimensions, mm | 7 × 7 × 1 | 24 × 16 × 4 |
| Printed circuit board (PCB) | Custom printed | NodeMCU [35] |
| Pricea, USD | 6.2 | 6.74b |
Since the components were purchased locally, the prices were converted according to the exchange rate for the date March 31, 2023 [32], which was 448.05 KZT for 1 USD.
Total price for NodeMCU firmware including ESP8266MOD microcontroller.
Table 3.
Specification of communication modules.
| Characteristics | Lora Ra-02 on the SX1278 chip [36] | Wi-Fi within ESP8266 ESP-12F [34] | SIM800L GSM/GPRS [37] |
|---|---|---|---|
| Manufacturer | Ai-Thinker | Espressif Systems | SIMCom |
| Communication protocol | LoRaWAN | Wi-Fi | GPRS |
| Operating voltage, V | 2.5 to 3.7 | 2.5 to 3.6 | 3.4 to 4.4 |
| Amperage, mA | 12.15 | 80 | 2000 |
| Frequency range, MHz | 433 | 2400 to 2483.5 | 850 to 1900 |
| Communication distance, m | Up to 10000 | Up to 50 | Within the coverage area |
| Transmitting power, Mbps | Up to 0.027 | Up to 54 | Up to 0.856 |
| Operating temperature, °C | −30 to 85 | 40 to 125 | −40 to 85 |
| Dimensions, mm | 17 × 16 × 3.2 | 24 × 16 × 4 | 15.8 × 17.8 × 2.4 |
| Pricea, USD | 7.63 | Counted in NodeMCU | 8.88 |
Since the components were purchased locally, the prices were converted according to the exchange rate for the date March 31, 2023 [32], which was 448.05 KZT for 1 USD.
Table 4.
Specification of cases.
| Characteristics | RYD-F3-2 [38] | Custom, as in [39] |
|---|---|---|
| Manufacturer | Digital Zakka | Handmade |
| Material | Acrylonitrile butadiene styrene (ABS) | Two-component polyurethane |
| Waterproof | IP67 | IP67 |
| Dimensions, mm | 115 × 90 × 55 | 200 × 85 × 65 |
| Pricea, USD | 10 | 1.2 |
Since the components were purchased locally, the prices were converted according to the exchange rate for the date March 31, 2023 [32], which was 448.05 KZT for 1 USD.
Table 5.
Specification of power suppliers.
| Characteristics | LS 14500 [40] | RS-15-5 [41] |
|---|---|---|
| Manufacturer | SAFT | Mean Well |
| Type of power supply | Battery | Transformer |
| Type of current | DC | AC/DC |
| Output power, W | – | 15 |
| The output voltage, V | 3.6 | 5 |
| Output current, A | – | 3 |
| Nominal capacity, Ah | 2.6 | – |
| Nominal energy, Wh | 9.36 | – |
| Input voltage range, V | – | 85 to 264 |
| Operating temperature, °C | −60 to 85 | −20 to 70 |
| Battery holder | Included | – |
| Dimensions, mm | Ø14.62 × 50.28 (AA) | 62.5 × 51 × 28 |
| Pricea, USD | 6 | 9.67 |
Since the components were purchased locally, the prices were converted according to the exchange rate for the date March 31, 2023 [32], which was 448.05 KZT for 1 USD.
Deliberations concerning sensor selection encompassed a multifaceted array of parameters (Table 2). Market availability, cost considerations, power consumption thresholds, operational principles, intricacies of debugging, as well as data interface availability and type all were meticulously weighed for comparative assessment. Diverse sensors exhibited distinctive power consumption profiles and technical attributes, intricately entwined with their measurement principles. Yet, adjudging the aptness of a specific sensor solely based on its technical traits proved elusive, necessitating the execution of empirical investigations to discern the feasibility of their amalgamation. The blueprint encompassed the evaluation of a cadre of distance measurement sensors, comprising Sharp GP2Y0A41SK0F, TOF400 VL53L1X, JSN-SR04T, and TF-Luna Benewake, geared to detecting the presence of manhole covers and potential overflow scenarios. The envisaged approach entailed periodic distance measurements between the manhole cover and liquid surface, with any abrupt deviations indicating potential anomalies necessitating attention. For the pursuit of identifying pipe blockages, the tandem of FC-28 and YL-63 sensors was cherry-picked for their plausible utility. The envisioned concept for the pipe blockage sensor revolved around the discernment of critical levels of sediment or debris, relying on electrical conductivity (for FC-28) or optical observations (for YL-63). However, upon scrutinizing the FC-28, its inadequacy came to the fore. The sensor's correlation of electrical conductivity with sediment moisture content led to biased records in the presence of debris. Furthermore, circumstances surfaced where both pipe blockages and unobstructed flow would yield near-constant moisture levels, barring infrequent instances of non-flow. Moreover, the FC-28's vulnerability to external pressures, including liquid flow, accentuated by its fragile components, precipitated potential breakage.
The assembly of the Wireless Sensing Device (WSD) centered around the ATmega328P microcontroller, which boasts essential technical capabilities for seamless data collection, processing, and subsequent transmission via the Serial Peripheral Interface (SPI) (Table 3). Its notable feature lies in its efficient power consumption, pivotal for sustained autonomy. The integration of supplementary interfaces facilitated the seamless incorporation of wireless modules, elevating the desired self-sufficiency level. With clock frequency and memory capacity aligned with requirements, it effectively realizes the intended functionality. In contrast, the foundation of the Data Gathering Station (DGS) rested upon the ESP8266MOD microcontroller, often integrated into the NodeMCU firmware [41], chosen for its seamless Wi-Fi connectivity. The SPI interface provided simultaneous linkage with additional wireless or alternate modules, leading to the inclusion of a RobotDyn SD card module [42] coupled with a microSD card (cumulatively priced at 4.5 USD). This arrangement established a provisional repository for sensor data during Wi-Fi disruptions. While autonomy took a back seat for the DGS, the essential criterion encompassed versatile wireless communication support, substantial program memory, and ample storage capacity for collected data until successful transmission to the server. The selection of these microcontrollers is fortified by their open-source code, facilitating effortless customization tailored to specific needs, thereby enhancing adaptability and optimization potential.
The envisioned system unfolds within the realm of IoT, entailing the strategic integration of diverse data transmission interfaces. As the system's construction took shape and communication methodologies were selected, pivotal considerations encompassed data traffic volume, power efficiency, and the feasibility of operation without regulatory entanglements from network providers and governmental bodies (Table 4). The transmission of data from the Wireless Sensing Device (WSD) necessitated criteria like low power consumption and long-range coverage, prompting the adoption of LoRaWAN. This communication modality empowers data transmission up to 100 m with a mere 12.15 mA operating current, dipping even lower during standby mode. The commendably low power consumption during operation significantly elongates battery life, rendering it an apt choice. The available bandwidth comfortably accommodates the anticipated data load. At the Data Gathering Station (DGS), the dual deployment of LoRaWAN and subsequent transmission via Wi-Fi materialized. This design decision derives from the DGS's consistent access to an external power source and the absence of power consumption constraints, alongside its installation within the Wi-Fi coverage area. While the potential use of GPRS was contemplated, the SIM800L module's voltage output demand of 3.4–4.4 V and a maximum 2 A operating current would have introduced complexities and compromised reliability in the design. As a result, the pragmatic choice of Wi-Fi for data transmission to the server was embraced.
For the Wireless Sensing Device (WSD), the selection gravitated towards the RYD-F3-2 ABS plastic enclosure, renowned for its durability (Table 5). Its waterproof integrity upholding the IP67 standard coupled with its adaptable size and form-fitting capabilities to house electronic components rendered it a natural choice, effectively safeguarding against liquid incursions and dust infiltration. The four strategically positioned holes at the edges catered to seamless anchor attachment, optimizing secure placement. On the other hand, the Data Gathering Station (DGS) enclosure was meticulously crafted through a bespoke two-component liquid polyurethane molding and casting process, enabling rapid attainment of adequate structural strength within a mere minute of casting. Both enclosures comprised dual plastic components - a container and a lid - precisely fastened together by four screws. To ensure an airtight seal along the lid's perimeter groove, rubber gaskets were thoughtfully incorporated into both cases. Mitigating the risks of fogging and condensation, silica gel packets were poised to coexist within the enclosures alongside the electronic components, ensuring optimal internal conditions.
The LS 14500 batteries were opted for to power the WSD due to their noteworthy frost resistance and extended operational lifespan. As for energizing the DGS, the RS-15-5 switching power supply transformer emerged as the choice for converting high voltage current to a level compatible with the ESP8266MOD microcontroller. The selected power sources' compact dimensions facilitated their seamless integration within the enclosures.
Simultaneously, a spectrum of IT solutions played a pivotal role in the development of the Real-Time Sewer Monitoring System (RTSMS). The design of the WSD and DGS printed circuit boards (PCBs) in Gerber format was facilitated by the Eagle software [43] (56 USD per month). The PCBs were programmed using the Arduino IDE [44], an open-source cross-platform software. Data hailing from the DGS found its repository in the MariaDB [45] open-source relational database. The backend was supported by the Spring Boot [46] open-source framework, while the frontend interface of a Geographic Information System (GIS) was fostered through the amalgamation of React JS [47] and OpenLayers APIs [48].
PCB fabrication was executed at Astana IT University (Astana, Kazakhstan). The DGS PCB hosted the NodeMCU, underpinned by ESP8266MOD, in conjunction with the SX1278, SD card module, and DS3231 real-time clock (RTC) [49] (4 USD). Establishing the connection between the RS-15-5 and the DGS PCB involved copper wires, alongside an attachment of a line cable with Schuko plug 230V (2 USD) secured using the transformer's screws, thus all components found snug refuge within the bespoke DGS case.
Concurrently, the WSD PCB orchestrated the integration of ATmega328P, SX1278, and AA battery holder, alongside the necessary microcomponents, all securely housed within the confines of the RYD-F3-2 case. The sensors were intricately linked through copper wires, resulting in the realization of three distinct WSD iterations, differing exclusively in their sensor combinations for wastewater level and manhole cover monitoring: the first involving wastewater level measurement with Sharp GP2Y0A41SK0F and manhole cover detection via JSN-SR04T, the second incorporating TF-Luna Benewake for both wastewater level and manhole cover detection, and the third assigning TOF400 VL53L1X the task of simultaneous wastewater level measurement and manhole cover detection. Rigorous evaluation of each sensor's appropriateness took place within a purpose-built test setup, mirroring a horizontal sewage well configuration.
The Wireless Sensing Device (WSD) was tactfully positioned on the floor, partitioning it into distinct halves. A tableau of obstacles adorned the left and right segments, meticulously mimicking the behaviors of wastewater levels and the nether expanse of a manhole cover. The envisaged deployment scenario envisioned the WSD ensconced within the confines of a customary manhole, its depth not trespassing the 1-m threshold. To this end, a series of demarcated distances embellished the right expanse of the floor, spaced at 20-cm intervals up to the 1-m mark. Concomitantly, on the left territory, intervals spanning 1–5 m were etched onto the floor. With each designated juncture, every sensor, nestled on the right and left, embarked on a procession of 100 measurements, interspersed by 5-s intervals. This sequence unfolded repeatedly for every permutation of the WSD configuration. This developmental phase bore witness to the DGS prototype's direct liaison with a laptop through a USB link, orchestrating the acquisition of measurement data from the WSD via the LoRaWAN conduit. Subsequent visualization of the accrued data onto graphical charts ensued, culminating in the appraisal of sensor performance and a refined selection process. The meticulous assessment of sensor accuracy was punctuated by the computation of average deviations from the aspired distances, culminating in their vivid representation on graphical canvases. This data-driven evaluation profoundly informed the final sensor choice, entrusted with the dual responsibilities of manhole cover and wastewater level surveillance.
Earmarking the endeavor to monitor pipe blockages, the ensemble incorporated an infrared sentinel, the YL-63, artfully embedded as an externally amalgamated module within the WSD framework. This modular configuration manifested as two discernible segments, where the infrared emitter and the photo-receiver of the YL-63 sensor stood vis-à-vis. A characteristic transparency enveloped the casings of both module constituents, granting unimpeded passage to thermal radiance. Diverging from its sensor counterparts, the YL-63 forayed into the arena without the need for distance intel, honing its focus solely on the presence or absence of obstructions. The modus operandi of this exterior module was elegantly straightforward. Emanations reverberated from any impeding entity, be it wastewater or sediment, to rendezvous with the photo-receiver, subsequently catalyzing a signal relay to the LM393 comparator. The latter, calibrated to respond to specific photo-receptor illumination thresholds, materialized into a beacon of binary signals—high or low. The module's kernel pivoted on the discernment of photo-receptor luminosity. Nonetheless, the pursuit of accuracy remained nuanced as the sensor's interpretation hinged upon the reflected radiation, thus exposing the potential for measurement deviations owing to the material-dependent reflective properties of the obstructing surfaces. Ergo, the pipe blockage module orchestrated a calibration ritual, primed to recognize mediums like wastewater and sediment based on their distinctive reflective signatures.
4. Results
After considering various electronic components and software solutions, the most suitable IoT architecture for the RTSMS was formed and is presented in Fig. 1 below.
Fig. 1.

RTSMS system architecture.
Engraved within the intricate tapestry of the outlined system architecture, the Real-Time Sewer Monitoring System (RTSMS) unveils its intricate design. The crux of this system resides in the deployment of Wireless Sensing Devices (WSDs) snugly embedded within sewer wells, their orchestrated symphony relaying crucial measurement data via LoRaWAN to the proximate Data Gathering Station (DGS). The DGS, a sentinel of data, dutifully garners the transmitted insights, thereafter channeling them through the conduit of Wi-Fi and an Internet modem, until they are laid bare at the doorstep of the server-side realm. The server, the heart of this operation, takes form as a MariaDB open-source relational database, galvanized by the fortitude of a Spring Boot open-source framework that seamlessly envelops REST API business logic within its core. This digital nucleus currently finds solace within the confines of the Astana IT University, its custodial guardian. The user's interface is meticulously crafted, utilizing the intricate tapestry of React JS, OpenLayers APIs, HTML, JavaScript, and CSS, harmoniously orchestrating a symphony of user-friendly interactivity. This interface unfurls as a vibrant tapestry, adorning web browsers on the client side, where HTTP entreaties paint the canvas of interaction, summoning forth the collected data, neatly encapsulated in JSON format. The architecture, emblematic of a distributed framework akin to its predecessor [28], serenades the present, bearing no claim to 5G's prowess, a choice shaped by the modesty of the current data volume and the absence of video-laden traffic akin to Ref. [30]. However, this humble present bears testament to a scalable future, wherein the orchestration of a burgeoning data load and a constellation of connected sensors can seamlessly tap into the latent potential of 5G. The canvas of this system finds itself awash with the hues of Geographic Information System (GIS) layers, unfurling a spatial tapestry hitherto unattainable in the domain of [7,12,28,30]. A lustrous gem adorning this innovative vista emerges in the form of the system's robust backend, a creation set apart from Ref. [17], where the tether to laptops or smartphones is severed. This liberation imparts a fluidity to the system's evolution, rendering it amenable to future augmentation and scalability. The grand tableau culminates in Fig. 2, where a circuit diagram and a PCB design of the DGS unfurl, bestowing a visual testament to this intricate symphony of technological innovation.
Fig. 2.

Circuit diagram.
Navigating the intricate lanes of the depicted circuit diagram, the Data Gathering Station (DGS) comes to life, an embodiment of meticulous assembly. The orchestration of this entity transpired through the judicious intertwining of components: LoRa Ra-02, DS3231 RTC, and RobotDyn SD card modules. This symphony of connectivity found its expression within a bespoke PCB, a masterpiece conceived via the nurturing arms of Eagle and hewn into existence at Astana IT University's workshop. A meticulous ballet preceded the assembly, wherein the pins of each module were identified and their designated interfaces discerned. An intimate pas de deux unfolded, with 11 input-output pins of the NodeMCU pirouetting in harmony to forge links with the modules. Thus, a delicate choreography ensued: NodeMCU's D0, D3, D4, D5, D6, D7, 3V3, and GND entwined with the LoRa Ra-02's RESET, NSS, DIO0, SCK, MISO, MOSI, 3.3V, and GND pins, respectively. The embrace deepened as NodeMCU's D1, D2, 3V3, and GND waltzed with DS3231 RTC's SCL, SDA, VCC, and GND pins, while D5, D6, D7, D8, 3V3, and GND of NodeMCU pirouetted elegantly with RobotDyn SD card module's D5, D6, D7, D8, 3V3, and G pins. The canvas of the DGS's PCB bore resemblance to its predecessor [17], yet distinct, an echo of design principles echoing through its intricate pathways. In the absence of comprehensive resources delineating the implementation, the realm often remains a conceptual haven, lacking a tangible manifestation. Drawing from the wellspring of circuit design wisdom, the development of the DGS PCB was a testament to this artistry. Evidenced in Fig. 3, the circuit diagram and PCB design of the WSD await their curtain call, poised to breathe life into the symphony of innovation.
Fig. 3.

Circuit diagram.
The symphony of innovation unfolds through the circuit diagram illustrated in Fig. 4, illuminating the realm of WSD in its myriad combinations. In this spotlight, the inaugural performance features WSD Combination No. 1, a choreography starring the Sharp GP2Y0A41SK0F sensor measuring the wastewater level and the JSN-SR04T sensor performing a pas de deux to detect the presence of the manhole cover. A parallel ballet of electrical circuits echoes through the other combinations, each sensor in harmonious resonance. The canvas of the WSD was woven around the ATmega328P chip, its firmware akin to the conductor orchestrating the sensor data. In graceful communion, the 433 MHz LoRa Ra-02 communication module breathed life into the transmission of this data. The power wellspring emanated from the trinity of LS 14500 AA batteries. Pins D7, D9, D10, MISO, MOSI, and SCK, akin to dancers moving in elegant synchrony, united with the LoRa module. The stage unveiled three interfaces for sensor connection, a dynamic trio: two I2C interfaces, a tether to the realm of serial communication. The JSN-SR04T sensor, poised as the protagonist, engaged via the serial interface. The Sharp GP2Y0A41SK0F sensor danced through the analog sensor connection, finding resonance in pin A2. As the YL-63 sensor entered the limelight, it bonded with pin D3. The ensemble came alive with the power switch, a masterstroke heralding their grand entrance.
Fig. 4.
WSD installment schema.
Behold the masterpiece unfurled in Fig. 5, where the WSD cosmos takes shape within the sanctum of the RYD-F3-2 case. The symphony of inner electronic components harmoniously finds their abode, a testament to engineering artistry. The walls of this case, marked with the imprints of innovation, reveal tailored openings aligned with the specific sensor's choreography. The YL-63 module, a virtuoso in external assembly, emerges as a duet of transparent plastic capsules, joined in a ballet of metal, with one encapsulating the YL-63 LM393 comparator and photoreceiver, and the other embracing the emitter. These capsules, akin to enchanted vessels, are sealed with a promise of hermetic guardianship, their contents kept in intimate proximity. Bound together, they exhibit a mere 3–5 mm of separation, an orchestration of precision. As dictated by the scripted schema, the WSD takes its rightful place within the sewage well, embracing a recommended depth, a subterranean spectacle under 1 m. The YL-63 module, an eager observer, extends its gaze to the discharge pipe's realm, poised midway to capture the silt's performance. Uniting through sealed wires, it pledges allegiance to the WSD, a sentinel against blockage. Unlike its predecessors, this ingenious contrivance graces the well with unbroken vigilance, an ever-present sentinel akin to Ref. [28]. As the virtuoso of continuous monitoring, it redefines the rhythm of data acquisition, orchestrating a real-time symphony, in stark contrast to the episodic cadence proposed in Refs. [7,12,30]. With Fig. 5 as its muse, it showcases the results of sensor tests, painting a panorama of distance measurement to the manhole cover, the range extending from 0.2 to 1.0 m.
Fig. 5.

Testing of sensors at distances from 0.2 to 1.0 m.
The tapestry woven above, adorned with graphs, unveils a dance of sensors in their pursuit of precision. The luminary of this spectacle is the TOF400 VL53L1X laser sensor, a virtuoso rendering measurements that embrace the intended distances (0.2–1.0 m) with grace. Its artistry is unveiled with a modest standard deviation, a duet within the range of 0.13–0.24. However, within this gallery of revelations, a nuanced narrative emerges. In the realm of short distances, a scene embellished by TF-Luna Benewake LiDAR's presence, stability reigns supreme, an anchor amidst oscillations. Yet, amidst these stars, the Sharp GP2Y0A41SK0F infrared sensor, cloaked in disappointment, offers the weakest tale. Its measurements, confined to the 0.4–1.0 m realm, whisper a range of 0.13–0.23 m, a clarion call that proclaims its inadequacy in the realm of manhole cover monitoring. The symphony crescendos with Fig. 6, a canvas that unveils the sensor tests' results. Here, the simulation of wastewater level measurement unfolds, an odyssey spanning 1.0–5.0 m, immortalized in this gallery of insights.
Fig. 6.

Testing of sensors at distances from 1.0 to 5.0 m.
The above analysis provides a comprehensive overview of sensor performance, highlighting the various strengths and weaknesses of different sensors. Among them, the TF-Luna Benewake LiDAR sensor emerges as the standout performer, garnering recognition for its exceptional accuracy within the 1.0–5.0 m range (Fig. 7 (a) and (b)). The sensor's consistency is exemplified by its standard deviation, which ranges from 0.44 to 1.15, further solidifying its reputation. In contrast, the TOF400 VL53L1X laser sensor weaves a different story (Fig. 7 (e) and (f)). While it possesses some notable attributes, its standard deviation fluctuates significantly, even reaching as high as 104. Consequently, as the distance increases, so does its margin of error and oscillation, introducing a crescendo of uncertainty. Amidst this constellation of sensors, the JSN-SR04T ultrasonic sensor (Fig. 7 (c) and (d)), initially promising, reveals its limitations within this specific distance range. Its readings remain confined within a narrow corridor of 0.22–0.23 m, rendering it unsuitable for the complexities associated with sewer well measurement. As such, it is advisable to exclude this sensor from consideration, as its application is better suited for disparate realms such as car parking sensors, which demand different levels of precision. LiDAR, a technology rooted in the same fundamental principle as ultrasonic sensors, showcases its prowess by enabling contactless measurement.
Fig. 7.

Deviation analysis (a) maximum fluctuation for TF-Luna Benewake (b) average deviation for TF-Luna Benewake (c) maximum fluctuation for sharp GP2Y0A41SK0F & JSN-SR04T (d) average deviation sharp GP2Y0A41SK0F & JSN-SR04T (e) maximum fluctuation for TOF400 VL53L1X (f) average deviation for TOF400 VL53L1X.
The intricate labyrinth of Fig. 7's deviations analysis unraveled a discernible pattern (Fig. 8 (a), (b), (c) and (d)): with the expansion of distance, both sensors saw their accuracy wane. The tapestry of precision, once tightly woven, loosened its threads. At distances up to 2.0 m, their accuracies waltzed to a harmonious ±5 cm, a synchronized descent. Yet, with the horizon lengthening, a stark contrast unfolded. The TOF400 VL53L1X laser sensor stumbled into a chasm of accuracy degradation, while the TF-Luna Benewake LiDAR sensor maintained its poise, holding its accuracy within a steadfast ±8 cm even up to 5.0 m. Thus, the saga of suitability unfolded: TOF400 VL53L1X claimed its role as the sentinel of manhole covers, while TF-Luna Benewake emerged as the harbinger of wastewater level insights. For TF-Luna Benewake, a logarithmic function took the reins, its reliability nearing ≈84.5%, while TOF400 VL53L1X embraced an exponential equation, boasting reliability approximating ≈89.6%. With this compass in hand, for distances of 8–10 m, TF-Luna Benewake's accuracy treaded within the bounds of ±10 cm, a testament to its mettle. In the wake of these revelations, the cast of sensors underwent metamorphosis in the initial WSD compositions: TF-Luna Benewake, the envoy of wastewater levels, and TOF400 VL53L1X, the guardian of manhole cover presence. As highlighted earlier, LiDAR unravels distances via the time-of-flight principle, an alchemy of speed of light (c), modulation frequency (f), and Δφ, the ballet of phase shift (Equation (1)) [50].
| (1) |
Fig. 8.

Sewage monitoring algorithms integrated to GIS (a) sewer chamber section (b)wastewater overflow algorithm (c) manhole cover presence algorithm (d) pipe blocakage algorithm.
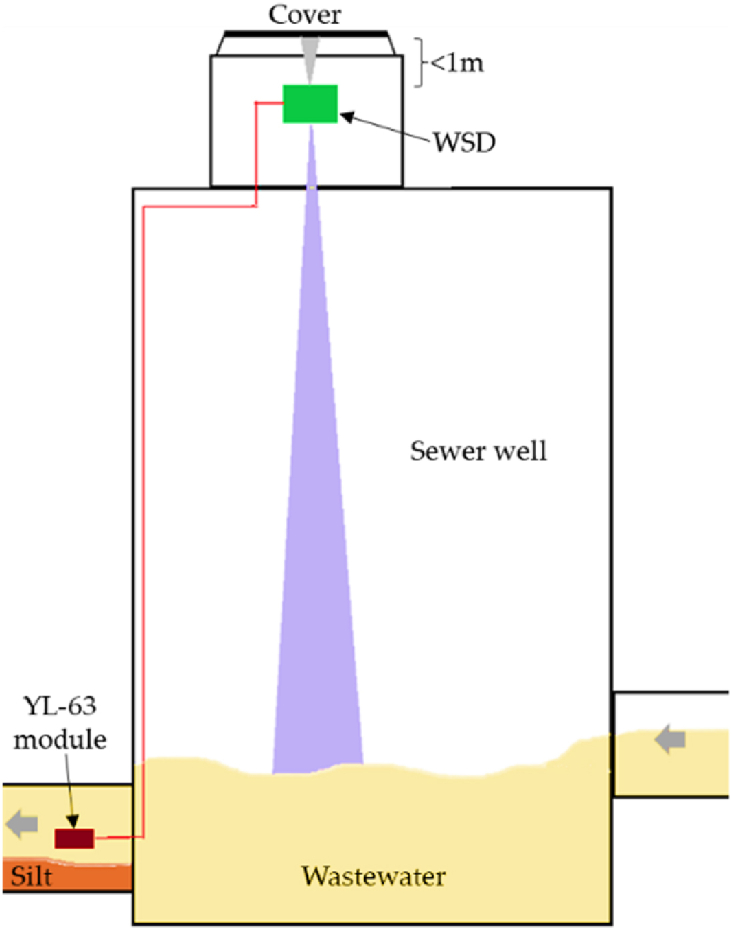
Beyond their prowess in water quality vigilance, the adoption of laser sensors in sewage domain for water level detection remains a frontier yet to be fully traversed. The dominion of these sensors has been steadfastly aligned with water quality monitoring, their eminence undisputed. An exposition by Post et al. [51] stands testament to this, a narrative that unfolds the harmonious marriage of Laser-Induced Raman and Fluorescence Spectroscopy (LIRFS) with the finesse of Artificial Intelligence (AI). The realms of micropollutant surveillance in wastewater unveil their potential. An orchestra composed of Raman measurements and AI symphonies witnessed the rise of nitrate level monitoring after biological treatment, yielding an assignment rate of 95% and above. In the realm of this discourse, the spotlight falls upon TOF400 laser sensors, their essence scrutinized for the realm of sewage chamber water level monitoring. Their precision prowess extends across diverse terrain, embracing the levels of liquids like water and oil, and transcending to bulk solids and powders. The tableau of Fig. 8 unfurls the masterstroke of WSD installation, an intricately woven tapestry interlaced with algorithms seamlessly embraced by the GIS domain.
The sequence described above showcases the integration of the Wastewater Surveillance Device (WSD) within the sewage well environment. The WSD is securely anchored to the shaft section, with one sensor directed towards the base of the manhole cover while another sensor is positioned inside the outlet pipe's inner wall. This coordinated arrangement is illustrated in Fig. 9. At the core of the WSD lies the ATmega328P microcontroller, which facilitates sensor synergy and allows for the incorporation of additional sensors. In cases where multiple outlet pipes converge within the well, multiple external units collaborate to provide comprehensive monitoring. This scenario also involves key parameters, such as A, a, B, b, d, and e, which represent dimensions and distances. These parameters play a significant role in interpreting the data captured by the sensors. The depicted scenario involves the upward-facing sensor (TOF400 VL53L1X) measuring the distance to the manhole cover's underside, providing crucial information about any barriers present. Simultaneously, the downward-facing sensor (TF-Luna Benewake) continuously monitors the wastewater level by measuring the distance to the well's bottom. The diameter of the outlet pipe adds further context to the data, while the user's error tolerance influences the system's operation. These parameters are integral to the system's functioning, particularly in the detection of overflow events, as shown in Fig. 9. Algorithms utilize parameters B and b to generate alerts indicating different wastewater levels, represented by "Red," "Yellow," and "Green." When the data indicates "Null," it means there is no signal available. In cases where data is unavailable, a "No signal" message is displayed. The final act, as depicted in Fig. 9, focuses on the presence of barriers, such as silt or sludge, within the outlet pipe. The system differentiates between "Blockage" and "No blockage," and in cases where data is absent, it indicates a "No signal" situation. This ensemble of components culminates in a comprehensive portrayal of the sewage well's environment. It demonstrates the transformation of algorithms into monitoring tools, while Geographic Information Systems (GIS) orchestrate the management of wastewater effectively.
Fig. 9.

Interface of RTSMS GIS.
The image displayed above introduces us to a real-time view of information – the GIS interface – which acts as a window into the ever-changing world of sewer manholes and pipelines, all depicted on an interactive map. The canvas is brought to life by the OpenLayers library, painting it with three distinct colors: Open Street Map (OSM), the far-reaching sight of satellites, and a combination of both. The data orchestrates like a symphony as algorithms come to life, a dance choreographed by unseen forces. Manholes take center stage, each symbol representing a musical note, telling a unique story presented in six different variations. The circle carries a cross, an invitation; a checkmark indicates a sealed connection. Colors burst forth like petals – red, yellow, green – a colorful performance that communicates levels of wastewater. The pipes that weave through the ground mirror this dance, a performance of their own, with their color reflecting the flow's path, whether it's a healthy flow or a blocked red obstruction. A gentle touch on a manhole or pipe brings forth whispers of their condition, a message that seems to arrive on the wind.
However, like any evolving masterpiece, there are missing parts in the current melody. The tools required to illustrate the dance of manholes and pipes are absent, a feature that the future promises to reveal, like a painter's brush poised to create a blueprint on a digital canvas. The data about location and the constants that hold the dance together are established through manual connections on the server side, where each link weaves the fabric of understanding. But the future resonates with dreams – a tool that infuses life into external files, in the form of GeoJson and Shape-file formats, imparting spatial details of manholes and pipes a chance to be woven into this digital narrative.
As the symphony of insights reaches its peak, the curtains descend, and the tableau transforms, unveiling Table 6, a ledger of expenses. The cost of a symphony, one should remember, extends beyond just monetary value. It encompasses the effort, the hard work, the labor – the hidden notes that bring about harmony. Yet here, the financial prelude stands, a numeric representation of the finalized RTSMS prototype. The price of each unit is inscribed, excluding the concealed effort, serving as a testament to the journey undertaken to transform innovation into reality.
Table 6.
Material cost estimation.
| Units | Components | Pricea, USD | Unit cost, USD |
|---|---|---|---|
| WSD | ATmega328P microcontroller | 6.2 | 78.88 |
| Lora Ra-02 on the SX1278 chip | 7.63 | ||
| RYD-F3-2 case | 10 | ||
| Two LS 14500 batteries | 12 | ||
| TOF400 VL53L1X sensor | 18.15 | ||
| TF-Luna Benewake sensor | 24.9 | ||
| DGS | NodeMCU firmware (ESP8266MOD and Wi-Fi) | 6.74 | 90.54 |
| Lora Ra-02 on the SX1278 chip | 7.63 | ||
| RS-15-5 power supply | 9.67 | ||
| DS3231 RTC module | 4 | ||
| Schuko plug 230V | 2 | ||
| RobotDyn SD card module with microSD | 4.5 | ||
| Eagle software (monthly payment) | 56 | ||
| GIS | Arduino IDE software | Free | 0 |
| MariaDB relational database | Free | ||
| Spring Boot framework | Free | ||
| React JS | Free | ||
| OpenLayers | Free |
| Overall cost, USD: | 169.42 |
Since the components were purchased locally, the prices were converted according to the exchange rate for the date March 31, 2023 [32], which was 448.05 KZT for 1 USD.
Behold Table 6, a parchment inscribed with the financial architecture of one RTSMS, a symphony of digits dancing in harmonious formation. The ledger unveils that the ensemble's material expenditure, a melody of dollars, stands at around 170 USD for each composition. Within this ensemble, the WSD, the virtuoso of the piece, claims a share of 79 USD, while the DGS, the quiet conductor, whispers for 35 USD. The GIS, the grand stage, demands 56 USD to unfurl its canvas. An interesting note resounds - had we danced with free software for PCB design, Eagle's withdrawal would have gifted us 56 USD, a cost-saving cadence that would paint the composition even more economically. The crescendo of thrift swells as mass production takes its bow, turning the composition into an orchestra of savings.
5. Discussion
In the initial demonstration, the study highlighted the significance of WSD Combination No. 1, where the Sharp GP2Y0A41SK0F sensor played a crucial role in accurately measuring wastewater levels. Simultaneously, the JSN-SR04T sensor collaborated in a synchronized manner to detect the presence of the manhole cover. This collaboration of sensors created a harmonious connection, with each sensor contributing seamlessly to the overall system. The design of the WSD is intricately centered around the ATmega328P micro-controller, functioning as a conductor orchestrating the coordination of sensor data. The 433 MHz LoRa Ra-02 communication module added vitality to the data transmission process. The energy required for the system was provided by the LS 14500 AA batteries. The coordination between pins D7, D9, D10, MISO, MOSI, and SCK elegantly connected with the LoRa module, forming a seamless integration. The setup included three sensor interfaces, forming a dynamic trio in the overall system. Two I2C interfaces bridged the gap to serial communication, while the JSN-SR04T sensor took the lead through the serial interface. The Sharp GP2Y0A41SK0F sensor, a key component, was integrated through the analog sensor connection on pin A2. The YL-63 sensor, with its impact, had a smooth integration with pin D3. The activation of the power switch marked the ensemble's entry into action, signifying the beginning of their coordinated performance. Unlike existing solutions [[42], [52], [53], [54], [55]], our approach consciously moves away from the use of video streams and cameras, allowing these elements to recede into the background. Instead, the study focus on spotlighting the meticulous mapping journey of the sensors, emphasizing their crucial role in the system's functioning. The prototype comes together like a symphony of sensors, each finely tuned for various tasks that involve overseeing overflow situations, skillfully detecting manhole covers, and maintaining a vigilant watch against pipe blockages. The scene is enhanced by a familiar arrangement, displaying their installation with the precision of a meticulously rehearsed performance.
Within this arrangement, a symphony of internal electronic components finds their harmonious home, a testament to the skillful engineering at play. The case's structure bears the marks of innovation, featuring custom openings that are meticulously aligned with the precise arrangement of specific sensors. Among these, the YL-63 module stands out, showcased as a captivating duo of transparent plastic capsules. These capsules engage in a graceful dance of metal – one housing the YL-63 LM393 comparator and photoreceiver, and the other embracing the emitter. These capsules, reminiscent of magical vessels, are sealed securely, preserving their contents with care. Bound together, their separation is meticulously crafted to be just 3–5 mm, showcasing a high level of precision. Following the intended design, the WSD takes its place within the sewage well, adhering to the recommended depth, creating a subterranean spectacle below the 1 m mark. The watchful YL-63 module extends its attention to the discharge pipe area, strategically positioned to capture sediment-related activities. Sealed wires further solidify its commitment to the WSD, acting as a steadfast guardian against potential blockages. Setting itself apart from its predecessors, this innovative creation instills the well with continuous vigilance, resembling an unwavering sentinel. Operating as a masterful conductor of perpetual monitoring, it transforms the rhythm of data collection, orchestrating a real-time symphony of information that stands in stark contrast to the intermittent pattern.Drawing inspiration from the results, this system reveals the outcomes of sensor tests, painting a comprehensive picture of distance measurements toward the manhole cover. The measurements span a range from 0.2 to 1.0 m, providing a detailed look at the performance intricacies. The panorama of insights presented earlier reveals a diverse collection of sensor performances, each playing a crucial role in this symphonic pursuit of accuracy. Amidst this expansive display, the TF-Luna Benewake LiDAR sensor takes the spotlight, earning praise for its outstanding achievements over distances from 1.0 to 5.0 m. Its standard deviation, indicative of consistent accuracy, falls within the range of 0.44–1.15, showcasing its impressive precision. Sharing the stage is the TOF400 VL53L1X laser sensor, whose standard deviation gracefully dances with variability, reaching up to 104. However, with increasing distance, its inaccuracies and fluctuations also escalate, leading to heightened uncertainty. In this constellation of sensor performances, the JSN-SR04T ultrasonic sensor, once full of promise, reveals limitations within this specific distance range. Its readings remain confined, oscillating within a narrow range of 0.22–0.23 m. Unfortunately, this limited range renders it unsuitable for the intricate demands of sewer well measurements. Consequently, it's advisable to exclude this sensor from consideration in this context, reserving its applications for distant settings such as car parking sensors, where precision requirements differ significantly. LiDAR, a technology grounded in the same foundational principle as ultrasonic sensors, emerges as a standout for its contactless measurement capabilities. This approach finds endorsement from Jannata et al. [56], who affirm LiDAR's adeptness in water level measurement, showcasing error rates of 9.8% at 200 cm and 4.3% at 150 cm, even amidst dynamic aquatic environments. While ultrasonic sensors traverse the domain of sound, lasers harness the speed of light. A laser pulse ventures out to meet the liquid's surface, its return to the detector choreographed by the Time-Of-Flight principle, deciphering distances with unparalleled accuracy.
In this cosmic dance, the JSN-SR04T sensor, contending with obstacles, shares a tale of its challenges. Acoustic barriers introduce dissonance, distorting sound propagation and affecting precision. Ultrasonic waves emitted transform into echoes, crafting visual representations of liquid levels in containers. However, substances with absorption tendencies add complexity to this melodious arrangement. Here, the TF-Luna Benewake LiDAR sensor and the TOF400 VL53L1X laser sensor resurface, their narratives interwoven in the analytical backdrop. The focus now pivots to the pivotal role of online monitoring, a cornerstone in understanding sewer overflows [57]. This narrative not only empowers operational efforts like fine-tuning functions, quality assessment, maintenance scheduling, and hydraulic urban drainage system refinement [43,44], but also forms the foundation of a resilient system, guiding sewer networks toward harmonious coexistence. In the realm of wastewater management, the symphony of flow and water level sensors takes center stage, narrating the tale of sewer overflows by tracing events' rhythm – their occurrences, durations, volumes, and complexities. Yet, introducing these sensor virtuosos onto the stage often comes with a financial crescendo. While their enchanting melody captivates, it's accompanied by significant expenses for procurement, installation, and maintenance, particularly within urban drainage systems [[45], [46], [47], [48]]. As the narrative unfolds, Edmondson et al. [49] shed light on the intricate choreography executed by sensors responsible for measuring water levels and velocities. Within the confines of the manhole chamber, these sensors, much like seasoned performers, maintain a poised stance, capturing data through diverse techniques such as ultrasonic emissions, pressure transducers, radar, and laser technologies. The venerable pressure transducer takes center stage, a familiar presence in water level sensor assemblies owing to its widespread use. Attention then shifts to ultrasonic level sensors, a more selective presence strategically positioned within the sewerage network. These strategic nodes, akin to pivotal moments in a musical composition, emerge in flood-prone areas, stations flanking storm overflows, or significant intersections along the primary sewer, where the intricate dance of sub-catchment currents weaves an engaging tale. The symphony of technology conducts a multifaceted performance, with each instrument playing a distinct role in achieving a harmonious equilibrium between cost-effectiveness and robust monitoring. This symphony reverberates through the intricacies of wastewater management's grand performance. The intricate network of manholes seamlessly intertwines within the framework of the sewer system, serving as access points that not only facilitate maintenance but also hold a crucial role in averting potential crises. These subterranean sentinels stand as steadfast guards against the threat of blockages that, if neglected, could lead to sewage overflow onto streets, inconveniencing pedestrians and motorists alike. Even the angle of manhole covers contributes to this urban ballet, presenting hazards for those traversing above. This challenging scenario extends further below the surface, where courageous individuals navigate hazardous torrents in their quest for solutions. In the midst of these trials, innovation takes its stance, and addressing these challenges necessitates not only vigilance but also informed decision-making. Hence emerges the proposed system, a fusion of sensors and vigilance that orchestrates a harmonious symphony of proactive measures. At the core of this system lies the intricate arrangement of sensors, woven together to oversee the dynamics beneath the surface of the manhole cover. A watchful gaze is directed towards the water level, poised to issue an alert when it surpasses a critical threshold, a call to action that echoes through the channels of relevant authorities. However, this tune is not the sole melody; an ongoing symphony resounds, monitoring the position of the manhole cover and scrutinizing the quality of the drainage water's toxicity. With each note sounded, it recounts a tale of proactive prevention, a narrative of challenges averted and crises mitigated [58].
As the story unfolds, the study pays tribute to the pioneers who laid the groundwork for automated wastewater management. Z. Mohd Hussin et al. [50] embarked on this journey, amalgamating gas sensors, ultrasonic sensors, and an Arduino microcontroller to decipher the signals of the underground realm. Focused on real-time drainage system monitoring through the lens of IoT applications, this undertaking harmonized with the resonant voice of the Global System for Mobile Communication (GSM), relaying alerts to pertinent authorities. Their composition culminated in data visualization, with graphs coming alive on ThingSpeak, while the echoes of data resonated to web servers and clouds through the use of ESP 8266. The narrative continues to evolve with the contribution of Nataraja et al. [59], who have crafted a secure manhole tracking system by combining sensors and GSM technology to form a vigilant ensemble. The collaboration of Arduino Uno, BMP 280, Ultrasonic Sensor, SW-420 Vibration Sensor, HC-SR04 Ultrasonic Sensor, and GSM SIM 300 orchestrates a symphony of environmental surveillance. Their magnum opus casts its gaze upon the surroundings, calculating outcomes and eliciting protocol-driven actions. The focus shifts to tilted lids and their inherent risks, as sensors vocalize their findings. A crescendo of alerts reaches pertinent personnel, a rhythmic dance that shields lives from lurking dangers, while the harmonies of human safety resound through SMS notifications and registered alerts.
Tasin et al. [60] then make their entrance, crafting a melody that reverberates through waterlogged streets. They detect uncapped manholes through LED displays and alert local authorities. A vigilant system comprised of an LED display and a buzzer forms a symphony that harmonizes safety, notifying users of potential hazards. This symphony of safeguarding unfolds, economical and user-friendly, weaving safety into the very fabric of urban existence. The crescendo of innovation continues to swell, exemplified by the work of Ramadhin et al. [51], who are the creators of a sophisticated drainage and health monitoring system. A symphony of sensors – ultrasonic sensors, gas sensors, pulse sensors, heartbeat sensors – harmoniously converges with buzzers, fans, and an Arduino. When a predetermined threshold is breached, a crescendo of alerts ensues – buzzers resonate, and IoT webpages illuminate. Their creation, a masterpiece of the Internet of Things (IoT), shines a light on overflow issues, extending assistance to both workers and residents. Within its symphonic arrangement lies a narrative of proactive intervention, showcasing the power of technology to pre-emptively address challenges. In the grand finale, This user interface acts as a mosaic of control and insight, where data takes tangible form, and insights converge into actionable measures. It forms a tapestry woven from the threads of innovation and vigilance, encapsulating the essence of a system that safeguards, informs, and harmonizes the coexistence of humans and urban drainage. Furthermore, the study encounters a document marked with the financial structure of a single Real-Time Sewer Monitoring System (RTSMS), a harmonious arrangement of numbers. The ledger reveals that the material cost for each RTSMS is approximately 170 USD. Within this ensemble, the Water Level Sensor Device (WSD), taking a central role, accounts for 79 USD, while the Data Gathering System (DGS), assuming a more subdued role, commands 35 USD. The Geographic Information System (GIS), the grand platform for this performance, requires an investment of 56 USD to present its visual representation. A notable insight emerges – had the study opted for free PCB design software, as suggested by the departure from Eagle software, they could have saved 56 USD, a thrifty melody that would make the composition even more cost-effective. This crescendo of cost-consciousness gains momentum as mass production enters the scene, transforming the composition into a symphony of cost savings. However, this is just the prelude to the final appreciation. The ultimate value lies not solely in the investment but in the utility, the enduring impact of the composition. A new business model emerges, resembling an encore in philosophy – a monthly rental symphony. In this scenario, the ensemble arrives at your doorstep without the burden of an initial capital investment. This innovative approach in business philosophy resonates with the concept of broadening access to innovation. As we delve into the content of this page, it becomes valuable to align our understanding with the wider landscape of costs. A comparison with the financial experiences of predecessors reveals a spectrum of financial compositions. Gruber et al. [61] orchestrated their work with water quality sensors, a composition that resonated with a starting cost of 15,000 €, an expensive arrangement. Siemers et al. [62] composed their work with motion sensors at a more modest cost of 200 €, a composition sensitive to external factors. Wani et al. [63] played their part with moisture sensors ranging from 100 to 300 €, a composition that harmonized with the variability of humidity. Rasmussen et al. [64], incorporating electrical contacts and switches, struck a note at 200 €, yet the potential for blockages cast a shadow. Jeanbourquin et al. [65] and Lo et al. [66] orchestrated their work using video image analysis, incurring a cost of 1000 €, a composition that required a collective effort of data. Amidst this array of costs, our Real-Time Sewer Monitoring System (RTSMS) emerges as a distinct movement, its melody resonating with affordable innovation, echoing a sense of economy without compromising the depth of its insights.
While previous literature acknowledges the significance of sewage monitoring, this study takes a significant stride ahead by not only recognizing the multifaceted challenges posed by inadequate monitoring infrastructure, but also by presenting a comprehensive solution through the Live-Feed Sewer Monitoring Framework (LSMF). It is pertinent to acknowledge that this study introduces a range of novel contributions. Firstly, it accentuates the comprehensive nature of sewage surveillance challenges. It not only focuses on the evident risks of flooding and contamination due to unimpeded flow within conduits but also sheds light on the often underestimated dangers linked to harmful gases, tampering with manhole lids, structural deterioration, and safety hazards. This expansive viewpoint lays the groundwork for a more all-encompassing solution. Secondly, the proposed Live-Feed Sewer Monitoring Framework (LSMF) emerges as an innovative and integrated blueprint for effective sewer surveillance. By introducing the concept of a Data Gathering Nexus (DGN), it presents a unique mechanism for the collection and aggregation of real-time data from diverse sensors. Furthermore, the empirical assessment of various Wireless Sensing Implements (WSI) for precise data collection introduces a pragmatic and evidence-driven approach to sensor selection, ensuring accuracy and efficacy in monitoring activities. The concurrent development of a Geographic Information Matrix (GIM) equipped with algorithms tailored for detecting sewer surges, blockages, and missing manhole covers further elevates the novelty of this research. Integrating Geographic Information System (GIS) technology into the monitoring framework adds a dynamic and location-based dimension to the surveillance system, bolstering its ability to respond to changing circumstances. Additionally, the evaluation of three specific sensors—namely, LiDAR TF-Luna, laser TOF400 VL53L1X, and ultrasonic JSN-SR04T—for water level measurement in sewer vaults represents a noteworthy contribution. The comparative analysis of these sensors under varying conditions offers insights into their strengths and limitations, guiding the process of selecting the most suitable sensors for optimal deployment. In summation, the uniqueness of this research lies in its holistic perspective, the development of the LSMF featuring the DGN and WSI components, the integration of GIS technology with algorithmic detection capabilities, and the empirical assessment of sensors. These collective contributions deepen the comprehension of effective sewer surveillance and provide a comprehensive blueprint for sustainable solutions, thereby propelling the field beyond the scope of existing literature.
6. Conclusions
The investigation delved into the realm of crafting a prototype architecture for an innovative real-time sewer monitoring system, probing its feasibility and practicality. This endeavor extended to conceptualizing and assembling a data collection station, housing an array of wireless sensing devices to meticulously scrutinize sensor accuracy. Moreover, the endeavor encompassed the development of a sophisticated geographic information system (GIS), enriched with algorithms adept at identifying complex concerns, including sewer overflow, pipe blockages, and the presence of manhole covers. In the implementation phase, the Wireless Sensing Device (WSD) was strategically positioned on the shaft section of the sewage well, at a designated distance from the manhole cover's base, while the external unit was securely affixed to the inner wall of the outlet pipe at its midpoint diameter. The ATmega328P microcontroller fueled the capabilities of the WSD, enabling seamless integration with a plethora of additional sensors. The GIS interface bestowed the virtue of real-time vigilance over sewer conditions, transposing them onto an interactive map graced by a triad of map types: Open Street Map (OSM), satellite, and hybrid, facilitated through the OpenLayers library. The software orchestrated the visualization of wastewater flow dynamics within the manholes through pipes, with each click on a manhole or pipe offering informative insights into their prevailing status. However, the interface's present version lacks the ability to sketch the intricate network of manholes and pipes, a facet slated for future enhancements, alongside the inclusion of mechanisms for uploading external files in GeoJson and Shapefile formats, encapsulating spatial information about the manifold network. Notably, the performance evaluations showcased the ascendancy of the TF-Luna Benewake LiDar sensor in the 1.0–5.0 m span, exhibiting a commendable standard deviation ranging between 0.44 and 1.15. Following suit, the TOF400 VL53L1X laser sensor emerged as the runner-up, although it exhibited conspicuous standard deviation fluctuations, peaking at 104. However, its precision and oscillatory tendencies waned with increasing obstacle distances. Contrarily, the JSN-SR04T ultrasonic sensor faltered within this range, displaying modest standard deviations (ranging from 0.0 to 26.05), yet persistently registering readings at 0.22–0.23 m within the 2.0–5.0 m scope. This exploration's key takeaway resonated around the criticality of weaving diverse components into a cohesive fabric for unerring real-time sewer surveillance, empowering prompt interventions in response to evolving sewer-related challenges. These insights, resonating with sustainable solutions, hold the potential to navigate the complex waters of sewer monitoring predicaments.
Data availability statement
The data that support the findings of this study are available from the corresponding author, upon reasonable request.
Additional information
No additional information is available for this paper.
CRediT authorship contribution statement
Yelbek Utepov: Writing – original draft, Methodology, Investigation, Conceptualization. Alexandr Neftissov: Methodology, Investigation. Timoth Mkilima: Writing – original draft, Methodology, Investigation. Zhanbolat Shakhmov: Resources, Investigation. Sungat Akhazhanov: Resources, Investigation. Alizhan Kazkeyev: Resources, Investigation. Assel Toleubekovna Mukhamejanova: Resources, Investigation, Data curation. Aigul Kenzhebekkyzy Kozhas: Resources, Investigation.
Declaration of competing interest
The authors declare that they have no known competing financial interests or personal relationships that could have appeared to influence the work reported in this paper.
Contributor Information
Timoth Mkilima, Email: tmkilima@gmail.com.
Zhanbolat Shakhmov, Email: shakhmov_zha@enu.kz.
References
- 1.Duque N., Bach P.M., Scholten L., Fappiano F., Maurer M. A simplified sanitary sewer system generator for exploratory modelling at city-scale. Water Res. 2022;209 doi: 10.1016/j.watres.2021.117903. [DOI] [PubMed] [Google Scholar]
- 2.Sood B., Lokhande S., Krishnankutty M., Kalbar P.P. Economic assessment of centralized and decentralized sewerage network systems: a case study of Ludhiana, India. J. Urban Plann. Dev. 2023;149 doi: 10.1061/JUPDDM.UPENG-4095. [DOI] [Google Scholar]
- 3.Ouattara Z.A., Kabo-Bah A.T., Dongo K., Akpoti K. A Review of sewerage and drainage systems typologies with case study in Abidjan, Côte d'Ivoire: failures, policy and management techniques perspectives. Cogent Eng. 2023;10 doi: 10.1080/23311916.2023.2178125. [DOI] [Google Scholar]
- 4.Mazunga F., Romosi T., Guvhu R. Manhole intrusion detection system with notification stages. Sci. African. 2021;12 doi: 10.1016/j.sciaf.2021.e00819. [DOI] [Google Scholar]
- 5.Anbari M.J., Tabesh M., Roozbahani A. Risk assessment model to prioritize sewer pipes inspection in wastewater collection networks. J. Environ. Manag. 2017;190:91–101. doi: 10.1016/j.jenvman.2016.12.052. [DOI] [PubMed] [Google Scholar]
- 6.Alejo D., Caballero F., Merino L. A robust localization system for inspection Robots in sewer networks. Sensors. 2019;19:4946. doi: 10.3390/s19224946. [DOI] [PMC free article] [PubMed] [Google Scholar]
- 7.Malek Mohammadi Najafi, Kaushal Serajiantehrani, Salehabadi, Ashoori Sewer pipes condition prediction models: a state-of-the-art review. Infrastructure. 2019;4:64. doi: 10.3390/infrastructures4040064. [DOI] [Google Scholar]
- 8.Klusek M., Szydlo T. Lect. Notes Comput. Sci. (Including Subser. Lect. Notes Artif. Intell. Lect. Notes Bioinformatics); 2021. Supporting the process of sewer pipes inspection using machine learning on embedded devices. [DOI] [Google Scholar]
- 9.Nourinejad M., Berman O., Larson R.C. Placing sensors in sewer networks: a system to pinpoint new cases of coronavirus. PLoS One. 2021 doi: 10.1371/journal.pone.0248893. [DOI] [PMC free article] [PubMed] [Google Scholar]
- 10.Bahnsen C.H., Johansen A.S., Philipsen M.P., Henriksen J.W., Nasrollahi K., Moeslund T.B. 3D sensors for sewer inspection: a quantitative review and analysis. Sensors. 2021;21:2553. doi: 10.3390/s21072553. [DOI] [PMC free article] [PubMed] [Google Scholar]
- 11.Pacheco Fernández M., Despot D., Barjenbruch M. Comparison of H2S gas sensors: a sensor management procedure for sewer monitoring. Sustainability. 2021;13 doi: 10.3390/su131910779. [DOI] [Google Scholar]
- 12.See C.H., Horoshenkov K.V., Tareq Bin Ali M., Tait S.J. 2021. An Acoustic Sensor for Combined Sewer Overflow (CSO) Screen Condition Monitoring in a Drainage Infrastructure, Sensors (Switzerland) [DOI] [PMC free article] [PubMed] [Google Scholar]
- 13.Thiyagarajan K., Kodagoda S., Ranasinghe R., Vitanage D., Iori G. Robust sensor suite combined with predictive analytics enabled anomaly detection model for smart monitoring of concrete sewer pipe surface moisture conditions. IEEE Sensor. J. 2020;20:8232–8243. doi: 10.1109/JSEN.2020.2982173. [DOI] [Google Scholar]
- 14.Sambito M., Freni G. AIP Conf. Proc.; 2021. Optimal Positioning of Water Quality Sensors in Sewer during Dry and Wet Weather. [DOI] [Google Scholar]
- 15.Tomperi J., Rossi P.M., Ruusunen M. Estimation of wastewater flowrate in a gravitational sewer line based on a low-cost distance sensor. Water Pract. Technol. 2023;18:40–52. doi: 10.2166/wpt.2022.171. [DOI] [Google Scholar]
- 16.Salem A.K., Abokifa A.A. World Environ. Water Resour. Congr. 2023. American Society of Civil Engineers; Reston, VA: 2023. Optimization of water quality sensor placement in sewer networks; pp. 1119–1126. [DOI] [Google Scholar]
- 17.Sambito M., Di Cristo C., Freni G., Leopardi A. Optimal water quality sensor positioning in urban drainage systems for illicit intrusion identification. J. Hydroinf. 2020;22:46–60. doi: 10.2166/hydro.2019.036. [DOI] [Google Scholar]
- 18.Ghavami S.M., Borzooei Z., Maleki J. An effective approach for assessing risk of failure in urban sewer pipelines using a combination of GIS and AHP-DEA. Process Saf. Environ. Protect. 2020;133:275–285. doi: 10.1016/j.psep.2019.10.036. [DOI] [Google Scholar]
- 19.Lim S., Norzahari F., Lee H. A GIS-based analysis of potential sewer choke in Western Sydney Region. KSCE J. Civ. Eng. 2010;14:601–612. doi: 10.1007/s12205-010-0601-y. [DOI] [Google Scholar]
- 20.Abebe Y., Tesfamariam S. Storm sewer pipe renewal planning considering deterioration, climate change, and urbanization: a dynamic Bayesian network and GIS framework. Sustain. Resilient Infrastruct. 2023;8:70–85. doi: 10.1080/23789689.2020.1740865. [DOI] [Google Scholar]
- 21.Oduah U.I., Ogunye E.B. A smart solution for preventing environmental pollution caused by overflowing onsite sewage septic tank. Heliyon. 2023;9 doi: 10.1016/j.heliyon.2023.e14925. [DOI] [PMC free article] [PubMed] [Google Scholar]
- 22.Banik B.K., Alfonso L., Di Cristo C., Leopardi A., Mynett A. Evaluation of different formulations to optimally locate sensors in sewer systems. J. Water Resour. Plann. Manag. 2017 doi: 10.1061/(asce)wr.1943-5452.0000778. [DOI] [Google Scholar]
- 23.Stoianov I., Nachman L., Whittle A., Madden S., Kling R. Water Distrib. Syst. Anal. Symp. 2006. American Society of Civil Engineers; Reston, VA: 2008. Sensor networks for monitoring water supply and sewer systems: Lessons from Boston; pp. 1–17. [DOI] [Google Scholar]
- 24.Tatiparthi S.R., De Costa Y.G., Whittaker C.N., Hu S., Yuan Z., Zhong R.Y., Zhuang W.Q. Development of radio-frequency identification (RFID) sensors suitable for smart-monitoring applications in sewer systems. Water Res. 2021 doi: 10.1016/j.watres.2021.117107. [DOI] [PubMed] [Google Scholar]
- 25.Kim J., Lim J.S., Friedman J., Lee U., Vieira L., Rosso D., Gerla M., Srivastava M.B. 2009 6th Annu. IEEE Commun. Soc. Conf. Sensor, Mesh Ad Hoc Commun. Networks. IEEE; 2009. SewerSnort: a drifting sensor for in-situ sewer gas monitoring; pp. 1–9. [DOI] [Google Scholar]
- 26.Ogura H. München; Germany: 2005. Analog Output Type Distance Measuring Sensor GP2Y0A41SK0F. [Google Scholar]
- 27.Kamami . Kamami.Pl - Electron. Store.; 2023. TOF laser ranging sensor module.https://kamami.pl/en/distance-sensors/581159-tof-laser-range-sensor-5m.html [Google Scholar]
- 28.Diymore, JSN SR04T DC 5V . Sens. Modul. - Diymore.; 2023. Ultrasonic module distance measuring transducer sensor IO Port waterproof for Arduino.https://www.diymore.cc/collections/sensor-module/products/high-accuracy-jsn-sr04t-dc-5v-ultrasonic-module-distance-measuring-transducer-sensor-io-port-waterproof-for-arduino [Google Scholar]
- 29.Benewake, Short-Range Distance Sensor. 2023. http://en.benewake.com/Industrial/index.html [Google Scholar]
- 30.UrukTech, FC-28 Soil Hygrometer (Moisture) Sensor. UrukTech Electron; 2023. https://www.uruktech.com/product/fc-28-soil-hygrometer-sensor/#::text=Description%3A%20The%20FC28%20Soil%20Moisture,acting%20as%20a%20variable%20resistor [Google Scholar]
- 31.Centenary, YL-63 Infrared & Photoelectric Sensor Modules. Centen. Mater. Co., Ltd.; 2023. https://www.duino.lk/product/ir-infrared-obstacle-avoidance-sensor-module-adjustable/ [Google Scholar]
- 32.NBK, Daily Official (Market) Foreign Exchange Rates. Natl. Bank Kazakhstan; 2023. [Google Scholar]
- 33.2023. Atmel, ATmega328P datasheet, 8-bit AVR microcontroller with 32K Bytes in-system program, Flash.https://www.alldatasheet.com/datasheet-pdf/pdf/1132281/ATMEL/ATMEGA328P.html [Google Scholar]
- 34.Espressif Systems, ESP8266EX Datasheet. 2023. https://datasheetspdf.com/datasheet/ESP8266EX.html [Google Scholar]
- 35.Make-It.ca, NodeMCU ESP8266 Detailed Review. 2023. https://www.make-it.ca/nodemcu-details-specifications/ [Google Scholar]
- 36.Ai-Thinker . vol. 1. 2017. (Ra-02 LoRa Product Specification V1). [Google Scholar]
- 37.SIMCom, SIM800L GSM/GPRS Module. 2023. https://techmartgh.com/product/sim800l-gprs-gsm-module/ [Google Scholar]
- 38.DigitalZakka, ABS Black Plastic Electronics Project Box Enclosure Hobby Case with Screws. 2023. https://digitalzakka.com/product/abs-black-plastic-electronics-project-box-enclosure-hobby-case-with-screws/ [Google Scholar]
- 39.Utepov Y.B. Effect of the shape and structure of MATURITY SENSOR’S plastic housing on its PHYSICO-mechanical properties. Eurasian Phys. Tech. J. 2021;18:83–87. doi: 10.31489/2021No3/83-87. [DOI] [Google Scholar]
- 40.Saft L.S. 2023. 14500 Product Datasheet; p. 2. [Google Scholar]
- 41.Mean Well, 15W Single Output Switching Power Supply, (n.d.) 2. [Online]. Available: https://www.meanwell.com/productSeries.aspx. Accessed on 22 February 2023.
- 42.Chikamoto Y., Tsutsumi Y., Sawano H., Ishihara S. Design and implementation of a video-frame localization system for a drifting camera-based sewer inspection system. Sensors. 2023;23:793. doi: 10.3390/s23020793. [DOI] [PMC free article] [PubMed] [Google Scholar]
- 43.Benedetti L., Langeveld J., Comeau A., Corominas L., Daigger G., Martin C., Mikkelsen P.S., Vezzaro L., Weijers S., Vanrolleghem P.A. Modelling and monitoring of integrated urban wastewater systems: review on status and perspectives. Water Sci. Technol. 2013;68:1203–1215. doi: 10.2166/wst.2013.397. [DOI] [PubMed] [Google Scholar]
- 44.Hofer T., Montserrat A., Gruber G., Gamerith V., Corominas L., Muschalla D. A robust and accurate surrogate method for monitoring the frequency and duration of combined sewer overflows. Environ. Monit. Assess. 2018;190:209. doi: 10.1007/s10661-018-6589-3. [DOI] [PMC free article] [PubMed] [Google Scholar]
- 45.Xekalakis G., Christou P. Tracing the historical development of architecture in Cyprus and its resilience to seismic hazards. Int. J. Archit. Eng. Technol. 2023;10:1–15. doi: 10.15377/2409-9821.2023.10.1. [DOI] [Google Scholar]
- 46.Utepov Y., Kazkeyev A., Aniskin A. A multi-criteria analysis of sewer monitoring methods for locating pipe blockages and manhole overflows. Technobius. 2021;1 doi: 10.54355/tbus/1.4.2021.0006. [DOI] [Google Scholar]
- 47.Zhussupov T., Yelubay L. House stock forecasting based on population growth. A case of Nur-Sultan City, Kazakhstan, Technobius. 2021;1 doi: 10.54355/tbus/1.4.2021.0009. 0009. [DOI] [Google Scholar]
- 48.Mkilima T. Dam site characterization based on Land use and Land cover changes in urban catchments. A case of the Msimbazi catchment in dar es Salaam, Tanzania. Technobius. 2023;3 doi: 10.54355/tbus/3.1.2023.0034. 0034. [DOI] [Google Scholar]
- 49.Edmondson V., Cerny M., Lim M., Gledson B., Lockley S., Woodward J. A smart sewer asset information model to enable an ‘Internet of Things’ for operational wastewater management. Autom. ConStruct. 2018;91:193–205. doi: 10.1016/j.autcon.2018.03.003. [DOI] [Google Scholar]
- 50.Hussin Z.M., Saaddin S.S., Mohammad S., Azmi N.A.M., Salim S. 2022 IEEE Int. Conf. Autom. Control Intell. Syst. IEEE; 2022. Development of automated drainage system; pp. 72–77. [DOI] [Google Scholar]
- 51.Ramadhin S.P.K., Anand S., Aishwarya R., R Y. 2021 5th Int. Conf. Intell. Comput. Control Syst. IEEE; 2021. Smart drainage and health monitoring system of manual scavenger using IoT; pp. 412–416. [DOI] [Google Scholar]
- 52.Kannala J., Brandt S.S., Heikkilä J. Measuring and modelling sewer pipes from video. Mach. Vis. Appl. 2008;19:73–83. doi: 10.1007/s00138-007-0083-1. [DOI] [Google Scholar]
- 53.Yin X., Ma T., Bouferguene A., Al-Hussein M. Automation for sewer pipe assessment: CCTV video interpretation algorithm and sewer pipe video assessment (SPVA) system development. Autom. ConStruct. 2021;125 doi: 10.1016/j.autcon.2021.103622. [DOI] [Google Scholar]
- 54.Ji H.W., Yoo S.S., Koo D.D., Kang J.H. 2021. Determination of Internal Elevation Fluctuation from CCTV Footage of Sanitary Sewers Using Deep Learning, Water (Switzerland. [DOI] [Google Scholar]
- 55.Inagaki Y., Ikeda H., Takeuchi P.K., Yato Y., Sawai T. An effective measure for evaluating sewer condition: UAV screening in comparison with CCTVS and manhole cameras. Water Pract. Technol. 2020;15:482–488. doi: 10.2166/wpt.2020.038. [DOI] [Google Scholar]
- 56.Jannata M.S., Salam R.A., Suhendi A. Study on the near-IR light detection and ranging (LiDAR) potential use as water level sensor. IOP Conf. Ser. Earth Environ. Sci. 2021;704 doi: 10.1088/1755-1315/704/1/012040. [DOI] [Google Scholar]
- 57.Caradot N., Sonnenberg H., Rouault P., Gruber G., Hofer T., Torres A., Pesci M., Bertrand-Krajewski J.-L. Influence of local calibration on the quality of online wet weather discharge monitoring: feedback from five international case studies. Water Sci. Technol. 2015;71:45–51. doi: 10.2166/wst.2014.465. [DOI] [PubMed] [Google Scholar]
- 58.A. N, N. V, . P., P. S, A.P.G. D L A review on manhole monitoring system. Int. J. Res. Appl. Sci. Eng. Technol. 2023;11:1972–1974. doi: 10.22214/ijraset.2023.49854. [DOI] [Google Scholar]
- 59.Nataraja N., Amruthavarshini R., Chaitra N.L., Jyothi K., Krupaa N., Saqquaf S.S.M. 2018 3rd IEEE Int. Conf. Recent Trends Electron. Inf. Commun. Technol. IEEE; 2018. Secure manhole monitoring system employing sensors and GSM techniques; pp. 2078–2082. [DOI] [Google Scholar]
- 60.Tasin H.S., Sarkar M.S., Rahman M.A., Shara S.H., Zishan M.S.R. 2021 2nd Int. Conf. Robot. Electr. Signal Process. Tech. IEEE; 2021. Design and development of uncapped manhole detection system for waterlogged Roads; pp. 561–566. [DOI] [Google Scholar]
- 61.Gruber G., Winkler S., Pressl A. Continuous monitoring in sewer networks an approach for quantification of pollution loads from CSOs into surface water bodies. Water Sci. Technol. 2005;52:215–223. [PubMed] [Google Scholar]
- 62.Siemers L., Dodd J., Day D., Kerr D., LaGorga J., Romano P. Low cost overflow monitoring techniques and hydraulic modeling of A complex sewer network. Proc. Water Environ. Fed. 2011;2011:571–583. doi: 10.2175/193864711802837363. [DOI] [Google Scholar]
- 63.Wani O., Scheidegger A., Carbajal J.P., Rieckermann J., Blumensaat F. Parameter estimation of hydrologic models using a likelihood function for censored and binary observations. Water Res. 2017;121:290–301. doi: 10.1016/j.watres.2017.05.038. [DOI] [PubMed] [Google Scholar]
- 64.Rasmussen M.R., Thorndahl S., Schaarup-Jensen K. 11th Int. Conf. Urban Drain. Edinburgh Int. Conf. Centre, Scotl. Aalborg Universitet; Edinburgh, Scotland: 2008. A low cost calibration method for urban drainage models; p. 6. [Google Scholar]
- 65.Jeanbourquin D., Sage D., Nguyen L., Schaeli B., Kayal S., Barry D.A., Rossi L. Flow measurements in sewers based on image analysis: automatic flow velocity algorithm. Water Sci. Technol. 2011;64:1108–1114. doi: 10.2166/wst.2011.176. [DOI] [PubMed] [Google Scholar]
- 66.Lo S.-W., Wu J.-H., Lin F.-P., Hsu C.-H. Visual sensing for urban flood monitoring. Sensors. 2015;15:20006–20029. doi: 10.3390/s150820006. [DOI] [PMC free article] [PubMed] [Google Scholar]
Associated Data
This section collects any data citations, data availability statements, or supplementary materials included in this article.
Data Availability Statement
The data that support the findings of this study are available from the corresponding author, upon reasonable request.