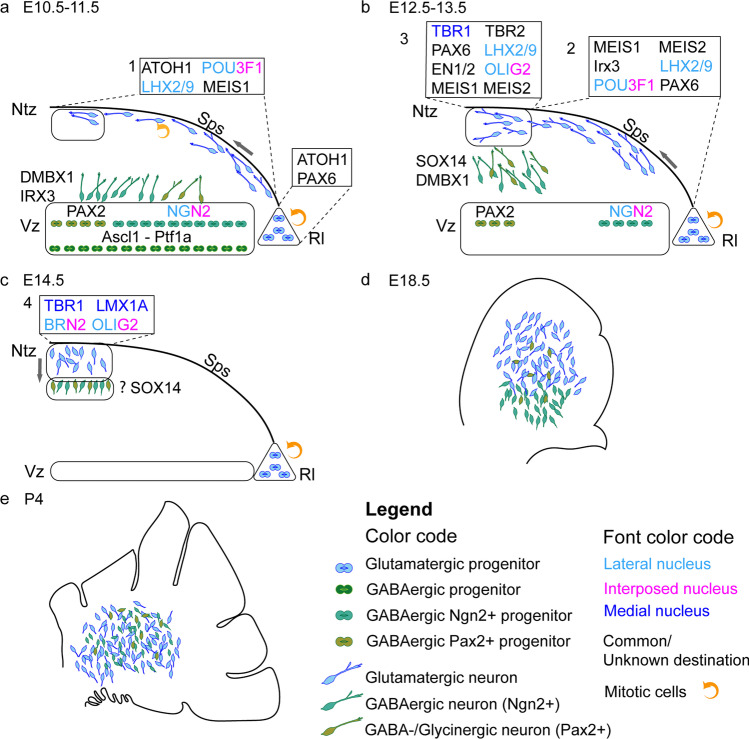
Fig. 12.
Schematic drawing showing migratory steps of GABAergic and glutamatergic neurons composing the cerebellar nuclei. All sagittal sections are oriented with rostral to the right. a Between E10.5 and E11.5 glutamatergic projection neurons (light blue cells) originate from the ATOH1 + and PAX6 + progenitors (light blue spheroids) localized in the Rhombic Lip (Rl, Triangular shape). They migrate apposed to the pia mater, forming the subpial stream (SPS, curved line) away from the Rl (gray arrow) expressing the genes indicated in Box 1. Few neurons reach the nuclear transitory zone (Ntz). GABAergic neurons differentiate from ASCL1 + and PTF1A + common progenitors (green spheroids) in the ventricular zone (Vz, rectangular shape) from which NEUROG2 + or PAX2 + transit amplifier populations originate (green spheroids). Postmitotic NEUROG2 + or PAX2 + GABAergic (green cells) neurons leave the Vz expressing IRX3 or Dmbx1. b Between E12.5 and E13.5 glutamatergic projection neurons continue their migration expressing several markers (Box 2) and start to reach the Ntz, where they express other markers (Box 3). GABAergic neurons move towards the Ntz and express SOX14 and DMBX1 while IRX3 is downregulated. Neurogenesis of NEUROG2 + and PAX2 + neurons appears to continue until E12.25-E12.5. c By E14.5 all the prospective glutamatergic CN neurons are located in the Ntz surrounded by a GABAergic population, where they further mature and prepare to descend into their final position in the central mass (grey arrows). d By E18.5 all the neurons are in the central mass, occupying different territories: glutamatergic neurons localize dorsally while NEUROG2 + GABAergic neurons are in ventral and lateral positions. A few PAX2 + GABAergic neurons are intermingled in the neuronal mass, while the prospective PAX2 + GABAergic interneurons surround the cerebellar nuclei mass. e By P4, the GABAergic and glutamatergic neurons continue small movements to reach their terminal destination. Color fonts of expressed molecules during development indicate the known destination of the cells. The numbers of cells illustrated do not reflect the actual cell numbers, which are mostly unknown

