

Summary
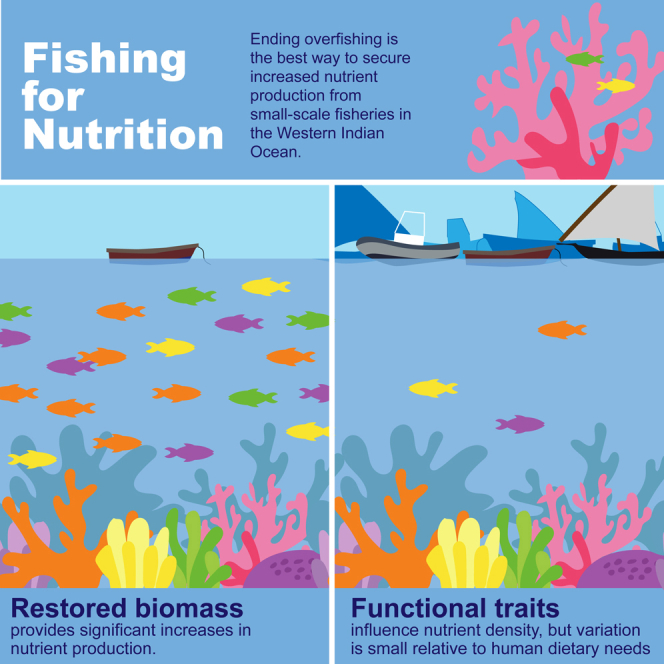
The need to enhance nutrient production from tropical ecosystems to feed the poor could potentially create a new framework for fisheries science and management. Early recommendations have included targeting small fishes and increasing the species richness of fish catches, which could represent a departure from more traditional approaches such as biomass-based management. To test these recommendations, we compared the outcomes of biomass-based management with hypothesized factors influencing nutrient density in nearshore artisanal fish catches in the Western Indian Ocean. We found that enhancing nutrient production depends primarily on achieving biomass-based targets. Catches dominated by low- and mid-trophic level species with smaller body sizes and faster turnover were associated with modest increases in nutrient densities, but the variability in nutrient density was small relative to human nutritional requirements. Therefore, tropical fishery management should focus on restoring biomass to achieve maximum yields and sustainability, particularly for herbivorous fishes.
Subject areas: Aquatic science, Biomass, Earth sciences, Natural sciences
Graphical abstract
Highlights
-
•
Overfishing drives lost nutrient production in WIO artisanal fisheries
-
•
Enhancing nutrient production depends on restoring biomass to sustainable levels
-
•
Modest increases in nutrient density are associated with fish functional traits
Aquatic science; Biomass; Earth sciences; Natural sciences
Introduction
Nearshore tropical ecosystems provide food, income, and other services to over one billion residents of tropical countries.1,2 However, climate change and overfishing degrade tropical ecosystems and threaten their ability to provide food security and nutrition to nearby populations.3,4 The fish harvested in these ecosystems are highly nutritious, but malnutrition often remains high, in part due to lost production as a result of overfishing.5,6,7,8 In spite of this, existing approaches to fishery management have largely failed to consider the value of fish as a nutritional resource, particularly in food insecure regions where this approach is most warranted.7,9 There is thus an urgent need to safeguard the nutritional benefits currently derived from tropical fisheries and sustainably increase nutrient production where possible.3
Nutrition-sensitive governance (NSG) offers one approach to safeguarding and enhancing the nutritional benefits of tropical fisheries.10 NSG leverages governance interventions at all levels through a distributive justice lens to provide dietary nutrients to those who most need them.10 In so doing, it addresses all six dimensions of food security: availability, access, utilization, stability, agency, and sustainability.11 Within the NSG framework, fisheries management plays an important supporting role by seeking to achieve sustainable production of plentiful dietary nutrients in coastal communities. This is normally accomplished by estimating the relationship between fish biomass and surplus production, which is mediated by the recovery rate of fish communities, reef locations, and histories of disturbance, among a variety of other ecological and environmental factors.12,13,14,15,16 By maintaining fish biomass at or near a locally specific management reference point, usually around 50% of the unfished biomass, sustainable yields of ∼5–6 tons km−2 year−1 can be achieved, although this value is highly variable depending on the estimation methods and locations reported.15,16,17,18 Managing nearshore tropical ecosystems with biomass-based targets achieves a number of goals, such as maintaining biodiversity and ecosystem functioning to the extent possible within fished seascapes, increasing microbial diversity, and enhancing reefs’ resilience to climate change and other sources of stress.19,20,21,22 These targets are usually met by implementing fishing restrictions such as spatial closures and gear restrictions that protect sensitive habitat and sexually immature fishes.23 However, even the best managed nearshore fisheries do not represent the diversity, trophic structure, or biomass present at pristine wilderness locations.24
Biomass-based management has not yet considered the nutritional quality of fish catches.3 Doing so could lead to alternative strategies. Preliminary suggestions to enhance nutrient production from fisheries have included the preferential targeting of small fish species,25,26,27 increasing the species richness of fish catches,8,28,29 and moving away from biomass-based targets in favor of nutrient density (concentration expressed per human nutritional requirement) or yield (total nutrient production) metrics.3,30 These suggestions build on a premise that nutrient production might peak under different circumstances than maximum yield.30 However, initial investigations in tropical ecosystems have not found stark tradeoffs between biomass and nutrition, nor have they been consistent with preliminary management suggestions based mostly on global studies. In Kenya, for example, fish traps modified to release small fishes generated modest increases in nutrient yields, suggesting that traditional length- and biomass-based management approaches might also enhance nutrition.31 In the Seychelles, macroalgal regime-shifted reefs with low species richness supported higher densities of iron and zinc among and within fished species, suggesting that diversity does not necessarily increase nutrition.5 Unlike land-based systems, aquatic foods and their production systems can be highly diverse.32 As a result, blanket recommendations may fail in some contexts. Instead, local and regional solutions should be sought based on the unique characteristics of particular social-ecological systems.33
Options for enhancing nutrient production in tropical artisanal fisheries have not yet been evaluated on a large scale despite their crucial role as nutrient banks in the poorer Global South.3 In this study, we explore options for nutrient production from fisheries in the food insecure faunal province of the Western Indian Ocean (WIO). The WIO includes larger countries that tend to have an increased prevalence of moderate or severe food insecurity (59–75%), such as Mozambique, Madagascar, Tanzania, and Kenya, as well as small island jurisdictions with comparatively lower rates of food insecurity, such as Maldives (13%), Seychelles (15%), and Mauritius (32%).34 The small island jurisdictions also have comparatively better childhood nutritional outcomes, with lower rates of stunting among children aged five and younger (7–14%) than in the larger, more food insecure countries (18–39%).34
There is wide variation in aquatic food consumption in this region, accounting for only 7% of animal-source protein consumption in Kenya but 66% in Maldives.35 However, these national statistics often obscure significant differences within countries.36 For instance, artisanal fisheries in Kenya play a very important role in local subsistence despite low consumption at the national level.36 Along the Kenyan coast, fishing households are more food secure and consume more fish than their neighbors, but micronutrient intakes remain low among children across households, including for vitamin A, iron, and zinc.37,38,39 In Seychelles, insufficient intakes of iron, zinc, and selenium are common among pregnant women, but increased fish consumption, which is more common among low-income individuals, is associated with sufficient intakes.40,41 Across the WIO, however, data on fish consumption, nutrient intakes, and nutritional status are scarce.
Here, we use large datasets and a machine learning algorithm to evaluate dietary nutrient production in the nearshore artisanal fisheries of the Western Indian Ocean. Specifically, we ask (1) what the nutritional quality of the nearshore artisanal catch is, (2) how achieving biomass-based management targets will influence nutrient yields, and (3) what factors influence nutrient densities in these fisheries. First, we reconstructed the taxonomic and nutritional composition of artisanal fishery catches in 10 jurisdictions. Second, the biomass and production of these fisheries were estimated in ∼6.25 km2 cells using a strongly predictive multivariate environment model (training-testing R2 = 85%) developed to evaluate the factors that influence stock biomass on coral reefs.42 We were thus able to estimate daily nutrient production for all mapped cells in our 10 jurisdictions. Finally, for 41 landing sites distributed in Kenya, Mozambique, and Madagascar, we compiled 20 environmental variables (e.g., water, temperature, current velocity), 10 catch variables (e.g., length, species richness), and 7 management variables (e.g., gear restrictions, area closures) suspected to influence catch nutrient densities (Table S1).
Data were derived from remote sensing and in situ measurements, catch monitoring data, and predictive models of tropical fisheries. Using a variable selection procedure and the Random Forest Model (RFM) algorithm, we evaluated the potential influences of these variables on the catch’s nutrient density. Nutrient densities are presented as the percent daily recommended intake for a child 1–3 years old available in 100 g of fish.43,44 It is unlikely that children will eat 100 g of fish in one day, but using this value allows for more direct comparison with previous studies on nutrient yields from fisheries.5,8,45 We found that selenium, omega-3, and zinc were abundant in the WIO artisanal catch. We also found significant potential nutrient gains from restoring fishable biomass and modest increases in nutrient density associated with catches dominated by comparatively smaller and lower trophic level species.
Results and discussion
Nearshore artisanal fisheries in the WIO produce significant amounts of selenium, omega-3, and zinc, and achieving biomass-based management targets would significantly increase their overall nutrient production (Figure 1; Table 1). In the WIO region, much of the potential production has been lost due to a widespread failure to achieve biomass targets (Figures 2 and 3).20,42 We found modest variation in nutrient densities in the WIO artisanal catch, amounting to a range of approximately 10% of the total daily requirement of a child 1–3 years old (Figure 4). Increased nutrient densities were associated with catches made up of predominantly low- and mid-trophic level species with smaller body sizes and higher growth coefficients, but that were still above the threshold for sexual maturity (Figure 4). While existing approaches to nutrition-sensitive fisheries management sometimes advocate maximizing nutrient densities (quality) rather than yields (quantity), we find that both aspects of nutrient production are important, and that restoring biomass will be a key management strategy to support NSG.8,10,28,30
Figure 1.

Nutrient density of artisanal fish catches in 10 Western Indian Ocean jurisdictions
Density of six nutrients in fish muscle tissue as percentage of the recommended dietary reference intake for a child 1–3 years old based on a 100 g daily consumption. Nutrient densities were derived from an estimated standard catch composition for each jurisdiction based on reconstructed small-scale catches from the Sea Around Us database and, where available, national catch statistics and landing site monitoring data (Table S1). Some variation is expected to exist within each jurisdiction.
Table 1.
Daily lost nutrients due to overfishing as proportion of national child population
| Child Population | Selenium Daily Portions | Omega-3 Daily Portions | Zinc Daily Portions | Iron Daily Portions | Vitamin A Daily Portions | Calcium Daily Portions | |
|---|---|---|---|---|---|---|---|
| Reunion | 42,090 | 12,463 (29.6%) | 3,150 (7.5%) | 1,059 (2.5%) | 1,508 (3.6%) | 153 (0.4%) | 451 (1.1%) |
| Mozambique | 3,274,842 | 373,589 (11.4%) | 73,089 (2.2%) | 64,518 (2.0%) | 30,439 (0.9%) | 17,562 (0.5%) | 25,618 (0.8%) |
| Kenya | 4,207,317 | 146,890 (3.5%) | 31,858 (0.8%) | 27,431 (0.7%) | 11,449 (0.3%) | 8,830 (0.2%) | 5,767 (0.1%) |
| Tanzania | 5,624,229 | 439,851 (7.8%) | 75,180 (1.3%) | 63,923 (1.1%) | 31,425 (0.6%) | 22,503 (0.4%) | 23,927 (0.4%) |
| Mauritius | 39,560 | 69,276 (175%) | 13,040 (33.0%) | 17,747 (44.9%) | 6,146 (15.5%) | 5,216 (13.2%) | 2,796 (7.1%) |
| Madagascar | 2,562,401 | 460,518 (18.0%) | 95,251 (3.7%) | 78,873 (3.1%) | 34,168 (1.3%) | 34,500 (1.3%) | 21,180 (0.8%) |
| Seychelles | 4,915 | 65,508 (>100%) | 14,607 (>100%) | 11,759 (>100%) | 6,444 (>100%) | 6,419 (>100%) | 2,815 (57.2%) |
| Mayotte | 32,023 | 18,305 (57.2%) | 3,036 (9.5%) | 2,045 (6.4%) | 1,277 (4.0%) | 941 (2.9%) | 627 (2.0%) |
| Comoros | 68,660 | 32,235 (46.9%) | 5,060 (7.4%) | 2,473 (3.6%) | 2,791 (4.1%) | 805 (1.2%) | 935 (1.4%) |
| Maldives | 21,821 | 124,562 (>100%) | 18,581 (85.2%) | 10,855 (49.7%) | 9,043 (41.4%) | 3,036 (13.9%) | 4,121 (18.9%) |
Legend: Total nutrient yields lost daily due to biomass overfishing of coral reefs within each fishery jurisdiction. Lost nutrients are presented as number of daily portions and percent of child population. One daily portion of each nutrient is the recommended dietary reference intake for a child 1–3 years old. Child population is the estimated number of children 1–3 years old in each jurisdiction in 2023.36 Fishing jurisdictions are presented in decreasing order of prevalence of overfishing. Although national populations are presented here, marine artisanal fisheries primarily support coastal populations, particularly in the jurisdictions with larger land areas, such as Kenya, Tanzania, Mozambique, and Madagascar.36
Figure 2.

Lost nearshore nutrient yields due to overfishing in the Western Indian Ocean
Heat maps of lost nutrient yields due to overfishing in six jurisdictions. Lost yields are presented as a factor of the combined dietary reference intake (i.e., the complete daily requirement of six nutrients) and yield per square kilometer per day. Jurisdictions are presented left to right by row in decreasing order of prevalence of overfishing, with overfished reefs being most frequent in Reunion and less frequent in Madagascar. Detailed maps of all 10 jurisdictions can be found in Figures S1–S10.
Figure 3.

Lost nutrient yields at overfished sites
Violin plots of the median value and distribution density of nutrient yields lost due to overfishing. Lost yields are expressed as the expected increase in yield associated with restoring fishable biomass to sustainable levels, reported as number of daily portions of each nutrient per reef area.
Figure 4.

Factors influencing nutrient densities
Variables associated with nutrient densities in artisanal fish catches from 41 nearshore coral and seagrass-based landing sites in Kenya, Mozambique, and Madagascar. (A) Random Forest Model (RFM) results showing two measures of variable importance. (B–F) RFM estimates (black) and locally weighted smoothing (blue) for partial dependence of nutrient concentration on informative variables: the most frequent habitat of the captured species (B), trophic level (C), growth coefficient (K) (D), the ratio of length at capture to length at maturity (L/Lmat) (E), and length at capture (F). See also Figures S11–18.
Tropical fisheries provide key dietary nutrients
Selenium, omega-3, and zinc were abundant in the WIO artisanal catch (Figure 1). Fish catches in all 10 jurisdictions were an excellent source of selenium, providing >100% of a child’s recommended daily intake in a 100 g daily portion. Catches were also a good source of omega-3, providing ≥38% recommended intake in 100 g (Figure 1). Catches from all jurisdictions except Reunion had a high density of zinc, providing ≥31% of the recommended daily allowance (Figure 1). Catches from Maldives, Comoros, and Reunion were also good sources of iron with ≥30% of the recommended daily allowance in a daily portion (Figure 1). Nutrient densities were largely similar across these jurisdictions, ranging from ∼210% in Seychelles to ∼260% in Maldives. A total of 600% would indicate the full recommended daily intake for all six nutrients (calcium, iron, omega-3, selenium, vitamin A, and zinc). For more data-rich jurisdictions where subnational variations in nutrient composition could be observed, there were only small variations among catches as indicated by low standard errors. In Kenya and Madagascar, the mean nutrient density was 202% (±0.6 SE), and in Mozambique, the mean nutrient density was 210% (±1.0 SE). Nutrient densities for catches in all three jurisdictions ranged from 73% to 394%.
Nutrient yields are limited by overfishing and biomass depletion
All fisheries jurisdictions were losing yields and nutrients to overfishing. Overfished sites, which account for ∼37% of studied nearshore fishing grounds, lose on average 2.78 kg km−2 day−1 (±0.01 SE) in fish yields relative to estimated maximum sustained yield, with sites in many jurisdictions frequently losing more. These lost yields significantly limit nutrient production from tropical fisheries by several portions of the six nutrients km−2 day−1 (Table 1).
Overfishing displayed spatial patterns both within and among jurisdictions. Within jurisdictions, overfished reefs were often located near population centers and other overfished reefs, while reefs with high biomass were often remote from markets or highly protected (Figures 2 and S1–S10).42 Among jurisdictions, overfishing was most prevalent in coastal nations with high populations and more accessible reefs, while it was less common in small island and archipelagic jurisdictions (Figures 2 and S1–S10).42 In the most overfished jurisdictions, such as Kenya, Reunion, Mozambique, and Madagascar, overfished reefs were losing many daily portions of selenium (30–38), omega-3 (12–21), and zinc (7–15) per square kilometer per day (Figure 3).
Restoring fishable biomass on coral reefs would greatly increase nutrient production (Figure 2; Table 1). Ending overfishing in Reunion, for example, would produce enough additional selenium to meet the daily requirement of nearly 30% of children 1–3 years old (Table 1). In Seychelles, recovering lost yields would provide more than enough additional selenium, omega-3, and zinc to meet the daily requirements of all children aged 1–3 assuming the species composition of the catch does not change greatly (Table 1). In jurisdictions with larger and more widely distributed populations, such as Kenya, Tanzania, Mozambique, and Madagascar, the increase in nutrient production is smaller when compared with total child nutrient demand, but still amounts to thousands of daily requirements of all six nutrients (Table 1). These larger jurisdictions have significant inland populations that often have little or no access to marine fisheries production.36 As such, the production figures in Table 1 should be interpreted as assets available for national food system governance, not benefits that will be automatically accrued upon ending overfishing. In general, additional production does not directly translate to food security or public health outcomes, but it can serve as a resource for more holistic interventions through governance or other means.10,46
Small body sizes and lower trophic levels are associated with modest increases in nutrient densities
Nutrient densities in artisanal fish catches observed at 41 landing sites in three WIO countries displayed modest variability attributed to catch characteristics. Densities clustered between 210% and 260% (out of a potential 600%) of a child’s total dietary requirement for all six nutrients in a 100 g daily portion. The variables that influenced nutrient density were the habitat of fished species, trophic level, somatic growth coefficient (K), the ratio of the length of captured fish to their estimated length at sexual maturity (L/Lmat), and length at capture (Figure 4). Catches of fish <25 cm in length had ∼20% higher nutrient densities (Figure 4F). Modeled nutrient densities also peaked at or slightly above the sexual maturity reference point of L/Lmat = 1 (Figure 4E). Catches dominated by herbivorous and mid-trophic species with high intrinsic growth rates (K > 1) were associated with ∼10% higher nutrient densities (Figures 4C and 4D). Effect sizes were modest relative to human nutritional requirements, amounting to ∼10% of the recommended intake for a child 1–3 years old in a daily portion of fish.
The RFM performed well, explaining 85% of the variance in nutrient densities for the training data and 67% for testing data. Most of the initially tested variables, including all management and environmental variables, had no relationship to nutrient densities in the daily catch (Figure S11). Climate and other anthropogenic pressures did not greatly affect the nutritional composition of these fish catches (Figure S11), although it has been suggested these factors might be related.3 Results for individual nutrients were not always consistent with the trends in overall density, either in variable importance or the sign and shape of the relationship, which suggests that policies targeting specific nutrient deficits will differ from those seeking to maximize the overall density of the catch (Figures S13–S18).
The relationship between nutrient density and trophic level, growth coefficient, and body size is consistent with recent literature on the value of low-trophic level species with high turnover and productivity. As in Seychelles, Belize, Fiji, and Solomon Islands, the artisanal fisheries of Kenya, Mozambique, and Madagascar experience a modest nutritional benefit when catches are dominated by lower trophic levels (≤3.5) (Figure 4C).5,47 Such fisheries are potentially problematic from a conservation perspective as they can be associated with decreased diversity, trophic downgrading, and changes in life histories in unselective tropical fisheries.24 However, they are also sometimes associated with persistent yields and increased productivity despite often high levels of exploitation.13,14 As a result, there may be significant potential to protect and enhance nutrient production where trophic downgrading has already occurred.
Our findings suggest a nuanced approach to the role of small fish in nutrient production. Most of the literature advocating for the increased capture and consumption of small fishes refer to specific species and families (e.g., Clupeidae).6,26 Sustainable targeted fisheries for such species are quite valuable for nutrient production.6,27,48 However, the WIO nearshore artisanal fisheries studied here are unselective, and catches with small body sizes contain a mix of mature individuals of small-bodied species alongside immature individuals of large-bodied species.49 In these fisheries, targeting small fishes decreases yields and contributes to overfishing, which we connect to significant losses in overall nutrient production (Figures 2 and 3).23,49,50,51,52 Furthermore, the nutrient gains associated with small body sizes in this study were quite modest relative to human nutritional requirements (Figure 4F). As a result, unselective targeting of small fishes from coral reefs and associated nearshore tropical habitats is expected to significantly reduce nutrient yield and overall production while only garnering small benefits for nutrient density.49
Catches from our 41 landing sites did not display the same positive relationship between species richness and nutrient density found in other systems and at the global level.8,28,29 Although species richness is an important management concern for other reasons, we found no evidence it was related to nutrient production in nearshore marine tropical fisheries.19,22 Achieving increased species richness in artisanal fish catches would likely mean restoring fishable biomass to a level higher than that required for maximum sustained yield and incurring lost yields due to underfishing.19 Our findings suggest that high species richness is a conservation objective, not an objective for maximizing nutrient production from small-scale tropical fisheries.
Our model does not consider the potential effects of diverse recovery trajectories on coral reef fish communities. As fish biomass recovers to sustainable levels, the species, functional, and nutritional composition of restored fish communities may not be uniform across habitats or perturbations. This could cause recovered fish communities to support varying levels of nutrient production. Coral reef fish communities that have recovered from overfishing have usually regained key ecosystem functions, but they do not reflect the composition of unfished seascapes.18,24,53 Marine heat waves and coral bleaching also drive changes in fish community composition post-recovery, often leading to lost species and functional richness.54,55,56,57,58 Any such change in fish community functional traits can be expected to impact the nutrient composition of fish catches.7,59 This relationship has been observed in the Seychelles, where post-bleaching reef habitats supported different fish assemblages and nutrient compositions depending on whether coral cover returned or reefs transitioned to a macroalgal dominated state.5
Limitations of the study
Our use of large datasets and modeling made it possible to estimate nutrient production and the variables influencing it at a regional scale. However, this approach is also vulnerable to the highly variable spatial, taxonomic, and temporal resolutions of the underlying datasets. For example, the fish biomass model that estimates production and lost yields is based on 6.25 km2 cells that include various habitat types.42 It had high predictive skill and provides an acceptable spatial scale considering the operating behaviors of small-scale fishers in the WIO, but it is subject to higher uncertainty at lower spatial scales.42,60 Similarly, our jurisdiction-level catch reconstructions are based on the best data available, but they mask interannual and spatial variability in catch composition for WIO fisheries.23 Furthermore, as fish assemblages recover from overfishing and biomass is restored, species composition is expected to change.23 Our study of artisanal catches in Kenya, Mozambique, and Madagascar include this concern through life history parameters such as trophic level and growth coefficient. However, our broader WIO estimates assume that catch composition will stay the same as assemblages recover. Although this assumption is incorrect, we still expect our nutrient production estimates to be reasonably accurate, especially given the relatively low variability in nutrient density among landing sites and countries. Nonetheless, we consider our fish production and nutrient composition estimates to be open to revision as more data are collected across nearshore tropical systems.
STAR★Methods
Key resources table
| REAGENT or RESOURCE | SOURCE | IDENTIFIER |
|---|---|---|
| Deposited data | ||
| Multivariate environment-fish biomass model informs sustainability and lost income in Indian Ocean coral reefs | McClanahan et al.42 | https://doi.org/10.1016/j.marpol.2023.105590 |
| FishBase | Froese & Pauly61 | https://www.fishbase.org |
| Sea Around Us concepts, design, and data | Pauly et al.62 | https://seaaroundus.org |
| Characterisation of artisanal catches in selected fishing areas of the Lower Tana Delta and Malindi-Ungwana Bay, Kenya | Dzoga et al.63 | https://doi.org/10.4314/wiojms.v19i1.4 |
| Species composition, abundance, and fishing methods of small-scale fisheries in the seagrass meadows of Gazi Bay, Kenya | Musembi et al.64 | https://doi.org/10.1080/19480881.2019.1603608 |
| Catch monitoring data | Wildlife Conservation Society65 | NA |
| Catch monitoring data | Blue Ventures66 | NA |
| An investigation into fisheries trends and a critical analysis of fisheries management within the Bay of Ranobe, Madagascar | Tiliouine67 | NA |
| Fisheries co-management: Ecological and social impacts. A case study of Northern Mozambique | da Silva68 | NA |
| La pêche locale aux abords de la Réunion | Biais & Taquet69 | https://archimer.ifremer.fr/doc/00000/1455/ |
| Unpublished data | Seychelles Fishing Authority70 | NA |
| The annual fisheries statistics report | Tanzania Ministry of Livestock and Fisheries71 | NA |
| World population prospects: The 2022 revision | UNDESA72 | https://population.un.org/dataportal/ |
| Bio-ORACLE v2.0: Extending marine data layers for bioclimatic modeling | Assis et al.73 | https://doi.org/10.1111/geb.12693 |
| NOAA Coral reef watch: Daily global 5km satellite sea surface temperature product | NOAA74 | https://coralreefwatch.noaa.gov/ |
| Global gradients of coral exposure to environmental stresses and implications for local management | Maina et al.75 | https://doi.org/10.1371/journal.pone.0023064 |
| Marine socio-environmental covariates: Queryable global layers of environmental and anthropogenic variables for marine ecosystem studies | Yeager et al.76 | https://doi.org/10.1002/ecy.1884 |
| How accessible are coral reefs to people? A global assessment based on travel time | Maire et al.77 | https://doi.org/10.1111/ele.12577 |
| Software and algorithms | ||
| Original code associated with this paper | This paper | Zenodo: https://doi.org/10.5281/zenodo.8258102 |
| rfishbase v4.1.2 [R Package] | Boettiger et al.78 | https://doi.org/10.1111/j.1095-8649.2012.03464.x |
| R v4.2.2 | R Core Team79 | https://www.R-project.org/ |
| FishLife v3.0.0 [R Package] | Thorson et al.80 | https://doi.org/10.1111/2041-210X.14076 |
Resource availability
Lead contact
Further information and requests for resources and reagents should be directed to, and will be fulfilled by, the lead contact, Bryan P. Galligan, S.J. (bgalligan@jesuits.org).
Materials availability
This study did not generate new unique materials.
Data and code availability
-
•
This paper analyzes existing, publicly available data. These datasets and DOIs are listed in the key resources table. Some of the catch monitoring data reported in this study cannot be deposited in a public repository because access to it is governed by the original authors and/or organizations. To request access, contact the original authors via email. In addition, processed datasets derived from these data have been deposited at Zenodo and are publicly available as of the date of publication. DOIs are listed in the key resources table.
-
•
All original code has been deposited at Zenodo and is publicly available as of the date of publication. The DOI is listed in the key resources table.
-
•
Any additional information required to reanalyze the data reported in this paper is available from the lead contact upon request.
Method details
Nutrient density for 10 fishery jurisdictions
The nutrient density of fish catches was based on the relative biomass of captured species, but most jurisdictions do not report catch data with sufficient taxonomic precision to obtain precise nutrient estimates. We thus reconstructed the taxonomic composition of fish catches in 10 Western Indian Ocean (WIO) jurisdictions with available data. We began by using the catch compositions in the Sea Around Us (SAU) catch reconstruction database.62,81 We extracted the SAU estimates for artisanal and subsistence landings in the most recent year available as this was the most convenient way of accessing SAU catch composition estimates. For WIO artisanal catches, SAU reconstructions estimate a stable catch composition that is applied to several years at a time.62 For example, the Kenya catch reconstruction features one taxonomic breakdown applied to the small-scale catch from 1950 to 2010 and a second version for 2011–2018.82,83 The Madagascar catch reconstruction includes one taxonomic breakdown for the entire period 1950–2018.84,85 We removed unidentified species and non-fish species. The majority of SAU catch data were reported to the family level. For example, SAU reports artisanal landings in Kenya in 40 taxa, 38 of which (87% by mass) are families, genera, or species.83 For Maldives, SAU reports artisanal landings in 42 taxa: 7 families, 3 genera, and 32 species.86 For Mayotte, SAU reports artisanal landings in 95 taxa, including 31 families, 13 genera, and 46 species.85 By mass, 98% of Mayotte’s landings are reported to the family level or better. For four jurisdictions—Comoros, Maldives, Mauritius, and Mayotte—we used the SAU data as provided.85,86 For the remaining six jurisdictions—Kenya, Madagascar, Mozambique, Reunion, Seychelles, and Tanzania—we compiled data from various contributors and published datasets to increase the taxonomic precision of the SAU reconstructions.63,64,65,66,67,68,69,70,71,83,85,87,88,89 We did this by taking the original proportion of the catch assigned to each taxon in the SAU reconstructions and further partitioning it into finer taxonomic categories based on the proportions found in our supplementary sources of catch data. These data sources are summarized in Table S1.
By-species estimates of nutrient concentrations were extracted from FishBase using the rfishbase package in R, including calcium, iron, vitamin A, omega-3 polyunsaturated fatty acids, selenium, and zinc.61,78,79 The nutrient concentrations in FishBase are estimates derived from a series of hierarchical Bayesian models that predict nutrient concentrations in finfish species based on functional traits and phylogeny and are updated annually to account for new data and model improvements. In 7% of instances, nutrient concentrations were not available for an observed species, and in 1%, catch data listed fishes under imprecise taxonomic categories, such as genera or families. Where these problems occurred, we assigned a genus- or family-level mean nutrient concentration to the taxon in question. Nutrient densities were based on the percent daily recommended intake for a child 1–3 years old in a 100 g portion of fish.43,44 This portion size is unrealistically high for a young child, even as a daily consumption, but it is a convenient denominator and allows for more direct comparison with previous studies.5,8 There is a need for more data on fish consumption in the WIO and elsewhere. Daily consumption of marine fish has been estimated at approximately 76 g for adult women in the Seychelles,40 and 390 g per capita among coastal indigenous communities in East Africa.45
Overfishing-induced nutrient losses
We estimated nutrient yields relative to maximum sustained yield by combining our nutrient densities for each jurisdiction with estimates of actual and maximum production from a fish biomass model. Model estimates of fish biomass and lost yield were derived from a multivariate environment—fish biomass model that evaluated 15 environmental and management characteristics and used 7 variables to predict biomass and production for all mapped reef cells (∼6.25 km2) in the Western Indian Ocean (WIO).42 These cells contain a number of ecosystems, including hard bottom reefs, sandy bottom seagrass and mangroves, and pelagic systems. The spatial scale of the model is also contained within the area from which fish are captured in this region (i.e., ∼20 km2). This area is variable but has been measured as ∼9 km between fishing landing sites along shorelines.60 Therefore, for the purpose of utilizing a realistic space and ecosystem access of artisanal fishers, we estimated access and production for the 15–20 km2 areas next to a landing site location. We therefore extracted the mean biomass and production values from the nearest three cells offshore from each landing site. Environment, management, and biomass parameters used in the model drew from successfully predicted fishable biomass at 591 reef sites with an 85% fit to training data, with estimates based on environmental data collected between 1985 and the time of the biomass field sample.42 For the 10 jurisdictions included in this study, the model included 11,678 cells covering a total reef area of >70,000 km2. Here, we only include yields lost due to overfishing. While production could also be increased by expanding fishing into underexploited and protected areas, this was not considered as a viable or recommended option.
We converted the model’s estimates of biomass and lost yields into lost nutrient yields using our reconstructed nutrient catch densities for each jurisdiction. Nutrient yields are presented as a factor of nutrient density for all six nutrients (0–600%) and yield (kg) per square kilometer per day . Selenium was capped at 100%, so that 100 g of lost yield would be reported as 100% (0.17) of a combined serving km−2 day−1 plus the losses due to other nutrients. Lost nutrient yields were mapped by reef cell and aggregated for analysis by jurisdiction. In order to provide a sense of the scale of nutrient demand, we also extracted population estimates for each jurisdiction from the UN World Population Prospects Data Portal.72 These population estimates are of the total population aged 1–3 years as of July, 2023 based on projections revised and published in 2022.72 Although we used national population estimates, it should be noted that artisanal fisheries in the WIO primarily support coastal populations.36 For jurisdictions with large inland populations, such as Kenya, Tanzania, Mozambique, and Madagascar, nutrient production from marine fisheries will not benefit inland communities without additional governance interventions.
Quantification and statistical analysis
Modeling drivers of nutrient density
We compiled data for environmental, catch, and management parameters that could influence the nutrient composition of artisanal fishery catches at 41 landing sites in Kenya, Mozambique, and Madagascar. Thirty-seven variables were compiled for each site that could be classified as environment (20 variables), management (7 variables), and catch characteristics (10 variables) (Table S1). The catch and management characteristics were derived directly from observations at each landing site and based on long-term or published monitoring studies that recorded catch, length, and effort data for nearshore artisanal fisheries (Table S1).63,64,65,66,67,68 Data collection for these studies took place between 2001 and 2021 and observed a total of 5,188 fishing trips, defined as a unique combination of fisher/crew identity and date. Biomass and management variables were extracted from the biomass model used to estimate lost nutrient yields due to overfishing.42 All other variables were derived from publicly available databases and previous studies (Table S1).73,74,75,76,77
We also compiled estimates of life history parameters for each species in our study and cross-referenced those parameters with observed lengths at capture to provide indicators of fishery status relative to management reference points. The life history parameters we used were length at first maturity (Lmat) and optimum fishing length (Lopt). If the ratio of length at capture to length at maturity (L/Lmat) was less than one, recruitment overfishing was likely taking place.90 Growth overfishing was considered likely when the ratio of length at capture to optimum length (L/Lopt) was less than one.90 Although these single-species, length-based indicators are most frequently used in yield per recruit models, we apply them here in the context of community surplus production.17,50,91 Lmat for each species was obtained directly from the FishLife R package, which uses data found in FishBase and the RAM Legacy Stock Assessment Database to inform a Bayesian model that predicts life history parameters for all finfish species.61,80,92 We derived Lopt from the life history parameters estimated by FishLife using the equation
where Linf is the asymptotic length, M represents natural mortality, and K is the von Bertalanffy growth coefficient.93
We used a machine learning Random Forest Model (RFM) to identify environment, catch, and management parameters influencing the nutrient density of artisanal catches at our 41 landing sites. To select variables for modeling, we added a vector of random numbers in an initial series of RFM runs and eliminated all variables that were consistently less important than random numbers.94,95 This eliminated most variables, leaving only habitat, trophic level, growth coefficient (K), maturity (L/Lmat), and length at capture (cm). We then tested the remaining variables for autocorrelation using Spearman’s correlation coefficient. We retained all variables after this test as no variable pair had a correlation coefficient greater than 0.75.96 Uninformative variables do not hurt RFM performance, but removing them can streamline interpretation and computational efficiency.94,95
We split the retained data into a testing and training sample to construct and evaluate the RFM.97 The training dataset was a bootstrapped sample the same size as the original, sampled with replacement (n = 5,188 fishing trips). The testing dataset was the out-of-bag sample after bootstrapping (n = 1,922 fishing trips). We tuned the RFM based on its performance in predicting the training and testing data, which peaked when three of the five variables were randomly selected at each tree.94 After running the model, we plotted two measures of variable importance: the percent increase in mean squared error when a variable was eliminated, and the increase in node purity when a variable was included.94 Increase in node purity is a measure of the increase in predictive accuracy of a node in a decision tree when a particular variable is included.94
We extracted RFM predictions for the partial dependence of nutrient densities on each of the five selected variables and used a feature-based measure to evaluate variable significance.98 The only feature producing a mean squared error standard deviation of less than 0.01, catch per unit effort (CPUE), was deemed not significant and pruned from the model; its exclusion did not affect model skill.98 We then plotted the partial dependence of model predictions over the most important predictor variables and included a locally weighted smoothing function to aid interpretation. Finally, we used the same model structure to predict the relationships between each variable and all six studied dietary nutrients.
It is important to note that our 41 landing sites may not be representative of the whole WIO region. Our landing sites were in three of the most heavily fished nations of the WIO. Approximately 76% of the reef cells adjacent to these sites were overfished, while this is only true of 37% of reefs in the wider region. As a result, the reefs adjacent to our landing sites are likely to be less species rich and functionally diverse than other WIO coral reefs.19,99 This may drive differences in the nutrient densities of artisanal catches and will not be captured by our data.
Acknowledgments
The authors gratefully acknowledge data contributions from M. Azali, I. da Silva, M. Dzoga, C. Gough, J. Lucas, P. Musembi, T. Randrianjafimanana, R. Stein-Rostaing, O. Tiliouine, Blue Ventures, Seychelles Fishing Authority, and Wildlife Conservation Society. T. R. McClanahan was supported during this period by Feed the Future Innovation Lab in partnership with the Mississippi State University through an award from USAID (Award No. 7200AA18CA00030) and the Bloomberg Foundation’s Vibrant Oceans Initiative. A. Canta, S.J. provided assistance with the graphical abstract.
Author contributions
Conceptualization, B.P.G. and T.R.M.; Methodology, B.P.G. and T.R.M.; Software, B.P.G.; Validation, B.P.G.; Formal Analysis, B.P.G. and T.R.M.; Data Curation, B.P.G.; Writing–Original Draft, B.P.G.; Writing–Review and Editing, B.P.G. and T.R.M.; Visualization, B.P.G.; Supervision, T.R.M.
Declaration of interests
The authors declare no competing interests.
Published: March 5, 2024
Footnotes
Supplemental information can be found online at https://doi.org/10.1016/j.isci.2024.109420.
Contributor Information
Bryan P. Galligan, Email: bgalligan@jesuits.org.
Timothy R. McClanahan, Email: tmcclanahan@wcs.org.
Supplemental information
References
- 1.Teh L.S.L., Teh L.C.L., Sumaila U.R. A global estimate of the number of coral reef fishers. PLoS One. 2013;8 doi: 10.1371/journal.pone.0065397. [DOI] [PMC free article] [PubMed] [Google Scholar]
- 2.Sing Wong A., Vrontos S., Taylor M.L. An assessment of people living by coral reefs over space and time. Glob. Chang. Biol. 2022;28:7139–7153. doi: 10.1111/gcb.16391. [DOI] [PMC free article] [PubMed] [Google Scholar]
- 3.Mellin C., Hicks C.C., Fordham D.A., Golden C.D., Kjellevold M., MacNeil M.A., Maire E., Mangubhai S., Mouillot D., Nash K.L., et al. Safeguarding nutrients from coral reefs under climate change. Nat. Ecol. Evol. 2022;6:1808–1817. doi: 10.1038/s41559-022-01878-w. [DOI] [PubMed] [Google Scholar]
- 4.Eddy T.D., Lam V.W., Reygondeau G., Cisneros-Montemayor A.M., Greer K., Palomares M.L.D., Bruno J.F., Ota Y., Cheung W.W. Global decline in capacity of coral reefs to provide ecosystem services. One Earth. 2021;4:1278–1285. doi: 10.1016/j.oneear.2021.08.016. [DOI] [Google Scholar]
- 5.Robinson J.P.W., Maire E., Bodin N., Hempson T.N., Graham N.A.J., Wilson S.K., MacNeil M.A., Hicks C.C. Climate-induced increases in micronutrient availability for coral reef fisheries. One Earth. 2022;5:98–108. doi: 10.1016/j.oneear.2021.12.005. [DOI] [PMC free article] [PubMed] [Google Scholar]
- 6.Robinson J.P.W., Mills D.J., Asiedu G.A., Byrd K., Mancha Cisneros M.D.M., Cohen P.J., Fiorella K.J., Graham N.A.J., MacNeil M.A., Maire E., et al. Small pelagic fish supply abundant and affordable micronutrients to low- and middle-income countries. Nat. Food. 2022;3:1075–1084. doi: 10.1038/s43016-022-00643-3. [DOI] [PubMed] [Google Scholar]
- 7.Hicks C.C., Cohen P.J., Graham N.A.J., Nash K.L., Allison E.H., D’Lima C., Mills D.J., Roscher M., Thilsted S.H., Thorne-Lyman A.L., MacNeil M.A. Harnessing global fisheries to tackle micronutrient deficiencies. Nature. 2019;574:95–98. doi: 10.1038/s41586-019-1592-6. [DOI] [PubMed] [Google Scholar]
- 8.Maire E., Graham N.A.J., MacNeil M.A., Lam V.W.Y., Robinson J.P.W., Cheung W.W.L., Hicks C.C. Micronutrient supply from global marine fisheries under climate change and overfishing. Curr. Biol. 2021;31:4132–4138.e3. doi: 10.1016/j.cub.2021.06.067. [DOI] [PubMed] [Google Scholar]
- 9.Bennett A., Basurto X., Virdin J., Lin X., Betances S.J., Smith M.D., Allison E.H., Best B.A., Brownell K.D., Campbell L.M., et al. Recognize fish as food in policy discourse and development funding. Ambio. 2021;50:981–989. doi: 10.1007/s13280-020-01451-4. [DOI] [PMC free article] [PubMed] [Google Scholar]
- 10.Allegretti A., Hicks C.C. ‘Getting the right nutrients to those who need them most’: towards nutrition-sensitive governance of fisheries in the Global South. Rev. Fish Biol. Fish. 2023;33:561–571. doi: 10.1007/s11160-022-09743-6. [DOI] [Google Scholar]
- 11.Clapp J., Moseley W.G., Burlingame B., Termine P. The case for a six-dimensional food security framework. Food Pol. 2022;106 doi: 10.1016/j.foodpol.2021.102164. [DOI] [Google Scholar]
- 12.McClanahan T.R. Multicriteria estimate of coral reef fishery sustainability. Fish Fish. 2018;19:807–820. doi: 10.1111/faf.12293. [DOI] [Google Scholar]
- 13.Morais R.A., Connolly S.R., Bellwood D.R. Human exploitation shapes productivity–biomass relationships on coral reefs. Glob. Chang. Biol. 2020;26:1295–1305. doi: 10.1111/gcb.14941. [DOI] [PubMed] [Google Scholar]
- 14.Morais R.A., Smallhorn-West P., Connolly S.R., Ngaluafe P.F., Malimali S., Halafihi T., Bellwood D.R. Sustained productivity and the persistence of coral reef fisheries. Nat. Sustain. 2023;6:1199–1209. doi: 10.1038/s41893-023-01137-1. [DOI] [Google Scholar]
- 15.McClanahan T.R., Azali M.K. Improving sustainable yield estimates for tropical reef fisheries. Fish Fish. 2020;21:683–699. doi: 10.1111/faf.12454. [DOI] [Google Scholar]
- 16.Zamborain-Mason J., Cinner J.E., MacNeil M.A., Graham N.A.J., Hoey A.S., Beger M., Brooks A.J., Booth D.J., Edgar G.J., Feary D.A., et al. Sustainable reference points for multispecies coral reef fisheries. Nat. Commun. 2023;14:5368. doi: 10.1038/s41467-023-41040-z. [DOI] [PMC free article] [PubMed] [Google Scholar]
- 17.Thorson J., Cope J., Branch T., Jensen O. Spawning biomass reference points for exploited marine fishes, incorporating taxonomic and body size information. Can. J. Fish. Aquat. Sci. 2012;69:1556–1568. doi: 10.1139/f2012-077. [DOI] [Google Scholar]
- 18.MacNeil M.A., Graham N.A.J., Cinner J.E., Wilson S.K., Williams I.D., Maina J., Newman S., Friedlander A.M., Jupiter S., Polunin N.V.C., McClanahan T.R. Recovery potential of the world’s coral reef fishes. Nature. 2015;520:341–344. doi: 10.1038/nature14358. [DOI] [PubMed] [Google Scholar]
- 19.McClanahan T.R. Fisheries yields and species declines in coral reefs. Environ. Res. Lett. 2022;17 doi: 10.1088/1748-9326/ac5bb4. [DOI] [Google Scholar]
- 20.McClanahan T.R., Graham N.A.J., MacNeil M.A., Cinner J.E. Biomass-based targets and the management of multispecies coral reef fisheries. Conserv. Biol. 2015;29:409–417. doi: 10.1111/cobi.12430. [DOI] [PubMed] [Google Scholar]
- 21.Bruce T., Meirelles P.M., Garcia G., Paranhos R., Rezende C.E., de Moura R.L., Filho R.F., Coni E.O., Vasconcelos A.T., Amado Filho G., Hatay M. Abrolhos Bank reef health evaluated by means of water quality, microbial diversity, benthic cover, and fish biomass data. PLoS One. 2012;7 doi: 10.1371/journal.pone.0036687. [DOI] [PMC free article] [PubMed] [Google Scholar]
- 22.Duffy J.E., Lefcheck J.S., Stuart-Smith R.D., Navarrete S.A., Edgar G.J. Biodiversity enhances reef fish biomass and resistance to climate change. Proc. Natl. Acad. Sci. 2016;113:6230–6235. doi: 10.1073/pnas.1524465113. [DOI] [PMC free article] [PubMed] [Google Scholar]
- 23.McClanahan T.R. Marine reserve more sustainable than gear restriction in maintaining long-term coral reef fisheries yields. Mar. Policy. 2021;128 doi: 10.1016/j.marpol.2021.104478. [DOI] [Google Scholar]
- 24.McClanahan T.R., Friedlander A.M., Wantiez L., Graham N.J., Bruggemann J.H., Chabanet P., Oddenyo R.M. Best-practice fisheries management associated with reduced stocks and changes in life histories. Fish Fish. 2022;23:422–444. doi: 10.1111/faf.12625. [DOI] [Google Scholar]
- 25.FAO. Duke U., WorldFish . FAO; Duke University; WorldFish; 2023. Illuminating Hidden Harvests: The Contributions of Small-Scale Fisheries to Sustainable Development. [Google Scholar]
- 26.Kawarazuka N., Béné C. The potential role of small fish species in improving micronutrient deficiencies in developing countries: building evidence. Public Health Nutr. 2011;14:1927–1938. doi: 10.1017/S1368980011000814. [DOI] [PubMed] [Google Scholar]
- 27.Bavinck M., Ahern M., Hapke H.M., Johnson D.S., Kjellevold M., Kolding J., Overå R., Schut T., Franz N., editors. Small fish for food security and nutrition (FAO) 2023. [Google Scholar]
- 28.Heilpern S.A., DeFries R., Fiorella K., Flecker A., Sethi S.A., Uriarte M., Naeem S. Declining diversity of wild-caught species puts dietary nutrient supplies at risk. Sci. Adv. 2021;7 doi: 10.1126/sciadv.abf9967. [DOI] [PMC free article] [PubMed] [Google Scholar]
- 29.Bernhardt J.R., O’Connor M.I. Aquatic biodiversity enhances multiple nutritional benefits to humans. Proc. Natl. Acad. Sci. 2021;118 doi: 10.1073/pnas.1917487118. [DOI] [PMC free article] [PubMed] [Google Scholar]
- 30.Robinson J.P.W., Nash K.L., Blanchard J.L., Jacobsen N.S., Maire E., Graham N.A.J., MacNeil M.A., Zamborain-Mason J., Allison E.H., Hicks C.C. Managing fisheries for maximum nutrient yield. Fish Fish. 2022;23:800–811. doi: 10.1111/faf.12649. [DOI] [PMC free article] [PubMed] [Google Scholar]
- 31.Galligan SJ B.P., McClanahan T.R., Humphries A.T. Nutrient capture and sustainable yield maximized by a gear modification in artisanal fishing traps. Environ. Res. Lett. 2022;17 doi: 10.1088/1748-9326/aca77e. [DOI] [Google Scholar]
- 32.Golden C.D., Koehn J.Z., Shepon A., Passarelli S., Free C.M., Viana D.F., Matthey H., Eurich J.G., Gephart J.A., Fluet-Chouinard E., et al. Aquatic foods to nourish nations. Nature. 2021;598:315–320. doi: 10.1038/s41586-021-03917-1. [DOI] [PMC free article] [PubMed] [Google Scholar]
- 33.Kearney B., Hilborn R. Solutions to world-wide fisheries problems are mostly local or regional. ICES J. Mar. Sci. 2022;79:997–1004. doi: 10.1093/icesjms/fsac033. [DOI] [Google Scholar]
- 34.FAO. IFAD. UNICEF. WFP. WHO . FAO; 2023. The State of Food Security and Nutrition in the World 2023. Urbanization, Agrifood Systems Transformation, and Healthy Diets across the Rural-Urban Continuum. [Google Scholar]
- 35.Crona B.I., Wassénius E., Jonell M., Koehn J.Z., Short R., Tigchelaar M., Daw T.M., Golden C.D., Gephart J.A., Allison E.H., et al. Four ways blue foods can help achieve food system ambitions across nations. Nature. 2023;616:104–112. doi: 10.1038/s41586-023-05737-x. [DOI] [PMC free article] [PubMed] [Google Scholar]
- 36.Taylor S.F.W., Roberts M.J., Milligan B., Ncwadi R. Measurement and implications of marine food security in the Western Indian Ocean: an impending crisis? Food Secur. 2019;11:1395–1415. doi: 10.1007/s12571-019-00971-6. [DOI] [Google Scholar]
- 37.Darling E.S. Assessing the effect of marine reserves on household food security in Kenyan coral reef fishing communities. PLoS One. 2014;9 doi: 10.1371/journal.pone.0113614. [DOI] [PMC free article] [PubMed] [Google Scholar]
- 38.Cartmill M.K., Blackmore I., Sarange C., Mbeyu R., Cheupe C., Cheupe J., Kamau-Mbuthia E., Iannotti L., Wamukota A., Humphries A., Lesorogol C. Fish and complementary feeding practices for young children: Qualitative research findings from coastal Kenya. PLoS One. 2022;17 doi: 10.1371/journal.pone.0265310. [DOI] [PMC free article] [PubMed] [Google Scholar]
- 39.Kamau-Mbuthia E., Lesorogol C., Wamukota A., Humphries A., Sarange C., Mbeyu R., Cheupe C., Cheupe J., Nunez-Garcia A., Blackmore I., Iannotti L. Sustainable aquatic food systems: Multisectoral analysis of determinants of child nutrition in coastal Kenya. Front. Sustain. Food Syst. 2023;7 doi: 10.3389/fsufs.2023.1091339. [DOI] [Google Scholar]
- 40.Bonham M.P., Duffy E.M., Robson P.J., Wallace J.M., Myers G.J., Davidson P.W., Clarkson T.W., Shamlaye C.F., Strain J.J., Livingstone M.B.E. Contribution of fish to intakes of micronutrients important for fetal development: a dietary survey of pregnant women in the Republic of Seychelles. Public Health Nutr. 2009;12:1312–1320. doi: 10.1017/S136898000800387X. [DOI] [PMC free article] [PubMed] [Google Scholar]
- 41.Mayén A.L., Bovet P., Marti-Soler H., Viswanathan B., Gedeon J., Paccaud F., Marques-Vidal P., Stringhini S. Socioeconomic differences in dietary patterns in an East African country: Evidence from the Republic of Seychelles. PLoS One. 2016;11 doi: 10.1371/journal.pone.0155617. [DOI] [PMC free article] [PubMed] [Google Scholar]
- 42.McClanahan T.R., D’Agata S., Graham N.A.J., Kodia M.A., Maina J.M. Multivariate environment-fish biomass model informs sustainability and lost income in Indian Ocean coral reefs. Mar. Policy. 2023;152 doi: 10.1016/j.marpol.2023.105590. [DOI] [Google Scholar]
- 43.Institute of Medicine (IOM) National Academies Press; 2006. Dietary Reference Intakes: The Essential Guide to Nutrient Requirements. [Google Scholar]
- 44.Institute of Medicine (IOM) National Academies Press; 2011. Dietary Reference Intakes for Calcium and Vitamin D. [PubMed] [Google Scholar]
- 45.Cisneros-Montemayor A.M., Pauly D., Weatherdon L.V., Ota Y. A global estimate of seafood consumption by coastal Indigenous peoples. PLoS One. 2016;11 doi: 10.1371/journal.pone.0166681. [DOI] [PMC free article] [PubMed] [Google Scholar]
- 46.Fouilleux E., Bricas N., Alpha A. ‘Feeding 9 billion people’: global food security debates and the productionist trap. J. Eur. Public Policy. 2017;24:1658–1677. doi: 10.1080/13501763.2017.1334084. [DOI] [Google Scholar]
- 47.Robinson J.P.W., Darling E.S., Maire E., Hamilton M., Hicks C.C., Jupiter S.D., Aaron MacNeil M., Mangubhai S., McClanahan T., Nand Y., Graham N.A.J. Trophic distribution of nutrient production in coral reef fisheries. Proc. Biol. Sci. 2023;290 doi: 10.1098/rspb.2023.1601. [DOI] [PMC free article] [PubMed] [Google Scholar]
- 48.Mills D.J., Simmance F., Byrd K., Ahern M., Cohen P., D’Agostino E., Fiorella K., Garrido-Gamarro E., Gondwe E., Hicks C., et al. Illuminating hidden harvests: The contributions of small-scale fisheries to sustainable development. FAO; Duke University; WorldFish; 2023. Contributions of small-scale fisheries to food security and nutrition; pp. 145–174. [Google Scholar]
- 49.Galligan B.P., McClanahan T.R. Nutrition contributions of coral reef fisheries not enhanced by capture of small fish. Ocean Coast Manag. 2024;249 doi: 10.1016/j.ocecoaman.2023.107011. [DOI] [Google Scholar]
- 50.Hicks C.C., McClanahan T.R. Assessing gear modifications needed to optimize yields in a heavily exploited, multi-species, seagrass and coral reef fishery. PLoS One. 2012;7 doi: 10.1371/journal.pone.0036022. [DOI] [PMC free article] [PubMed] [Google Scholar]
- 51.Ault J.S., Smith S.G., Bohnsack J.A., Luo J., Stevens M.H., DiNardo G.T., Johnson M.W., Bryan D.R. Length-based risk analysis for assessing sustainability of data-limited tropical reef fisheries. ICES J. Mar. Sci. 2019;76:165–180. doi: 10.1093/icesjms/fsy123. [DOI] [Google Scholar]
- 52.Jones B.L., Unsworth R.K.F. The perverse fisheries consequences of mosquito net malaria prophylaxis in East Africa. Ambio. 2020;49:1257–1267. doi: 10.1007/s13280-019-01280-0. [DOI] [PMC free article] [PubMed] [Google Scholar]
- 53.McClanahan T.R., Graham N.A.J., Calnan J.M., MacNeil M.A. Toward pristine biomass: Reef fish recovery in coral reef marine protected areas in Kenya. Ecol. Appl. 2007;17:1055–1067. doi: 10.1890/06-1450. [DOI] [PubMed] [Google Scholar]
- 54.Stuart-Smith R.D., Brown C.J., Ceccarelli D.M., Edgar G.J. Ecosystem restructuring along the Great Barrier Reef following mass coral bleaching. Nature. 2018;560:92–96. doi: 10.1038/s41586-018-0359-9. [DOI] [PubMed] [Google Scholar]
- 55.Bellwood D.R., Hoey A.S., Ackerman J.L., Depczynski M. Coral bleaching, reef fish community phase shifts and the resilience of coral reefs. Glob. Chang. Biol. 2006;12:1587–1594. doi: 10.1111/j.1365-2486.2006.01204.x. [DOI] [Google Scholar]
- 56.Bellwood D.R., Baird A.H., Depczynski M., González-Cabello A., Hoey A.S., Lefèvre C.D., Tanner J.K. Coral recovery may not herald the return of fishes on damaged coral reefs. Oecologia. 2012;170:567–573. doi: 10.1007/s00442-012-2306-z. [DOI] [PubMed] [Google Scholar]
- 57.Graham N.A.J., Wilson S.K., Jennings S., Polunin N.V.C., Robinson J., Bijoux J.P., Daw T.M. Lag effects in the impacts of mass coral bleaching on coral reef fish, fisheries, and ecosystems. Conserv. Biol. 2007;21:1291–1300. doi: 10.1111/j.1523-1739.2007.00754.x. [DOI] [PubMed] [Google Scholar]
- 58.Robinson J.P.W., Wilson S.K., Jennings S., Graham N.A.J. Thermal stress induces persistently altered coral reef fish assemblages. Glob. Chang. Biol. 2019;25:2739–2750. doi: 10.1111/gcb.14704. [DOI] [PubMed] [Google Scholar]
- 59.Robinson J.P.W., Benkwitt C.E., Maire E., Morais R., Schiettekatte N.M.D., Skinner C., Brandl S.J. Quantifying energy and nutrient fluxes in coral reef food webs. Trends Ecol. Evol. 2023 doi: 10.1016/j.tree.2023.11.013. [DOI] [PubMed] [Google Scholar]
- 60.McClanahan T.R., Abunge C.A. Demographic variability and scales of agreement and disagreement over resource management restrictions. Ecol. Soc. 2018;23:33. doi: 10.5751/ES-10544-230433. [DOI] [Google Scholar]
- 61.Froese R., Pauly D. 2023. FishBase. [Google Scholar]
- 62.Pauly D., Zeller D., Palomares M.L.D. 2020. Sea Around Us Concepts, Design, and Data. [Google Scholar]
- 63.Dzoga M., Simatele D., Munga C. Characterisation of artisanal catches in selected fishing areas of the Lower Tana Delta and Malindi-Ungwana Bay, Kenya. West. West. Ind. Oc. J. Mar. Sci. 2020;19:45–53. doi: 10.4314/wiojms.v19i1.4. [DOI] [Google Scholar]
- 64.Musembi P., Fulanda B., Kairo J., Githaiga M. Species composition, abundance, and fishing methods of small-scale fisheries in the seagrass meadows of Gazi Bay, Kenya. J. Indian Ocean Reg. 2019;15:139–156. doi: 10.1080/19480881.2019.1603608. [DOI] [Google Scholar]
- 65.WCS Catch Monitoring Data (Wildlife Conservation Society)
- 66.Blue Ventures Catch Monitoring Data
- 67.Tiliouine O. 2019. An Investigation into Fisheries Trends and a Critical Analysis of Fisheries Management within the Bay of Ranobe, Madagascar. [Google Scholar]
- 68.da Silva I.M. 2015. Fisheries Co-management: Ecological and Social Impacts. A Case Study of Northern Mozambique. [Google Scholar]
- 69.Biais G., Taquet M. Repères Océans; 1992. La pêche locale aux abords de la Réunion. [Google Scholar]
- 70.SFA Unpublished Data (Seychelles Fishing Authority)
- 71.TMLF . Tanzania Ministry of Livestock and Fisheries; 2020. The Annual Fisheries Statistics Report. [Google Scholar]
- 72.UNDESA . United Nations, Department of Economic and Social Affairs, Population Division); 2022. World Population Prospects: The 2022 Revision. [Google Scholar]
- 73.Assis J., Tyberghein L., Bosch S., Verbruggen H., Serrão E.A., De Clerck O., Tittensor D. Bio-ORACLE v2.0: Extending marine data layers for bioclimatic modelling. Glob. Ecol. Biogeogr. 2018;27:277–284. doi: 10.1111/geb.12693. [DOI] [Google Scholar]
- 74.NOAA . 2018. NOAA Coral Reef Watch: Daily Global 5km Satellite Sea Surface Temperature Product. [Google Scholar]
- 75.Maina J., McClanahan T.R., Venus V., Ateweberhan M., Madin J. Global gradients of coral exposure to environmental stresses and implications for local management. PLoS One. 2011;6 doi: 10.1371/journal.pone.0023064. [DOI] [PMC free article] [PubMed] [Google Scholar]
- 76.Yeager L.A., Marchand P., Gill D.A., Baum J.K., McPherson J.M. Marine socio-environmental covariates: queryable global layers of environmental and anthropogenic variables for marine ecosystem studies. Ecology. 2017;98:1976. doi: 10.1002/ecy.1884. [DOI] [PubMed] [Google Scholar]
- 77.Maire E., Cinner J., Velez L., Huchery C., Mora C., Dagata S., Vigliola L., Wantiez L., Kulbicki M., Mouillot D. How accessible are coral reefs to people? A global assessment based on travel time. Ecol. Lett. 2016;19:351–360. doi: 10.1111/ele.12577. [DOI] [PubMed] [Google Scholar]
- 78.Boettiger C., Lang D.T., Wainwright P.C. rfishbase: exploring, manipulating and visualizing FishBase data from R. J. Fish. Biol. 2012;81:2030–2039. doi: 10.1111/j.1095-8649.2012.03464.x. [DOI] [PubMed] [Google Scholar]
- 79.R Core Team . R Foundation for Statistical Computing; 2022. R: A Language and Environment for Statistical Computing. [Google Scholar]
- 80.Thorson J.T., Maureaud A.A., Frelat R., Mérigot B., Bigman J.S., Friedman S.T., Palomares M.L.D., Pinsky M.L., Price S.A., Wainwright P. Identifying direct and indirect associations among traits by merging phylogenetic comparative methods and structural equation models. Methods Ecol. Evol. 2023;14:1259–1275. doi: 10.1111/2041-210X.14076. [DOI] [Google Scholar]
- 81.Zeller D., Palomares M.L.D., Tavakolie A., Ang M., Belhabib D., Cheung W.W.L., Lam V.W.Y., Sy E., Tsui G., Zylich K., Pauly D. Still catching attention: Sea Around Us reconstructed global catch data, their spatial expression and public accessibility. Mar. Policy. 2016;70:145–152. doi: 10.1016/j.marpol.2016.04.046. [DOI] [Google Scholar]
- 82.Le Manach F., Abunge C.A., McClanahan T.R., Pauly D. In: Fisheries catch reconstructions in the Western Indian Ocean, 1950-2010 Fisheries Center Research Reports. Le Manach F., Pauly D., editors. Fisheries Center, University of British Columbia); 2015. Tentative reconstruction of Kenya’s marine fisheries catch, 1950-2010; pp. 37–51. [Google Scholar]
- 83.McAlpine A., Zeller D. In: Updating to 2018 the 1950-2010 Marine Catch Reconstructions of the Sea Around Us: Part I – Africa, Antarctica, Europe, and the North Atlantic, B. Derrick. Khalfallah M., Relano V., Zeller D., Pauly D., editors. Fisheries Center, University of British Columbia); 2020. Kenya: Updated catch reconstruction for 1950-2018; pp. 46–59. [Google Scholar]
- 84.Le Manach F., Gough C., Humber F., Harper S., Zeller D. In: Fisheries catch reconstructions: Islands, Part II Fisheries Center Research Reports. Harper S., Zeller D., editors. Fisheries Center, University of British Columbia); 2011. Reconstruction of total marine fisheries catches for Madagascar (1950-2008) pp. 21–37. [Google Scholar]
- 85.White R., Noël S.-L., Christ H., Relano V., Sicnawa F., Tsui G. In: Updating to 2018 the 1950-2010 marine catch reconstructions of the Sea Around Us: Part I - Africa, Antarctica, Europe, and the North Atlantic. Fisheries Center Research Reports. Derrick B., Khalfallah M., Relano V., Zeller D., Pauly D., editors. Fisheries Center, University of British Columbia); 2020. Madagascar and smaller islands in the Western Indian Ocean: Updated catch reconstructions for 2011-2018; pp. 81–99. [Google Scholar]
- 86.White R., Hood L., Derrick B., Relano V., Zeller D. In: Updating to 2018 the 1950-2010 marine catch reconstructions of the Sea Around Us. Part II: The Americas and Asia-Pacific Fisheries Center Research Reports. Derrick B., Khalfallah M., Relano V., Zeller D., Pauly D., editors. Fisheries Center, University of British Columbia); 2020. South Asia and Indian Ocean island catch updates to 2018; pp. 365–382. [Google Scholar]
- 87.Vianna G.M.S. In: Updating to 2018 the 1950-2010 marine catch reconstructions of the Sea Around Us: Part I – Africa, Antarctica, Europe, and the North Atlantic Fisheries Center Research Reports. Derrick B., Khalfallah M., Relano V., Zeller D., Pauly D., editors. Fisheries Center, University of British Columbia); 2020. Mozambique: Updated catch reconstruction for 2011–2018; pp. 65–68. [Google Scholar]
- 88.Christ H.J., White R., Hood L., Vianna G.M.S., Zeller D. A baseline for the blue economy: Catch and effort history in the Republic of Seychelles’ domestic fisheries. Front. Mar. Sci. 2020;7:269. doi: 10.3389/fmars.2020.00269. [DOI] [Google Scholar]
- 89.White R., Page E., Noël S.-L. In: Updating to 2018 the 1950-2010 marine catch reconstructions of the Sea Around Us: Part I – Africa, Antarctica, Europe, and the North Atlantic Fisheries Center Research Reports. Derrick B., Khalfallah M., Relano V., Zeller D., Pauly D., editors. Fisheries Center, University of British Columbia); 2020. Tanzania: Updated catch reconstruction for 2011-2018; pp. 77–80. [Google Scholar]
- 90.Froese R. Keep it simple: three indicators to deal with overfishing. Fish Fish. 2004;5:86–91. doi: 10.1111/j.1467-2979.2004.00144.x. [DOI] [Google Scholar]
- 91.Medeiros-Leal W., Santos R., Peixoto U.I., Casal-Ribeiro M., Novoa-Pabon A., Sigler M.F., Pinho M. Performance of length-based assessment in predicting small-scale multispecies fishery sustainability. Rev. Fish Biol. Fish. 2023;33:819–852. doi: 10.1007/s11160-023-09764-9. [DOI] [Google Scholar]
- 92.Ricard D., Minto C., Jensen O.P., Baum J.K. Examining the knowledge base and status of commercially exploited marine species with the RAM Legacy Stock Assessment Database. Fish Fish. 2012;13:380–398. doi: 10.1111/j.1467-2979.2011.00435.x. [DOI] [Google Scholar]
- 93.Beverton R.J.H. Patterns of reproductive strategy parameters in some marine teleost fishes. J. Fish. Biol. 1992;41:137–160. doi: 10.1111/j.1095-8649.1992.tb03875.x. [DOI] [Google Scholar]
- 94.Kuhn M., Johnson K. Springer; 2013. Applied Predictive Modeling. [Google Scholar]
- 95.Fox E.W., Hill R.A., Leibowitz S.G., Olsen A.R., Thornbrugh D.J., Weber M.H. Assessing the accuracy and stability of variable selection methods for random forest modeling in ecology. Environ. Monit. Assess. 2017;189:316. doi: 10.1007/s10661-017-6025-0. [DOI] [PMC free article] [PubMed] [Google Scholar]
- 96.Myers L., Sirois M.J. In: Encyclopedia of Statistical Sciences. Kotz S., Read C.B., Balakrishnan N., Vidakovic B., Johnson N.L., editors. John Wiley & Sons; 2006. Spearman correlation coefficients, differences between; p. 12. [Google Scholar]
- 97.Breiman L. Random forests. Mach. Learn. 2001;45:5–32. doi: 10.1023/A:1010933404324. [DOI] [Google Scholar]
- 98.Greenwell B.M., Boehmke B.C., McCarthy A.J. A simple and effective model-based variable importance measure. arXiv. 2018 doi: 10.48550/arXiv.1805.04755. Preprint at. [DOI] [Google Scholar]
- 99.Cáceres I., Ibarra-García E.C., Ortiz M., Ayón-Parente M., Rodríguez-Zaragoza F.A. Effect of fisheries and benthic habitat on the ecological and functional diversity of fish at the Cayos Cochinos coral reefs (Honduras) Mar. Biodivers. 2020;50:9. doi: 10.1007/s12526-019-01024-z. [DOI] [Google Scholar]
Associated Data
This section collects any data citations, data availability statements, or supplementary materials included in this article.
Supplementary Materials
Data Availability Statement
-
•
This paper analyzes existing, publicly available data. These datasets and DOIs are listed in the key resources table. Some of the catch monitoring data reported in this study cannot be deposited in a public repository because access to it is governed by the original authors and/or organizations. To request access, contact the original authors via email. In addition, processed datasets derived from these data have been deposited at Zenodo and are publicly available as of the date of publication. DOIs are listed in the key resources table.
-
•
All original code has been deposited at Zenodo and is publicly available as of the date of publication. The DOI is listed in the key resources table.
-
•
Any additional information required to reanalyze the data reported in this paper is available from the lead contact upon request.