Abstract
π–π coupling as a common interaction plays a key role in emissions, transport and mechanical properties of organic materials. However, the precise control of π–π coupling is still challenging owing to the possible interference from other intermolecular interactions in the aggregated state, usually resulting in uncontrollable emission properties. Herein, with the rational construction of intramolecular dimer models and crystal engineering, π–π coupling can be subtly modulated by conformation variation with balanced π–π and π–solvent interactions and visualized by green-to-blue emission switching. Moreover, it can rapidly respond to temperature, pressure and mechanical force, affording a facile way to modulate π–π coupling in situ. This work contributes to a deeper understanding of the internal mechanism of molecular motions in aggregated states.
In situ regulation of π–π coupling was realized with the combination of rigid intramolecular dimer models and external stimuli, mainly due to the balance of π–π and solvent–π interactions. The results establish the quantitative relationship between emission properties and π–π distances.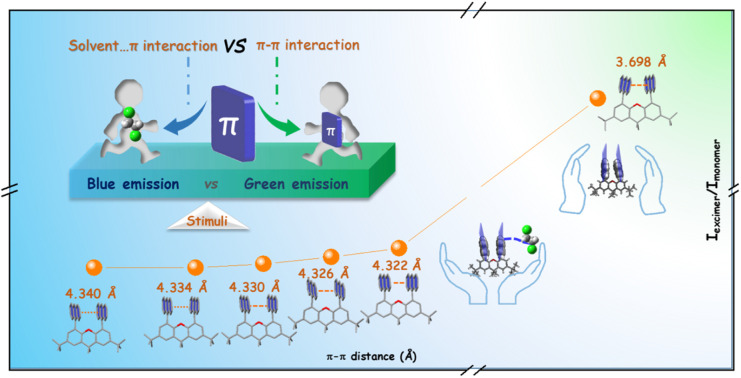
Introduction
π–π coupling of conjugated systems has attracted wide attention and plays a crucial role in emissions, transport and mechanical functions of organic opto-electronic materials.1–14 However, to date, the precise regulation of π–π coupling in aggregated states is still a big challenge, mainly owing to the multiple intermolecular interactions of organic molecules,15–24 including electrostatic interactions, exciton resonance, charge–transfer interactions, dispersion forces, and overlap repulsion. Compared to molecular aggregates with complex packing and intermolecular interactions, dimers can be considered as a simplified model to understand the internal mechanism of π–π coupling.25–30 Accordingly, excimer emission as a sensitive response toward π–π coupling of dimers has been investigated since 1954.31,32 The changes from monomer to excimer emission, such as the red-shifted emission band and increased photoluminescence lifetimes, are efficient approaches to investigate the relationship between luminescence property and π–π coupling.33–35 Although many efficient strategies have been proposed to modulate π–π coupling by electronic and steric effect, it is still hard to precisely control the π–π distances of naturally formed excimers in aggregated states due to uncontrollable intermolecular interactions.36–42 Alternatively, intramolecular dimer models fixed by covalent bonds have been explored; their π–π distances can be mainly determined by “scaffold” moieties, which are covalently linked to two π systems to control their arrangement, and they exhibit little interference to their electronic properties. For instance, in 1,3-diphenylpropane and 1,3,5-triphenylpentane, phenyl moieties are arranged in parallel by the zigzag conformation of alkyl moieties, and their distances can be determined from the length of middle alkyl units.43–45 Recently, 9,9-dimethylxanthene has been employed as a scaffold with a rigid conjugated system and suitable reaction sites. Electronic donor–acceptor pairs were employed as luminogens to form through-space charge transfer and achieve thermally activated delayed fluorescence (TADF) properties.46 With pyrene moieties as the luminescence source, intramolecular excimer emission can be achieved.47 However, until now, related studies have mainly focused on the opto-electronic properties of single molecules with accurate molecular design; few studies concerning the aggregated structures of these dimer models have been reported. It usually results in a big gap between molecular structures and the final opto-electronic performance. The modulation of aggregated structures with efficient methods and deep understanding of the internal mechanism of π–π coupling are essential.
The organic solvent is a key factor in crystal growth and plays a crucial role in the modulation of aggregated structures.48,49 In some cases, solvents can be wrapped into single crystals by hydrogen bonding and electrostatic interactions, to subtly adjust π–π distances and corresponding emission properties.50,51 Moreover, the excimer emission is sensitive to the environment, including pressure, temperature, and solvents, resulting in the stimuli-responsive property. For instance, π–π interactions between anthracene moieties can be tuned through a solvent-fuming process, demonstrating the switching of emission colors.37 Thus, these external stimuli can be employed as efficient methods to adjust excimer formation and π–π interactions.52–55 Recently, room temperature phosphorescence (RTP) materials,56,57 mechanoluminescence (ML) and mechanochromic (MC) materials58–63 have also been reported with high dependence on π–π interactions and demonstrate stimuli–responsive properties. However, the quantitative relationship between π–π interactions and emission properties is still unclear.
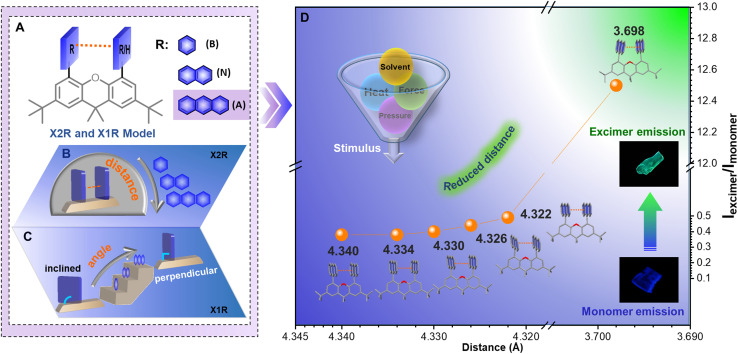
Prompted by these considerations, intramolecular dimer models (X2R) were established using 9,9-dimethylxanthene (X) as the scaffold. With the covalent linkage of benzene (B), naphthalene (N), or anthracene (A) as the π-system, fixed face-to-face stacked geometry can be formed (Fig. 1A, B and Scheme S1†). Accordingly, monomer models (X1R) with one aromatic ring fixed on the C4-position of xanthene were also synthesized as a reference (Fig. 1C). With the increasing size of the aromatic moiety, increased π–π interactions resulted in the excimer emission of X2A in the aggregated state, which can be rationally modulated with the aid of organic solvents and external stimuli. Owing to the competition of solvent–π and π–π interactions under different conditions, controllable rotations and swings of two anthracene moieties can be detected by in situ crystal analysis. This afforded an efficient approach to precisely regulate the π–π distance from 4.340 Å to 3.698 Å in situ, with continuous regulation of emission colors (Fig. 1D). A quantitative relationship between π–π interactions and emission properties can be built, affording a deep understanding of π–π coupling with excimer emission in aggregated states.
Fig. 1. Molecular design of intramolecular dimer model and in situ crystal structures under various external stimuli. (A) Molecular structures of rigid intramolecular dimer (X2R) models with R group varying from benzene (B), naphthalene (N) and anthracene (A), and the corresponding monomer model (X1R). (B) Decreased distances of R moieties from benzene to anthracene. (C) Monomer (X1R) model with only one R substituent and angles between 9,9-dimethylxanthene and R moieties increased from benzene to anthracene. (D) Precise adjustment of π–π distances of X2A crystals from 4.340 Å to 3.698 Å with emission colors changing from blue to green.
Results and discussion
X1R and X2R derivatives were conveniently synthesized (Scheme S2†) and characterized by 1H NMR and 13C NMR spectroscopy, mass spectrometry and elemental analysis (Fig. S1–S12†). For dimer (X2R) and monomer (X1R) models, the possible electronic effects of 9,9-dimethylxanthane (X) on these aromatics (R) have been illustrated by their absorption and emission spectra. When aromatic rings (R) are benzene (B) and naphthalene (N), X1R and X2R models exhibited slightly red-shifted absorption spectra than those of aromatic rings.
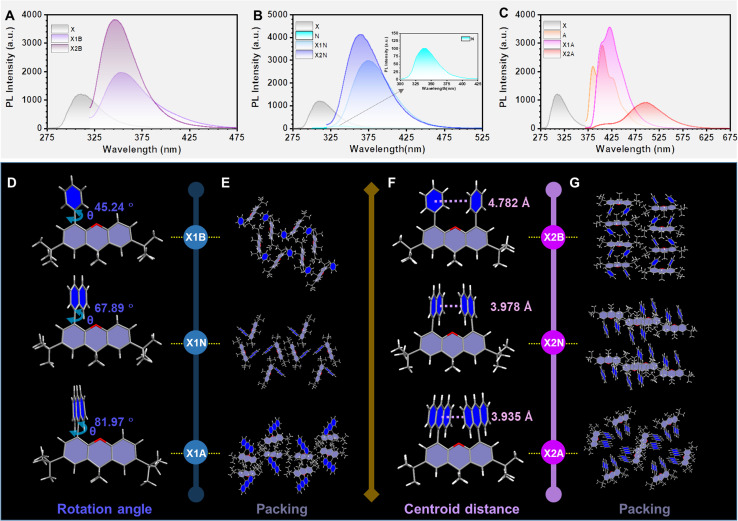
However, the absorption spectra of X1A and X2A with anthryl moieties (A) were almost the same as that of anthracene, indicating that there is nearly no conjugated effect between 9,9-dimethylxanthane and anthryl (Fig. S13†). It can be explained by corresponding molecular configurations in single crystals, while dihedral angles between aromatic moieties as R units and the 9,9-dimethylxanthane moiety in X1R models increased from 45.24° to 81.97° with R changing from phenyl to anthryl (Fig. 2D). The increased dihedral angles were mainly due to the increased steric effect between aromatic rings and the scaffold. Similar phenomena can also be observed in X2R models (Fig. S14†), further confirming the ignorable electronic effect of 9,9-dimethylxanthane on the anthryl unit. Thus, X2R models can be considered as preferred intramolecular dimers to investigate interactions between aromatic moieties without the interference of electronic effects from the covalent scaffold. This can be further confirmed by the separated photoluminescence (PL) spectra of 9,9-dimethylxanthane and R moieties (Fig. 2).
Fig. 2. Photophysical properties and crystal structures of X1R and X2R compounds. (A) Photoluminescence spectra of 9,9-dimethylxanthane, X1B and X2B in THF solution (10 μM) at room temperature. (B) PL spectra of 9,9-dimethylxanthane, X1N, and X2N in THF solution (10 μM) at room temperature. (C) PL spectra of 9,9-dimethylxanthane, anthracene, X1A and X2A in THF solution (10 μM) at room temperature. (D) Molecular geometry of X1B, X1N and X1A in single crystals with dihedral angles (θ) between R moieties and 9,9-dimethylxanthane scaffold. (E) Molecular packing modes in X1B, X1N and X1A crystals. (F) Molecular geometry of X2B, X2N and X2A in single crystals with centroid distances between two R moieties. (G) Molecular packing modes in X2B, X2N and X2A crystals.
The emission spectra of dimer models (X2B and X2N) in dilute THF solution were similar to those of monomer models (X1B and X1N), indicating the absence of intramolecular π–π interactions (Fig. 2A and B). However, when the R group was changed to anthracene, X2A exhibited bright green emission with the maximum wavelength located at 500 nm, red-shifted about 80 nm compared to those of anthracene (427 nm) and X1A (421 nm) (Fig. 2C), which should be ascribed to the excimer emission. The corresponding photoluminescence lifetime and quantum yield were measured to be 18.29 ns and 24.91%, respectively, which showed little difference in various solutions with different polarities (Fig. S15 and S16†). Furthermore, the emission wavelength demonstrated nearly no change with increasing concentrations from 1 × 10⁻⁶ mol L−1 to 1 × 10⁻² mol L−1 in THF solution, while obvious red-shifted emissions can be observed in X1A solutions under same conditions (Fig. S17 and S18†). It is confirmed that the excimer emission of X2A is derived from the intramolecular dimer, not intermolecular interactions.
Once these molecules were aggregated into crystals, the X2A crystal (475 nm) showed an obvious red-shift (about 21 nm) compared to the X1A crystal (454 nm) (Fig. S19 and Table S1†). Since there were nearly no intermolecular π–π interactions in the X2A crystal, the red-shifted emission of the X2A crystal was derived from the intramolecular π–π coupling of anthryl moieties, which can be proved by X-ray single crystal structural analyses. As shown in Fig. 2F, centroid distances between two aromatic rings in the X2R model decreased from 4.782 Å (X2B) to 3.978 Å (X2N), then to 3.935 Å (X2A) with enlarged sizes of conjugated planes from benzene to anthracene. Moreover, the photoluminescence quantum yield (PLQY) of the X2A crystal reached ∼100%, which was mainly due to the almost orthometric arrangement of X2A molecules (Fig. 2E, G and S20–S25†). This can diminish the possible π–π quenching in the aggregated state and suppress molecular motions from multiple C–H⋯π interactions, contributing to the high efficiency of excimer emission of anthryl moieties by the X2R model (Tables S2 and S3†).
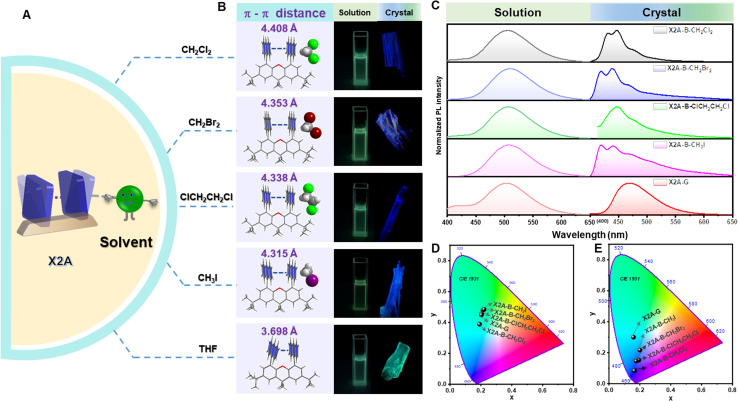
Considering the sensitivity of excimer emission to the environment, some external forces are employed. First, various solvents were incorporated for crystal growth (Fig. 3A). Some single crystals with blue emission (X2A-B), not the green one (X2A-G) as mentioned above, were obtained from dichloromethane (CH2Cl2), dibromomethane (CH2Br2), 1,2-dichloroethane (ClCH2CH2Cl) and methyl iodide (CH3I) solutions (Fig. 3B). The photoluminescence (PL) spectra of X2A-B crystals displayed two dominant emission peaks at around 420 nm and 440 nm and located in the blue emission region in the CIE 1931 chromaticity coordinate (Fig. 3C and E). Accordingly, the photoluminescence lifetimes of X2A-B crystals decreased to 13.18 ns for X2A-B-CH2Cl2, 2.77 ns for X2A-B-CH2Br2, 12.24 ns for X2A-B-ClCH2CH2Cl, and 3.44 ns for X2A-B-CH3I, compared to that of the X2A-G crystal (48.05 ns) (Fig. S26†). Additionally, the absorption spectra of these X2A-B crystals blue-shifted with the onset wavelength changing from 465 nm (X2A-G) to 431 nm (X2A-B) (Fig. S27†). Since the solvation effect can be ignored by their similar absorption and emission spectra in these solvents (Fig. 3C, D, S28 and Table S4†), and there is nearly no π–π interaction in these X2A-B crystals, these variations were mainly due to the varied molecular conformations of X2A under different conditions, which can be explained by the enlarged distances of two anthryl moieties in X2A-B crystals. They were 4.408 Å (X2A-B-CH2Cl2), 4.353 Å (X2A-B-CH2Br2), 4.338 Å (X2A-B-ClCH2CH2Cl), and 4.315 Å (X2A-B-CH3I), respectively, compared to that of 3.698 Å in the X2A-G crystal. Thus, the blue-shifted emission from the incorporation of solvents was ascribed to the decreased π–π coupling of anthryl moieties with increased distances, which was mainly related to the regularly alternating arrangement of X2A molecules and solvents in these X2A-B crystals (Fig. S29†). Multiple C–H⋯π interactions were formed between solvents and anthryl moieties (Fig. S30†), which acted as the external driving force to compete with the intramolecular π–π coupling of anthryl moieties. Thus, π–π distances were enlarged, resulting in monomer emission with blue-shifted wavelengths. In addition, some differences appeared in the Raman and micro-infrared spectra of X2A-G and X2A-B-ClCH2CH2Cl crystals, supporting the different vibration characteristics of anthryl moieties with varied π–π coupling (Fig. S31 and S32†).
Fig. 3. Emission properties of X2A with different organic solvents. (A) Scheme of tunable π–π distance with the aid of solvents. (B) Molecular configurations and intramolecular π–π distances in X2A crystals (left) and photographs of X2A in different solutions (middle) and crystals (right) taken under 365 nm excitation. (C) PL spectra of X2A in dichloromethane, dibromomethane, 1,2-dichloroethane, methyl iodide, and tetrahydrofuran solutions (left) and corresponding crystals (right). (D) Calculated CIE coordinates in CIE 1931 color space chromaticity diagram based on the PL spectra in different solutions: CH2Cl2 (0.19, 0.38), CH2Br2 (0.21, 0.48), ClCH2CH2Cl (0.21, 0.46), CH3I (0.22, 0.48), and THF (0.20, 0.45). (E) Calculated CIE coordinates in CIE 1931 color space chromaticity diagram based on the PL spectra of corresponding crystals: X2A-B-CH2Cl2 (0.16, 0.08), X2A-B-CH2Br2 (0.19, 0.15), X2A-B-ClCH2CH2Cl (0.17, 0.15), X2A-B-CH3I (0.20, 0.22), and X2A-G (0.16, 0.30).
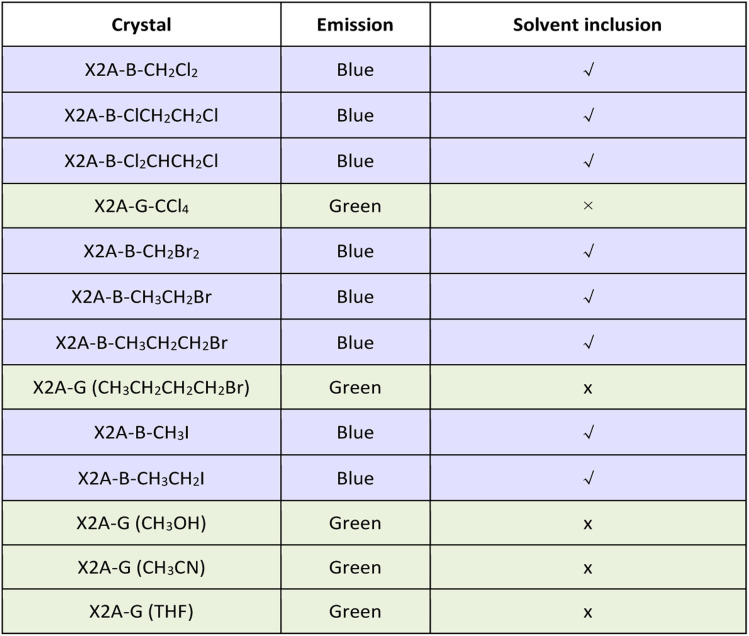
According to the detailed analysis of X2A-B crystals cultivated from different solvents, the strength of solvent–π interactions as the competition for π–π coupling play a key role in the emission properties of corresponding crystals. It can enlarge π–π distances and weaken the corresponding strength of π–π coupling in dimer models. Among them, only halogen-containing solvents can be included into crystals to realize the blue emission. This was further confirmed by the green emission of organic crystals cultivated from methanol (CH3OH) and acetonitrile (CH3CN) solvents without halogen (Table 1). The main effects of halogen-containing reagents can be summarized as follows: one is the generation of C–H⋯π, C–X⋯π and X–C⋯π interactions between solvents and π moieties and other is the modulation of molecular packing by spatial isolation of organic solvents. Subsequently, more halogen-containing solvents have been employed to further investigate the detailed mechanism. On increasing the number of chlorine atoms in the solvent from two (CH2Cl2 and ClCH2CH2Cl) to three (Cl2CHCH2Cl), the emission of corresponding crystals remains blue. However, when the number of chlorine atoms was increased to four and CCl4 was employed as the solvent for crystal growth, the emission color of resultant crystals changed to green. This was mainly due to missing C–H⋯π interactions between CCl4 and anthryl moieties, which was proved as the main driving force to incorporate solvents into crystals (Fig. S33†). Thus, CCl4 cannot be included in crystals to form solvent–π interactions. As the chain length increased from CH2Br2 to CH3CH2CH2Br and from CH3I to CH3CH2I, the blue emission still remained from the inclusion of these solvents by the formation of C–H⋯π interactions in crystals. However, after the chain length increased to CH3CH2CH2CH2Br, the corresponding emission color changed to green, which may be due to the excessive volume (Fig. S34†). Thus, the suitable size of the organic solvent and formation of multiple C–H⋯π interactions contributed to the blue emission from the balance of π–π and solvent–π interactions (Fig. S35 and Table S5†).
Emission properties of X2A crystals growth from different solvents.
|
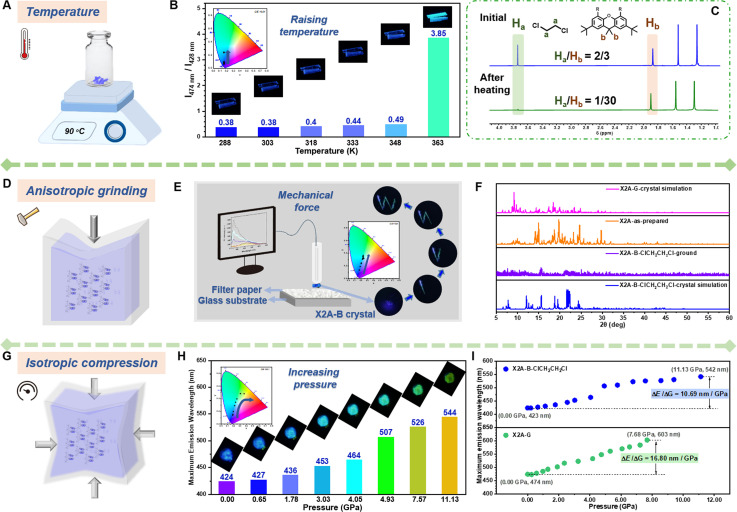
Under external stimuli, including heat and mechanical force, organic solvents can escape from organic crystals by thermal motion or cracking initiation. The absence of solvent–π interactions as the competing force can result in strengthened π–π interactions in dimer models. Accordingly, the emission color changes from monomer emission to excimer emission. Thus, diverse external stimuli were incorporated to subtly adjust the π–π coupling of anthryl moieties, with the aim of investigating the relationship between π–π coupling and emission properties. Taking the X2A-B-ClCH2CH2Cl crystal with blue emission as an example, environmental temperature and pressure were selected as control variables. As shown in the PL spectra and CIE coordinates (Fig. 4A, B, S36 and Table S6†), when the temperature increased to 363 K, the emission color changed from deep blue to green within 2 min, and the maximum emission wavelength red-shifted from 428 nm to 474 nm. Accordingly, the photoluminescence lifetime increased from 8.53 ns to 18.85 ns, meaning the transformation from monomer to excimer emission (Fig. S37 and Table S7†). Furthermore, the internal mechanism of dynamic emission under various temperatures was investigated by powder X-ray diffraction (PXRD) and 1H NMR spectra (Fig. 4C and S38†). Some small peaks appeared around 22–28° (dπ–π: 3.2–4.0 Å) in the PXRD pattern of the X2A-B-ClCH2CH2Cl crystal after heating at 363 K for 2 min, which was similar to the X2A-G crystal (Fig. S38†), indicating strengthened π–π interactions. It was mainly related to the escape of solvent molecules from the X2A-B-ClCH2CH2Cl crystal with the temperature changing from room temperature to 363 K, as supported by the decreased contents of ClCH2CH2Cl in the 1H NMR spectra of corresponding crystals. Since the external force of solvents was removed, the π–π coupling of anthryl moieties in X2A molecules can be recovered, resulting in the excimer emission. A similar phenomenon can also be seen in the X2A-B-CH2Cl2 crystal (Fig. S39 and S40†), and the X2A-G crystal with green emission showed nearly no difference in emission wavelength with increased temperatures (Fig. S41†). This further confirmed that the excimer emission of anthryl moieties originated from intramolecular π–π coupling, regardless of molecular packing and intermolecular interactions. The possibility of thermal decomposition can be excluded by thermo-gravimetric analysis (TGA) (Fig. S42†). Furthermore, the differential scanning calorimetry (DSC) curves of X2A-B-ClCH2CH2Cl and X2A-B-CH2Cl2 crystals presented sharp peaks around 80–110 °C (Fig. S43†). For comparison, green emitting X2A-G crystal showed no apparent peak on DSC curves, further confirming the escape of solvents from the X2A-B-ClCH2CH2Cl/X2A-B-CH2Cl2 crystal. The higher temperatures of solvent escape than their boiling points is mainly owing to solvent–π interactions in organic crystals. The stronger the solvent–π interactions, the higher the temperature of solvent escape. Taking X2A-B-CH2Cl2 and X2A-B-ClCH2CH2Cl crystals as examples, the CH2Cl2 escape from the X2A-B-CH2Cl2 crystal occurs at 100 °C, 60 °C higher than its boiling point (40 °C), while the ClCH2CH2Cl escape from the X2A-B-ClCH2CH2Cl crystal occurs at 90 °C, only 6 °C higher than its boiling point (84 °C). This is mainly related to the different strengths of interactions between solvents and the anthracene moiety (Table S8 and Fig. S44†). The distances of C–H⋯π interactions between CH2Cl2 and the anthracene moiety (3.001 Å and 2.883 Å) were shorter than those between ClCH2CH2Cl and the anthracene moiety (3.205 Å and 2.949 Å). Moreover, the distance of the Cl–C⋯π interaction (3.449 Å) in the X2A-B-CH2Cl2 crystal is shorter than that in the X2A-B-ClCH2CH2Cl crystal (3.605 Å). Accordingly, the calculated interaction energy between the solvent and anthracene moiety in the X2A-B-CH2Cl2 crystal (5.63 kcal mol−1) is larger than that in the X2A-B-ClCH2CH2Cl crystal (4.64 kcal mol−1). The higher interaction energy can restrict the solvent more firmly, resulting in the higher temperature for solvent escape.
Fig. 4. Dynamic emission properties of X2A under various external stimuli. (A) Scheme of temperature sensor using the X2A-B-ClCH2CH2Cl crystal. (B) Ratio of excimer emission intensity (around 474 nm) to monomer emission intensity (around 428 nm) of the X2A-B-ClCH2CH2Cl crystal with temperature increasing from 288 K to 363 K (inset: photographs and CIE coordinates in CIE 1931 color space chromaticity diagram based on PL spectra). (C) 1H NMR spectra of the X2A-B-ClCH2CH2Cl crystal in CDCl3 at the initial state and after heating at 363 K (with the ratio of Ha and Hb). (D) Scheme of grinding of the X2A-B-ClCH2CH2Cl crystal. (E) Equipment for measuring the photoluminescence spectra during continuous grinding with time. Insert: photographs and CIE coordinates in CIE 1931 color space chromaticity diagram based on PL spectra of the X2A-B-ClCH2CH2Cl crystal during grinding. (F) PXRD patterns of the X2A-B-ClCH2CH2Cl crystal simulation, X2A-B-ClCH2CH2Cl ground state, as-prepared sample and X2A-G crystal simulation. (G) Scheme of isotropic compression on the X2A-B-ClCH2CH2Cl crystal. (H) Maximum fluorescence emission wavelength of the X2A-B-ClCH2CH2Cl crystal with the pressure increasing from 0.00 GPa to 11.13 GPa (inset: photographs and CIE coordinates in CIE 1931 color space chromaticity diagram based on PL spectra). (I) The relationship between maximum emission wavelength and pressure of the X2A-B-ClCH2CH2Cl crystal (up) and X2A-G crystal (down).
In addition, solvent molecules in X2A-B crystals can be released by a mechanical force, as proved by the varied 1H NMR spectra of the X2A-B-ClCH2CH2Cl crystal before and after grinding (Fig. S45†), resulting in the blue-to-green emission transformation of the X2A-B-ClCH2CH2Cl crystal (Fig. 4D and E). The corresponding PL spectra exhibited decreased emission intensity around 428 nm and a more apparent peak at 500 nm (Fig. S46†). Thus, a quartz tube with attached X2A-B-ClCH2CH2Cl crystal can act as a “fluorescence pen.” The emission pattern “W” with blue-to-green gradient color can be achieved by “writing” on filter paper (Video S1†), which can be applied for anti-counterfeiting and display applications (Fig. S47†). The PXRD patterns showed some differences between the crystalline and ground state. There were many peaks at 22–28° after grinding, similar to the as-prepared sample and X2A-G crystal with green emission (Fig. 4F), further illustrating the efficient transformation from monomer to excimer-like emission of anthracenes.
Furthermore, when isotropic pressure was imposed upon the X2A-B-ClCH2CH2Cl crystal, the initial blue emission changes gradually to yellow-green one, as shown by CIE coordinates (Fig. 4G and H). Accordingly, the maximum emission wavelength red-shifted from 423 nm to 542 nm with the pressure increased from 0.00 GPa to 11.13 GPa (Fig. S48†), and an obvious change of emission colors can be detected under a pressure of 4.9 Gpa. Once the pressure is released, it could get back to blue emission, similar to that in the initial state (Fig. S49†), indicating the good reversibility of PL emission under different pressures. For the X2A-G crystal with green emission, photoluminescence spectra also red-shifted about 130 nm upon isotropic compression of 7.68 GPa (Fig. S50 and S51†). The red-shifted emission of the X2A-G crystal under pressure is more obvious (16.80 nm GPa−1) compared to that of the X2A-B-ClCH2CH2Cl crystal (10.69 nm GPa−1), manifesting different π–π coupling in these two kinds of crystals (Fig. 4I). Accordingly, the in situ Raman spectra further indicated that the variation of PL emission was mainly due to the different π–π coupling in X2A-G and X2A-B-ClCH2CH2Cl crystals (Fig. S52 and S53†). This can be further confirmed by the similarity in PL and Raman spectra of X2A-B-CH2Cl2 and X2A-B-ClCH2CH2Cl crystals under different pressures (Fig. S54 and S55†). Thus, all dynamic emission changes of X2A-B crystals by an external force, including heat, mechanical force and isotropic pressure, were related to the adjustable π–π coupling of anthryl moieties, which provided multiple approaches to investigate the relationship between π–π coupling and the emission properties of anthryl moieties for precise regulation and a highly sensitive emission response.
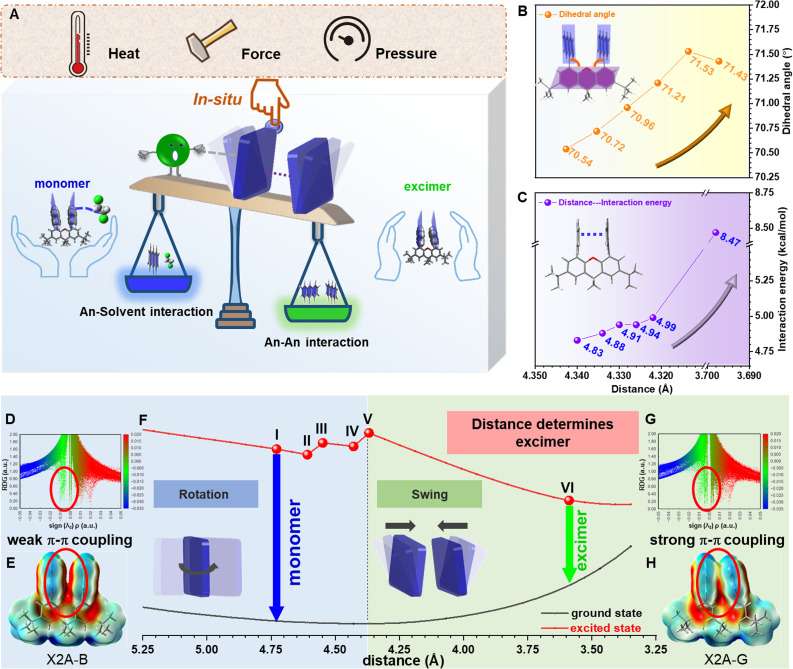
Subsequently, with the aim of investigating the intrinsic mechanism of various emission responses towards external force and establishing the explicit relationship between emission properties and π–π coupling of anthryl moieties, more detailed analyses and quantitative tests were conducted (Fig. 5A). For the blue-to-green emission conversion of the X2A-B-ClCH2CH2Cl crystal under heating, in situ single-crystal structures with the temperature changing from 288 K to 348 K were obtained, which exhibited similar packing modes but different molecular conformations (Fig. S56†). In detail, the π–π distances of anthryl moieties gradually decreasedfrom 4.340 Å to 4.322 Å, accompanied by more twisted conformations of the xanthene scaffold with anincrease of the dihedral angles of the inside two phenyl moieties from 0.90° to 1.05°. Accordingly, dihedral angles between anthracene and the xanthene scaffold gradually increased from 70.54° to 71.53° (Fig. 5B and Table S9†). These subtle variations were mainly related to the balance of intramolecular π–π interactions between two anthryl moieties (An–An interaction) and intermolecular interactions between the 1,2-dichloroethane molecule and anthryl moiety (An–solvent interaction). Accordingly, during the heating of X2A-B-ClCH2CH2Cl crystals, An–An interactions strengthened from 4.83 kcal mol−1 to 4.99 kcal mol−1, and X2A-solvent interactions weakened from 4.94 kcal mol−1 to 4.67 kcal mol−1 (Fig. 5C, S57 and Table S10†). Once the temperature further increased over 363 K, solvents evaporated, and the excimer emission could be observed, which was consistent with the X2A-G crystal with a stronger An–An interactions (8.47 kcal mol−1) and smaller An–An distance (3.698 Å).
Fig. 5. Relationship between π–π distance and emission property through crystal analysis and theory calculation. (A) Scheme of proposed mechanism: upon the incorporation of solvents, stimulation of heat, isotropic pressure and mechanical force, different π–π distances determined by the competition between anthracene–anthracene (An–An) interactions and anthracene–solvent (An–solvent) interactions, resulting in excimer or monomer emission of X2A crystals. (B) Relationship between dihedral angles of anthryl with xanthene and distance of anthryl moieties. (C) Quantitative relationship between distances and interaction energies of anthryl moieties in X2A. (D) Scatter diagram for RDG versus sign (λ2)ρ of the X2A-B-ClCH2CH2Cl crystal. (E) Electrostatic potential (ESP) analysis of the X2A-B-ClCH2CH2Cl crystal. (F) Calculated potential energy surfaces (PES) for the ground state and singlet excited state of X2A, with varied distances between two anthryl moieties (defined by distances of two C10 atoms of anthryl moieties). Changes in molecular conformations with decreased distances of anthryl moieties can be divided into two sections: rotation of anthryl moieties and swing of anthryl moieties. (G) Scatter diagram for RDG versus sign (λ2)ρ of the X2A-G crystal. (H) Electrostatic potential (ESP) analysis of the X2A-G crystal.
The subtle control of π–π coupling of anthryl moieties can be further confirmed by time-dependent density-functional theory (TD) DFT calculations. For the scatter diagram for reduced density gradient (RDG) versus sign (λ2)ρ, the X2A-G crystal demonstrated more green scatters near zero than those of the X2A-B-ClCH2CH2Cl crystal, suggesting stronger van der Waals interactions (Fig. 5D, G and S58†). Furthermore, the π–π coupling of anthryl moieties in X2A molecules increased from the X2A-B-ClCH2CH2Cl to X2A-G crystal, as shown by electrostatic potential (ESP) analysis (Fig. 5E, H and S59†). This was further confirmed by gradient isosurfaces (Fig. S60†). Furthermore, transfer integrals between HOMOs of anthracene moieties showed an increasing tendency from 17.38 meV to 18.41 meV, 19.88 meV, 21.48 meV, 23.30 meV and 108.53 meV with an increasing temperature, indicating the enhanced π–π coupling (Table S11†). Accordingly, the energy gap between HOMOs and LUMOs decreased from 3.52 to 3.57 eV (X2A-B-ClCH2CH2Cl crystals) to 3.45 eV (X2A-G crystals) (Fig. S61†), which was consistent with the red-shifted emission from the excimer formation. Thus, the controllable rotation and swing of anthracene moieties under various external environmental conditions resulted in the transformation from monomer to excimer emission, together with the aid of solvents, contributing to the sensitive stimulus-responsive behavior of X2A.
Subsequently, the relationship between emission properties and π–π coupling was illustrated by the potential energy surface (PES) calculation for the X2A molecule under different conditions. The π–π distance of anthryl moieties was highlighted, which was defined by the distances of two C10 atoms in anthryl moieties separately. The energy levels of X2A in the ground state demonstrated gentle changes; in detail, it became lower first with decreased π–π distances from 5.389 Å to 4.369 Å and became higher when it reached 3.589 Å. However, the energy levels of X2A in the excited state suffered several turning points for the variation of molecular conformations, which can be divided into two sections by different molecular motions (Fig. 5F). First, two anthryl moieties in X2A rotated to achieve almost perpendicular geometry to xanthene and a parallel arrangement with the face-to-face mode (Fig. S62†). During the first step, energy gaps between the excited state and ground state exhibited little changes, and the electronic coupling of two anthryl moieties in X2A can be ignored, resulting in the monomer-like emission with high energy gaps between the excited state and ground state. However, with the swing of anthryl moieties in the second step, energy gaps decreased largely, contributing to green emission (Video S2†). This indicated that the swing process is the key step to the transformation from monomer to excimer emission, and the decreased π–π distance is a crucial factor in the excimer emission of anthryl moieties.
Conclusions
In summary, through the establishment of an intramolecular dimer model (X2R model) of aromatic species using an xanthene scaffold, the relationship between emission properties, size of aromatic rings and π–π interactions has been systematically investigated. Among them, X2A crystal with tunable electronic coupling of anthryl moieties can exhibit the monomer to excimer emission gradually by selection of organic solvents and external stimulus, including heating, mechanical force and pressure. This visibly showed the formation process of anthracene excimer through the balance of solvent–π and π–π interactions, which was further illustrated by in situ analysis of crystal structures and theory calculations. The quantitative relationship between excimer emission and π–π distance will be helpful for the deep understanding of the inherent mechanism of the photoluminescence process in aggregated states, promoting the application of well-organized molecular aggregates.
Data availability
The datasets supporting this article have been uploaded as part of the ESI.†
Author contributions
Q. L. (Qianqian Li) and Z. L. conceived this research. Q. L. (Qiuyan Liao) prepared target compounds and carried out photophysical characterization as well as single-crystal analysis. A. L. carried out high-pressure tests and micro-infrared spectroscopy. A. H. partially carried out micro-photoluminescence tests. J. W., H. L and P. Y. partially synthesized and purified target compounds. K. C. conducted MC tests. C. Z. instructed and helped with TD-DFT calculations. P. X. helped to carry out photoluminescence tests of X2A crystals with different solvents. J. W. carried out lifetime tests at different temperatures. All authors contributed to the writing of the manuscript.
Conflicts of interest
There are no conflicts to declare.
Supplementary Material
Acknowledgments
This work was supported by the National Natural Science Foundation of China (22235006, 22122504), Hubei Province (2022BAA015 and 2022EHB010) and Wuhan city (whkxjsj014). The authors thank the supercomputing center of Wuhan University and parallel technology for providing the theoretical calculation platform. We thank the Core Facility of Wuhan University for assistance with single-crystal X-ray diffraction analysis.
Electronic supplementary information (ESI) available. CCDC 2308124–2308129, 2308248, 2180328, 2180336, 2180337, 2180349, 2180351, 2180353, 2180355, 2180357, 2180359–2180362 and 2180372–2180374. For ESI and crystallographic data in CIF or other electronic format see DOI: https://doi.org/10.1039/d3sc05533g
Notes and references
- Zhang D. Song X. Li H. Cai M. Bin Z. Huang T. Duan L. Adv. Mater. 2018;30:1707590. doi: 10.1002/adma.201707590. [DOI] [PubMed] [Google Scholar]
- Yoshizawa M. Klosterman J. K. Chem. Soc. Rev. 2014;43:1885–1898. doi: 10.1039/C3CS60315F. [DOI] [PubMed] [Google Scholar]
- Shimizu M. Hiyama T. Chem.–Asian J. 2010;5:1516–1531. doi: 10.1002/asia.200900727. [DOI] [PubMed] [Google Scholar]
- Jiang H. Zhu S. Cui Z. Li Z. Liang Y. Zhu J. Hu P. Zhang H. L. Hu W. Chem. Soc. Rev. 2022;51:3071–3122. doi: 10.1039/D1CS01136G. [DOI] [PubMed] [Google Scholar]
- Oyamada T. Uchiuzou H. Akiyama S. Oku Y. Shimoji N. Matsushige K. Sasabe H. Adachi C. J. Appl. Phys. 2005;98:074506. doi: 10.1063/1.2060932. [DOI] [Google Scholar]
- Figueira-Duarte T. M. Mullen K. Chem. Rev. 2011;111:7260–7314. doi: 10.1021/cr100428a. [DOI] [PubMed] [Google Scholar]
- Mei J. Leung N. L. C. Kwork R. T. K. Lam J. W. Y. Tang B. Z. Chem. Rev. 2015;115:11718–11940. doi: 10.1021/acs.chemrev.5b00263. [DOI] [PubMed] [Google Scholar]
- Wang Y. Nie J. Fang W. Yang L. Hu Q. Wang Z. Sun J. Tang B. Z. Chem. Rev. 2020;120:4534–4577. doi: 10.1021/acs.chemrev.9b00814. [DOI] [PubMed] [Google Scholar]
- Dey N. Bhattacharya S. Anal. Chem. 2017;89:10376–10383. doi: 10.1021/acs.analchem.7b02344. [DOI] [PubMed] [Google Scholar]
- Benny A. Ramakrishnan R. Hariharan M. Chem. Sci. 2021;12:5064–5072. doi: 10.1039/D1SC00520K. [DOI] [PMC free article] [PubMed] [Google Scholar]
- Hinoue T. Shigenoi Y. Sugino M. Mizobe Y. Hisaki I. Miyata M. Tohnai N. Chem.–Eur. J. 2012;18:4634–4643. doi: 10.1002/chem.201103518. [DOI] [PubMed] [Google Scholar]
- Mallia A. R. Salini P. S. Hariharan M. J. Am. Chem. Soc. 2015;137:15604–15607. doi: 10.1021/jacs.5b08257. [DOI] [PubMed] [Google Scholar]
- Ramakrishnan R. Niyas M. A. Lijina M. P. Hariharan M. Acc. Chem. Res. 2019;52:3075–3086. doi: 10.1021/acs.accounts.9b00320. [DOI] [PubMed] [Google Scholar]
- Li Q. Li Z. Adv. Sci. 2017;4:1600484. doi: 10.1002/advs.201600484. [DOI] [PMC free article] [PubMed] [Google Scholar]
- Hisamatsu S. Masu H. Takahashi M. Kishikawa K. Kohmoto S. Cryst. Growth Des. 2015;15:2291–2302. doi: 10.1021/acs.cgd.5b00081. [DOI] [Google Scholar]
- Liu H. Cong D. Li B. Ye L. Ge Y. Tang X. Shen Y. Wen Y. Wang J. Zhou C. Yang B. Cryst. Growth Des. 2017;17:2945–2949. doi: 10.1021/acs.cgd.7b00460. [DOI] [Google Scholar]
- Hu S. Yao Z. Ma X. Yue L. Chen L. Liu R. Wang P. Li H. Zhang S. T. Yao D. Cui T. Zou B. Zou G. J. Phys. Chem. Lett. 2022;13:1290–1299. doi: 10.1021/acs.jpclett.1c04214. [DOI] [PubMed] [Google Scholar]
- Liu H. Dai Y. Gao Y. Gao H. Yao L. Zhang S. Xie Z. Wang K. Zou B. Yang B. Ma Y. Adv. Opt. Mater. 2018;6:1800085. doi: 10.1002/adom.201800085. [DOI] [Google Scholar]
- Chen Y. H. Tang K. C. Chen Y. T. Shen J. Y. Wu Y. S. Liu S. H. Lee C. S. Chen C. H. Lai T. Y. Tung S. H. Jeng R. J. Hung W. Y. Jiao M. Wu C. C. Chou P. T. Chem. Sci. 2016;7:3556–3563. doi: 10.1039/C5SC04902D. [DOI] [PMC free article] [PubMed] [Google Scholar]
- Jiang W. Shen Y. Ge Y. Zhou C. Wen Y. Liu H. Liu H. Zhang S. Lu P. Yang B. J. Mater. Chem. C. 2020;8:3367–3373. doi: 10.1039/C9TC06603A. [DOI] [Google Scholar]
- Li Q. Li Z. Acc. Chem. Res. 2020;53:962–973. doi: 10.1021/acs.accounts.0c00060. [DOI] [PubMed] [Google Scholar]
- Hu J. Y. Pu Y. J. Nakata G. Kawata S. Sasabe H. Kido J. Chem. Commun. 2012;48:8434–8436. doi: 10.1039/C2CC33463A. [DOI] [PubMed] [Google Scholar]
- Liu H. Yao L. Li B. Chen X. Gao Y. Zhang S. Li W. Lu P. Yang B. Ma Y. Chem. Commun. 2016;52:7356–7359. doi: 10.1039/C6CC01993E. [DOI] [PubMed] [Google Scholar]
- Mcvey J. K. Shold D. M. Yang N. C. J. Chem. Phys. 2008;65:3375–3376. doi: 10.1063/1.433468. [DOI] [Google Scholar]
- Zhang Q. Fan Y. Liao Q. Zhong C. Li Q. Li Z. Sci. China Chem. 2022;65:918–925. doi: 10.1007/s11426-021-1229-4. [DOI] [Google Scholar]
- Winnik F. M. Chem. Rev. 1993;93:587–614. doi: 10.1021/cr00018a001. [DOI] [Google Scholar]
- Shen Y. Zhang Z. Liu H. Yan Y. Zhang S. Yang B. Ma Y. J. Phys. Chem. C. 2019;123:13047–13056. doi: 10.1021/acs.jpcc.9b02447. [DOI] [Google Scholar]
- Gu J. Li Z. Li Q. Coordin. Chem. Rev. 2023;475:214872. doi: 10.1016/j.ccr.2022.214872. [DOI] [Google Scholar]
- Huang A. Li Q. Li Z. Chin. J. Chem. 2022;40:2356–2370. doi: 10.1002/cjoc.202100843. [DOI] [Google Scholar]
- Li S. Li Q. Li Z. Prog. Chem. 2022;34:1554–1575. [Google Scholar]
- Förster T. Angew. Chem., Int. Ed. 1969;5:333–343. doi: 10.1002/anie.196903331. [DOI] [Google Scholar]
- Saigusa H. Lim E. C. Acc. Chem. Res. 1996;29:171–178. doi: 10.1021/ar950169v. [DOI] [Google Scholar]
- Philip A. M. Kuriakose F. Hariharan M. J. Phys. Chem. C. 2017;121:23259–23267. doi: 10.1021/acs.jpcc.7b06660. [DOI] [Google Scholar]
- Philip A. M. Manikandan S. K. Shaji A. Hariharan M. Chem.–Eur. J. 2018;24:18089–18096. doi: 10.1002/chem.201804139. [DOI] [PubMed] [Google Scholar]
- Zhang Z. Zhang Y. Yao D. Bi H. Javed I. Fan Y. Zhang H. Wang Y. Cryst. Growth Des. 2009;9:5069–5076. doi: 10.1021/cg9008569. [DOI] [Google Scholar]
- Rajagopal S. K. Salini P. S. Hariharan M. Cryst. Growth Des. 2016;16:4567–4573. doi: 10.1021/acs.cgd.6b00676. [DOI] [Google Scholar]
- Liu H. Shen Y. Yan Y. Zhou C. Zhang S. Li B. Ye L. Yang B. Adv. Funct. Mater. 2019;29:1901895. doi: 10.1002/adfm.201901895. [DOI] [Google Scholar]
- Sekiguchi S. Kondo K. Sei Y. Akita M. Yoshizawa M. Angew. Chem., Int. Ed. 2016;55:6906–6910. doi: 10.1002/anie.201602502. [DOI] [PubMed] [Google Scholar]
- Nagarajan K. Rajagopal S. K. Hariharan M. CrystEngComm. 2014;16:8946–8949. doi: 10.1039/C4CE01278J. [DOI] [Google Scholar]
- Shen Y. Liu H. Zhang S. Gao Y. Li B. Yan Y. Hu Y. Zhao L. Yang B. J. Mater. Chem. C. 2017;5:10061–10067. doi: 10.1039/C7TC03229C. [DOI] [Google Scholar]
- Sun L. Zhu W. Zhang X. Li L. Dong H. Hu W. J. Am. Chem. Soc. 2021;143:19243–19256. doi: 10.1021/jacs.1c07678. [DOI] [PubMed] [Google Scholar]
- Takaishi K. Iwachido K. Takehana R. Uchiyama M. Ema T. J. Am. Chem. Soc. 2019;141:6185–6190. doi: 10.1021/jacs.9b02582. [DOI] [PubMed] [Google Scholar]
- Hirayama F. J. Chem. Phys. 1965;42:3163–3171. doi: 10.1063/1.1696395. [DOI] [Google Scholar]
- Cook R. E. Phelan B. T. Kamire R. J. Majewski M. B. Young R. M. Wasielewski M. R. J. Phys. Chem. A. 2017;121:1607–1615. doi: 10.1021/acs.jpca.6b12644. [DOI] [PubMed] [Google Scholar]
- Shang C. Wang G. Wei Y. C. Jiang Q. Liu K. Zhang M. Chen Y. Y. Chang X. Liu F. Yin S. Chou P. T. Fang Y. CCS Chem. 2021;3:1921–1932. doi: 10.31635/ccschem.020.202000399. [DOI] [Google Scholar]
- Tsujimoto H. Ha D. G. Markopoulos G. Chae H. S. Baldo M. A. Swager T. M. J. Am. Chem. Soc. 2017;139:4894–4900. doi: 10.1021/jacs.7b00873. [DOI] [PubMed] [Google Scholar]
- Wang J. Dang Q. Gong Y. Liao Q. Song G. Li Q. Li Z. CCS Chem. 2021;3:274–286. doi: 10.31635/ccschem.020.202000556. [DOI] [Google Scholar]
- Chen C. Di Z. Li H. Liu J. Wu M. Hong M. CCS Chem. 2022;4:1315–1325. doi: 10.31635/ccschem.021.202100910. [DOI] [Google Scholar]
- Huang Q. Li W. Mao Z. Qu L. Li Y. Zhang H. Yu T. Yang Z. Zhao J. Zhang Y. Aldred M. P. Chi Z. Nat. Commun. 2019;10:3074. doi: 10.1038/s41467-019-10575-5. [DOI] [PMC free article] [PubMed] [Google Scholar]
- Wu Q. Ma H. Ling K. Gan N. Cheng Z. Gu L. Cai S. An Z. Shi H. Huang W. ACS Appl. Mater. Interfaces. 2018;10:33730–33736. doi: 10.1021/acsami.8b13713. [DOI] [PubMed] [Google Scholar]
- Li L. Ma H. Zhang J. Zhao E. Hao J. Huang H. Li H. Li P. Gu X. Tang B. Z. J. Am. Chem. Soc. 2021;143:3856–3864. doi: 10.1021/jacs.0c12153. [DOI] [PubMed] [Google Scholar]
- Dai Y. Liu H. Geng T. Ke F. Niu S. Wang K. Qi Y. Zou B. Yang B. Mao W. L. Lin Y. J. Mater. Chem. C. 2021;9:934–938. doi: 10.1039/D0TC04677A. [DOI] [Google Scholar]
- Liu H. Gu Y. Dai Y. Wang K. Zhang S. Chen G. Zou B. Yang B. J. Am. Chem. Soc. 2020;142:1153–1158. doi: 10.1021/jacs.9b11080. [DOI] [PubMed] [Google Scholar]
- Shang C. Wang G. Wei Y. C. Jiang Q. Liu K. Zhang M. Chen Y. Y. Chang X. Liu F. Yin S. Chou P. T. Fang Y. CCS Chem. 2022;4:1949–1960. doi: 10.31635/ccschem.021.202100871. [DOI] [Google Scholar]
- Keshri S. K. Takai A. Ishizuka T. Kojima T. Takeuchi M. Angew. Chem., Int. Ed. 2020;59:5254–5258. doi: 10.1002/anie.201914414. [DOI] [PubMed] [Google Scholar]
- Liu X. Liao Q. Yang J. Li Z. Li Q. Angew. Chem., Int. Ed. 2023;62:e202302792. doi: 10.1002/anie.202302792. [DOI] [PubMed] [Google Scholar]
- Ren J. Wang W. Tian Y. Liu Z. Xiao X. Yang J. Fang M. Li Z. Angew. Chem., Int. Ed. 2021;60:12335–12340. doi: 10.1002/anie.202101994. [DOI] [PubMed] [Google Scholar]
- Gu M. Chen L. Hu R. Chen Q. Liu J. Wang L. Chen S. Sci. China Chem. 2023;66:2986–3005. doi: 10.1007/s11426-023-1825-7. [DOI] [Google Scholar]
- Liu Z. Tian Y. Yang J. Li A. Wang Y. Ren J. Fang M. Tang B. Z. Li Z. Light Sci. Appl. 2022;11:142. doi: 10.1038/s41377-022-00826-4. [DOI] [PMC free article] [PubMed] [Google Scholar]
- Fan Y. Li Q. Li Z. Sci. China Chem. 2023;66:2930–2940. doi: 10.1007/s11426-023-1790-0. [DOI] [Google Scholar]
- Huang Q. Li W. Yang Z. Zhao J. Li Y. Mao Z. Yang Z. Liu S. Zhang Y. Chi Z. CCS Chem. 2022;4:1643–1653. doi: 10.31635/ccschem.021.202100968. [DOI] [Google Scholar]
- Chen Z. Chen X. Ma D. Mao Z. Zhao J. Chi Z. J. Am. Chem. Soc. 2023;145:16748–16759. doi: 10.1021/jacs.3c04725. [DOI] [PubMed] [Google Scholar]
- Liao Q. Li Q. Li Z. Adv. Mater. 2023:2306617. doi: 10.1002/adma.202306617. [DOI] [PubMed] [Google Scholar]
Associated Data
This section collects any data citations, data availability statements, or supplementary materials included in this article.
Supplementary Materials
Data Availability Statement
The datasets supporting this article have been uploaded as part of the ESI.†


