

Summary
In this study, we investigate the genetic mechanisms responsible for the loss of anthocyanins in betalain‐pigmented Caryophyllales, considering our hypothesis of multiple transitions to betalain pigmentation.
Utilizing transcriptomic and genomic datasets across 357 species and 31 families, we scrutinize 18 flavonoid pathway genes and six regulatory genes spanning four transitions to betalain pigmentation. We examined evidence for hypotheses of wholesale gene loss, modified gene function, altered gene expression, and degeneration of the MBW (MYB‐bHLH‐WD40) trasnscription factor complex, within betalain‐pigmented lineages.
Our analyses reveal that most flavonoid synthesis genes remain conserved in betalain‐pigmented lineages, with the notable exception of TT19 orthologs, essential for the final step in anthocyanidin synthesis, which appear to have been repeatedly and entirely lost. Additional late‐stage flavonoid pathway genes upstream of TT19 also manifest strikingly reduced expression in betalain‐pigmented species. Additionally, we find repeated loss and alteration in the MBW transcription complex essential for canonical anthocyanin synthesis.
Consequently, the loss and exclusion of anthocyanins in betalain‐pigmented species appear to be orchestrated through several mechanisms: loss of a key enzyme, downregulation of synthesis genes, and degeneration of regulatory complexes. These changes have occurred iteratively in Caryophyllales, often coinciding with evolutionary transitions to betalain pigmentation.
Keywords: AN9, anthocyanin biosynthesis, betalain biosynthesis, flavonoid biosynthesis, MBW complex, PAP1, pigment evolution, TT19
Introduction
The tree of life is replete with polyphyletic traits, a phenomenon also known as homoplasy, which may be explained by iterative origins of a trait, trait loss, or reversals to an ancestral state (Wake et al., 2011). Resolving these alternative scenarios is challenging, but a promising approach lies in a detailed genetic examination of the trait in question. For example, the homoplastic pattern of differentiated perianth in Ranunculales, initially ascribed to convergent evolution of differentiation, has now been shown to be derived through repeated petal loss via iterative loss or downregulation of the petal‐specific developmental regulator AP3‐3 (Rasmussen et al., 2009; Sharma et al., 2011; Zhang et al., 2013). Likewise, phylogenomic analysis of the NIN transcription factor, crucial for root nodule symbiosis, revealed multiple loss‐of‐function events that emphasize homoplasy via multiple losses (Griesmann et al., 2018), rather than iterated gains in symbiosis as previously hypothesized (Doyle, 1998). In a final example, initial suggestions of repeated origins of stomata (Pressel et al., 2014) have been ruled out following examination of patterns of gene conservation and loss, which posit a single origin of stomata and subsequent loss in liverworts (Chater et al., 2017; Harris et al., 2020). Phylogenetic analysis of underlying genetic variation therefore serves both as a robust tool to elucidate the evolutionary history of traits and to identify potential genetic mechanisms underlying trait transitions.
With this as context, anthocyanin pigmentation has been developed into a powerful model in which to explore the interaction between genetic architecture and trait transitions. Anthocyanin‐based floral coloration shows frequent transitions between different hues through changes in concentrations of red pelargonidins, purple cyanidins, and blue delphinidins (Wessinger & Rausher, 2012; Wheeler et al., 2021). These transitions can be caused by repeated regulatory changes to the same or similar anthocyanin pathway genes (Larter et al., 2018; Wheeler et al., 2023). The targets of these changes appear to be constrained by pleiotropy and the structure of the anthocyanin biosynthesis pathway (Streisfeld & Rausher, 2011; Larter et al., 2018; Wheeler et al., 2021). Some lineages have also repeatedly evolved white flowers by loss of anthocyanins (Ho & Smith, 2016; Wheeler et al., 2023), by diverse mechanisms (Gates et al., 2018; Duncan & Rausher, 2020), but with predictable molecular evolutionary consequences for genes in the pathway (Ho & Smith, 2016). Interestingly, while some transitions to white flowers involve gene loss or loss of function in anthocyanin pathway genes (Coburn et al., 2015; Lin et al., 2022), others seem to involve primarily regulatory changes (Ho & Smith, 2016; Gates et al., 2018), suggesting that some losses of anthocyanins may be more easily reversible. But while loss of anthocyanins in specific tissues is not uncommon, complete loss of anthocyanins is rare, and has only been documented in the angiosperm order Caryophyllales.
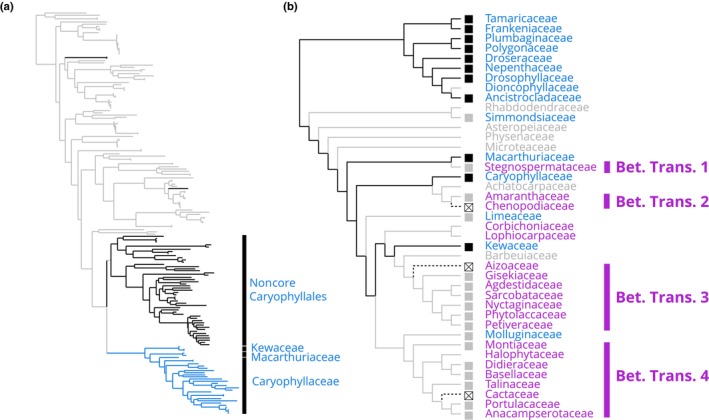
In Caryophyllales, an unusual class of pigments, the betalains, replaces the otherwise ubiquitous anthocyanins. Intriguingly, species within Caryophyllales that exhibit betalain pigmentation have consistently shown an absence of anthocyanin pigments, and vice versa (Bate‐Smith, 1962; Mabry, 1964; Clement & Mabry, 1996). Despite this, betalain‐pigmented species continue to produce other flavonoids, such as proanthocyanidins in their seed coats (Shimada et al., 2005). These findings have led to the prevailing hypothesis that anthocyanins and betalains are mutually exclusive (Stafford, 1994; Clement & Mabry, 1996). Phylogenetic analyses reveal a complex, homoplastic distribution of betalain and anthocyanin pigmentation within Caryophyllales (Sheehan et al., 2020; Fig. 1a). This interdigitated pattern has traditionally been ascribed to a single origin of betalains early in the evolutionary history of Caryophyllales, followed by multiple reversals to anthocyanin pigmentation (Fig. 1a; Brockington et al., 2011, 2015). However, recent evidence challenges this view, suggesting that betalain synthesis has originated independently multiple times within Caryophyllales (Sheehan et al., 2020), which implies multiple independent losses of anthocyanins (Fig. 1b). Four distinct evolutionary genetic mechanisms can be hypothesized to explain the loss of anthocyanins in betalain‐pigmented Caryophyllales lineages: Hypothesis 1 – wholesale loss of anthocyanin synthesis genes, Hypothesis 2 – loss of function in anthocyanin synthesis genes, Hypothesis 3 – reduced expression of anthocyanin synthesis genes, and Hypothesis 4 – degeneration of trans‐acting factors responsible for the activation of anthocyanin synthesis genes.
Fig. 1.

Two alternative hypotheses of pigment evolution in Caryophyllales. (a) A single origin of betalain pigmentation (sensu Brockington et al., 2015) implies a single loss of anthocyanins and subsequently five independent reversals (Gn1–5) back to anthocyanin pigmentation (dotted blue lines represent the maintenance of anthocyanin pathway genes); (b) in this scenario, all instances of anthocyanin pigmentation represent retention of the plesiomorphic state, and multiple transitions (Bet. Trans 1–4) to betalain pigmentation (sensu Sheehan et al., 2020) implying at least four independent losses of anthocyanin (Ls1–4). Blue = anthocyanin, purple = betalain, gray = unknown. Tree topology and color coding based on the mutual exclusion between the betalain and anthocyanin pigmentation and the family level phylogeny of Sheehan et al. (2020).
Studies examining the anthocyanin synthesis pathway (Fig. 2) in five betalain‐pigmented species have yielded some insights with respect to these hypotheses. First, current evidence does not support the notion of a wholesale loss of genes involved in anthocyanin synthesis. Specifically, the genes encoding late‐stage dihydroflavonol 4‐reductase (DFR) and leucoanthocyanidin dioxygenase (LDOX) are retained in betalain‐pigmented Spinacia oleracea, Phytolacca americana, and Astrophytum myriostigma. This conservation is likely attributable to the pleiotropic roles of DFR and ANS, which include proanthocyanidin synthesis (Shimada et al., 2004, 2005; Sakuta et al., 2021). Implicit then in the retention of these late‐stage genes is the preservation of preceding elements within the pathway. Second, evidence regarding the loss of function in anthocyanin synthesis genes remains inconclusive. While canonical functions for ANS and DFR are conserved in S. oleracea and P. americana (Shimada et al., 2004, 2005; Sakuta et al., 2021), Polturak et al. (2018) identified a truncated ANS protein in Mirabilis jalapa that is devoid of its canonical enzymatic activity, suggesting that the loss of anthocyanins in this species could be due to functional abrogation of ANS. Third, investigations into the cis‐regulatory regions of ANS and DFR in S. oleracea and P. americana have suggested that cis‐regulatory modifications could potentially be linked to the observed downregulation of these genes, which is restricted to seed coats (Shimada et al., 2004, 2005, 2007; Sakuta et al., 2021). However, the impact of cis‐modifications remains uncertain, primarily due to the limitations of heterologous promoter‐binding assays (Shimada et al., 2007; Sakuta et al., 2021). Lastly, in both Beta vulgaris and Portulaca grandiflora, trans‐acting Promoter of Anthocyanin Pigmentation 1 (PAP1) homologs have been found to lose their ability to interact with canonical bHLH partners in heterologous assays. This loss is suggested to impair the activation of anthocyanin biosynthesis genes in planta, thus contributing to the absence of anthocyanins (Hatlestad et al., 2014; Sakuta et al., 2021).
Fig. 2.

Simplified flavonoid biosynthesis pathway. CHS (naringenin‐chalcone synthase), CHI (chalcone isomerase), FNS (flavone synthase), FLS (flavonol synthase), F3H (flavanone 3‐hydroxylase), F3′H (flavonoid 3′‐hydroxylase), F3′5′H (flavonoid 3′,5′‐hydroxylase), DFR (dihydroflavonol 4‐reductase), LDOX (leucoanthocyanidin dioxygenase), TT19 (glutathione S‐transferase), LAR (leucoanthocyanidin reductase), ANR (anthocyanidin reductase), GT (glycosyltransferase; here the arrow represents glycosyltransferase enzymes in general rather than a specific glycosyltransferase, as glycosylations take place as series of steps), MATE (multidrug and toxin extrusion), ABCC (ATP binding cassette protein type C), and AHA10 (autoinhibited H(+)‐ATPase isoform 10). Note TT19 appears twice and with a ‘?’ in the second instance to reflect uncertainty in its role as a ligandin, in addition to its recently identified role in anthocyanidin synthesis (Eichenberger et al., 2023). MATE, ABCC, and AHA10 are involved in the anthocyanin transport from the cytoplasm into the vacuole. Shaded oval represents the vacuole in which anthocyanins are stored. Dotted lines show branch points from anthocyanin metabolism to other phenylalanine‐derived metabolites.
But while these studies offer valuable insights, their limitations manifest in three ways: (1) they cover a narrow selection of just five species, (2) they lack a consistent evaluation of mechanisms across these species, and (3) they explore only a subset of the components involved in the flavonoid biosynthesis pathway. These limitations lead to gaps in our understanding that warrant further investigation. For instance, the early components of the flavonoid biosynthesis pathway remain largely unexplored, and the evolutionary trajectories of glycosylation enzymes, putative anthocyanin transporters, and a recently identified anthocyanidin synthesis enzyme have not been adequately addressed. Additionally, the evolutionary dynamics of bHLH and WD40 transcription factors, which operate in tandem with the PAP1 transcription factor in an MBW protein complex, have not been investigated. Moreover, varied methodologies and restricted taxon sampling employed in existing research have left it unclear as to whether the mechanisms responsible for the loss of anthocyanins vary across independent transitions to betalain pigmentation. To remedy these gaps, we have capitalized on the recent surge in genomic and transcriptomic resources to construct a comprehensive comparative framework, both gene‐rich and species‐rich. This framework allowed us to reassess the evolutionary fate of the flavonoid biosynthesis pathway in 357 species and 31 families, representing all four proposed transitions to betalain pigmentation.
First, under Hypothesis 1, we scrutinized our dataset for discernable patterns of gene absence in betalain‐pigmented lineages that would indicate wholesale gene loss. Our analyses reveal that most flavonoid synthesis genes are, in fact, conserved within betalain‐pigmented lineages, with the notable patterns of loss of the flavonoid hydroxylase F3′5′H and the wholesale loss of orthologs of TT19, recently identified as a key enzyme in anthocyanidin synthesis (Eichenberger et al., 2023). Second, to evaluate Hypothesis 2, we focused on the conserved genes within betalain‐pigmented lineages, probing for shifts in nucleotide substitution patterns that would suggest either loss or alteration of gene function. Our findings indicate a pattern of relaxed purifying selection, as well as reduced diversifying selection for multiple genes, particularly when comparing betalain lineages to their anthocyanin counterparts. Third, to assess Hypothesis 3, we employed combined RNA‐Seq datasets to examine variations in gene expression levels between betalain‐ and anthocyanin‐pigmented families. Our analysis demonstrate diminished expression, especially for late‐stage flavonoid pathway genes in lineages featuring betalain pigmentation. Lastly, for Hypothesis 4, we delved into the MYB‐bHLH‐WD40 (MBW) regulatory complex, examining it for gene loss patterns and site‐specific degeneration of complex‐forming residues specifically within betalain‐pigmented lineages. We observed relaxed selective pressures and gene loss in several constituents of the MBW complex, while residues within the bHLH interaction domain of PAP1 homologs displayed markedly higher divergence and greater diversity in betalain lineages compared with anthocyanin lineages. Overall, our results paint a complex picture supporting repeated anthocyanin loss and underpinned by multiple evolutionary mechanisms, including loss of a key synthetic enzyme and the apparent degeneration of regulatory complexes.
Materials and Methods
Data source and processing raw sequences
Some sequence data used in this study were transcriptome and genome assemblies from the One Thousand Plant Transcriptome (1KP) project (Matasci et al., 2014) with a larger data sample provided by Caryophyllales‐specific transcriptomic and genomic sampling projects (Walker et al., 2018; Pucker et al., 2020a). Additional transcriptome assemblies were generated based on publicly available RNA‐Seq datasets of Halostachys caspica, Myosoton aquaticum, Oxyria digyna, Achyranthes bidentata, Dysphania schraderiana, Hammada scoparia, Hololachna songarica, and Gymnocarpos przewalskii using a previously established protocol (Haak et al., 2018). Briefly, this involved trimming with Trimmomatic v.0.39 (Bolger et al., 2014) followed by an assembly with Trinity v.2.4 (Grabherr et al., 2011) with k = 25 and a prediction of peptide sequences (Haak et al., 2018). The completeness of the predicted peptides in transcriptome and genome assemblies was evaluated through the presence of well‐conserved Benchmarking Universal Single Copy Orthologs (Buscos) with Busco v.3 (Simão et al., 2015), run in protein mode with an e‐value cutoff of 1e‐3 and considering at most 10 hits on all predicted peptide sets using the ‘embryophyta odb9’ reference gene set (Zdobnov et al., 2017). Genomic or transcriptomic data were retrieved for a total of 357 species: 124 anthocyanin species and 233 betalain species. Of these, we retrieved RNA‐Seq datasets for 110 anthocyanin species and 187 betalain species. Of the RNA‐Seq datasets, the following passed filtering steps (discussed in the ‘Quantifying gene expression’ in the Material and Methods section): 1420 datasets from anthocyanin species and 2374 datasets from betalain species.
Identification of candidate sequences
To perform a comprehensive analysis of the flavonoid biosynthesis, a thorough annotation of sequences in transcriptome and genome assemblies is required. Annotation is based on sequence similarity to previously characterized sequences. Previously characterized protein sequences for each step in the flavonoid biosynthesis (Pucker et al., 2020b), modification, transport, and regulatory pathway including chalcone synthase (CHS), chalcone isomerase (CHI), flavanone 3‐hydroxylase (F3H), flavonoid 3′‐hydroxylase (F3′H), flavonoid 3′,5′‐hydroxylase (F3′5′H), flavonol synthase (FLS), flavone synthase (FNS), DFR, LDOX, leucoanthocyanidin reductase (LAR), anthocyanidin reductase (ANR), anthocyanidin 3‐O‐gucosyltransferase (A3GT), anthocyanin 5‐O‐gucosyltransferase (A5GT), flavonoid 3‐O‐glucosyltransferase (F3GT), glutathione S‐transferase (AN9/TT19), proton antiporter (MATE/TT12), ATP‐binding cassette protein 1 (ABC), autoinhibited H(+)‐ATPase isoform 10 (AHA10/TT13), subgroup 6 MYB75 PAP1, bHLH proteins EGL1, MYC1 and TT8, and WD40 protein TTG1 were used as baits (search queries) for the identification of candidate sequences with a high degree of similarity to baits. This collection of bait sequences was further extended by identification of orthologous sequences in datasets representing > 120 species of major plant lineages (NCBI and Phytozome datasets) based on a previously described approach (Yang et al., 2015). Smith–Waterman alignment‐based searches with Swipe v.2.0.12 (Rognes, 2011) were conducted against each transcriptome or genome assembly, and up to 100 hits per bait with a minimum bit score of 30 were considered in the initial step and manually refined through iterative construction of gene trees with FastTree2 (Price et al., 2010) and removal of sequences on long branches likely to represent distantly related or nonhomologous sequences. Next, the extended set of bait sequences was used to further identify candidate sequences in the Caryophyllales following the same iterative approach (Yang et al., 2015). Alignments are inferred with Mafft v.7.475 with default auto settings (Katoh & Standley, 2013). Trees are inferred with FastTree2 and manually reviewed for long branches, which were removed. Alignment and tree inference are repeated iteratively until no further long branches are identified.
Construction of phylogenetic trees
To confirm the phylogenetic identity of candidate sequences and to establish homology relationships, including both orthology and paralogy, we constructed phylogenetic trees for each family of candidate genes. For the construction of gene trees, peptide sequences of outgroup species and Caryophyllales were aligned via Mafft v.7.475 using default auto settings (Katoh & Standley, 2013). Next, the aligned amino acids were substituted with the corresponding codons using pxaa2cdn from Phyx (Brown et al., 2017). Alignment columns with occupancy below 10% were removed via Phyx (Brown et al., 2017) (pxclsq –p 0.1). RAxML‐NG v.0.9 (Kozlov et al., 2019) was used to generate final trees using the GTR + G model and 100 rounds of bootstrapping. Monophyletic or paraphyletic groups of sequences from a single species' transcriptome assemblies could represent true paralogs or isoforms and were reduced to one representative sequence using a publicly available script (Yang & Smith, 2014). Briefly, clusters of monophyletic sequences of a single species were identified and reduced to the single longest transcript in the cleaned alignment. Paraphyletic sequences that are at most one node away from the monophyletic cluster were also masked. Several iterations of tree building and manual cleaning were performed to generate the final gene trees. For example, exceptionally long branches on isolated sequences can sometimes indicate an alignment or annotation issue which escaped initial filtering, where difficult‐to‐explain long branches were recognized, and the alignment was manually examined to understand any issues – sequences which were clearly mis‐annotated on part of their length or otherwise suspiciously misaligned were manually removed. Additional outgroup sequences were included to distinguish between related gene families: stilbene synthases and other polyketide synthases for CHS, short‐chain dehydrogenases for DFR (Moummou et al., 2012). Sequences of closely related gene families were investigated in a joined alignment and tree to ensure proper assignment of the candidate sequences. F3′H and F3′5′H were investigated together as they are Cytochrome P450 enzymes located in two sister subfamilies CYP75A and CYP75B, respectively. F3H, FLS, and LDOX were analyzed together to clearly separate these closely related 2‐oxoglutarate‐dependent dioxygenase sequences. We used an overlap‐based approach to label duplication nodes in the gene tree, requiring at least two species to overlap between the two daughter clades to map a gene duplication event to a node, and therefore, only detect deeper level gene duplication events represented by at least two species in our taxon sampling.
Molecular evolution
To assess the signal of altered selection in betalain‐pigmented lineages relative to anthocyanin‐pigmented lineages, we used the branch model approach of Yang (1998), which compare a model with one ratio of nonsynonymous to synonymous substitution rate (dN/dS) for the whole tree to one which partitions the tree into background (anthocyanin) and foreground (betalain) branches, each with their own dN/dS ratio. We reasoned that wholesale loss of function in anthocyanin pathway homologs in betalain‐pigmented lineages would lead to relaxation of purifying selection across the gene and dN/dS at all sites to 1. Because these analyses can be computationally intractable and numerically unstable when the number of parameters exceeds the number of datapoints, we first subsampled each alignment by extracting the clade(s) corresponding to Caryophyllales and then subsampled the resulting tree using a strategy designed to maintain paralogous diversity (Sheehan et al., 2020), using the script subsample_by_paralog.py available from https://github.com/NatJWalker‐Hale/alignment_and_tree_tools. The output number of sequences was set to 100 (however, due to differing numbers of paralogues and the requirement to keep at least one sequence per family, the final sample size could differ). Matching sequences were aligned with Guidance2 in codon mode using Mafft (‐‐genafpair ‐‐maxiterate 1000; Katoh & Standley, 2013; Sela et al., 2015). Residues with a Guidance2 score lower than 0.6 were masked as Ns, and alignment columns with occupancy below 10% were removed with pxclsq (‐p 0.1). We reasoned that the tree from the full sequence set would likely be more accurate due to the beneficial impact of taxon sampling, so we paired the alignments with the subsampled trees from above. We labelled foreground branches in the trees using the following rules: the subtending branch and all descendant branches in any clade of exclusively betalain‐pigmented taxa, and any tips from betalain‐pigmented taxa, were labelled as foreground. All other branches were considered background. Codon models were fitted using Paml v.4.10.6 (Yang, 2007). We compared the fit of Model 0 (model = 0, NSsites = 0) and the branch model (model = 2, NSsites = 0), using a likelihood ratio test (LRT) assuming a null distribution of the test statistic of chi‐square with one degree of freedom. For PAP1α and PAP1β, because the Caryophyllales clades were very small, we inferred trees from the Guidance2‐masked alignments as above and labelled foreground branches as above. To complement this analysis, we used the RELAX method as implemented in HyPhy v.2.5.53 (Wertheim et al., 2015; Kosakovsky Pond et al., 2020), which fits a mixture model of sites under strong purifying, nearly neutral, and diversifying selection, and compares foreground to background branches by raising dN/dS to the power of a selective intensity parameter, K, which is < 1 under relaxed selection and > 1 under intensified selection. We compared model fit using the LRT of the RELAX null (K = 1) vs the alternative with K free to vary.
We reasoned those sites substituting because of relaxed selection in MYBs of the MBW complex would show divergent amino acid states and more variability in betalain lineages compared with anthocyanin lineages. We assessed the signal for site‐specific amino acid divergence by calculating the base‐2 Jensen–Shannon Divergence (JSD) between site‐specific amino acid frequencies for sequences from betalain‐pigmented and anthocyanin‐pigmented lineages with script calc_site_specific_divergence_aa_n_aln.py, which is 0 if the two groups have identical site‐specific amino frequencies at the site, and 1 if there is no overlap in state frequencies between the site. We assessed amino acid signals consistent with relaxed selection by calculating the effective number of amino acids (N eff; Johnson & Wilke, 2020) using the script calc_site_specific_aa_var.py, which scales from 1 to 20 depending on the number of amino acids and their frequencies represented at the site, such that sites with a larger number of different amino acids represented will have a higher N eff. Both scripts are available from https://github.com/NatJWalker‐Hale/alignment_and_tree_tools. We focused on the region of the PAP sequence inferred to contain the bHLH interacting domain (Zimmermann et al., 2004; Hatlestad et al., 2014; Sakuta et al., 2021), and compared sequences from Caryophyllales betalain‐pigmented taxa to sequences from all anthocyanin‐pigmented taxa, including non‐Caryophyllales outgroups.
Quantifying gene expression
To assess the relative expression of flavonoid pathway genes and their regulators in betalain‐pigmented vs anthocyanic lineages, we collated publicly available RNA‐Seq data. We collected a comprehensive set of 4071 publicly available RNA‐Seq datasets (i.e. individual sequencing runs) of the Caryophyllales (https://github.com/bpucker/CaryoAnthoBlock). While public RNA‐Seq datasets are a valuable resource, metadata about the experimental settings can be incomplete or inaccurate, for example the classification of DNA sequencing data as RNA‐Seq. Quantification of transcript abundances was performed for each sequencing run individually based on the best available assembly and annotation, as adjudged by gene space completeness assessed by Busco. As UTR annotation or representation in a transcriptome assembly is error‐prone, only coding sequences were used for the quantification of transcript abundances. kallisto v.0.44 was applied with default parameters to quantify read abundance (Bray et al., 2016). While Kallisto can automatically determine the necessary settings for paired‐end data sets, some parameters need to be specified for single‐end RNA‐Seq datasets. Because we generally do not know the fragment size in libraries of single‐end RNA‐Seq datasets, an average fragment size of 200 bp with a standard deviation of 100 bp was assumed for all samples. Individual count tables from each dataset were merged to generate one table per species and filtered using customized Python scripts (https://github.com/bpucker/CaryoAnthoBlock). Filtering steps were applied to exclude datasets that are likely not suitable for quantitative analyses. Substantial amount of reads in an RNA‐Seq experiment belong to a small number of highly abundant transcripts. Assessing the distribution of transcript abundances in an individual sample allowed the identification and removal of normalized libraries which are characterized by the depletion of abundant transcripts and other artifacts which would not be suitable for quantitative analyses. The proportion of expression assigned to the 100 most abundant transcripts (top100) was determined for all datasets. Cutoffs were identified based on the distribution of these values: Only datasets with > 10% and < 80% of the total transcript per million (TPM) assigned to the top100 transcripts were subjected to down‐stream analyses. Datasets failing these filter criteria would not be suitable for a quantitative analysis. 3933 RNA‐Seq datasets belonging to 301 species passed these filters. Where possible, only paired‐end datasets were considered, because these reads can be assigned to similar transcripts with higher confidence.
Gene expression was compared between anthocyanin‐pigmented and betalain‐pigmented lineages for all genes in the flavonoid biosynthesis. Because the number of data sets is highly variable between species, all species are represented by the mean of expression values of all valid samples. This reduction to one data point per species avoids an overrepresentation of species with many available data sets. The sum of the transcript abundances (TPMs) of all isoforms of a given flavonoid biosynthesis gene were added up per RNA‐Seq sample (Supporting Information Fig. S1). Isoforms are all sequences that were assigned to the same function in the pathway through steps described above (i.e. all sequences included in each homolog tree, including paralogues). The combination of large numbers of datasets generated for different tissues under various conditions results in a high level of noise. Thus, only strong systemic biological signal should emerge from the broad‐scale comparative analysis, with precise quantifications of gene expression differences among different lineages being infeasible. The average value representing each species comprises a species‐specific number of samples that have different levels of variability resulting from multiple sources, and we therefore did not attempt to model this intraspecies variability. As each species is represented with a single average expression value per gene in the comparison between pigmentation groups, the most abundant tissue type was identified for each species to approximate the tissue representing the majority signal. The available metadata were compared between anthocyanin‐pigmented and betalain‐pigmented groups to preclude the possibility that differences resulted from tissue sampling alone (Table S1).
Results
Hypothesis 1: wholesale gene loss in betalain‐pigmented lineages
We searched for 18 genes in the flavonoid pathway within our transcriptome and genome sequence assemblies and generated phylogenetic trees (Fig. S2) to explore relationships, gene loss, and gene duplication (Fig. S3): CHS, CHI, F3H, F3′H, F3′5′H, FLS, DFR, LDOX, LAR, ANR, A3GT, A5GT, F3GT, AN9, MATE, AHA10, and ABCC. The bulk of datasets used in this analysis are transcriptomic in origin and can only offer proof of gene presence, as apparent gene absence may simply be due to lack of expression. However, coupled with annotated genome assemblies representing three of the inferred transitions to betalain pigmentation (B. vulgaris, Mesembryanthemum crystallinum, and Carnegiea gigantea), the combined genomic and transcriptomic datasets are informative with respect to the broad‐scale patterns of low gene expression and/or loss (Fig. 3), for a heatmap version (see Fig. S4).
Fig. 3.

Detection of flavonoid biosynthesis genes in 357 Caryophyllales species summarized at the family level. Families are sorted by pigmentation state into anthocyanin‐ and betalain‐pigmented (blue = anthocyanin, purple = betalain) to highlight the consistent differences between pigment types. Generally, most genes of the flavonoid biosynthesis are present in most families. Only F3′5′H and TT19 are consistently missing from betalain‐producing families. Species with exceptionally well‐annotated contiguous genome sequences that represent the three betalain origins were included at the bottom in italics to add additional support to the pattern. CHS (naringenin‐chalcone synthase), CHI (chalcone isomerase), FNS (flavone synthase), FLS (flavonol synthase), F3H (flavanone 3‐hydroxylase), F3′H (flavonoid 3′‐hydroxylase), F3′5′H (flavonoid 3′,5′‐hydroxylase), DFR (dihydroflavonol 4‐reductase), LDOX (leucoanthocyanidin dioxygenase), LAR (leucoanthocyanidin reductase), ANR (anthocyanidin reductase), A3GT (anthocyanidin 3‐O‐glucosyltransferase), A5GT (anthocyanin 5‐O‐glucosyltransferase), F3GT (flavonoid 3‐O‐glucosyltransferase), TT19 (glutathione S‐transferase), MATE (proton antiporter), ABC (ATP binding cassette protein 1), and AHA10 (autoinhibited H(+)‐ATPase isoform 10). Black = presence in at least one transcriptome or genome assembly in the family, white = not detected in transcriptome and genome assemblies, white with a cross = absence (unable to detect in highly contiguous genome sequence). The number on the right‐hand side indicates the number of transcriptome and genome assemblies sampled (plain text) and the number of species (bold). Below the dotted line are three highly contiguous genome assemblies representing 3/4 of the putative betalain transitions.
In Fig. 3, we focused on evidence for deeper level gene loss with the gene data summarized at the level of family, in line with data on pigment status which is historically also summarized to family level. Because these patterns are represented at the family level, there may be sub‐familial or species‐specific patterns of loss that may be significant, but are not captured in this representation. In some anthocyanin‐pigmented families, we detected occasional sporadic gene absence without apparent phylogenetic pattern for: F3′5′H, LAR, F3GT, AN9, and MATE. Except for F3′5′H loss in Caryophyllaceae (which has high data coverage), these apparent gene absences in anthocyanic taxa usually appeared in lineages with very little transcriptomic coverage (median of 2 transcriptome assemblies) and therefore higher probability of stochastic lack of detection. In general, most flavonoid biosynthesis, decoration, and transport‐associated genes are maintained and expressed in betalain‐pigmented families. But in some betalain‐producing families that lack whole genome data, we were unable to find transcriptomic evidence for the following genes: F3GT, MATE, and AHA10 in Stegnospermataceae, CHI, F3H, and F3′H in Gisekiaceae; CHI, DFR, ANS, LAR, and ANR in Agdestidaceae; CHI, F3H, DFR and ANS in Sarcobataceae; ANS and LAR in Basellaceae; ANS, LAR and ANR in Portulacaceae. However, Stegnospermataceae, Gisekiaceae, Agdestidaceae, and Sarcobataceae are all monotypic families, comprising only a single species, and represented by a one or two transcriptome assemblies in our analyses, again representing a higher probability of lack of detection (Fig. 3).
Putative stochastic absences aside, two stronger patterns of gene absence emerge in relation to betalain‐pigmentation lineages. First, we found no evidence for the presence of F3′5′H in 15 out of 17 betalain‐pigmented families including in genome assemblies from B. vulgaris, M. crystallinum, and C. gigantea. Second, we recovered a striking pattern of repeated absence from transcriptome and genome assemblies for the protein TT19 in betalain‐pigmented lineages that could be explained by gene loss (Fig. 3). In the phylogenetic tree of TT19 orthologs (Fig. 4a), we recovered numerous sequences from anthocyanic noncore Caryophyllales species and core Caryophyllales anthocyanin‐pigmented Caryophyllaceae, Macarthuriaceae, and Kewaceae. Importantly, only anthocyanin‐pigmented species are represented in this tree, and no sequences were detected from a betalain‐pigmented species. These species represent independent betalain‐pigmented lineages, and our phylogenetic reconstruction supports the fact that TT19 orthologs have been separately and completely lost in multiple betalain lineages (Fig. 4b). The probability of missing TT19 by chance in all betalain‐pigmented families (0/17) if the proportion of absence in anthocyanin‐pigmented families (5/14) represents the probability of failing to detect TT19 when it is present, would be below 0.001 (binomial probability). This conservative estimation does not account for the better representation of betalain‐pigmented species within our datasets.
Fig. 4.
Loss of TT19 orthologs in betalain‐pigmented lineages. (a) A phylogenetic analysis revealed the presence of TT19 homologs in most anthocyanin‐pigmented Caryophyllales species, but the absence from all betalain‐pigmented species in 31 families sampled (gray = non‐Caryophyllales outgroups, black = noncore anthocyanic Caryophyllales, blue = anthocyanic core Caryophylales). (b) Parsimony‐based reconstruction of TT19 loss assuming losses are irreversible, and with the conservative assumption that absence of a gene from the transcriptome is not proof of absence. Black lines = presence, gray lines = ambiguous, dotted lines = loss, blue = anthocyanin, purple = betalain, black box = TT19 gene detected, gray box = no TT19 detected, crossed box = TT19 not detected in highly contiguous genome sequence, no box = missing data.
Hypothesis 2: loss or change in function in flavonoid pathway genes
We searched for molecular evolutionary signatures of relaxed selection consistent with loss of function in structural and transport genes using branch codon models which allow for a different ratio of synonymous and nonsynonymous substitutions between genes from anthocyanin‐pigmented and genes from betalain‐pigmented taxa, averaged over all codons in the alignment. Many genes in the pathway showed a significantly better fit of the two‐ratio model over the null model, and the dN/dS in betalain‐pigmented lineages tended to be elevated over anthocyanin‐pigmented lineages, but still < 1 so consistent with purifying selection (Table S2; Fig. 5). In these cases, the difference in dN/dS between anthocyanin‐ and betalain‐pigmented lineages was small, with the greatest increase (c. 0.23) observed for MYC1 (Fig. 5). The two‐ratio model did not offer significant improvement in fit for F3′5′H, LAR, A5GT, MATE, GL3, and TTG1, and consistently, the inferred difference in dN/dS between anthocyanin‐ and betalain‐pigmented lineages for these genes was very small. RELAX results were largely consistent, inferring significant relaxation of selection for all genes except F3′5′H, LAR, A3GT, MATE, PAP1β, GL3, and TTG1 (Table S3; Fig. S5). A5GT was inferred to be under intensified selection, consistent with the reduced average dN/dS in betalain lineages compared with anthocyanin lineages inferred from the branch model.
Fig. 5.

Signature of selection in flavonoid pathway genes in betalain vs anthocyanin lineages. Ratio of nonsynonymous to synonymous substitutions between 17 pathway genes (and 6 regulator genes – see later the Results section for description of these) from anthocyanin‐pigmented taxa (white circle with blue boundary) and genes from betalain‐pigmented taxa (filled purple circles; excluding TT19 as no recovered from betalain lineages) averaged over all codons in the alignment. CHS (naringenin‐chalcone synthase), CHI (chalcone isomerase), FNS (flavone synthase), FLS (flavonol synthase), F3H (flavanone 3‐hydroxylase), F3′H (flavonoid 3′‐hydroxylase), F3′5′H (flavonoid 3′,5′‐hydroxylase), DFR (dihydroflavonol 4‐reductase), LDOX (leucoanthocyanidin dioxygenase), LAR (leucoanthocyanidin reductase), and ANR (anthocyanidin reductase), A3GT (anthocyanidin 3‐O‐glucosyltransferase), A5GT (anthocyanin 5‐O‐glucosyltransferase), F3GT (flavonoid 3‐O‐glucosyltransferase), MATE (proton antiporter), ABC (ATP binding cassette protein 1), and AHA10 (autoinhibited H(+)‐ATPase isoform 10), PAP1α and PAP1β (subgroup 6 MYB transcription factors), GL3, MYC1, and TT8 (bHLH transcription factors) and TTG1 (WD40 protein). Several genes in betalain‐pigmented lineages show slightly elevated but significant dN/dS indicating slightly relaxed selection relative to anthocyanic lineages but still < 1, consistent with purifying selection. Likelihood ratio test (LRT) P‐values (see the Materials and Methods section): ns, not significant; **, P < 0.01; ***, P < 0.001.
Hypothesis 3: reduced expression of flavonoid pathway genes in betalain‐pigmented lineages
We observed a generally reduced transcript abundance in most genes in the flavonoid biosynthesis pathway in betalain‐pigmented vs anthocyanin‐pigmented species (Fig. 6). This observation was very common, but the differences are far more dramatic for some genes than others. This pattern is apparent for some early‐acting components (CHS, CHI, F3H, F3′H, and F3′5′H) but is especially pronounced for the late‐acting components (DFR, LDOX, LAR, ANR, MATE, and AHA10). This phenomenon was clearly visible in data representing the three putative betalain origins that were sampled. Although expression of later‐acting flavonoid biosynthesis genes leading to anthocyanins and proanthocyanidins are highly reduced in betalain‐pigmented species, several genes acting in other branches of the flavonoid biosynthesis show little reduction. For example, the flavonol biosynthesis gene FLS shows almost no difference between anthocyanic and betalain‐pigmented lineages. Although CHS transcript was observed at substantially lower abundance in betalain‐pigmented species, its abundance is still relatively high compared with other genes in the pathway, implying a substantial production of the key flavonoid substrate naringenin chalcone in betalain‐pigmented lineages.
Fig. 6.

Comparative analysis of flavonoid biosynthesis gene expression in the Caryophyllales. The gene expression in anthocyanin‐pigmented species (blue) is compared with the gene expression in species of three betalain transitions (pink) (see Fig. 1b for illustration of three origins). (a) CHS (naringenin‐chalcone synthase), (b) CHI (chalcone isomerase), (c) F3H (flavanone 3‐hydroxylase), (d) F3′H (flavonoid 3′‐hydroxylase), (e) F3′5′H (flavonoid 3′5′‐hydroxylase), (f) FLS (flavonol synthase), (g) FNS (flavone synthase), (h) DFR (dihydroflavonol 4‐reductase), (i) LDOX (leucoanthocyanidin dioxygenase), (j) LAR (leucoanthocyanidin reductase), (k) ANR (anthocyanidin reductase), (l) A3GT (anthocyanidin 3‐O‐gucosyltransferase), (m) A5GT (anthocyanidin 5‐O‐glucosyltransferase), (n) F3GT (flavonoid 3‐O‐glycosyltransferase), (o) TT19 (glutathione S‐transferase), (p) ABCC (ATP binding cassette protein 1), (q) MATE (proton antiporter), and (r) AHA10 (autoinhibited H(+)‐ATPase isoform 10). Blue = anthocyanin‐pigmented lineages, purple = betalain‐pigmented lineages. Boxplots within violin plots show median (white dot), interquartile range (black box), and maximum and minimum values excluding outliers (whiskers).
Hypothesis 4: loss and/or degeneration of the MBW complex in betalain‐pigmented lineages
Given the observed reduction in gene expression, especially in late‐acting components in the flavonoid pathways, we then examined the evolutionary fate of the MYB, bHLH, and WD40 transcription factors which together are known to regulate at least DFR and LDOX expression in the production of anthocyanins. Specifically, we searched for the following five genes in the flavonoid pathway within our transcriptome and genome sequence assemblies and generated phylogenetic trees (Fig. S6) to explore patterns of loss: PAP1, Glabrous3 (GL3), Transparent Testa 8 (TT8), Myelocytomatosis Oncogene 1 (MYC1), and Transparent Testa Glabra 1 (TTG1).
The WD40 TTG1 lineage is universally recovered in all betalain and anthocyanin families and shows no evidence of gene loss. Likewise, of the three bHLH lineages known to interact in the MBW complex, the TT8 bHLH lineage, which is implicated in proanthocyanidin pigmentation, is substantially present across all betalain and anthocyanin families (Fig. 7), aside from occasional absences in three families with more limited transcriptome data (Limeacee, Sarcobataceae, and Basellaceae). However, the other two bHLH lineages – the MYC1 and GL3/EGL3 lineages – show more evidence of absence from transcriptomes and corresponding whole genome sequences. MYC1 homologs were present in 12/14 anthocyanin‐pigmented families but only present in 8/17 betalain families. MYC1 homologs were not recovered from any transcriptomes emanating from Betalain Transition 3, consonant with its loss in the M. crystallinum genome (Fig. 7). The GL3 lineage is recovered in 13/14 anthocyanic families but only present in 9/17 betalain‐pigmented families and is not recovered from any transcriptomes emanating from Betalain Transition 2, consonant with its loss in B. vulgaris (Fig. 7).
Fig. 7.

Detection of components of the anthocyanin MBW complex in 357 Caryophyllales species summarized at the family level. Families are sorted by pigmentation state into anthocyanin‐ and betalain‐pigmented (blue = anthocyanin, purple = betalain) to highlight the consistent differences between pigment types. The detection of homologs of five components is reported: WD40 TTG1, bHLHs TT8, MYC1, and GL3, and MYB PAP1s (PAP1α and PAP1β). Black = presence in at least one transcriptome or genome assembly in the family, white = not detected in transcriptome or genome assemblies, white with a cross = absence unable to detect in most contiguous genome sequence. Number on the right‐hand side indicates the number of transcriptome and genome assemblies sampled (italics) and the number of species (bold). Below the dotted line are three highly contiguous genome assemblies representing 3/4 of the putative betalain transitions.
The PAP1 lineage shows a complex pattern of duplication across the eudicots, resulting in two paralogous lineages of PAP1 in Caryophyllales, which stem from a duplication preceding the origin of Caryophyllales, and which we have termed PAP1α and PAP1β (Fig. 8a). The PAP1α lineage is recovered in 9/14 anthocyanic families, but only present in 2/17 betalain families, and only recovered from transcriptome assemblies derived from Amaranthaceae and Chenopodiaceae, consistent with its presence in the B. vulgaris genome (Fig. 7). PAP1α was undetected from any transcriptome assemblies derived from Betalain Transitions 1, 3 and 4, consonant with their loss in the M. crystallinum and C. gigantea genomes. The PAP1β lineage, on the contrary, is only recovered from 6/14 anthocyanic families, and present in 11/17 betalain families. PAP1β homologs are not recovered from any transcriptome assemblies emanating from Betalain Transition 2, consonant with its loss in the B. vulgaris genome. Conversely, PAP1β homologs are only detected in families arising from Betalain Transitions 1, 3, and 4, consistent with their presence in the M. crystallinum and C. gigantea genomes. In summary, PAP1α and PAP1β exhibit reciprocal patterns of retention and loss that are a mirror image of each other (Fig. 8b).
Fig. 8.

Phylogeny of the Promoter of Anthocyanin Pigmentation 1 (PAP1) MYB lineage. (a) Phylogeny of the PAP1 lineage across eudicots revealing the existence of a deep duplication (marked with solid black circle) that gives rise to PAP1α and PAP1β clades, both of which are represented in Caryophyllales. (b) Phylogenies of the two paralogous PAP1 lineages (PAP1α and PAP1β), illustrating their differential and reciprocal patterns of loss and retention in the four transitions to betalains. Betalain branches are purple and anthocyanin branches are blue. Scale bars indicate the expected number of substitutions per site.
We then examined both PAP1α and PAP1β lineages, looking at the MYB‐bHLH interacting domain (N‐terminal, R3 repeat), which is essential for canonical MBW complex formation. Zimmermann et al. (2004) identified 15 residues within the R3 repeat that are essential in mediating the interaction of AtPAP75 and AtbHLH proteins (Fig. 9, positions: 1, 2, 5, 8, 10, 12, 13, 15, 17, 19, 20, 26, 32, 33, and 36). Hatlestad et al. (2014) analyzed PAP1α representative BvMYB1 from B. vulgaris and identified six residues which when mutagenized could restore the lost MYB‐bHLH interaction (Fig. 9, positions: 5, 6, 9, 10, 12, and 24). Sakuta et al. (2021) analyzed the PAP1β representative PgPAP1 and identified four residues in the interacting domain which when mutagenized could restore canonical PAP1 function (Fig. 9, positions: 5, 9, 13, 14, and 24). Combining existing functional data from site‐specific mutagenesis studies, in the context of our new phylogenetic resolution, the PAP1α and PAP1β lineages show convergence in degenerated interacting sites, at positions 6, 9, and 24. Applying bioinformatic approaches, we found further evidence for clear divergence (JSD) in the identity of residues found in betalain vs anthocyanin PAP1s, coupled with greater site‐specific variation (Neff) in betalain vs anthocyanin PAP1s. For PAP1α, sites showing elevated divergence and variation include 5, 6, 9, 10, 13, 14, 23, 24, and 36 (Fig. 9). For PAP1β, sites showing elevated divergence and variation include 6, 9, 13, 14, and 24. Based on bioinformatic signals, therefore, PAP1α and PAP1β showed additional patterns of convergence at sites 13 and 14. Both PAP1 lineages, MYC1, and TT8 all showed higher elevated dN/dS in betalain‐pigmented lineages compared with anthocyanin‐pigmented lineages, consistent with some relaxation of purifying selection, while GL3 and TTG1 did not (Fig. 5; Table S2).
Fig. 9.

Comparison of substitution patterns occurring in the R3 interacting domain of PAP1α and PAP1β homologs in betalain vs anthocyanic lineages. Residue‐level analysis of the 40‐amino acid R3 interacting domain from the study by Zimmermann et al. (2004). The figure presents the data for: (a) PAP1α and (b) PAP1β. Both proteins, PAP1α and PAP1β, feature: N eff (effective number of amino acids) plots, with anthocyanin in white and betalains in black; JSD (Jensen–Shannon Divergence) plots; and logo plots for both anthocyanic and betalain‐pigmented lineages. Central to the figure is a black‐and‐white matrix, highlighting residues (represented by back squares) that are crucial for MYB‐bHLH interactions. Their relevance has been backed by three distinct studies: Zimmermann et al. (2004) for AtPAP1, Hatlestad et al. (2014) for PAP1α, and Sakuta et al. (2021) for PAP1β. Furthermore, residues shown as consistently divergent and notably variable between betalain and anthocyanic lineages are also marked with black squares. These were deduced from the N eff, JSD, and logo analyses.
Discussion
Significant patterns of loss in TT19 and F3′5′H gene lineages within betalain‐pigmented families
Previously, the TT19 family of glutathione S‐transferases, including AN9 gene in Petunia hybrida and its TT19 ortholog in Arabidopsis thaliana, was primarily linked with anthocyanin transport and stabilization (Mueller et al., 2000). The prevalent model suggested that TT19 orthologs play a key role in shuttling anthocyanins from the endoplasmic reticulum to the tonoplast for further processing (Sun et al., 2012). However, a very recent study has revealed a different major function for the TT19 orthologs. Instead of transport, TT19 enzymes are now suggested to predominantly catalyze the dehydration of flavan‐3,3,4‐triol, a product of LDOX, to produce cyanidin (Eichenberger et al., 2023). This casts TT19 as a critical enzyme in the late stages of anthocyanin formation. This discovery adds significance to our finding of complete absence of TT19 orthologs in transcriptome assemblies and annotated genomes of betalain‐pigmented species, despite their detectable presence in three anthocyanin lineages within the core Caryophyllales. Notably, these orthologs are retained in Kewaceae, Caryophyllaceae, and Macarthuriaceae, logically as a plesiomophic state from a common ancestor. The absence in betalain species then implies that TT19 orthologs have been lost repeatedly in different betalain origins (Fig. 4b). In contrast to earlier research that relied on the presence of DFR and LDOX genes as late‐stage markers for a functioning anthocyanin synthesis pathway, our findings indicate that anthocyanin synthesis has in fact been repeatedly disrupted through the loss of the enzyme crucial for converting flavan‐3,3,4‐triol to anthocyanidin.
The repeated loss of TT19 orthologs impacts on our understanding of the directionality in pigment trait evolution. Previously, the maintenance but restricted expression of flavonoid synthesis genes, LDOX and DFR, in the proanthocyanidin‐pigmented seed coats of betalain‐pigmented species was inferred to give a clear evolutionary mechanism for multiple reversals back to anthocyanin pigmentation from a betalain ancestor (Fig. 1a), that is restoring broader expression patterns of LDOX and DFR could restore anthocyanin biosynthesis, assuming presence of all other components of the pathway. However, recent research by Sakuta et al. (2021) complicates this narrative. Their work shows that anthocyanin pigmentation in betalain‐pigmented A. myriostigma can only be reinstated through the heterologous expression of DFR and LDOX when it is accompanied by the heterologous expression of PhAN9, the TT19 ortholog from P. hybrida. Our discovery of the repeated loss of TT19 orthologs in betalain‐pigmented lineages supports the findings of Sakuta et al. (2021) and suggests a pattern of recurrent loss of anthocyanins in core Caryophyllales, consistent with the hypothesis of repeated specialization to betalain pigmentation (Sheehan et al., 2020).
The enzymes F3′H and F3′5′H play pivotal roles in the flavonoid biosynthesis pathway, specifically at branch points where they convert dihydrokaempferol to either dihydroquercetin or dihydromyricetin, respectively. Both are Cytochrome P450 enzymes, with F3′H belonging to the CYP75B subfamily and F3′5′H to the CYP75A subfamily (Yonekura‐Sakakibara et al., 2019). In our study, F3′H was universally present across all examined families (23/23 families), while F3′5′H from the CYP75A lineage was conspicuously absent in from most core Caryophyllales lineages (17/23 families), including almost all betalain‐pigmented lineages (15/17 families). This absence was further corroborated by the three highly contiguous genomes (Fig. 3). Dihydromyricetin, the product of F3′5′H activity, can be converted to myricetin‐derived flavonols, and consistent with the loss of F3′5′H orthologs, Caryophyllales predominantly produce quercetin‐type flavonoids via F3′H, rather than the myricetin‐type flavonoids, which are dependent on F3′5′H, and are notably rare (Iwashina, 2015). Dihydromyricetin, produced by F3′5′H activity, also serves as a critical precursor for the blue anthocyanin delphinin. Prior studies have documented the rapid pseudogenization and deletion of F3′5′H in species transitioning from delphinin‐based blue to red‐colored flowers, highlighting its evolutionary significance for blue anthocyanin production in flowers (Smith & Rausher, 2011; Wessinger & Rausher, 2014; Ho & Smith, 2016). Given the widespread loss or downregulation of F3′5′H, it is notable that blue flowers are completely absent in all betalain‐pigmented species, and extremely rare even among anthocyanic Caryophyllaceae species. One interpretation might be that the rare occurrence of blue flowers has led to reduced evolutionary pressure to maintain the F3′5′H enzyme. This, in turn, has a cascading effect, resulting in not only a lack of dihydromyricetin‐derived delphinidin but also a paucity of other myricetin‐derived flavonoids. However, the presence of F3′5′H in some betalain lineages suggests that its loss is not an early, singular event but occurs multiple times toward the tips of the phylogeny. In general, widespread loss of F3′5′H adds a layer of complexity to our understanding of flavonoid biosynthesis and its evolutionary trajectory within Caryophyllales.
Little evidence for significant altered or loss of function in maintained flavonoid biosynthesis genes within betalain‐pigmented species
Recent work proposed that a truncation in the anthocyanin biosynthesis gene LDOX could account for the absence of anthocyanins in the betalain‐pigmented species M. jalapa (Polturak et al., 2018). Although all genes for anthocyanin biosynthesis are expressed in M. jalapa flowers, no anthocyanins appear, a phenomenon attributed to a truncated form of MjANS (aka LDOX) that failed to complement an A. thaliana ans/ldox mutant (Polturak et al., 2018). However, contrary to this, our findings indicate the existence of an LDOX gene duplication within the Nyctaginaceae family, resulting in two distinct clades. One of these clades includes the truncated MjANS previously detected in M. jalapa, but both clades contain full‐length ANS versions as well (Figs S3, S7). M. jalapa itself has both truncated and full‐length ANS variants. Given this, we argue that ANS functional loss is probably not the reason for the total absence of anthocyanins in M. jalapa. More broadly, our data shows that most betalain‐pigmented species possess a full‐length LDOX gene, with no clear genomic evidence supporting a widespread loss of LDOX functionality through frame‐shifting mutations or significant indels.
Looking beyond LDOX, we used codon models to explore the signal of relaxed selection indicative of loss of function in other genes in the pathway. We found that branches derived from betalain‐pigmented lineages generally showed elevated dN/dS compared with branches from anthocyanin‐pigmented lineages, when averaging over all codons. The increase in dN/dS we observe could be consistent with relaxed purifying selection in betalain‐pigmented lineages. However, the observed differences are small, with none of the values were above one, indicating that purifying selection is still occurring, and total loss of function is unlikely. Because these branch models average over codons, it is difficult to say exactly from where this signal is derived. For example, the increase in dN/dS could also be explained by a small number of sites experiencing positive selection in foreground branches. Because many of the genes we examined experienced gene duplications in Caryophyllales, and we have not discriminated between paralogs, it is possible that bursts of amino acid substitution associated with neo‐ or subfunctionalization in foreground branches could mislead these tests. On the contrary, RELAX analyses suggested that diversifying selection was frequently also reduced in betalain‐pigmented lineages, but most sites were still inferred to be evolving under strong purifying selection, which likewise suggests that wholesale loss of function in these loci is unlikely.
In general, evidence would also seem to suggest that widescale loss of function is unlikely. Shimada et al. (2004, 2005) characterized LDOX and DFR from S. oleracea (Amaranthaceae s. l.) and P. americana (Phytolaccaceae) and showed that the genes maintained their canonical function when expressed in Escherichia coli. This is in line with expectations based on the widescale maintenance of these homologs in the genomes of betalain‐pigmented taxa. Furthermore, because Caryophyllales still produce proanthocyanidins in the seed, these functions are still required. Similarly, some Caryophyllales still produce most other types of flavonoids (Iwashina, 2015), and it seems likely the functional copies of most of the pathway genes are required to produce these compounds. Therefore, despite the potential signal of marginal relaxed selection, we assess loss or change in gene function across the pathway to be very unlikely, outside the wholesale gene loss previously discussed.
Numerous flavonoid biosynthesis genes show reduced expression in betalain‐pigmented lineages
Before delving into the discussion of our comparative expression analyses, it is necessary to acknowledge the constraints of our study. First, the RNA‐Seq data sets we utilized were not generated with our specific research objectives and analytical approaches in mind, a common limitation in bioinformatic reanalysis. However, the broad range of species and tissue types represented in these publicly available datasets surpasses what could realistically be collected in a single study. Despite this benefit, inconsistencies exist, including varying numbers of RNA‐Seq datasets across species and uneven sampling across tissues, developmental stages, and stress conditions. Moreover, the lack of corresponding metabolite data precludes the correlation of gene expression patterns with target flavonoids. Complicating matters further, recurrent gene duplication events (Fig. S3) necessitated the integration of expression values across multiple paralogs, many of which were identified for the first time in this study. It is reassuring, however, that the macroevolutionary trends we report appear to be devoid of systematic bias as certain genes like FLS deviate from patterns observed in other flavonoid biosynthesis genes. While providing valuable qualitative insights, these analyses serve as a preliminary global examination of flavonoid pathway gene expression and should be interpreted cautiously.
From our analysis, we note a generally reduced expression of most genes involved in the anthocyanin pathway in betalain‐pigmented species compared with anthocyanin‐pigmented counterparts. This reduction is evident across three evolutionary transitions for which sufficient RNA‐Seq data was available. While the expression of early‐acting components such as CHS, CHI, F3H, F3′H, and F3′5′H is modestly reduced, a more marked decrease is seen in late‐acting components including DFR, LAR, ANR, MATE, and AHA10. This observation aligns with earlier research suggesting that the loss of anthocyanin pigmentation is often linked to cis‐ and/or trans‐regulatory changes in enzymatic genes (Shimada et al., 2004, 2005, 2007; Streisfeld & Rausher, 2011; Hatlestad et al., 2014; Larter et al., 2018; Sakuta et al., 2021; Wheeler et al., 2022, 2023). Interestingly, not all flavonoid biosynthesis genes follow this trend. For example, consistent expression levels of FLS and FNS, along with glycosylation enzymes A3GT, A5GT, and F3GT, are maintained in betalain‐pigmented lineages. This indicates that the observed expression patterns are not merely artifacts or biases in the data. The substrate versatility of glycosylation enzymes has been well‐documented, and some are known to modify betalains (Vogt et al., 1999; Vogt, 2002). Therefore, the stable expression of these genes between the two pigment types is not unexpected. Lastly, the sustained high expression of FLS and FNS in betalain‐pigmented species may reflect the ongoing presence of flavonols and flavonones. This suggests that the metabolic flux toward flavonols and flavonones may account for the maintained expression levels of these genes.
The observed overall decline in gene expression across the flavonoid biosynthesis pathway, including early‐acting components, raises intriguing questions, especially because betalain‐pigmented species still synthesize flavonols and flavones. One possible explanation for this widespread reduction in gene expression may relate to a metabolic shift within core Caryophyllales, specifically from phenylalanine‐derived to tyrosine‐derived pathways (Lopez‐Nieves et al., 2018). This shift is potentially facilitated by a gene duplication event that led to a novel isoform of arogenate dehydrogenase (ADHα). Unlike its ancestral form, ADHα lacks feedback sensitivity and promotes tyrosine over phenylalanine production in heterologous assays using Nicotiana benthamiana (Lopez‐Nieves et al., 2018). Such an isoform could constrain the availability of phenylalanine, contributing to the observed reduced gene expression in the flavonoid pathway. Alternatively, the diminished demand for naringenin chalcone, owing to the absence of anthocyanin as a final product, might be sufficient to account for the lower expression levels.
Repeated gene loss and convergent degeneration within the anthocyanin MBW transcription factor complex in betalain‐pigmented lineages
The evolutionary trajectory of the MYB‐bHLH‐WDR (MBW) complex within Caryophyllales presents intriguing features that merit close examination. Hatlestad et al. (2014) showed that BvPAP1 (here termed PAP1α) in B. vulgaris has lost the ability to interact with heterologous bHLH partners and attributed the loss of anthocyanins in B. vulgaris to this lost MYB‐bHLH interactivity. However, because Hatlestad et al. (2014) used heterologous Arabidopsis bHLH partners to test the BvPAP1/bHLH interaction, the fate of the native bHLH partners was never clearly articulated. Yet, the bHLH lineages, GL3 and MYC1, show interesting patterns of absence and/or loss. For example, we show that the GL3 ortholog, which normally partners with PAP1 to regulate anthocyanin production has been completely lost in B. vulgaris, reinforcing the concept that the canonical anthocyanin MBW complex has thoroughly disintegrated in all taxa within betalain transition 2 (Amaranthaceae). However, this is not the case for taxa associated with other transitions, for example, despite patchy recovery overall, GL3 homologs appear to be present in all data‐rich families and genomes within betalain transitions 3 and 4. The MYC1 lineage meanwhile shows an intriguing pattern, being consistently absent from all transcriptome and genome assemblies associated with betalain transition 3. Lastly, for comparison, the homologs of TT8 bHLH which partner with the MYB TT2 to regulate proanthocyanidin production are highly recovered in our data, consistent with the continued presence of proanthocyanidins in betalain‐pigmented lineages.
Hatlestad et al. (2014) showed that BvPAP1 alone can regulate betalain synthesis, independent of an MBW complex. However, here we report that orthologs of BvPAP1, that is the PAP1α lineage, are undetectable in any other betalain lineages and have been lost in genomes representing betalain transitions 3 and 4. In the absence of BvPAP1 orthologs (the PAP1α lineage), one can reasonably infer that nonhomologous mechanisms regulating betalain pigmentation must exist in at least the whole‐genome betalain species (M. crystallinum and C. gigantea), and this inference may reasonably extend to all related taxa occurring within the same transitions to betalain pigmentation (i.e. transitions 3 and 4). Given the presence of PAP1α orthologs in both anthocyanic Kewaceae and Macarthuriaeae, one can infer at least two independent losses of PAP1α, which, in line with TT19 losses, is consistent with multiple separate losses of anthocyanins. However, we show that there are two paralogous lineages of PAP1 in Caryophyllales. Although the PAP1α lineage appears to have been repeatedly lost, the reciprocal retention of the paralogous lineage PAP1β, in mirror image to the PAP1α losses, remains intriguing. Even more so, because PAP1β homologs show convergent patterns of residue substitutions, seen also in PAP1α at sites that have been shown to be influential in mediating MYB‐bHLH interactions (Sakuta et al., 2021), perhaps indicating a similar loss of PAP1/bHLH interaction in the PAP1β lineage. Although in contrast to lineages with PAP1α, canonical partners such as GL3 homologs are retained in taxa also possessing PAP1β. Although they have been implicated in anthocyanin regulation (Sakuta et al., 2021), the function and significance of PAP1β homologs is less well understood and merits further investigation.
Conclusion
In summary, our bioinformatic analyses corroborate three of the four postulated genetic mechanisms responsible for the disappearance of anthocyanins in betalain‐pigmented lineages. Specifically, these mechanisms include the elimination of TT19 orthologs (Hypothesis 1), diminished expression of flavonoid pathway elements such as DFR and LDOX (Hypothesis 3), and the degradation of the canonical MBW complex (Hypothesis 4). Notably, we demonstrate recurrent instances of TT19 ortholog loss and MBW complex degeneration, often coinciding with shifts to betalain pigmentation. Some of these mechanisms seem more decisive than others in terms of anthocyanin loss, and the newly annotated role of lost TT19 orthologs in anthocyanidin synthesis in particular overturn the long‐standing belief that all structural aspects of anthocyanin synthesis are maintained in betalain‐pigmented lineages. Although our data do not clarify the sequential order of these evolutionary changes, they significantly influence our understanding of the directionality in pigment evolution. Overall, our findings not only validate multiple evolutionary shifts from anthocyanin to betalain pigmentation but also question the likelihood of reversals from betalain to anthocyanin pigmentation. Broadly speaking, this research builds on the rich literature on the molecular evolution of the anthocyanin pathway, highlighting that late‐stage enzymatic steps and corresponding regulatory complexes emerge as prime targets for evolutionary modification at macroevolutionary timescales, consistent with trends observed at microevolutionary levels.
Competing interests
None declared.
Author contributions
BP and SFB conceived the work. WCY and JCC provided unpublished genomic resources. BP and NW‐H conducted analyses with support from JD, AC and YY. SFB, BP and NW‐H prepared the figures. SFB and NW‐H wrote the manuscript, with methods contributed by BP. All authors read and approved the manuscript. BP and NW‐H are joint first authors for this work.
Supporting information
Fig. S1 Illustration of the cross‐species gene expression calculation that forms the basis of Fig. 6.
Fig. S2 Phylogenetic trees of the 18 flavonoid biosynthesis and flavonoid transport genes.
Fig. S3 Summary of flavonoid biosynthesis gene duplications in the Caryophyllales.
Fig. S4 Heatmap of frequency of presence of flavonoid biosynthesis genes in 357 Caryophyllales species summarized at the family level.
Fig. S5 Plots of RELAX alternative model fits showing dN/dS and site proportions of each site class for reference anthocyanin branches and test betalain branches.
Fig. S6 Phylogenetic trees of six components that can contribute to the MBW complex.
Fig. S7 Analyses of Mirabilis jalapa ANS gene copies.
Table S1 Comparison of RNA‐Seq tissue types between anthocyanin‐pigmented and betalain‐pigmented plants.
Table S2 Values for the ratio of synonymous and nonsynonymous substitutions between 23 genes from anthocyanin‐pigmented and genes from betalain‐pigmented taxa.
Table S3 Log likelihoods, information criteria, and parameter estimates of null, alternative, and partitioned descriptive models for RELAX analyses.
Please note: Wiley is not responsible for the content or functionality of any Supporting Information supplied by the authors. Any queries (other than missing material) should be directed to the New Phytologist Central Office.
Acknowledgements
We thank several anonymous reviewers for their greatly appreciated insight and comments that improved the manuscript over several rounds of peer review. We thank members of the Brockington Lab for the discussion and careful reading of the manuscript. We thank the Center for Biotechnology (CeBiTec) at Bielefeld University and de.NBI (031A532B, 031A533A, 031A533B, 031A534A, 031A535A, 031A537A, 031A537B, 031A537C, 031A537D, and 031A538A) for providing an environment for computational analyses. We thank Benoit van der Rest for sharing a collection of SDR sequences and Andrea Berardi for helpful discussion. We thank all colleagues and the wider community who performed sequencing studies in the Caryophyllales and shared raw data that enabled this analysis. We acknowledge support from the following funding bodies: BP, Deutsche Forschungsgemeinschaft (DFG, German Research Foundation) – 436841671; NW‐H, Woolf Fisher Cambridge Scholarship; JCC, DOE, GSP DE‐SC0008834; SFB, BBSRC High Value Chemicals from Plants Network; AC, SFB and YY, National Science Foundation NSFDEB‐NERC award no. 1939226.
Data availability
RNA‐Seq data sets analyzed in this study are available at the SRA/ENA. A list of the analyzed data sets, Fasta files containing bait sequences and sequences identified in this study, and Python scripts developed for this study are available at github: https://github.com/bpucker/CaryoAnthoBlock.
References
- Bate‐Smith E. 1962. The phenolic constituents of plants and their taxonomic significance. Botanical Journal of the Linnean Society 58: 95–173. [Google Scholar]
- Bolger AM, Lohse M, Usadel B. 2014. Trimmomatic: a flexible trimmer for Illumina sequence data. Bioinformatics 30: 2114–2120. [DOI] [PMC free article] [PubMed] [Google Scholar]
- Bray NL, Pimentel H, Melsted P, Pachter L. 2016. Near‐optimal probabilistic RNA‐seq quantification. Nature Biotechnology 34: 525–527. [DOI] [PubMed] [Google Scholar]
- Brockington SF, Walker RH, Glover BJ, Soltis PS, Soltis DE. 2011. Complex pigment evolution in the Caryophyllales. New Phytologist 190: 854–864. [DOI] [PubMed] [Google Scholar]
- Brockington SF, Yang Y, Gandia‐Herrero F, Covshoff S, Hibberd JM, Sage RF, Wong GKS, Moore MJ, Smith SA. 2015. Lineage‐specific gene radiations underlie the evolution of novel betalain pigmentation in Caryophyllales. New Phytologist 207: 1170–1180. [DOI] [PMC free article] [PubMed] [Google Scholar]
- Brown JW, Walker JF, Smith SA. 2017. Phyx: phylogenetic tools for unix. Bioinformatics 33: 1886–1888. [DOI] [PMC free article] [PubMed] [Google Scholar]
- Chater CCC, Caine RS, Fleming AJ, Gray JE. 2017. Origins and evolution of stomatal development. Plant Physiology 174: 624–638. [DOI] [PMC free article] [PubMed] [Google Scholar]
- Clement JS, Mabry TJ. 1996. Pigment evolution in the Caryophyllales: a systematic overview. Botanica Acta 109: 360–367. [Google Scholar]
- Coburn RA, Griffin RH, Smith SD. 2015. Genetic basis for a rare floral mutant in an Andean species of Solanaceae. American Journal of Botany 102: 264–272. [DOI] [PubMed] [Google Scholar]
- Doyle JJ. 1998. Phylogenetic perspectives on nodulation: evolving views of plants and symbiotic bacteria. Trends in Plant Science 3: 473–478. [Google Scholar]
- Duncan TM, Rausher MD. 2020. Selection favors loss of floral pigmentation in a highly selfing morning glory. PLoS ONE 15: e0231263. [DOI] [PMC free article] [PubMed] [Google Scholar]
- Eichenberger M, Schwander T, Hüppi S, Kreuzer J, Mittl PRE, Peccati F, Jiménez‐Osés G, Naesby M, Buller RM. 2023. The catalytic role of glutathione transferases in heterologous anthocyanin biosynthesis. Nature Catalysis: 1–12. doi: 10.1038/s41929-023-01018-y. [DOI] [PMC free article] [PubMed] [Google Scholar]
- Gates DJ, Olson BJSC, Clemente TE, Smith SD. 2018. A novel R3 MYB transcriptional repressor associated with the loss of floral pigmentation in Iochroma. New Phytologist 217: 1346–1356. [DOI] [PubMed] [Google Scholar]
- Grabherr MG, Haas BJ, Yassour M, Levin JZ, Thompson DA, Amit I, Adiconis X, Fan L, Raychowdhury R, Zeng Q et al. 2011. Trinity: reconstructing a full‐length transcriptome without a genome from RNA‐Seq data. Nature Biotechnology 29: 644–652. [DOI] [PMC free article] [PubMed] [Google Scholar]
- Griesmann M, Chang Y, Liu X, Song Y, Haberer G, Crook MB, Billault‐Penneteau B, Lauressergues D, Keller J, Imanishi L et al. 2018. Phylogenomics reveals multiple losses of nitrogen‐fixing root nodule symbiosis. Science 361: eaat1743. [DOI] [PubMed] [Google Scholar]
- Haak M, Vinke S, Keller W, Droste J, Rückert C, Kalinowski J, Pucker B. 2018. High quality de novo transcriptome assembly of Croton tiglium . Frontiers in Molecular Biosciences 5: 62. [DOI] [PMC free article] [PubMed] [Google Scholar]
- Harris BJ, Harrison CJ, Hetherington AM, Williams TA. 2020. Phylogenomic evidence for the monophyly of bryophytes and the reductive evolution of stomata. Current Biology 30: 2001–2012. [DOI] [PubMed] [Google Scholar]
- Hatlestad GJ, Akhavan NA, Sunnadeniya RM, Elam L, Cargile S, Hembd A, Gonzalez A, McGrath JM, Lloyd AM. 2014. The beet Y locus encodes an anthocyanin MYB‐like protein that activates the betalain red pigment pathway. Nature Genetics 47: 92–96. [DOI] [PubMed] [Google Scholar]
- Ho WW, Smith SD. 2016. Molecular evolution of anthocyanin pigmentation genes following losses of flower color. BMC Evolutionary Biology 16: 98. [DOI] [PMC free article] [PubMed] [Google Scholar]
- Iwashina T. 2015. Flavonoid properties in plant families synthesizing betalain pigments (review). Natural Product Communications 10: 1103–1114. [PubMed] [Google Scholar]
- Johnson MM, Wilke CO. 2020. Site‐specific amino acid distributions follow a universal shape. Journal of Molecular Evolution 88: 731–741. [DOI] [PMC free article] [PubMed] [Google Scholar]
- Katoh K, Standley DM. 2013. Mafft multiple sequence alignment software v.7: improvements in performance and usability. Molecular Biology and Evolution 30: 772–780. [DOI] [PMC free article] [PubMed] [Google Scholar]
- Kosakovsky Pond SL, Poon AFY, Velazquez R, Weaver S, Hepler NL, Murrell B, Shank SD, Magalis BR, Bouvier D, Nekrutenko A et al. 2020. HyPhy 2.5 – a customizable platform for evolutionary hypothesis testing using phylogenies. Molecular Biology and Evolution 37: 295–299. [DOI] [PMC free article] [PubMed] [Google Scholar]
- Kozlov AM, Darriba D, Flouri T, Morel B, Stamatakis A. 2019. RAxML‐NG: a fast, scalable and user‐friendly tool for maximum likelihood phylogenetic inference. Bioinformatics 35: 4453–4455. [DOI] [PMC free article] [PubMed] [Google Scholar]
- Larter M, Dunbar‐Wallis A, Berardi AE, Smith SD. 2018. Convergent evolution at the pathway level: predictable regulatory changes during flower color transitions. Molecular Biology and Evolution 35: 2159–2169. [DOI] [PubMed] [Google Scholar]
- Lin C, Xing P, Jin H, Zhou C, Li X, Song Z. 2022. Loss of anthocyanidin synthase gene is associated with white flowers of Salvia miltiorrhiza Bge. f. alba, a natural variant of S. miltiorrhiza . Planta 256: 15. [DOI] [PubMed] [Google Scholar]
- Lopez‐Nieves S, Yang Y, Timoneda A, Wang M, Feng T, Smith SA, Brockington SF, Maeda HA. 2018. Relaxation of tyrosine pathway regulation underlies the evolution of betalain pigmentation in Caryophyllales. New Phytologist 217: 896–908. [DOI] [PubMed] [Google Scholar]
- Mabry T. 1964. The betacyanins, a new class of red violet pigments, and their phylogenetic significance. New York, NY, USA: Roland Press. [Google Scholar]
- Matasci N, Hung L‐H, Yan Z, Carpenter EJ, Wickett NJ, Mirarab S, Nguyen N, Warnow T, Ayyampalayam S, Barker M et al. 2014. Data access for the 1,000 Plants (1KP) project. GigaScience 3: 17. [DOI] [PMC free article] [PubMed] [Google Scholar]
- Moummou H, Kallberg Y, Tonfack LB, Persson B, van der Rest B. 2012. The Plant Short‐Chain Dehydrogenase (SDR) superfamily: genome‐wide inventory and diversification patterns. BMC Plant Biology 12: 219. [DOI] [PMC free article] [PubMed] [Google Scholar]
- Mueller LA, Goodman CD, Silady RA, Walbot V. 2000. AN9, a petunia glutathione S‐transferase required for anthocyanin sequestration, is a flavonoid‐binding protein. Plant Physiology 123: 1561–1570. [DOI] [PMC free article] [PubMed] [Google Scholar]
- Polturak G, Heinig U, Grossman N, Battat M, Leshkowitz D, Malitsky S, Rogachev I, Aharoni A. 2018. Transcriptome and metabolic profiling provides insights into betalain biosynthesis and evolution in Mirabilis jalapa . Molecular Plant 11: 189–204. doi: 10.1016/j.molp.2017.12.002. [DOI] [PubMed] [Google Scholar]
- Pressel S, Goral T, Duckett JG. 2014. Stomatal differentiation and abnormal stomata in hornworts. Journal of Bryology 36: 87–103. [Google Scholar]
- Price MN, Dehal PS, Arkin AP. 2010. FastTree 2 – approximately maximum‐likelihood trees for large alignments. PLoS ONE 5: e9490. [DOI] [PMC free article] [PubMed] [Google Scholar]
- Pucker B, Feng T, Brockington SF. 2020a. Next generation sequencing to investigate genomic diversity in Caryophyllales. bioRxiv . doi: 10.1101/646133. [DOI]
- Pucker B, Reiher F, Schilbert HM. 2020b. Automatic identification of players in the flavonoid biosynthesis with application on the biomedicinal plant Croton tiglium . Plants 9: 1103. [DOI] [PMC free article] [PubMed] [Google Scholar]
- Rasmussen DA, Kramer EM, Zimmer EA. 2009. One size fits all? Molecular evidence for a commonly inherited petal identity program in Ranunculales. American Journal of Botany 96: 96–109. [DOI] [PubMed] [Google Scholar]
- Rognes T. 2011. Faster Smith‐Waterman database searches with inter‐sequence SIMD parallelisation. BMC Bioinformatics 12: 221. [DOI] [PMC free article] [PubMed] [Google Scholar]
- Sakuta M, Tanaka A, Iwase K, Miyasaka M, Ichiki S, Hatai M, Inoue YT, Yamagami A, Nakano T, Yoshida K et al. 2021. Anthocyanin synthesis potential in betalain‐producing Caryophyllales plants. Journal of Plant Research 134: 1335–1349. [DOI] [PMC free article] [PubMed] [Google Scholar]
- Sela I, Ashkenazy H, Katoh K, Pupko T. 2015. Guidance2: accurate detection of unreliable alignment regions accounting for the uncertainty of multiple parameters. Nucleic Acids Research 43: W7–W14. [DOI] [PMC free article] [PubMed] [Google Scholar]
- Sharma B, Guo C, Kong H, Kramer EM. 2011. Petal‐specific subfunctionalization of an APETALA3 paralog in the Ranunculales and its implications for petal evolution. New Phytologist 191: 870–883. [DOI] [PubMed] [Google Scholar]
- Sheehan H, Feng T, Walker‐Hale N, Lopez‐Nieves S, Pucker B, Guo R, Yim WC, Badgami R, Timoneda A, Zhao L et al. 2020. Evolution of l‐DOPA 4,5‐dioxygenase activity allows for recurrent specialisation to betalain pigmentation in Caryophyllales. New Phytologist 227: 914–929. [DOI] [PMC free article] [PubMed] [Google Scholar]
- Shimada S, Inoue YT, Sakuta M. 2005. Anthocyanidin synthase in non‐ anthocyanin‐producing Caryophyllales species. The Plant Journal 58: 950–959. [DOI] [PubMed] [Google Scholar]
- Shimada S, Otsuki H, Sakuta M. 2007. Transcriptional control of anthocyanin biosynthetic genes in the Caryophyllales. Journal of Experimental Botany 58: 957–967. [DOI] [PubMed] [Google Scholar]
- Shimada S, Takahashi K, Sato Y, Sakuta M. 2004. Dihydroflavonol 4‐reductase cDNA from non‐anthocyanin‐producing species in the Caryophyllales. Plant and Cell Physiology 45: 1290–1298. [DOI] [PubMed] [Google Scholar]
- Simão FA, Waterhouse RM, Ioannidis P, Kriventseva EV, Zdobnov EM. 2015. Busco: assessing genome assembly and annotation completeness with single‐copy orthologs. Bioinformatics 31: 3210–3212. [DOI] [PubMed] [Google Scholar]
- Smith SD, Rausher MD. 2011. Gene loss and parallel evolution contribute to species difference in flower color. Molecular Biology and Evolution 28: 2799–2810. [DOI] [PMC free article] [PubMed] [Google Scholar]
- Stafford HA. 1994. Anthocyanins and betalains: evolution of the mutually exclusive pathways. Plant Science 101: 91–98. doi: 10.1016/0168-9452(94)90244-5. [DOI] [Google Scholar]
- Streisfeld MA, Rausher MD. 2011. Population genetics, pleiotropy, and the preferential fixation of mutations during adaptive evolution. Evolution 65: 629–642. [DOI] [PubMed] [Google Scholar]
- Sun Y, Li H, Huang J‐R. 2012. Arabidopsis TT19 functions as a carrier to transport anthocyanin from the cytosol to tonoplasts. Molecular Plant 5: 387–400. [DOI] [PubMed] [Google Scholar]
- Vogt T. 2002. Substrate specificity and sequence analysis define a polyphyletic origin of betanidin 5‐ and 6‐O‐glucosyltransferase from Dorotheanthus bellidiformis . Planta 214: 492–495. [DOI] [PubMed] [Google Scholar]
- Vogt T, Grimm R, Strack D. 1999. Cloning and expression of a cDNA encoding betanidin 5‐O‐glucosyltransferase, a betanidin‐ and flavonoid‐specific enzyme with high homology to inducible glucosyltransferases from the Solanaceae. The Plant Journal 19: 509–519. [DOI] [PubMed] [Google Scholar]
- Wake DB, Wake MH, Specht CD. 2011. Homoplasy: from detecting pattern to determining process and mechanism of evolution. Science 331: 1032–1035. [DOI] [PubMed] [Google Scholar]
- Walker JF, Yang Y, Feng T, Timoneda A, Mikenas J, Hutchison V, Edwards C, Wang N, Ahluwalia S, Olivieri J et al. 2018. From cacti to carnivores: improved phylotranscriptomic sampling and hierarchical homology inference provide further insight into the evolution of Caryophyllales. American Journal of Botany 105: 446–462. [DOI] [PubMed] [Google Scholar]
- Wertheim JO, Murrell B, Smith MD, Kosakovsky Pond SL, Scheffler K. 2015. RELAX: detecting relaxed selection in a phylogenetic framework. Molecular Biology and Evolution 32: 820–832. [DOI] [PMC free article] [PubMed] [Google Scholar]
- Wessinger CA, Rausher MD. 2012. Lessons from flower colour evolution on targets of selection. Journal of Experimental Botany 63: 5741–5749. [DOI] [PubMed] [Google Scholar]
- Wessinger CA, Rausher MD. 2014. Predictability and irreversibility of genetic changes associated with flower color evolution in Penstemon barbatus . Evolution 68: 1058–1070. [DOI] [PubMed] [Google Scholar]
- Wheeler LC, Dunbar‐Wallis A, Schutz K, Smith SD. 2023. Evolutionary walks through flower colour space driven by gene expression in Petunia and allies (Petunieae). Proceedings of the Royal Society B: Biological Sciences 290: 20230275. [DOI] [PMC free article] [PubMed] [Google Scholar]
- Wheeler LC, Walker JF, Ng J, Deanna R, Dunbar‐Wallis A, Backes A, Pezzi PH, Palchetti MV, Robertson HM, Monaghan A et al. 2022. Transcription factors evolve faster than their structural gene targets in the flavonoid pigment pathway. Molecular Biology and Evolution 39: msac044. [DOI] [PMC free article] [PubMed] [Google Scholar]
- Wheeler LC, Wing BA, Smith SD. 2021. Structure and contingency determine mutational hotspots for flower color evolution. Evolution Letters 5: 61–74. [DOI] [PMC free article] [PubMed] [Google Scholar]
- Yang Z. 1998. Likelihood ratio tests for detecting positive selection and application to primate lysozyme evolution. Molecular Biology and Evolution 15: 568–573. doi: 10.1093/oxfordjournals.molbev.a025957. [DOI] [PubMed] [Google Scholar]
- Yang Z. 2007. PAML 4: phylogenetic analysis by maximum likelihood. Molecular Biology and Evolution 24: 1586–1591. doi: 10.1093/molbev/msm088. [DOI] [PubMed] [Google Scholar]
- Yang Y, Moore MJ, Brockington SF, Soltis DE, Wong GK‐S, Carpenter EJ, Zhang Y, Chen L, Yan Z, Xie Y et al. 2015. Dissecting molecular evolution in the highly diverse plant clade Caryophyllales using transcriptome sequencing. Molecular Biology and Evolution 32: 2001–2014. [DOI] [PMC free article] [PubMed] [Google Scholar]
- Yang Y, Smith SA. 2014. Orthology inference in nonmodel organisms using transcriptomes and low‐coverage genomes: improving accuracy and matrix occupancy for phylogenomics. Molecular Biology and Evolution 31: 3081–3092. [DOI] [PMC free article] [PubMed] [Google Scholar]
- Yonekura‐Sakakibara K, Higashi Y, Nakabayashi R. 2019. The origin and evolution of plant flavonoid metabolism. Frontiers in Plant Science 10: 943. [DOI] [PMC free article] [PubMed] [Google Scholar]
- Zdobnov EM, Tegenfeldt F, Kuznetsov D, Waterhouse RM, Simão FA, Ioannidis P, Seppey M, Loetscher A, Kriventseva EV. 2017. OrthoDB v.9.1: cataloging evolutionary and functional annotations for animal, fungal, plant, archaeal, bacterial and viral orthologs. Nucleic Acids Research 45: D744–D749. [DOI] [PMC free article] [PubMed] [Google Scholar]
- Zhang R, Guo C, Zhang W, Wang P, Li L, Duan X, Du Q, Zhao L, Shan H, Hodges SA et al. 2013. Disruption of the petal identity gene APETALA3‐3 is highly correlated with loss of petals within the buttercup family (Ranunculaceae). Proceedings of the National Academy of Sciences, USA 110: 5074–5079. [DOI] [PMC free article] [PubMed] [Google Scholar]
- Zimmermann IM, Heim MA, Weisshaar B, Uhrig JF. 2004. Comprehensive identification of Arabidopsis thaliana MYB transcription factors interacting with R/B‐like BHLH proteins. The Plant Journal 40: 22–34. [DOI] [PubMed] [Google Scholar]
Associated Data
This section collects any data citations, data availability statements, or supplementary materials included in this article.
Supplementary Materials
Fig. S1 Illustration of the cross‐species gene expression calculation that forms the basis of Fig. 6.
Fig. S2 Phylogenetic trees of the 18 flavonoid biosynthesis and flavonoid transport genes.
Fig. S3 Summary of flavonoid biosynthesis gene duplications in the Caryophyllales.
Fig. S4 Heatmap of frequency of presence of flavonoid biosynthesis genes in 357 Caryophyllales species summarized at the family level.
Fig. S5 Plots of RELAX alternative model fits showing dN/dS and site proportions of each site class for reference anthocyanin branches and test betalain branches.
Fig. S6 Phylogenetic trees of six components that can contribute to the MBW complex.
Fig. S7 Analyses of Mirabilis jalapa ANS gene copies.
Table S1 Comparison of RNA‐Seq tissue types between anthocyanin‐pigmented and betalain‐pigmented plants.
Table S2 Values for the ratio of synonymous and nonsynonymous substitutions between 23 genes from anthocyanin‐pigmented and genes from betalain‐pigmented taxa.
Table S3 Log likelihoods, information criteria, and parameter estimates of null, alternative, and partitioned descriptive models for RELAX analyses.
Please note: Wiley is not responsible for the content or functionality of any Supporting Information supplied by the authors. Any queries (other than missing material) should be directed to the New Phytologist Central Office.
Data Availability Statement
RNA‐Seq data sets analyzed in this study are available at the SRA/ENA. A list of the analyzed data sets, Fasta files containing bait sequences and sequences identified in this study, and Python scripts developed for this study are available at github: https://github.com/bpucker/CaryoAnthoBlock.