

Abstract
Objectives
To identify distinct foot pain trajectories over 7 years and examine their associations with potential prognostic factors.
Methods
Adults ages ≥50 years and registered with 4 general practices in North Staffordshire, UK were mailed a baseline health survey. Those reporting current or recent foot pain were invited to attend a research assessment clinic. Follow‐up was by repeated postal surveys at 18, 36, 54, and 84 months. Distinct trajectories of foot pain were explored using latent class growth analysis (LCGA). Subsequently, identified trajectories were combined into most and least progressive groups, and covariate‐adjusted associations with a range of prognostic factors were examined.
Results
Of 560 adults with foot pain attending baseline research clinics, 425 (76%) provided data at baseline and 2 or more follow‐up time points. LCGA for foot pain severity (0–10 numerical rating scale) identified a 4‐trajectory model: “mild, improving” (37%); “moderate, improving” (33%); “moderate‐severe, persistent” (24%); and “severe, persistent” (6%). Compared with individuals in more favorable (improving) pain trajectories, those in less favorable (persistent) pain trajectories were more likely to be obese, have routine/manual and intermediate occupations, have poorer physical and mental health, have catastrophizing beliefs, have greater foot‐specific functional limitation, and have self‐assessed hallux valgus at baseline.
Conclusions
Four distinct trajectories of foot pain were identified over a 7‐year period, with one‐third of individuals classified as having pain that is persistently moderate‐severe and severe in intensity. The effect of intervening to target modifiable prognostic factors such as obesity and hallux valgus on long‐term outcomes in people with foot pain requires investigation.
INTRODUCTION
Foot pain affects 24% of adults ages ≥45 years and accounts for 8% of primary care musculoskeletal consultations in the UK (1, 2). Painful foot disorders are major causes of restricted activity, poor balance, and risk of falling, particularly in older people (1, 3). Symptomatic osteoarthritis (OA) is the leading global cause of years lived with disability in older people (4) and is likely to be a significant contributor to foot pain in this age group (5).
SIGNIFICANCE & INNOVATIONS.
Individuals with joint pain often believe their pain will get worse over time, but there are few prospective studies of foot pain and osteoarthritis (OA).
Over 7 years, one‐third of individuals had persistent moderate‐severe or severe foot pain. Reassurance is provided that many people with foot pain improve over time.
Persistent pain was associated with obesity, routine/manual and intermediate occupations, poorer physical and mental health, catastrophizing beliefs, foot‐specific functional limitation, and hallux valgus at baseline.
Future research should investigate whether targeting modifiable prognostic factors, such as obesity and hallux valgus, improves long‐term outcomes in people with foot pain.
Few prospective studies of foot pain and OA have been undertaken, and little is known about what happens to people over time. Longitudinal studies of foot OA to date have focused on radiographic progression rather than change in symptoms, finding that structural progression after 3 and 19 years occurred in only one‐third of people (6, 7). At other joint sites, including the knee, hip, and hand, distinct pain trajectories and specific generic and joint‐specific risk factors for pain progression have been identified, showing that OA symptoms fluctuate over time and vary greatly between individuals (8, 9, 10, 11, 12).
Better understanding of the prognosis and natural history of foot pain is needed to develop a coherent clinical approach to helping people with painful foot OA and strategies to reduce the impact of related pain and disability in older people. This information could also help identify where treatment need is greatest, whether there are modifiable risk factors that could be targeted, and to inform intervention development for future clinical trials. The objectives of this study were to identify distinct trajectories of foot pain and function over 7 years in community‐dwelling individuals ages ≥50 years and examine associations between trajectories and potential prognostic factors.
PATIENTS AND METHODS
Study population and data collection
This was a prospective observational cohort study, the Clinical Assessment Study of the Foot (CASF) (13). Ethical approval was obtained at baseline, 18‐, 36‐, and 54‐month follow‐up from Coventry Research Ethics Committee (REC project number: 10/H1210/5) and at 84‐month follow‐up from East Midlands—Leicester South Research Ethics Committee (REC project number: 18/EM/0249).
At baseline (May 2010 to July 2011), a postal health survey was sent to community‐dwelling adults ages ≥50 years registered with 4 general practices in North Staffordshire, UK. The health survey collected information on foot pain severity (0–10 numerical rating scale [NRS]) (14); foot pain and foot‐specific function (Manchester Foot Pain and Disability Index [MFPDI]) (15); self‐reported hallux valgus using a validated line drawing instrument for which the 3 most severe grades (representing 30, 45, and 60 degrees of angulation) indicate presence of the condition (16); general health (Short Form 12 health survey [SF‐12]) (17); anxiety and depression (Hospital Anxiety and Depression Scale [HADS]) (18); coping strategies (19); and demographic and socioeconomic characteristics. Participants provided written informed consent to participate and to further contact in the postal questionnaire.
Individuals who reported experiencing foot pain within the preceding 12 months at baseline and provided consent to further contact were invited to attend a research clinic where assessments were undertaken, including the Foot Posture Index (FPI) (20), and height and weight were measured. Weight‐bearing dorsoplantar and lateral radiographs of each foot were obtained. Osteophytes and joint space narrowing were graded separately in the first metatarsophalangeal (MTP) joint, first and second cuneometatarsal joints, navicular‐first cuneiform joint, and talonavicular joint using a 0–3 scale according to a standardized foot atlas (21). Radiographic OA was defined as grade ≥2 for either feature on either view in 1 or more joints. Symptomatic radiographic foot OA phenotypes (no/minimal foot OA, isolated first MTP joint OA, polyarticular foot OA) were defined as described previously (22). Further written informed consent was obtained to undergo assessment at the research clinic.
Participants’ consent for review of their medical records was requested. Participants with gout were identified from the primary care medical records, and inflammatory arthritis (nonspecific inflammatory arthritis, rheumatoid arthritis, or psoriatic arthritis) were identified from the primary care and hospital medical records and a clinical radiography report by a consultant musculoskeletal radiologist.
All baseline, clinic attenders received follow‐up postal health surveys at 18, 36, 54, and 84 months, except deceased participants and those who had revoked consent or whose general practitioner had deemed them inappropriate to contact. At each time point, survey content was similar to baseline and, nonresponders were sent reminders 2 and 4 weeks after mailing, followed by attempts to collect key outcomes (MFPDI function subscale, global assessment of change, and pain, aching, and stiffness in previous month) by telephone and mail.
Outcomes
The main outcome was foot pain severity in the previous month (0–10 NRS) completed at each of the 5 time points (14). The impact of foot pain and function were also assessed at all time points using the MFPDI pain and functional limitation subscales (15). These subscales fit the Rasch model, allowing interval‐level data to be generated. Higher Rasch‐transformed scores indicate greater pain and limitation (23).
Public and patient involvement
People with foot pain contributed to study design, conduct, and dissemination. They prioritized pain and impaired function as the most important outcomes and informed questionnaire content. Individuals assisted with baseline clinical assessment training, refining the assessment protocol. They contributed to interpretation of findings and dissemination plans.
Statistical analysis
Latent class growth analysis (LCGA) was used to model repeated measures of foot pain (0–10 NRS) at 5 time points over 84 months. For inclusion in the analysis, participants were required to have foot pain data at baseline and 2 or more of the 4 follow‐up time points. The optimal number of trajectories was selected using a combination of statistical, parsimony, and interpretability criteria (24).
Three models were tested initially, with solely linear, quadratic, or cubic specifications for trajectories. In each case, the number of modeled trajectories was increased and significance of the improvement in the model fit assessed using Akaike information criterion (AIC), Bayesian information criterion (BIC), and sample size–adjusted (SSA) BIC (smaller values indicating better fit). The Lo‐Mendell‐Rubin adjusted likelihood ratio test (LRT) (25) and the bootstrap LRT were used to assess whether there was a significant improvement in model fit between K‐1 and K trajectory models. Additionally, the following criteria were used for model selection: 1) delineation of trajectories assessed by higher entropy (range 0–1), 2) clear classification of participants into trajectories (average posterior probability >0.7) (26), 3) trajectory membership ≥4% of the study population, and 4) clinical relevance and interpretation of the identified trajectories (24). Mixed polynomial models were derived, allowing the specification for trajectories to differ. An appropriate polynomial functional form for each trajectory was chosen, based on the significance of the estimated parameters related to each polynomial component (26), with each participant assigned to the most appropriate trajectory using the maximum probability assignment principle. Improvement of model fit with each additional trajectory was then assessed.
We assessed the sensitivity of our findings by modifying various components of our analyses. A complete case analysis of those with foot pain severity data at all 5 time points was undertaken to examine whether trajectories could be replicated. We also examined whether similar trajectories could be identified using the MFPDI pain and functional limitation subscales. LCGA assumes that individual participant patterns within a particular trajectory are homogeneous. We relaxed this assumption and allowed growth parameters to vary within trajectories by applying a growth mixture model (GMM), of which LCGA is a subclass. For all LCGA and GMM models, full information maximum likelihood estimation with robust standard errors was employed, and to avoid convergence at local maxima, each model was fitted using 1,000 random sets of starting values and 50 final stage optimizations carried out for each.
A nested case–control study was undertaken to compare those in the most progressive (cases) and least progressive trajectories (controls) of the final selected model. Crude univariable associations between progression and baseline characteristics, including sociodemographic (age, sex, body mass index [BMI], attended higher education, occupational class), general and mental health (SF‐12, HADS, catastrophizing beliefs), and foot‐specific characteristics (FPI, MFPDI, presence of hallux valgus, radiographic OA phenotype) (odds ratios [ORs] and 95% confidence intervals [95% CIs]) were assessed using logistic regression models and subsequently adjusted for age, sex, and BMI as potential confounders of OA severity. Additionally, the relationship between the most progressive and least progressive foot pain NRS trajectories and the MFPDI function subscale at 7 years was examined and adjusted for baseline score, age, sex, and BMI.
The Guidelines for Reporting on Latent Trajectory Studies checklist for reporting latent trajectory studies was followed (27). P values less than or equal to 0.05 were considered significant. Analyses were performed in STATA (version 15.0) and Mplus (version 8.0) (28).
RESULTS
A total of 560 participants who reported having foot pain in the last 12 months and consented to further contact attended the baseline research assessment clinic. Follow‐up data were received from 501 participants (89%) at 18 months, 455 (81%) at 36 months, 356 (64%) at 54 months, and 309 (55%) at 84 months. A total of 425 participants (76%) had pain NRS data at baseline and 2 or more follow‐up time points. These participants were younger (mean age 64.4 versus 66.8 years), were less likely to be female (52.7 versus 65.9%), had significantly lower foot pain NRS (mean 5.2 versus 5.8), and had a lower SF‐36 score (mean 30.1 versus 32.0) at baseline than the remaining participants who had data at baseline but fewer than 2 follow‐up time points.
A total of 396 participants (94.3%) reported foot pain in the last month; more than half reported having foot pain, aching, or stiffness on most or all days (Table 1). Nearly two‐thirds had radiographic foot OA affecting 1 or more foot joints, 44.5% had self‐reported hallux valgus, and only 3.5% had gout and 4.0% inflammatory arthritis. Concomitant foot conditions were common (32.2%, n = 137).
Table 1.
Baseline characteristics of the study population and the 4‐trajectory model obtained by LCGA*
| Baseline characteristics | All participants (n = 425) | Mild improving pain (n = 156) | Moderate improving pain (n = 139) | Moderate‐severe persistent pain (n = 104) | Severe persistent pain (n = 26) |
|---|---|---|---|---|---|
| Age, mean ± SD years | 64.4 ± 7.8 | 64.4 ± 7.3 | 64.2 ± 8.2 | 65.0 ± 8.1 | 62.4 ± 7.3 |
| Female sex | 224 (52.7) | 77 (49.4) | 79 (56.8) | 58 (55.8) | 10 (38.5) |
| BMI, kg/m2; mean ± SD | 30.2 ± 5.5 | 29.1 ± 4.7 | 30.4 ± 5.8 | 31.1 ± 5.5 | 32.5 ± 6.0 |
| Attended higher education | 114 (27.6) | 51 (33.6) | 37 (27.6) | 18 (17.8) | 8 (30.8) |
| Occupational class: | |||||
| Managerial and professional | 111 (26.1) | 55 (35.3) | 35 (25.2) | 19 (18.3) | 2 (7.7) |
| Intermediate | 82 (19.3) | 26 (16.7) | 25 (18.0) | 26 (25.0) | 5 (19.2) |
| Routine and manual | 210 (49.4) | 71 (45.5) | 71 (51.1) | 52 (50.0) | 16 (61.5) |
| SF‐12 PCS 0–100; mean ± SD | 38.9 ± 12.1 | 44.4 ± 10.2 | 38.7 ± 12.3 | 33.4 ± 10.8 | 28.2 ± 8.8 |
| SF‐12 MCS 0–100; mean ± SD | 49.9 ± 10.6 | 53.2 ± 8.5 | 49.9 ± 10.6 | 47.0 ± 11.2 | 40.5 ± 10.9 |
| SF‐36 Physical Functioning scale 0–100; mean ± SD | 59.6 ± 30.1 | 75.7 ± 20.5 | 58.8 ± 30.3 | 44.0 ± 29.1 | 29.2 ± 24.0 |
| HADS anxiety 0–21; mean ± SD | 6.9 ± 4.3 | 5.7 ± 3.9 | 6.6 ± 4.0 | 8.1 ± 4.4 | 10.8 ± 4.8 |
| HADS depression 0–21; mean ± SD | 5.3 ± 3.8 | 3.9 ± 2.9 | 5.0 ± 3.5 | 6.6 ± 4.0 | 9.9 ± 4.3 |
| Any foot pain, aching, or stiffness in last month | 397 (93.4) | 132 (84.6) | 136 (97.8) | 103 (99.0) | 26 (100) |
| Foot pain, aching, or stiffness on most or all days in last month | 234 (55.1) | 54 (34.6) | 77 (55.4) | 78 (75.0) | 25 (96.2) |
| Foot pain severity (NRS 0–10) last month; mean ± SD | 5.2 ± 2.6 | 3.5 ± 2.2 | 5.4 ± 2.1 | 6.7 ± 1.9 | 8.6 ± 1.7 |
| MFPDI Pain subscale (Rasch); mean ± SD | −0.21 ± 1.5 | −1.18 ± 1.4 | −0.10 ± 1.3 | 0.62 ± 1.2 | 1.61 ± 1.2 |
| MFPDI Function subscale (Rasch); mean ± SD | −0.76 ± 2.1 | −2.02 ± 1.6 | −0.65 ± 1.9 | 0.42 ± 1.8 | 1.5 ± 1.8 |
| FPI (Rasch); mean ± SD | |||||
| Left foot | 2.5 ± 1.8 | 2.5 ± 1.7 | 2.5 ± 1.8 | 2.4 ± 2.0 | 2.1 ± 2.3 |
| Right foot | 2.5 ± 1.9 | 2.6 ± 1.7 | 2.5 ± 1.9 | 2.5 ± 2.0 | 2.3 ± 2.0 |
| Radiographic foot OA (one or more foot joints) | 255 (63.7) | 90 (59.6) | 79 (62.2) | 68 (70.1) | 18 (72.0) |
| Symptomatic radiographic foot OA phenotypes | |||||
| First MTP joint OA | 84 (20.7) | 34 (21.8) | 24 (17.3) | 19 (18.3) | 7 (26.9) |
| Polyarticular OA | 62 (15.3) | 14 (9.0) | 25 (18.0) | 21 (20.2) | 2 (7.7) |
| Hallux valgus (either foot) | 189 (44.5) | 57 (36.5) | 59 (42.4) | 62 (59.6) | 11 (42.3) |
| Gout | 15 (3.5) | 7 (4.5) | 3 (2.2) | 3 (2.9) | 2 (7.7) |
| Inflammatory arthritis (RA, PsA, other) | 17 (4.0) | 2 (1.3) | 8 (5.8) | 6 (5.8) | 1 (3.8) |
Values are the number (%) unless indicated otherwise. BMI = body mass index; FPI = Foot Posture Index; HADS = Hospital Anxiety and Depression Scale (higher scores indicate more anxiety and depression); LCGA = latent class growth analysis; MFPDI = Manchester Foot Pain and Disability Index (higher scores indicate more pain and disability); MCS = mental component score; MTP = metatarsophalangeal; NRS = numerical rating scale; OA = osteoarthritis; PCS = physical component score; PsA = psoriatic arthritis; RA = rheumatoid arthritis; SF‐12 = Short Form 12 health survey (higher scores indicate better physical and mental health and physical function).
A 4‐trajectory model was selected as optimal based on low AIC, BIC, and SSA‐BIC values and significance of bootstrap LRT while maintaining high entropy and average posterior probabilities (Supplementary Table 1, available on the Arthritis Care & Research website at http://onlinelibrary.wiley.com/doi/10.1002/acr.24823). Additionally, this model identified a small but clinically important subgroup of patients reporting high pain severity.
The 4 identified trajectories were labeled as “mild, improving pain” (n = 156, 36.7%); “moderate, improving pain” (n = 139, 32.7%); “moderate‐severe, persistent pain” (n = 104, 24.5%); and “severe, persistent pain” (n = 26, 6.1%). Individuals in the mild improving pain trajectory had a mean NRS pain severity score of 3.6 at baseline that improved over 18 months and was sustained over follow‐up (slope parameter estimate = −3.513; P < 0.001) (Figure 1). Those in the moderate improving pain trajectory had a mean pain score of 5.1 at baseline that steadily declined over follow‐up (slope parameter estimate = −0.489; P < 0.001). The moderate‐severe persistent pain trajectory had a mean pain score of 6.7 at baseline that was sustained over follow‐up (slope parameter estimate = −0.138; P = 0.321). Finally, those in the severe persistent pain trajectory had a mean pain score of 8.4 at baseline with consistently high levels of pain over follow‐up (slope parameter estimate = 0.037; P = 0.787). Figure 2 depicts individual observed growth trajectories within each trajectory, and Table 1 displays the baseline characteristics for each of the 4 trajectories.
Figure 1.
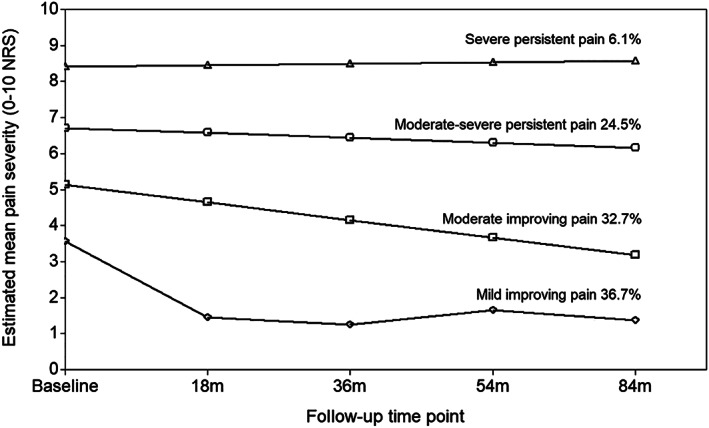
Foot pain severity trajectories over 7 years. NRS = numerical rating scale.
Figure 2.
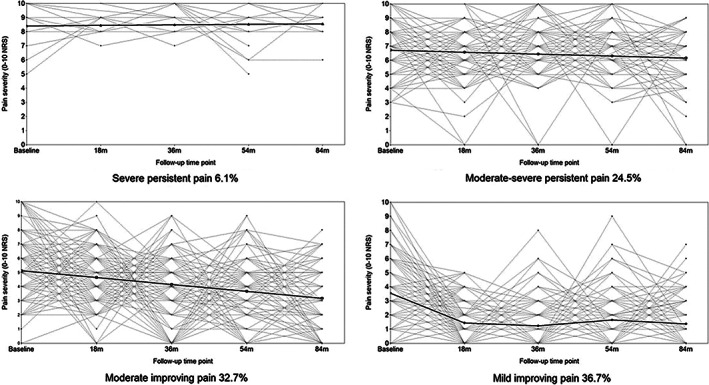
Estimated trajectories and individual observed growth trajectories. NRS = numerical rating scale.
Comparable trajectories for NRS foot pain severity were obtained on complete case analysis (n = 273) (Supplementary Figure 1, available on the Arthritis Care & Research website at http://onlinelibrary.wiley.com/doi/10.1002/acr.24823). Similar trajectories were also identified for the MFPDI pain (n = 379) and functional limitation (n = 384) subscales scores (Supplementary Figures 2 and 3, available at http://onlinelibrary.wiley.com/doi/10.1002/acr.24823). On fitting a GMM, an optimal model with fewer trajectories (a total of 3) was identified via LCGA (Supplementary Table 2, available at http://onlinelibrary.wiley.com/doi/10.1002/acr.24823); however, this was expected because GMM allows for within‐trajectory growth variation. It was possible to replicate the 4‐trajectory model; however, the severe persistent category consisted of <4% of participants.
The baseline characteristics of individuals in the moderate‐severe and severe persistent foot pain severity trajectories (n = 130, 30.6%) were compared with those in the mild and moderate improving trajectories (n = 295, 69.4%) (Table 2). On adjustment, the less favorable long‐term foot pain NRS trajectories were significantly associated with higher BMI (adjusted OR 1.06 [95% CI 1.02–1.11]), intermediate occupations (adjusted OR 2.69 [95% CI 1.39–5.21]), routine and manual occupations (adjusted OR 2.01 [95% CI 1.15–3.53]) versus managerial and professional occupations, worse MFPDI foot pain (adjusted OR 2.19 [95% CI 1.80–2.66]) and functional limitation (adjusted OR 1.78 [95% CI 1.54–2.05]), hallux valgus in either foot (adjusted OR 2.22 [95% CI 1.43–3.44]), poorer physical (adjusted OR 0.93 [95% CI 0.91–0.95]) and mental health (adjusted OR 0.95 [95% CI 0.93–0.97]), greater anxiety (adjusted OR 1.15 [95% CI 1.09–1.21]) and depression (adjusted OR 1.21 [95% CI 1.14–1.29), and catastrophizing beliefs (adjusted OR 1.36 [95% CI 1.23–1.50]). Less favorable trajectories were not significantly associated with the presence of radiographic foot OA phenotype (first MTP joint OA adjusted OR 1.21 [95% CI 0.70–2.08] or polyarticular OA adjusted OR 1.38 [95% CI 0.74–2.54] versus no/minimal OA).
Table 2.
Baseline characteristics and their association with moderate‐severe and severe persistent foot pain over 7 years*
| Baseline characteristics | Mild and moderate improving pain (n = 295) | Moderate‐severe and severe persistent pain (n = 130) | Univariable crude OR(95% CI) | OR (95% CI) adjusted for age, sex, and BMI |
|---|---|---|---|---|
| Age, mean ± SD years | 64.3 ± 7.7 | 64.5 ± 8.0 | 1.00 (0.98–1.03)† | 1.00 (0.98–1.03)† |
| Sex | ||||
| Male | 139 (46.1) | 62 (47.7) | 1 | 1 |
| Female | 156 (52.9) | 68 (52.3) | 0.98 (0.65–1.48) | 0.96 (0.63–1.45) |
| BMI; mean ± SD | 28.1 ± 4.9 | 29.7 ± 5.2 | 1.06 (1.02–1.11)† | 1.06 (1.02–1.11)† |
| Attended higher education | ||||
| No | 198 (67.1) | 101 (77.7) | 1 | 1 |
| Yes | 88 (29.8) | 26 (20.0) | 0.58 (0.35–0.95) | 0.61 (0.37–1.01) |
| Occupational class | ||||
| Managerial and professional | 90 (30.5) | 21 (16.2) | 1 | 1 |
| Intermediate | 51 (17.3) | 31 (23.9) | 2.61 (1.36–5.00) | 2.69 (1.39–5.21) |
| Routine and manual | 142 (48.1) | 68 (52.3) | 2.05 (1.18–3.58) | 2.01 (1.15–3.53) |
| FPI (Rasch); mean ± SD | ||||
| Left foot | 2.48 ± 1.75 | 2.38 ± 2.07 | 0.97 (0.87–1.09)† | 0.97 (0.86–1.08)† |
| Right foot | 2.55 ± 1.79 | 2.48 ± 2.00 | 0.98 (0.88–1.10)† | 0.98 (0.87–1.10)† |
| Hallux valgus (either foot) | ||||
| Absence | 179 (60.7) | 57 (43.9) | 1 | 1 |
| Presence | 116 (39.3) | 73 (56.2) | 1.98 (1.30–3.00) | 2.22 (1.43–3.44) |
| MFPDI pain subscale (Rasch); mean ± SD | −0.67 ± 1.44 | 0.82 ± 1.23 | 2.23 (1.84–2.70)† | 2.19 (1.80–2.66)† |
| MFPDI function subscale (Rasch); mean ± SD | −1.38 ± 1.86 | 0.63 ± 1.84 | 1.76 (1.54–2.01)† | 1.78 (1.54–2.05)† |
| Radiographic foot OA phenotype | ||||
| No/minimal OA | 186 (63.1) | 73 (56.2) | 1 | 1 |
| First MTP joint OA | 58 (19.7) | 26 (20.0) | 1.14 (0.67–1.95) | 1.21 (0.70–2.08) |
| Polyarticular OA | 39 (13.2) | 23 (17.7) | 1.50 (0.84–2.69) | 1.38 (0.74–2.54) |
| SF‐12 PCS (0–100); mean ± SD | 41.7 ± 11.60 | 32.3 ± 10.5 | 0.93 (0.91–0.95)† | 0.93 (0.91–0.95)† |
| SF‐12 MCS (0–100); mean ± SD | 51.7 ± 9.68 | 45.6 ± 11.4 | 0.95 (0.93–0.97)† | 0.95 (0.93–0.97)† |
| HADS anxiety (0–21); mean ± SD | 6.1 ± 3.94 | 8.6 ± 4.58 | 1.15 (1.09–1.21)† | 1.15 (1.09–1.21)† |
| HADS depression (0–21); mean ± SD | 4.4 ± 3.26 | 7.3 ± 4.23 | 1.23 (1.15–1.30)† | 1.21 (1.14–1.29)† |
| Catastrophizing beliefs (0–6); median (IQR)‡ | 0 (0–2) | 3 (0–5) | 1.37 (1.25–1.51)† | 1.36 (1.23–1.50)† |
Values are the number (%) unless indicated otherwise. 95% CI = 95% confidence interval; BMI = body mass index; FPI = Foot Posture Index; HADS = Hospital Anxiety and Depression Scale (higher scores indicate more anxiety and depression); IQR = interquartile range; MCS = mental component score; MFPDI = Manchester Foot Pain and Disability Index (higher scores indicate more pain and disability); MTP = metatarsophalangeal; OA = osteoarthritis; OR = odds ratio; PCS = physical component score; SF‐12 = Short Form 12 health survey (higher scores indicate better physical and mental health and physical function).
Per unit increase.
For catastrophizing beliefs, higher scores indicate more frequent occurrence.
Moderate‐severe and severe persistent foot pain NRS trajectories over 7 years were also accompanied by greater foot‐specific functional limitation (MFPDI function subscale) at 7 years (adjusted OR 1.43 [95% CI 1.16–1.76]) after adjustment for baseline score, age, sex, and BMI compared with those with mild and moderate improving pain trajectories.
DISCUSSION
In community‐dwelling individuals ages ≥50 years with foot pain, we identified 4 distinct trajectories of foot pain severity over 7 years: mild improving, moderate improving, moderate‐severe persistent, and severe persistent pain. Individuals in the less favorable moderate‐severe and severe persistent pain trajectories were more likely at baseline to be obese; to have greater foot‐specific functional limitation, hallux valgus in either foot, routine/manual and intermediate occupations, and poorer physical health and mental health; and to catastrophize about their foot pain symptoms compared with those in the mild and moderate improving trajectories.
Our analysis shows that foot pain does not persist at the same intensity or progress in all individuals. Approximately one‐third of the people who reported foot pain in the last year at baseline had persistent pain over 7 years, and there was a small but important group for whom pain was persistently severe. This group consisted of 6% of the study population, and the majority (69.2%, 18 of 26) had radiographic OA, 2 of whom had concomitant gout and 1 of whom had inflammatory arthritis. On average, people in this severe persistent pain trajectory reported pain scores of 8–9 or 10 at each time point, a pain level that they are likely to consider as being unmanageable (29). In a previous community‐based study from the same geographic area, foot pain was found to persist over 3 years in more than two‐thirds of participants (30); however, persistence was defined by presence rather than severity of pain.
Although to our knowledge, foot symptom trajectories have not previously been investigated, symptom trajectories at other sites including the knee and hip have been explored (8, 9, 10, 11, 12, 31, 32, 33, 34, 35, 36, 37, 38). Studies of symptom trajectories are heterogeneous, varying by length (18 months to 14 years) and frequency (3 months to 2 years) of follow‐up (8, 32, 33), sample size (n = 222–4,796) (8, 34), and how OA was defined (8, 9, 10, 11, 32, 34), as well as age and sex characteristics of the study populations. Despite these variations, these studies found pain trajectories similar in number (between 3 and 6) and pattern (35). Trajectories are often stable, with a similar level of symptoms over time but at different thresholds (e.g., mild, moderate, and severe) (9, 10, 11, 31, 34, 35). We also found improving pain trajectories that have been similarly reported at the knee and hip (8, 12, 36, 37, 38). However, we did not identify a group of people with highly progressive pain noted in several previous pain severity studies (8, 12, 37). Although rapidly progressing forms of hip and knee OA have been established (39, 40), our results provide no indication that this occurs at the foot. Structural progression of radiographic first MTP joint OA has been reported over 3 and 19 years in approximately one‐third of participants in 2 prospective cohorts (6, 7). However, because symptoms and radiographic change are often discordant, it cannot be assumed that the individuals with persistent pain in our study also have structural progression.
Obesity, routine/manual and intermediate occupations, foot‐specific functional limitation, poorer physical and mental health, and hallux valgus have previously been found to associate with foot pain in cross‐sectional studies (41, 42, 43, 44), but few have been examined longitudinally. BMI has been found to be a predictor of future foot pain, and an increase in BMI is associated with an increase in foot pain over 2 years (45, 46) and its persistence over 6 years (47). Worsening hallux valgus severity has been associated with greater foot pain over 6 years (48, 49). Depression has been found to be a predictor of future foot pain, and poorer mental health is associated with worsening of foot pain over 3 years (45, 50). Although not examined previously at the foot, having poorer general health, poorer coping strategies, and occupation have been reported to be associated with poorer hip and knee pain trajectories (9, 12, 36).
Pain has previously been found to be associated with increased risk of functional impairment development and progression, with stronger associations found for increased pain severity (51, 52, 53). The mechanisms underlying the association between pain and functional decline are not fully understood, but it is thought that individuals with joint pain often become less active often to avoid the pain and/or believe that they could make their condition worse (54). It is also believed that pain can reduce joint range of motion (55). In the long term, both these pathways are considered to result in the deterioration of physical performance and muscle weakness, which gradually lead to functional impairment and disability (56).
The strengths of this study include a prospective cohort design in a community‐dwelling population not selected based on primary care consultation or referral. It is the first study, to our knowledge, to examine trajectories of foot pain prospectively over several follow‐up time points. The quality of classification of the 4‐trajectory model was high, as judged by the average posterior probabilities and entropy value. The model was robust to missing data and model assumptions. Furthermore, similar trajectories were replicated in the complete case analysis, despite evidence of attrition bias, and for other foot outcomes.
A number of limitations should also be acknowledged. The source study population, the CASF study, has low representation of ethnic minorities (13). Pain severity was collected at the person level and so included both feet. It is therefore possible that the specific foot or regions of the foot with the most severe pain varied over time. Incident cases of foot pain were not specifically examined, and it is possible that the different trajectories may represent different stages of foot disease. Individuals with OA commonly report fluctuations and flares in their symptoms, and it is unknown how these short‐term changes are reflected in the trajectories because the interval between data collection points was fairly long (57, 58). Equidistance between follow‐up time points was assumed in the analysis, which was the case for 4 out of 5 time points. The time period between the penultimate and last time points was 6 months longer, but this is unlikely to have had an effect on the results over 7 years. It is unknown to what extent clinical treatment and self‐management influenced the trajectories identified. However, previous studies suggest that only a minority of individuals with foot pain consult primary care, with most prescribed analgesics and few receiving onward treatment referrals (59, 60). Additionally, some of the baseline characteristics in the nested case–control analysis, such as the symptomatic radiographic phenotypes, were less prevalent than anticipated, leading to insufficient power and a type II error.
Our study has important implications for individuals with foot pain, clinicians, and policy makers. Individuals with joint pain often believe that it is inevitable that their pain will get worse over time (61, 62); however, our findings provide reassurance that not all foot pain is progressive, and many people will experience some improvement over time. Our findings will aid in identification of individuals with moderate and severe persistent pain at risk of worse outcomes who could be targeted for intervention. Hallux valgus and obesity were associated with progressive pain trajectories, and each are potentially modifiable with orthoses and corrective surgery for hallux valgus and with diet and exercise for obesity (63, 64, 65). There is a need for well‐designed intervention studies to determine whether individuals with different trajectories would benefit from early intervention and whether specific interventions for hallux valgus and obesity influence foot symptoms.
In conclusion, over a 7‐year period, one‐third of individuals had persistent moderate to severe or severe pain that was accompanied by a decline in foot‐specific function. Obesity and hallux valgus have been identified as possible prognostic factors. Further investigation to ascertain whether interventions targeting these factors improve long‐term outcomes in people with foot pain are warranted.
AUTHOR CONTRIBUTIONS
All authors were involved in drafting the article or revising it critically for important intellectual content, and all authors approved the final version to be submitted for publication. Dr. Marshall had full access to all of the data in the study and takes responsibility for the integrity of the data and the accuracy of the data analysis.
Study conception and design
Marshall, Blagojevic‐Bucknall, Rathod‐Mistry, Thomas, Edwards, Peat, Menz, Roddy.
Acquisition of data
Marshall, Thomas, Roddy.
Analysis and interpretation of data
Marshall, Blagojevic‐Bucknall, Rathod‐Mistry, Thomas, Edwards, Peat, Menz, Roddy.
Supporting information
Disclosure Form
Appendix S1 Supplementary Information
ACKNOWLEDGMENTS
We thank the administrative, health informatics, and research nurse teams of Keele University's Primary Care Centre Versus Arthritis and the staff of the participating general practices and the Haywood Hospital, particularly Dr. Jackie Saklatvala, Carole Jackson, and the radiographers at the Department of Radiology. We acknowledge the contributions of Linda Hargreaves, Gillian Levey, Liz Mason, Dr. Jennifer Pearson, Julie Taylor, and Dr. Laurence Wood to data collection.
The views expressed are those of the authors and not necessarily those of the NIHR, NHS, Health Education England, or the Department of Health and Social Care.
Supported by the NIHR School for Primary Care Research (grant 396), Arthritis Research UK (grant 18174), and the West Midlands North Comprehensive Local Research Network. Dr. Thomas' work was supported by an Integrated Clinical Academic Programme Clinical Lectureship from the NIHR and Health Education England (grant ICA‐CL‐2016‐02‐014) and an NIHR Development and Skills Enhancement award (grant NIHR 300818). Dr. Edward's work was supported by the NIHR Academic Clinical Lectureship (grant CL‐201610003) and the NIHR. Dr. Menz is a Senior Research Fellow for the National Health and Medical Research Council of Australia (ID 1135995).
Author disclosures are available at https://onlinelibrary.wiley.com/action/downloadSupplement?doi=10.1002%2Facr.24823&file=acr24823‐sup‐0001‐Disclosureform.pdf.
REFERENCES
- 1. Thomas MJ, Roddy E, Zhang W, et al. The population prevalence of foot and ankle pain in middle and old age: a systematic review. Pain 2011;152:2870–80. [DOI] [PubMed] [Google Scholar]
- 2. Menz HB, Jordan KP, Roddy E, et al. Characteristics of primary care consultations for musculoskeletal foot and ankle problems in the UK. Rheumatology (Oxford) 2010;49:1391–8. [DOI] [PMC free article] [PubMed] [Google Scholar]
- 3. Menz HB, Auhl M, Spink MJ. Foot problems as a risk factor for falls in community‐dwelling older people: a systematic review and meta‐analysis. Maturitas 2018;118:7–14. [DOI] [PubMed] [Google Scholar]
- 4. Vos T, Flaxman AD, Naghavi M, et al. Years lived with disability (YLDs) for 1160 sequelae of 289 diseases and injuries 1990–2010: a systematic analysis for the Global Burden of Disease Study 2010. Lancet 2012;380:2163–96. [DOI] [PMC free article] [PubMed] [Google Scholar]
- 5. Roddy E, Menz HB. Foot osteoarthritis: latest evidence and developments. Ther Adv Musculoskelet Dis 2018;10:91–103. [DOI] [PMC free article] [PubMed] [Google Scholar]
- 6. Wilder FV, Barrett JP Jr, Farina EJ. Effect of regular exercise on the radiographic progression of foot osteoarthritis. J Am Podiatr Med Assoc 2005;95:342–6. [DOI] [PubMed] [Google Scholar]
- 7. Bowen C, Gates L, McQueen P, et al. The natural history of radiographic first metatarsophalangeal joint osteoarthritis: a nineteen‐year population‐based cohort study. Arthritis Care Res (Hoboken) 2020;72:1224–30. [DOI] [PMC free article] [PubMed] [Google Scholar]
- 8. Verkleij SP, Hoekstra T, Rozendaal RM, et al. Defining discriminative pain trajectories in hip osteoarthritis over a 2‐year time period. Ann Rheum Dis 2012;71:1517–23. [DOI] [PubMed] [Google Scholar]
- 9. Nicholls E, Thomas E, van der Windt DA, et al. Pain trajectory groups in persons with, or at high risk of, knee osteoarthritis: findings from the Knee Clinical Assessment Study and the Osteoarthritis Initiative. Osteoarthritis Cartilage 2014;22:2041–50. [DOI] [PMC free article] [PubMed] [Google Scholar]
- 10. Holla JF, van der Leeden M, Heymans MW, et al. Three trajectories of activity limitations in early symptomatic knee osteoarthritis: a 5‐year follow‐up study. Ann Rheum Dis 2014;73:1369–75. [DOI] [PubMed] [Google Scholar]
- 11. Collins JE, Katz JN, Dervan EE, et al. Trajectories and risk profiles of pain in persons with radiographic, symptomatic knee osteoarthritis: data from the osteoarthritis initiative. Osteoarthritis Cartilage 2014;22:622–30. [DOI] [PMC free article] [PubMed] [Google Scholar]
- 12. Bastick AN, Verkleij SP, Damen J, et al. Defining hip pain trajectories in early symptomatic hip osteoarthritis‐‐5 year results from a nationwide prospective cohort study (CHECK). Osteoarthritis Cartilage 2016;24:768–75. [DOI] [PubMed] [Google Scholar]
- 13. Roddy E, Thomas MJ, Marshall M, et al. The population prevalence of symptomatic radiographic foot osteoarthritis in community‐dwelling older adults: cross‐sectional findings from the clinical assessment study of the foot. Ann Rheum Dis 2015;74:156–63. [DOI] [PMC free article] [PubMed] [Google Scholar]
- 14. Williamson A, Hoggart B. Pain: a review of three commonly used pain rating scales. J Clin Nurs 2005;14:798–804. [DOI] [PubMed] [Google Scholar]
- 15. Garrow AP, Papageorgiou AC, Silman AJ, et al. Development and validation of a questionnaire to assess disabling foot pain. Pain 2000;85:107–13. [DOI] [PubMed] [Google Scholar]
- 16. Roddy E, Zhang W, Doherty M. Validation of a self‐report instrument for assessment of hallux valgus. Osteoarthritis Cartilage 2007;15:1008–12. [DOI] [PubMed] [Google Scholar]
- 17. Ware J Jr, Kosinski M, Keller SD. A 12‐Item Short‐Form Health Survey: construction of scales and preliminary tests of reliability and validity. Med Care 1996;34:220–33. [DOI] [PubMed] [Google Scholar]
- 18. Zigmond AS, Snaith RP. The hospital anxiety and depression scale. Acta Psychiatr Scand 1983;67:361–70. [DOI] [PubMed] [Google Scholar]
- 19. Jensen MP, Keefe FJ, Lefebvre JC, et al. One‐ and two‐item measures of pain beliefs and coping strategies. Pain 2003;104:453–69. [DOI] [PubMed] [Google Scholar]
- 20. Redmond AC, Crosbie J, Ouvrier RA. Development and validation of a novel rating system for scoring standing foot posture: the Foot Posture Index. Clin Biomech (Bristol, Avon) 2006;21:89–98. [DOI] [PubMed] [Google Scholar]
- 21. Menz HB, Munteanu SE, Landorf KB, et al. Radiographic classification of osteoarthritis in commonly affected joints of the foot. Osteoarthritis Cartilage 2007;15:1333–8. [DOI] [PubMed] [Google Scholar]
- 22. Rathod T, Marshall M, Thomas MJ, et al. Investigations of potential phenotypes of foot osteoarthritis: cross‐sectional analysis from the clinical assessment study of the foot. Arthritis Care Res (Hoboken) 2016;68:217–27. [DOI] [PMC free article] [PubMed] [Google Scholar]
- 23. Muller S, Roddy E. A rasch analysis of the Manchester Foot Pain and Disability Index. J Foot Ankle Res 2009;2:29. [DOI] [PMC free article] [PubMed] [Google Scholar]
- 24. Jung T, Wickrama KAS. An introduction to latent class growth analysis and growth mixture modeling. Soc Personal Psychol Compass 2008;2:302–17. [Google Scholar]
- 25. Lo Y, Mendell NR, Rubin DB. Testing the number of components in a normal mixture. Biometrika 2001;88:767–78. [Google Scholar]
- 26. Andruff H, Carraro N, Thompson A, et al. Latent class growth modelling: a tutorial. Tutor Quant Method Psychol 2009;5:11–24. [Google Scholar]
- 27. Van de Schoot R, Sijbrandij M, Winter SD, et al. The GRoLTS‐checklist: guidelines for reporting on latent trajectory studies. Struct Equ Modeling 2017;24:451–67. [Google Scholar]
- 28. Muthén LK, Muthén BO. Mplus user's guide. 8th ed. Los Angeles (CA): Muthén & Muthén; 1998. –2017. [Google Scholar]
- 29. Zelman DC, Hoffman DL, Seifeldin R, et al. Development of a metric for a day of manageable pain control: derivation of pain severity cut‐points for low back pain and osteoarthritis. Pain 2003;106:35–42. [DOI] [PubMed] [Google Scholar]
- 30. Roddy E, Muller S, Thomas E. Onset and persistence of disabling foot pain in community‐dwelling older adults over a 3‐year period: a prospective cohort study. J Gerontol A Biol Sci Med Sci 2011;66:474–80. [DOI] [PMC free article] [PubMed] [Google Scholar]
- 31. Leffondré K, Abrahamowicz M, Regeasse A, et al. Statistical measures were proposed for identifying longitudinal patterns of change in quantitative health indicators. J Clin Epidemiol 2004;57:1049–62. [DOI] [PubMed] [Google Scholar]
- 32. Hermsen LA, Smalbrugge M, van der Wouden JC, et al. Trajectories of physical functioning and their prognostic indicators: a prospective cohort study in older adults with joint pain and comorbidity. Maturitas 2014;78:316–22. [DOI] [PubMed] [Google Scholar]
- 33. James RJ, Walsh DA, Ferguson E. Trajectories of pain predict disabilities affecting daily living in arthritis. Br J Health Psychol 2019;24:485–96. [DOI] [PMC free article] [PubMed] [Google Scholar]
- 34. Dai Z, Lu N, Niu J, et al. Dietary fiber intake in relation to knee pain trajectory. Arthritis Care Res (Hoboken) 2017;69:1331–9. [DOI] [PMC free article] [PubMed] [Google Scholar]
- 35. Wieczorek M, Rotonda C, Guillemin F, et al. What have we learned from trajectory analysis of clinical outcomes in knee and hip osteoarthritis before surgery? Arthritis Care Res (Hoboken) 2019;72:1693–702. [DOI] [PubMed] [Google Scholar]
- 36. Wesseling J, Bastick AN, ten Wolde S, et al. Identifying trajectories of pain severity in early symptomatic knee osteoarthritis: a 5‐year follow up of the Cohort Hip and Cohort Knee (CHECK) Study. J Rheumatol 2015;42:1470–7. [DOI] [PubMed] [Google Scholar]
- 37. Bastick AN, Wesseling J, Damen J, et al. Defining knee pain trajectories in early symptomatic knee osteoarthritis in primary care: 5‐year results from a nationwide prospective cohort study (CHECK). Br J Gen Pract 2016;66:e32–9. [DOI] [PMC free article] [PubMed] [Google Scholar]
- 38. Schiphof D, Runhaar J, Waarsing JH, et al. The clinical and radiographic course of early knee and hip osteoarthritis over 10 years in CHECK (Cohort Hip and Cohort Knee). Osteoarthritis Cartilage 2019;27:1491–500. [DOI] [PubMed] [Google Scholar]
- 39. Davis J, Eaton CB, Lo GH, et al. Knee symptoms among adults at risk for accelerated knee osteoarthritis: data from the Osteoarthritis Initiative. Clin Rheumatol 2017;36:1083–9. [DOI] [PMC free article] [PubMed] [Google Scholar]
- 40. Flemming DJ, Gustas‐French CN. Rapidly progressive osteoarthritis: a review of the clinical and radiologic presentation. Curr Rheumatol Rep 2017;19:42. [DOI] [PubMed] [Google Scholar]
- 41. Butterworth PA, Landorf KB, Smith SE, et al. The association between body mass index and musculoskeletal foot disorders: a systematic review. Obes Rev 2012;13:630–42. [DOI] [PubMed] [Google Scholar]
- 42. Hill CL, Gill TK, Menz HB, et al. Prevalence and correlates of foot pain in a population‐based study: the North West Adelaide Health Study. J Foot Ankle Res 2008;1:2. [DOI] [PMC free article] [PubMed] [Google Scholar]
- 43. Hendry GJ, Fenocchi L, Woodburn J, et al. Foot pain and foot health in an educated population of adults: results from the Glasgow Caledonian University Alumni Foot Health Survey. J Foot Ankle Res 2018;11:48. [DOI] [PMC free article] [PubMed] [Google Scholar]
- 44. Laslett LL, Menz HB, Otahal P, et al. Factors associated with prevalent and incident foot pain: data from the Tasmanian Older Adult Cohort Study. Maturitas 2018;118:38–43. [DOI] [PubMed] [Google Scholar]
- 45. Gill TK, Menz HB, Landorf KB, et al. Predictors of foot pain in the community: the North West Adelaide Health Study. J Foot Ankle Res 2016;9:23. [DOI] [PMC free article] [PubMed] [Google Scholar]
- 46. Walsh TP, Butterworth PA, Urquhart DM, et al. Increase in body weight over a two‐year period is associated with an increase in midfoot pressure and foot pain. J Foot Ankle Res 2017;10:31. [DOI] [PMC free article] [PubMed] [Google Scholar]
- 47. Menz HB, Barr EL, Brown WJ. Predictors and persistence of foot problems in women aged 70 years and over: a prospective study. Maturitas 2011;68:83–7. [DOI] [PubMed] [Google Scholar]
- 48. Koo KK, Tse LF, Cheng HS, et al. The progression of hallux valgus in the oriental Chinese population in Hong Kong. Foot (Edinb) 2017;32:15–21. [DOI] [PubMed] [Google Scholar]
- 49. Menz HB, Roddy E, Thomas E, et al. Impact of hallux valgus severity on general and foot‐specific health‐related quality of life. Arthritis Care Res (Hoboken) 2011;63:396–404. [DOI] [PubMed] [Google Scholar]
- 50. Butterworth PA, Urquhart DM, Cicuttini FM, et al. Relationship between mental health and foot pain. Arthritis Care Res (Hoboken) 2014;66:1241–5. [DOI] [PubMed] [Google Scholar]
- 51. Castellanos‐Perilla N, Borda MG, Fernández‐Quilez Á, et al. Factors associated with functional loss among community‐dwelling Mexican older adults. Biomedica 2020;40:546–56. [DOI] [PMC free article] [PubMed] [Google Scholar]
- 52. Landi F, Russo A, Liperoti R, et al. Daily pain and functional decline among old‐old adults living in the community: results from the IlSIRENTE Study. J Pain Symptom Manage 2009;38:350–7. [DOI] [PubMed] [Google Scholar]
- 53. Leveille SG, Ling S, Hochberg MC, et al. Widespread musculoskeletal pain and the progression of disability in older disabled women. Ann Intern Med 2001;135:1038–46. [DOI] [PubMed] [Google Scholar]
- 54. Steultjens MP, Dekker J, Bijlsma JW. Avoidance of activity and disability in patients with osteoarthritis of the knee: the mediating role of muscle strength. Arthritis Rheum 2002;46:1784–8. [DOI] [PubMed] [Google Scholar]
- 55. Young A. Current issues in arthrogenous inhibition. Ann Rheum Dis 1993;52:829–34. [DOI] [PMC free article] [PubMed] [Google Scholar]
- 56. Rantanen T, Guralnik JM, Foley D, et al. Midlife hand grip strength as a predictor of older age disability. JAMA 1999;281:558–60. [DOI] [PubMed] [Google Scholar]
- 57. Parry E, Ogollah R, Peat G. ‘Acute flare‐ups’ in patients with, or at high risk of, knee osteoarthritis: a daily diary study with case‐crossover analysis. Osteoarthritis Cartilage 2019;27:1124–8. [DOI] [PubMed] [Google Scholar]
- 58. Thomas MJ, Neogi T. Flare‐ups of osteoarthritis: what do they mean in the short‐term and the long‐term? Osteoarthritis Cartilage 2020;28:870–3. [DOI] [PMC free article] [PubMed] [Google Scholar]
- 59. Ferguson R, Culliford D, Prieto‐Alhambra D, et al. Encounters for foot and ankle pain in UK primary care: a population‐based cohort study of CPRD data. Br J Gen Pract 2019;69:e422–9. [DOI] [PMC free article] [PubMed] [Google Scholar]
- 60. Paterson KL, Harrison C, Britt H, et al. Management of foot/ankle osteoarthritis by Australian general practitioners: an analysis of national patient‐encounter records. Osteoarthritis Cartilage 2018;26:888–94. [DOI] [PubMed] [Google Scholar]
- 61. Sarkisian CA, Hays RD, Mangione CM. Do older adults expect to age successfully? The association between expectations regarding aging and beliefs regarding healthcare seeking among older adults. J Am Geriatr Soc 2002;50:1837–43. [DOI] [PubMed] [Google Scholar]
- 62. Darlow B, Brown M, Thompson B, et al. Living with osteoarthritis is a balancing act: an exploration of patients’ beliefs about knee pain. BMC Rheumatol 2018;2:15. [DOI] [PMC free article] [PubMed] [Google Scholar]
- 63. Chadchavalpanichaya N, Prakotmongkol V, Polhan N, et al. Effectiveness of the custom‐mold room temperature vulcanizing silicone toe separator on hallux valgus: a prospective, randomized single‐blinded controlled trial. Prosthet Orthot Int 2018;42:163–70. [DOI] [PubMed] [Google Scholar]
- 64. Abdalbary SA. Foot mobilization and exercise program combined with toe separator improves outcomes in women with moderate hallux valgus at 1‐year follow‐up: a randomised clinical trial. J Am Podiatr Med Assoc 2018;108:478–86. [DOI] [PubMed] [Google Scholar]
- 65. Hall M, Castelein B, Wittoek R, et al. Diet‐induced weight loss alone or combined with exercise in overweight or obese people with knee osteoarthritis: a systematic review and meta‐analysis. Semin Arthritis Rheum 2019;48:765–77. [DOI] [PubMed] [Google Scholar]
Associated Data
This section collects any data citations, data availability statements, or supplementary materials included in this article.
Supplementary Materials
Disclosure Form
Appendix S1 Supplementary Information