

Abstract
Background
Sublingual immunotherapy (SLIT) for grass pollen allergy can modify the natural history of allergic rhinitis and is associated with increased allergen‐specific IgG4. IgG4 competitively inhibits functional IgE on the surface of effector cells, such as mast cells and basophils, from binding to allergens. To further understand the important role memory B‐cell (Bmem) responses play in mediating the beneficial effects of SLIT, we assessed changes in allergen‐specific Bmem subsets induced by SLIT for grass pollen allergy.
Methods
Blood samples were collected twice outside the pollen season from twenty‐seven patients with sensitization to ryegrass pollen (RGP; Lolium perenne) and seasonal rhinoconjunctivitis. Thirteen received 4‐month pre‐seasonal SLIT for grass pollen allergy, and 14 received standard pharmacotherapy only. Single‐cell RNA sequencing was performed on FACS‐purified Lol p 1‐specific Bmem before and after SLIT from four patients, and significant genes were validated by flow cytometry on the total cohort.
Results
Four months of SLIT increased RGP‐specific IgE and IgG4 in serum and induced two Lol p 1‐specific Bmem subsets with unique transcriptional profiles. Both subsets had upregulated expression of beta 1 integrin ITGB1 (CD29), whereas IGHE (IgE), IGHG4 (IgG4), FCER2 (CD23), and IL13RA1 were upregulated in one subset. There was an increase in the proportion of Lol p 1+ Bmem expressing surface IgG4, CD23, and CD29 after SLIT.
Conclusions
A clinically successful 4 months course of SLIT for grass pollen allergy induces two transcriptionally unique Bmem fates. Associated changes in surface‐expressed proteins on these Bmem subsets can be used as early biomarkers for treatment effects.
Keywords: allergen immunotherapy, biomarkers, grass pollen allergy, memory B cells, transcriptomics
Using recombinant Lol p 1 tetramers, allergen‐specific Bmem from patients allergic to ryegrass pollen were examined before and after 4 months of SLIT. Single‐cell RNA sequencing revealed that SLIT drives two unique transcriptional Bmem fates, typified by CD23, IgG4, IgE, CD29, and IL13Ra1 expression. Flow cytometry confirmation revealed that CD29 expression is the best positive predictor of SLIT effects.Abbreviations: AR, allergic rhinitis; Bmem, memory B cells; FCER2, Fc epsilon receptor II; IGH, immunoglobulin heavy chain; IL13RA1, interleukin 13 receptor subunit alpha 1; ITGB1, integrin subunit beta 1; SLIT, sublingual immunotherapy.

Abbreviations
- AIT
allergen‐specific immunotherapy
- AU
arbitrary units
- BAT
basophil activation test
- Bmem
memory B cells
- DEG
differentially expressed gene
- MFI
median fluorescence intensity
- PBMC
peripheral blood mononuclear cells
- PCA
principal component analysis
- RGP
ryegrass pollen
- SLIT
sublingual immunotherapy
- SPT
skin prick test
1. INTRODUCTION
Grass pollen allergy is the leading cause of seasonal allergic rhinitis (AR) worldwide, with 10%–30% of the global population exhibiting sensitization to one or more grass pollen allergens. 1 Allergies to grass pollens are a considerable burden on quality of life due to ongoing symptoms of rhinoconjunctivitis throughout the pollen season, anxiety in grass‐covered areas such as public parks, the development of co‐morbidities such as asthma and the financial costs of treatment and time off work or school. 2 , 3 , 4 , 5 Furthermore, grass pollen allergy is the underlying cause of thunderstorm asthma which can overwhelm healthcare institutions, exemplified by the November 2016 thunderstorm event in Melbourne, Australia, there were more than 3000 hospitalizations and 10 deaths. 6 , 7
Allergen immunotherapy (AIT) can successfully modify the natural history of allergic disease and is associated with increased allergen‐specific IgG4 and increased circulating allergen‐specific regulatory T(reg) and B(reg) cells. 8 Sublingual immunotherapy (SLIT) for grass pollen allergy can protect against thunderstorm asthma and prevent AR in the pollen season. 9 Such protection is associated with increased serum allergen‐specific IgG2 and IgG4 and an increased IgG4:IgE ratio. 9 , 10 IgG4 antibodies generated by AIT have been demonstrated to competitively inhibit specific IgE from binding to the allergen, which can prevent the onset of allergic symptoms by inhibiting effector cell degranulation. 11 , 12 , 13 Furthermore, the protective effect of allergen‐specific IgG can be further extended to other isotypes, particularly IgG1 and possibly IgG2, in preventing the binding of allergen‐specific IgE on the surface of effector cells or the ligation of inhibitory Fcγ receptors. 14 , 15
Despite the critical role of IgE in allergy pathogenesis and the role of AIT‐induced IgG in protecting against allergic responses, our understanding of allergen‐specific memory B cells (Bmem) and their role in AIT remains limited. IgE responses to allergens are driven by IL‐13‐expressing follicular helper T(fh) cells in the germinal center, 16 suggesting that this process leads to the formation of allergen‐specific Bmem. AIT for HDM allergy has been demonstrated to induce relative expansion of circulating allergen‐specific B cells expressing IgA or IgG4, as well as IL‐10+IL‐10Rα+ Breg. 17 Single‐cell transcriptomics of allergen‐specific plasmablasts from peanut‐allergic patients identified a unique transcriptional profile including expression of IGHE and FCER2, 18 but the transcriptional profile of allergen‐specific Bmem remains largely unknown. We have previously reported that 4 months of pre‐seasonal SLIT for grass pollen allergy can alleviate symptoms of AR and risk of thunderstorm asthma, 9 and that this is associated with increases in serum allergen‐specific IgG4 and proportions of total circulating IgG4 + B cells. 10
Recent advances in the use of allergen tetramers to identify allergen‐specific Bmem by flow cytometry have provided a novel opportunity to investigate the effect of AIT on this rare cell population. 19 We here applied fluorescent tetramers of the major RGP allergen Lol p 1 to purify circulating allergen‐specific Bmem from RGP‐allergic patients before and after 4 months of SLIT prior to the pollen season. The Bmem were subjected to single‐cell RNA sequencing to examine transcriptional changes induced by SLIT, subsequently evaluated at the protein level through multiparameter flow cytometry to identify early biomarkers for treatment success.
2. METHODS
2.1. Study design
Subjects with moderate to severe seasonal AR with or without asthma, and serum RGP‐specific IgE of ≥0.35 kUA/L (ImmunoCAP, Phadia) were recruited from the Allergy Clinics of The Alfred and Box Hill Hospitals (Alfred Ethics Committee project number 514/13). Exclusion criteria were immunodeficiency, AIT within the last 5 years, and treatment with continuous oral corticosteroids and/or β‐blockers. The study was conducted according to the principles of the Declaration of Helsinki, and written informed consent from each participant was obtained prior to inclusion.
All patients were permitted standard pharmacotherapy with anti‐histamines and topical intranasal corticosteroids and/or antihistamines for local symptom relief. Subjects that received SLIT as per standard protocol were treated with a commercial 5‐grass pollen SLIT tablet (Oralair®; Stallergenes) using a 4 months (May/June through to September/October) regimen completed prior to the Australian pollen season in 2019. Treatment with Oralair® involved dissolution under the tongue (at least 2 min) followed by swallowing the residue. The treatment regimen comprised: day 1–1 tablet 100 IR (index of reactivity); day 2–2 tablets 100 IR; day 3 to day 120–1 daily tablet 300 IR. Two years after recruitment, patients were contacted by phone and asked to report whether or not they had noticed a change in symptoms of allergic rhinitis in the subsequent spring after receiving 4 months of SLIT.
2.2. Blood sampling and ELISA
Heparinized blood samples were processed within 24 h of collection for PBMC isolation and storage. Serum was isolated concurrently. Serum RGP‐specific‐IgE levels were measured by ImmunoCAP and Lol p 1‐specific IgE was measured by a semi‐quantitative in‐house ELISA, as described previously. 10 , 20 , 21 Briefly, ELISA plate wells were coated with recombinant monomeric, non‐biotinylated Lol p 1 (MyBiosource), blocked with 5% skim milk powder in PBS, and incubated with serial dilutions of serum samples. For Lol p 1‐specific IgG2 and IgG4 ELISA, standard curves were generated with chimeric Lol p 1‐specific IgG2 or IgG4 monoclonal antibodies generated from a previously described mouse hybridoma producing Lol p 1‐specific antibody (see next section). 22 For Lol p 1‐specific IgE ELISA, separate wells were incubated with a range of concentrations of purified recombinant human IgE (clone AbD18705; Bio‐Rad) to generate a standard curve for relative quantification of IgE in serum. Antibody bound to Lol p 1 was detected using polyclonal rabbit anti‐hIgE (Agilent), biotinylated anti‐hIgG2 (clone HP6002, Thermo Fisher Scientific), or biotinylated anti‐hIgG4 (clone HP6025, Sigma Aldrich) followed by polyclonal goat anti‐rabbit HRP (Promega). ELISA were developed using TMB (Thermo Fisher Scientific) before the reaction was stopped with 1 M HCl and absorbance measured at OD 450 nm on a Multiskan Microplate Spectrophotometer (Thermo Fisher Scientific). Wells without allergens were used to determine background values. Arbitrary units (AU) were calculated by subtracting background values from allergen‐specific Ig absorbance values.
2.3. Production of recombinant Lol p 1 and anti‐Lol p 1 IgG2 and IgG4 antibodies
Production of and validation of recombinant Lol p 1 in Spodoptera frugiperda 21 (Sf21) insect cells was described previously. 23 The Lol p 1.0101 isoform 24 , 25 was generated with the N‐terminal leader sequence of insect allergen Api m 1 for secretion, a 6‐His tag for purification and a BirA tag for targeted biotinylation. To prevent unwanted effects of catalytic activity, a mutation was introduced (H104V), as published previously. 26 Purified, recombinant Lol p 1 was tetramerized with fluorochrome‐conjugated streptavidin (PE and APC or BV711 and BUV395 conjugates; BD Biosciences) at a 4:1 molar ratio of Lol p 1:streptavidin.
Chimeric IgG2 and IgG4 monoclonal antibodies specific to Lol p 1 were generated based on the Igh and Igκ variable regions from a previously‐described mouse hybridoma producing a Lol p 1‐specific antibody. 22 The PCR‐amplified (Table S1) 27 , 28 Igh variable region was cloned into the pWin98 expression vector containing human IgG2 and into the pBAR981 expression vector containing human IgG4 constant regions. The Igκ variable region was cloned into pWin187. Resultant plasmids were transfected into Expi293F cells (Thermo Fisher Scientific, Scoresby, Australia). Anti‐Lol p 1 IgG2 and IgG4 were purified using a Protein A column (GE Healthcare Amersham Biosciences) and Lol p 1‐specificity confirmed by ELISA. 23
2.4. Flow cytometry and cell sorting
Isolation of Lol p 1‐specific Bmem for single‐cell transcriptomics was performed using fluorescence‐activated cell sorting. Briefly, ten million PBMC were incubated with a 10‐color cocktail of 2 Lol p 1 allergen tetramers (APC and PE) and 7 antibodies against B‐cell markers (CD19, CD38, CD27, IgM, IgD, IgG, IgA) for 15 minutes at room temperature in 300 μl total volume (Table S2). Lol p 1‐specific Bmem were defined (Lol p 1 + CD19 + CD27 + CD38dim, Lol p 1 + CD19 + CD27‐CD38dimIgM‐IgD‐IgG+ and Lol p 1 + CD19 + CD27‐CD38dimIgM‐IgD‐IgA+), and sorted from four patients before and after SLIT on a 6‐laser FACSAria™ Fusion (BD Biosciences).
Detailed immunophenotyping of Lol p 1 specific Bmem was performed on 27 paired samples from RGP‐allergic patients. B‐cell subsets were defined as described previously. 29 , 30 , 31 Briefly, within the CD19+ B‐cell population, the proportions of IgM+ Bmem (CD38dimCD27 + IgM+), IgG + Bmem (CD38dimIgD‐IgM‐IgG+) and IgA+ Bmem (CD38dimIgD‐IgM‐IgA+) were determined.
Data were acquired on a 5‐laser BD LSRFortessa X‐20 with instrument set‐up and calibration performed using standardized EuroFlow SOPs, as described in detail previously. 32 , 33 All flow cytometry data were analyzed with FACS DIVA v8.0.1 (BD Biosciences) and FlowJo v10 software packages (FlowJo LLC).
2.5. Single‐cell transcriptome profiling
FACS purified Lol p 1+ Bmem from four patients were labeled with sample tags according to the manufacturer's instructions (Human Single‐Cell Multiplexing Kit, BD Biosciences). To ensure our transcriptomic analysis of Lol p 1‐specific Bmem was representative of the wider cohort, we used PBMC from four subjects with an allergen‐specific immunoglobulin profile representative of all patients recruited for SLIT (Figure 1). Single‐cell capture, cDNA synthesis, and library preparation were performed using the BD Rhapsody Single‐Cell Analysis System (BD Biosciences) for whole transcriptome analysis, according to manufacturer's instructions. Libraries were sequenced on a single run using an Illumina MiSeq platform (Genomics Hub, The Walter and Elisa Hall Institute of Medical Research). Raw sequences were processed using the SevenBridges platform (SevenBridges) to identify sample tags, cell barcodes, and the number of transcripts per cell. Cells without identifiable sample tags were excluded from further analysis. From the four patients, 512 Lol p 1‐specific Bmem were identified for single‐cell transcriptomic analysis. Patient 1 contributed 130 cells (27 pre‐SLIT, 103 post‐SLIT), patient 2 contributed 193 cells (96 pre‐SLIT, 97 post‐SLIT), patient 3 contributed 105 cells (45 pre‐SLIT, 60 post‐SLIT), and patient 4 contributed 84 cells (21 pre‐SLIT, 63 post‐SLIT). Single‐cell transcriptomics data were analyzed with SeqGeq v1.6 software package (FlowJo LLC). Read counts were normalized to a total library size of 10,000 reads per cell. Dimensionality reduction by principal component analysis (PCA) determined 25 principal components derived from the top 200 genes with most dispersed gene expression. T‐distributed stochastic neighbor embedding (tSNE) analysis was performed with 25 principal components from PCA. Pseudotime analysis to construct single‐cell trajectories was determined with Monocle v.2 plugin. Data dimensionality was reduced by reversed graph embedding with a gene expression filter of one and a cell expression filter of ten.
FIGURE 1.
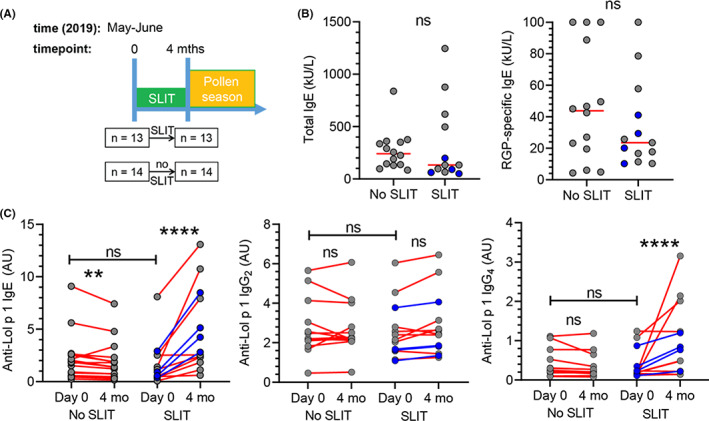
Four months of SLIT increases Lol p 1‐specific IgE and IgG4 in serum. A, Patient recruitment in May and June 2019 and timeline of 4 months pre‐seasonal SLIT for grass pollen allergy. B, Total and RGP‐specific IgE in serum at timepoint 0. Red bars, median values. Statistics, Mann–Whitney U‐test; ns, not significant. C, Lol p 1‐specific IgE, IgG2 and IgG4 in serum at t = 0 and 4 months. B, C, Data from the four subjects that were included for transcriptomic analysis of Lol p 1‐specific Bmem are highlighted in blue. Statistics, Wilcoxon signed rank test; **p < 0.01; ****p < 0.0001
2.6. Statistics
Differential gene expression from the combined transcripts of all cells before vs after SLIT was illustrated by volcano plots and significance determined by Bonferroni corrected Mann–Whitney t‐test. Genes with a Q‐value <0.05 and absolute fold change ≥1.5 were considered significantly and relevantly different between the analyzed subsets. Differences in proportions of IGHC transcripts were statistically analyzed with the chi‐square test.
Statistical analyses of flow cytometric data were performed using Graphpad Prism (v8.4.1): Paired data were analyzed with the non‐parametric Wilcoxon signed rank test and unpaired data with the non‐parametric Mann–Whitney U‐test. For all tests, p < 0.05 was considered significant.
3. RESULTS
3.1. Participant characteristics
In an investigator‐initiated study, thirteen RGP‐allergic patients were recruited after their decision to commence SLIT (median 46 years, 31% female), and fourteen patients who received standard pharmacotherapy only (median 32 years, 64% female) (Figure 1A). All 27 patients suffered from moderate to severe seasonal AR with or without asthma, and had serum RGP‐specific IgE of ≥0.35 kUA/L (ImmunoCAP).
3.2. Four‐month SLIT increases serum allergen‐specific IgE and IgG4 levels
Meta‐analyses and clinical trials have confirmed the clinical efficacy of SLIT with a 5‐grass mix. 9 , 10 , 34 Our prior study demonstrated that one 4 months course of pre‐seasonal SLIT reduced self‐reported symptoms of allergic rhinitis, and that this effect increased with successive courses over the following 2 years. 23 Of the 13 patients in our active study arm accessible 2 years later, 12 (92%) reported clinical benefit, thereby validating the efficacy of SLIT in this cohort. 23 There were no significant differences in total, RGP‐specific or Lol p 1‐specific IgE at the time of recruitment between patients recruited to receive SLIT and those who did not receive SLIT (Figure 1B,C). Four months of SLIT increased Lol p 1‐specific IgE and IgG4 (Figure 1C). In patients who did not receive SLIT, the intervening 4 months saw a slight but significant decrease in Lol p 1‐specific IgE, whereas Lol p 1‐specific IgG2 and IgG4 levels were unchanged (Figure 1C).
3.3. Increased expression of IGHE and IGHG4 transcripts in Lol p 1‐specific Bmem after SLIT
To investigate the immunological effects of SLIT, we conducted single‐cell transcriptomics on Lol p 1‐specific Bmem from four patients before and after 4 months of SLIT. Following electronic gating of Bmem (details in Methods), Lol p 1‐specific Bmem were identified by double‐positivity for two fluorescent Lol p 1 tetramer conjugates using APC and PE fluorochromes (Figure 2A). Outliers for total reads per gene (<150 or > 15,000) and cells per gene (<30) were excluded, followed by dimensionality reduction with PCA based on the 200 most dispersed genes (Figure 2B–D). This resulted in 745 cells that formed 2 main clusters. One enriched for the myeloid gene CD14 (233 cells; Figure 2E) was excluded from further analysis as this was deemed to comprise monocytes. The main cluster of 512 cells expressed the canonical B‐cell gene MS4A1 (CD20).
FIGURE 2.
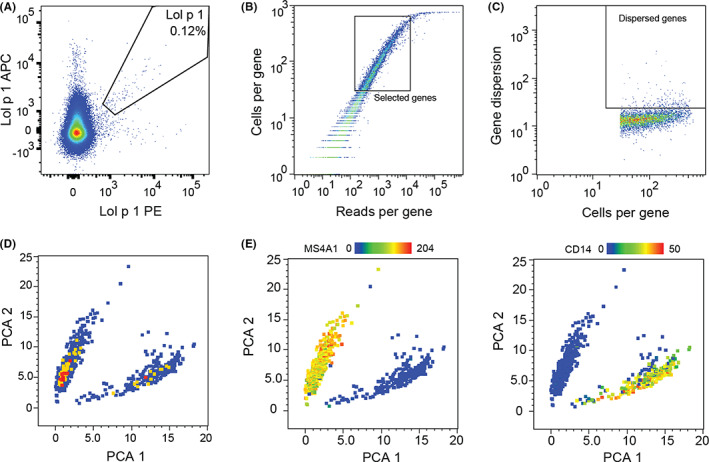
Identification of Lol p 1‐specific B cells for single‐cell transcriptomic analysis. Single‐cell RNA sequencing of PBMC sorted for Lol p 1‐specific Bmem by FACS from four patients before and after SLIT was conducted using the BD Rhapsody Whole Transcriptome Analysis pathway. A, Exemplary plot of Lol p 1‐specific Bmem sorted for single‐cell transcriptomics. Number indicates proportion of Bmem. B, Selection of genes used for the identification of B cells (square gate), excluding those with low expression (insufficient sequencing) or high and ubiquitous expression (housekeeping genes). C, The top 200 genes with highest dispersion in expression among all cells were used to generate D, PCA plot with two distinct clusters. E, Heatmaps of expression patterns for canonical B‐cell gene MS4A1 and myeloid gene CD14 identified separate clusters. Monocytes (lower cluster; 233 cells) were excluded from further analyses
To investigate the Ig gene usage of these Bmem, we assessed the expression of the IGH constant regions (Figure 3A), as well as expression of the IGK and IGL light chain regions. Each cell expressed one predominant IGH isotype and a single IGK or IGL constant region (Figure 3B). The proportions of IGHE and IGHG4 among total IGH transcripts were significantly increased in Lol p 1‐specific Bmem after SLIT (Figure 3C). There were no differences in the proportion of IGK or IGL expression in Lol p 1‐specific Bmem before and after SLIT (data not shown). Thus, after 4 months SLIT, both allergen‐specific IgE and IgG4 serum levels as well as Bmem expressing IGHE and IGHG4 were increased (Figure 1C).
FIGURE 3.
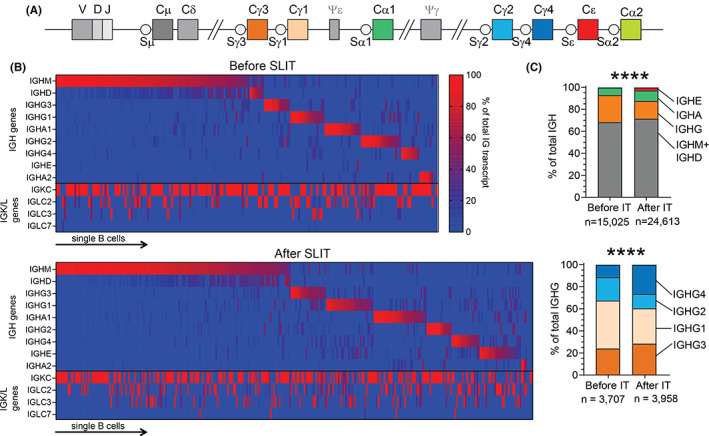
SLIT increases proportions of IGHE and IGHG4 transcripts in Lol p 1‐specific Bmem. A, Schematic of the constant genes in the human IGH locus depicting their position relative to the variable domain of the VDJ exon. B, Proportion of transcripts for IGH or IGK and IGL genes in single Lol p 1‐specific Bmem before (n = 189) and after SLIT (n = 323) isolated from four allergic patients used for single‐cell transcriptomic analysis. Cells arranged left‐to‐right based on maximal expression of IGH transcripts in the order of IGH genes in the human IGH locus (IGHM to IGHA2). C, Proportion of total IGH or IGHG gene transcripts in these Lol p 1‐specific Bmem before and after SLIT. Statistics for the proportional distribution of IGH and IGHG in (C), χ 2 test; ****p < 0.0001
3.4. Expansion of two transcriptionally distinct Bmem subsets after SLIT
The transcription profiles of the 512 Lol p 1‐specific Bmem included those for n = 189 pre‐ and 323 post‐SLIT. Direct comparison of the gene transcripts between these pre‐ and post‐SLIT samples showed that only 12 transcripts were >1.5‐fold upregulated and 3 were >1.5 fold downregulated (Figure 4A). To further investigate the transcriptional changes following SLIT on Bmem, we identified differentially expressed genes (DEG) between Lol p 1‐specific Bmem before (n = 189) and after SLIT (n = 323). Most notably, SLIT increased expression of genes with known immunological function including IGHE (IgE), ITGB1 (β1 integrin; CD29), PPP1R18 (phostensin), and oncogene PARM1 (Figure 4A ). In contrast, expression of JUN (c‐jun) and CD69 was reduced after SLIT.
FIGURE 4.
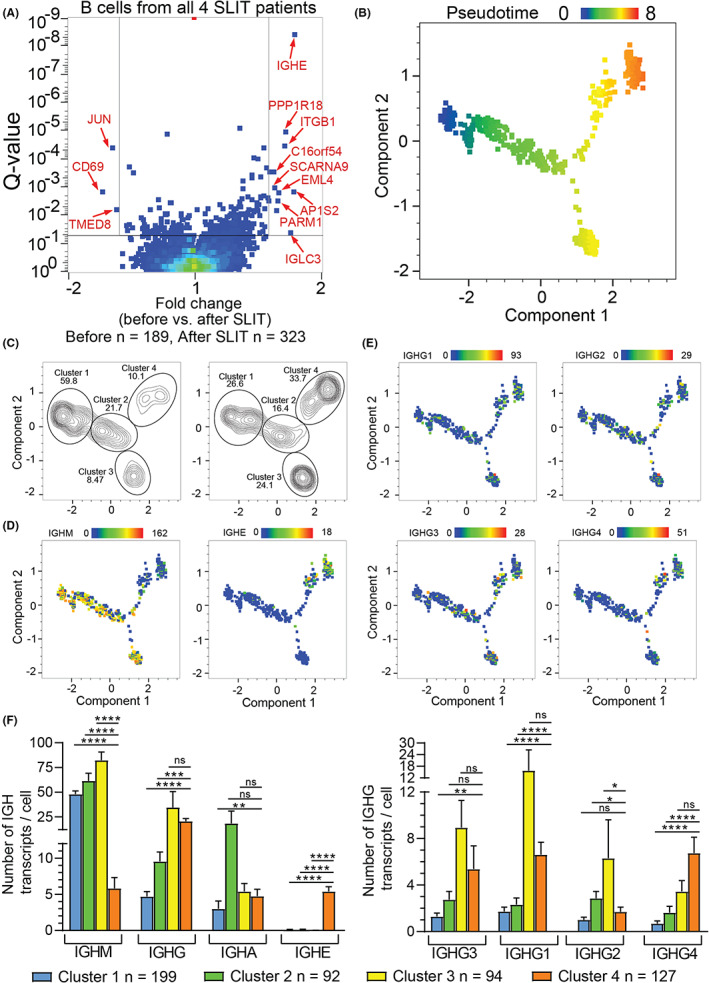
SLIT increases the proportion of IGHE, IGHG1 and IGHG4‐expressing Lol p 1‐specific Bmem and promotes differentiation toward two transcriptionally distinct clusters A, DEG in Lol p 1‐specific Bmem before and after SLIT. Genes with >1.5‐fold change and q < 0.05 identified by red arrows. Genes with >1.5‐fold change and q < 0.05 identified by red arrows. B, Pseudotime clustering based on the 268 genes (Q < 0.05) identified in 4A. C, B‐cell clusters identified by pseudotime analysis before or after SLIT. D, Heat map of IGHM, IGHE and E, IGHG1‐4 gene expression in B cells clustered by pseudotime analysis. F, IGH gene expression in Bmem from the four distinct pseudotime clusters. Statistics: Mann–Whitney U‐test;*p < 0.05; **p < 0.01; ***p < 0.001; ****p < 0.0001; ns, not significant
A large number of genes were significantly different (Q < 0.05) with a < 1.5‐fold change after SLIT (Table S3), potentially due to heterogeneity in the populations before and/or after SLIT. To assess this at the single‐cell level, all n = 268 genes with Q < 0.05 were used to generate PCA and tSNE plots (Figure S2B; Table S4). Both analyses did not yield distinct clusters of Bmem before and after SLIT. To identify clusters of transcriptional profiles associated with changes induced by SLIT, we conducted a pseudotime analysis on the same 268 genes. The B‐cell cluster expressing IGHM and IGHD was designated pseudotime zero due to not being Ig class‐switched, followed by 3 more clusters. Cluster 2 had a higher pseudotime value, followed by clusters 3 or cluster 4, which contained predominantly Ig class‐switched B cells (Figure 4B,C). After SLIT, the proportion of Bmem in cluster 1 (pseudotime 0–2) decreased, with relatively more Bmem in the most differentiated states: cluster 3 (pseudotime 5–6) and cluster 4 (pseudotime 6–8) (Figure 4C). Heat maps of IGH gene expression demonstrated that increasing pseudotime is associated with a shift from IGHM to expression of class‐switched IGH isotypes, particularly IGHE in cluster 4 (Figure 4D,F). Indeed, Bmem in cluster 4 were enriched for IGHE, IGHG1, and IGHG4 expression whereas cluster 3 predominantly expressed IGHM, IGHG3, and IGHG1 (Figure 4G; Figure S3A,B). Given that SLIT increased the proportion of B cells in clusters 3 and 4, this suggests that SLIT induces class‐switching and differentiation toward two distinct transcriptional profiles.
3.5. Gene expression associated with transcriptional profiles induced by SLIT
DEG analysis of distinct pseudotime clusters confirmed increases in IGHE, IGHG4, and IGHG1 in cluster 4 compared to cluster 1, whereas cluster 1 was enriched for IGHM and IGHD (Figure 5A,B; Table S5). Compared to cluster 1, cluster 4 also had increased expression of immune‐related genes such as PARM1, IL13RA1, ITGB1, PPP1R18, SELL, and FCER2 and decreased expression of CXCR4 and CD69 (Figure 5B). Similarly, cluster 3 also had increased expression of ITGB1 and PPP1R18 alongside decreased CXCR4 expression compared to cluster 1 (Figure 5B; Table S6). Furthermore, cluster 3 exhibited increased expression of FGR, SIGLEC10, CD99, and TLE3 and decreased expression of TXNIP, BTG1, and FCER2 compared to cluster 1. Comparing clusters 3 and 4, cluster 4 had increased expression of SELL, FCER2, IGHE, IL13RA1, IL4R, PARM1, and ITGB1 whereas cluster 3 had increased expression of IGHM, IGHD, CD1C, PLAC8, SYK, FGR, FCGR2B, FCRLA, FCRL2, FCRL3, FCRL5, and ITGAX (Figure 5B; Table S7). Due to unique expression patterns of ITGB1, FCER2 and IL13RA1 in pseudotime cluster 4 compared to clusters 1–3, as well as the association of this cluster with IgE and IgG4 which we have observed previously to be increased by SLIT, we wished to visualize the expression of these genes relative to their space in pseudotime to further characterize these cells (Figure 5C). Expression of these genes changed as pseudotime progressed reflecting the changes in Bmem transcriptional profiles along a SLIT‐induced differentiation pathway.
FIGURE 5.
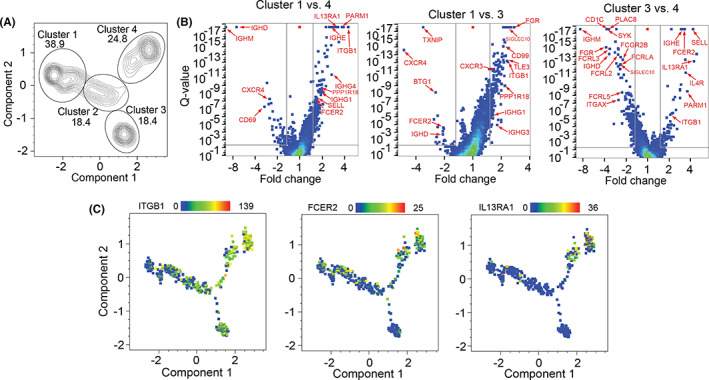
Lol p 1‐specific Bmem generated by SLIT show increased expression of ITGB1 (CD29), FCER2 (CD23), and IL13RA1 (CD213A1). A, Pseudotime clustering of all Lol p 1‐specific Bmem from four patients before and after SLIT using genes identified in Figure 3A. Numbers indicate proportion of clusters. B, Volcano plots of DEG comparing pseudotime clusters 1 to 4, 1 to 3, and 3 to 4. Significant genes (p > 0.05) with largest fold change or known immunological interest indicated by red arrows. C, Heatmap of gene expression for ITGB1, FCER2, and IL13RA1 on pseudotime plot from A
3.6. Confirmation of changes in IgG4, CD29, and CD23 by flowcytometric immunophenotyping of Lol p 1‐specific Bmem
To validate SLIT‐induced changes in gene expression identified by transcriptomics, we used flow cytometry to assess the expression of IgM, IgG, IgG4, and IgA isotypes and CD29 (ITGB1), CD23 (FCER2), and CD213A1 (IL13RA1) on Lol p 1‐specific Bmem at timepoints 0 and 4 months from patients who received or did not receive SLIT. Following electronic gating of CD19+ B cells and removal of CD3+ T cells, Lol p 1‐specific B cells were identified by double‐positivity for two fluorescent Lol p 1 tetramer conjugates using small molecule fluorophores BUV395 and BV711 (Figure 2A , Figure S1A–E). Lol p 1 tetramers did not bind to CD3+ T cells (Figure S1C), nor did B cells bind directly to the streptavidin‐fluorochrome conjugates used to generate these tetramers (Figure S1D). We did not observe CD14+ monocyte contamination in our identification of Lol p 1‐specific B cells (Figure S4A,B). In conjunction with additional gating on IgG2+, IgG4+ or IgA+, B cells that were double‐positive for both tetramers constitute a bona fide population of Lol p 1‐specific B cells. In patients who received SLIT, the number of Lol p 1‐specific Bmem was increased (Figure 6A). Both proportion and number of IgG+ (all IgG isotypes) and more specifically IgG4 + Lol p 1‐specific Bmem increased after SLIT, whereas the proportion of IgM+ Lol p 1‐specific Bmem decreased (Figure 6B , Figure S5A). Subjects who did not receive SLIT had no observable change in proportion or number of Lol p 1‐specific Bmem over the 4‐month time course (Figure 6A,B). SLIT also increased the proportion and number of CD29hi Lol p 1‐specific Bmem and was further associated with increases in CD29 and CD23 staining on Lol p 1‐specific Bmem (Figure 6C–F, Figure S5B). These flow cytometry data correspond with our transcriptomic data that identified increased proportions of Lol p 1‐specific Bmem expressing FCER2 (CD23) and ITGB1 (CD29) after SLIT (Figure 5). The one subject who did not report a benefit of SLIT (indicated by red dots and black lines in Figure 6) displayed decreases in total, IgG+ and CD29hi Lol p 1‐specific Bmem. In contrast, we did not observe any change in CD213A1 staining on Lol p 1‐specific Bmem from patients who received SLIT (Figure 6G). Staining of CD29, CD23, and CD213A1 on Lol p 1‐specific Bmem from patients who did not receive SLIT was unchanged (Figure 6D–G).
FIGURE 6.
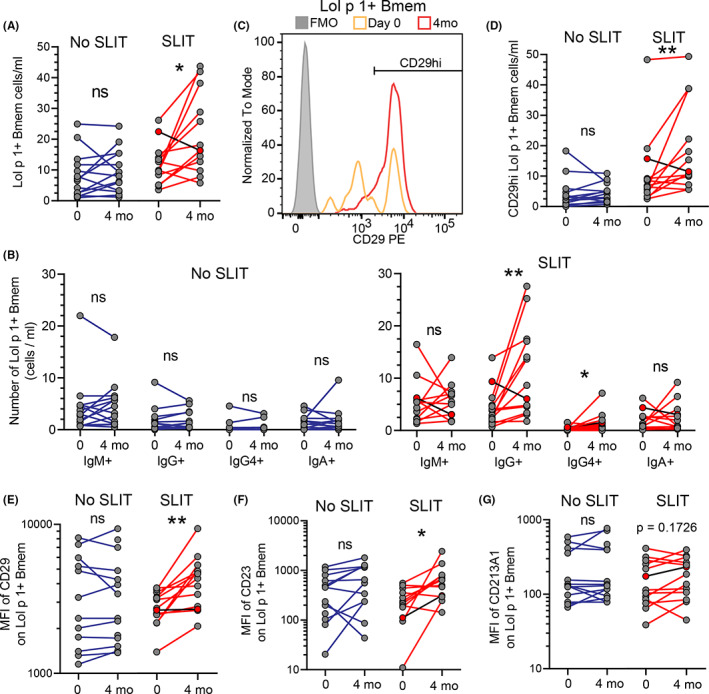
Increased numbers of circulating IgG4 + Lol p 1‐specific Bmem and surface expression of CD29 and CD23 after SLIT. A, Number of circulating Lol p 1‐specific Bmem and B, number of IgM+, IgG+, IgG4 +, and IgA+ Lol p 1‐specific Bmem from PBMC of RGP‐allergic patients before and after SLIT (red lines; SLIT n = 13) or from RGP‐allergic patients that did not receive SLIT (blue lines; no SLIT n = 14). The only patient to report no clinical benefit of SLIT is indicated by red dots and black lines. C, Representative histogram of CD29 expression on Lol p 1‐specific Bmem from one RGP‐allergic patient before (orange) and after (red) SLIT. Fluorescence minus one (FMO) control from after SLIT in gray. D, Number of CD29hi Lol p 1‐specific Bmem and MFI of E, CD29, F, CD23 and G, CD213A1 on Lol p 1‐specific Bmem. Statistics, Wilcoxon signed rank test; *p < 0.05; **p < 0.01; ns, not significant
3.7. CD29hi ‐expressing Lol p 1+ Bmem as biomarker
To evaluate the potential of each marker as a predictor of treatment outcome, receiver‐operator curves (ROC) were generated for treated vs untreated patients. To evaluate the effects of 4 months SLIT, the first evaluation was the ratio of markers after 4 months divided by the pre‐treatment values (Figure 7A) for total Lol p 1+ Bmem, CD29hi Lol p 1+ Bmem, and for expression levels of CD29, CD23, and CD213A1 on Lol p 1+ Bmem. None of the areas under the curve (AUC) were very high with CD29hi Lol p 1+ Bmem being the most predictive with an AUC of 0.72 (Figure 7A). Subsequently, for a comparison of SLIT vs no SLIT, we only evaluated the markers at 4 months. These yielded higher AUC for Lol p 1+ Bmem (0.79) and CD29hi Lol p 1+ Bmem (0.95), while the AUC for expression levels of CD29, CD23, and CD213A1 did not improve (Figure 7B). Thus, at 4 months of treatment, CD29+ Lol p 1+ Bmem numbers are a very strong indicator of treatment effect and more specific than total Lol p 1+ Bmem.
FIGURE 7.
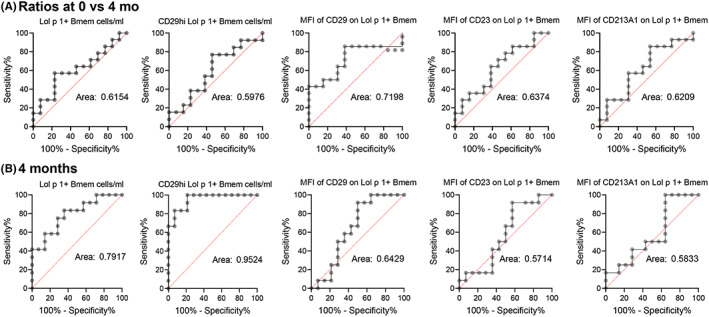
Positive predictive values of biomarkers for allergen immunotherapy. A, Receiver‐operator curves of ratios before/after 4 months for patients treated with SLIT vs untreated RGP allergic patients. Shown are Lol p 1+ Bmem numbers, CD29hi Lol p 1+ Bmem numbers and MFI of CD29, CD23, and CD213A1 on Lol p 1+ Bmem. B, Receiver‐operator curves of data obtained at the 4‐month timepoint for patients treated with SLIT vs untreated RGP‐allergic patients. Shown are Lol p 1+ Bmem numbers, CD29hi Lol p 1+ Bmem numbers and MFI of CD29, CD23, and CD213A1 on Lol p 1+ Bmem
Taken together, we demonstrate SLIT induces class‐switching from IgM to IgG, including IgG4, in circulating allergen‐specific Bmem and that these Bmem uniquely and highly express both CD29 and CD23. These changes at the transcript and protein level demonstrate that already after 4 months of SLIT for grass pollen allergy, allergen‐specific Bmem display a change in their immunophenotype.
4. DISCUSSION
We here describe for the first time the effect of SLIT for grass pollen allergy on the gene expression profile of allergen‐specific Bmem. We have identified distinct Bmem transcriptional profiles and demonstrated, using pseudotime analysis, that SLIT induces differentiation toward two branches of distinct transcriptional clusters.
In this study, one course of 4 months SLIT resulted in an increase in allergen‐specific IgE and IgG4 in serum, consistent with our prior study on a separate cohort. 10 This is in accordance with a number of studies demonstrating that AIT induces transient increases in allergen‐specific IgE. 35 This transient rise is suggested to result from IgE‐expressing B cells, which are prone to apoptosis and differentiation to short‐lived plasmablasts. 36 , 37 , 38 In contrast, IgG4 appears to be maintained at higher levels for at least three consecutive years of SLIT, 10 suggesting that IgG4 + B‐cell responses induced by SLIT may give rise to long‐lived plasma cells that maintain allergen‐specific IgG4 levels long term. We did not observe a significant increase in Lol p 1‐specific IgG2. Previously, we did observe that RGP‐specific IgG2 increased after 4 months of SLIT. Potentially, the effect magnitude of a single component in this study (Lol p 1) was not sufficient to observe this effect.
SLIT induced differentiation toward a transcriptional profile associated with IGHE‐ and IGHG4‐expressing Lol p 1‐specific Bmem (pseudotime cluster 4). This was confirmed by flow cytometry that identified an increased proportion and number of circulating IgG4 + Lol p 1‐specific Bmem and an increased staining intensity of anti‐IgE on Lol p 1‐specific Bmem after SLIT, which may reflect the normally weak expression of IgE on the surface of B cells. This profile of Ig expression reflects what we observed for serum allergen‐specific Ig titres, whereby SLIT increased Lol p 1‐specific IgE and IgG4. This suggests that transcriptional and flow cytometric profiling of antigen‐specific memory B cells reflects the isotypic nature of antibody responses to SLIT. The profiling of allergen‐specific Bmem can therefore provide valuable insight into the responses to various AIT and yield valuable biomarkers for disease progression or successful AIT for allergies due to the immunophenotype of allergen‐specific Bmem reflecting the response to SLIT.
IL13RA1, IL4R, IGHE, and IGHG4 transcript levels in Lol p 1‐specific Bmem were increased in pseudotime cluster 4 compared to clusters 1 and 3. This is consistent with the role of the Th2 cytokines IL‐13 and IL‐4 in driving class‐switching to IgE and IgG4, which was enhanced after SLIT. Cluster 4 also showed increased expression of FCER2 (encoding CD23), a well‐documented target of IL‐4. 39 , 40
Similar to our observation that IGHE expression and FCER2 expression were concomitant in Lol p 1‐specific Bmem, FCER2 expression has previously been observed in IGHE‐expressing plasmablasts in peanut‐allergic patients. 18 The functional relevance of CD23 expression on class‐switched B cells and plasma cells is largely unknown. Murine transitional B cells expressing CD23 are protected from BCR‐induced apoptosis in contrast to those lacking CD23, exhibiting increased survival from an apoptotic pathway hypothesized to limit potentially autoreactive immature B cells. 41 Although the mechanism by which CD23‐expressing B cells are protected from apoptosis is unclear, protection was reliant on anti‐CD40 and IL‐4, both signals of T cell help. Concomitant expression of Th2 cytokine receptors IL13RA1 and IL4R in IGHE‐expressing Bmem may suggest a requirement of T cells not only for class‐switching, but also for promoting survival of IgE‐expressing B cells, which otherwise are prone to apoptosis. 36 , 37 , 38
SLIT was associated with an increased number of Lol p 1‐specific Bmem highly expressing CD29. CD29 (β1 integrin) is commonly paired with CD49d (α4 integrin) to form the VLA‐4 (α4β1) integrin that binds VCAM‐1 and fibronectin to maintain leukocyte adhesion to the endothelium. 42 In vitro studies have demonstrated that CD29 expression on eosinophils enhances binding to nasal polyp endothelium, 43 and that histamine can induce expression of the CD29 ligand VCAM‐1 on nasal polyp endothelium. 44 VCAM‐1 is highly expressed on nasal polyps compared to the inferior turbinates from patients with diffuse sino‐nasal polyps, and its expression is correlated with recurring development of nasal polyps in these patients. 45 Chronic allergic inflammation characterized by AR may therefore induce and maintain the expression of VCAM‐1 in the upper airway to attract CD29‐expressing allergen‐specific Bmem to the site of allergen exposure and thereby draw circulating Bmem to their cognate antigen and promote allergen‐specific immune responses. This is in accordance with the detection of IGHE germline transcripts in the bronchial mucosa of asthmatic patients, 46 which may indicate that IGHE‐ and IGHG4‐expressing B cells that arise from the immune response to aeroallergens home to the site of allergen exposure. Upon repeated allergen exposure from immunotherapy, class‐switched allergen‐specific Bmem highly expressing CD29 may preferentially home to the site of allergic inflammation, whereby natural allergen exposure may subsequently promote differentiation into IgG‐producing plasmablasts that protect the host from allergic responses by producing IgG antibodies that competitively inhibit IgE on effector cells from binding to allergens. It remains unclear if CD29 expression increases on all circulating human Bmem upon exposure to their cognate antigen, or if persistent or repeated exposure is required. Repeated exposure leads to enhanced Ig class switching, and CD29 expression is typically higher on class‐switched B cells than un‐switched Bmem and naive B cells. 47
The expansion of allergen‐specific Bmem that highly express CD29 is strongly associated with efficacy of SLIT and may prove to be a potential new biomarker for successful immunotherapy. Furthermore, the one patient who did not report a clinical benefit from SLIT did not show a change in CD29 expression. Importantly, this marker can be assessed within a few months of treatment without the need of a pre‐treatment assessment.
The Database of Allergy and Asthma Biomarkers (DAAB; version 2) includes two studies in humans that associate the expression of ITGB1 in leukocytes with allergic disease. 48 One study identified >twofold lower ITGB1 expression in CD3+ T cells of patients with atopic dermatitis as compared to healthy controls, 49 while the other demonstrated a > 2 fold reduction in the expression of ITGB1 in cells of the bronchoalveolar lavage from corticosteroid‐resistant asthmatics compared to corticosteroid‐sensitive asthmatics. 50 These studies did not address allergen‐specific cells or evaluation after immunotherapy and so the finding of reduced CD29 expression does not contradict our result. The fact that the presence of disease might induce lower CD29 expression could actually help to improve the specificity of measurements of increased expression after SLIT.
One limitation of our study is that our cell sorting of Lol p 1‐specific Bmem for single‐cell transcriptomics was contaminated by monocytes. This is likely due to the rarity of these events, making it challenging to isolate these to more than 70% purity. It is unlikely that our tetramers bound to monocytes and that this affected in‐depth immunophenotyping as all B cells were defined by expression of CD19 and at least one surface Ig isotype (IgM, IgD, IgG, IgA, IgE).
Our study demonstrates that AIT induces a unique transcriptional profile in circulating allergen‐specific Bmem whereby B cells are class‐switched to IgE and IgG4, likely due to Th2 cytokines IL‐4 and IL‐13, and that this class‐switching is associated with the expression of CD29 which may promote homing to inflamed tissue. Detection of changes in surface marker expression on allergen‐specific Bmem by flow cytometry may provide a novel avenue for immune monitoring of successful therapy.
AUTHOR CONTRIBUTIONS
MCvZ and REO'H conceived the idea for the present study. REO'H, FT, and MH recruited patients and facilitated sample collection. CIM, NV, PMA, SR, BDW, and PMH conducted experiments. CIM analyzed the data. MCvZ and CIM wrote the manuscript with input from JMR, PMH, and REO'H. All authors revised and commented on the final version of the manuscript.
CONFLICT OF INTEREST
MCvZ, REO’H, and CIM are inventors on a patent application related to this work. All the other authors declare that they have no relevant conflicts of interest.
Supporting information
Figure S1
Figure S2
Figure S3
Figure S4
Figure S5
Appendix S1
Appendix S2
ACKNOWLEDGMENTS
The authors gratefully acknowledge Kirsten Deckert, Sara Bullen, Anita Hazard, Monique Dols and Anna Mackay for collection of clinical data and blood samples from patients, and Adam Nelson and Rosalyn Cao for technical support. We thank Dr. Lucy Sullivan, Ms Sandra Verschoor and Prof Joseph Trapani for sharing of reagents, the ARA FlowCore Facility team for technical assistance, Carole Ford and Nick Wong for assistance with the BD Rhapsody platform, Celine Pattaroni and Giulia Iacono for DNA quantification and Stephen Wilcox for Illumina Sequencing. The studies were supported financially by a NHMRC Senior Research Fellowship 1117687 to MCvZ, a Central Clinical School Early Career Fellowship to CIM, a NHMRC project grant 145303 to PMH, REO'H, BDW and a NHMRC Ideas grant 2000773 to MCvZ, REO'H, BDW and MH. Open access publishing facilitated by Monash University, as part of the Wiley ‐ Monash University agreement via the Council of Australian University Librarians.
McKenzie CI, Varese N, Aui PM, et al. RNA sequencing of single allergen‐specific memory B cells after grass pollen immunotherapy: Two unique cell fates and CD29 as a biomarker for treatment effect. Allergy. 2023;78:822‐835. doi: 10.1111/all.15529
REFERENCES
- 1. García‐Mozo H. Poaceae pollen as the leading aeroallergen worldwide: a review. Allergy. 2017;72:1849‐1858. [DOI] [PubMed] [Google Scholar]
- 2. Blaiss MS, Hammerby E, Robinson S, Kennedy‐Martin T, Buchs S. The burden of allergic rhinitis and allergic rhinoconjunctivitis on adolescents: a literature review. Ann Allergy Asthma Immunol. 2018;121:43‐52. [DOI] [PubMed] [Google Scholar]
- 3. Nathan RA. The burden of allergic rhinitis. Allergy Asthma Proc. 2007;28:3‐9. [DOI] [PubMed] [Google Scholar]
- 4. Schatz M. A survey of the burden of allergic rhinitis in the USA. Allergy. 2007;62:9‐16. [DOI] [PubMed] [Google Scholar]
- 5. Schoenwetter WF, Dupclay L, Appajosyula S, Botteman MF, Pashos CL. Economic impact and quality‐of‐life burden of allergic rhinitis. Curr Med Res Opin. 2004;20:305‐317. [DOI] [PubMed] [Google Scholar]
- 6. Hew M, Lee J, Susanto NH, et al. The 2016 Melbourne thunderstorm asthma epidemic: risk factors for severe attacks requiring hospital admission. Allergy. 2019;74:122‐130. [DOI] [PubMed] [Google Scholar]
- 7. Thien F, Beggs PJ, Csutoros D, et al. The Melbourne epidemic thunderstorm asthma event 2016: an investigation of environmental triggers, effect on health services, and patient risk factors. Lancet Planet Health. 2018;2:e255‐e263. [DOI] [PubMed] [Google Scholar]
- 8. van Zelm MC, McKenzie CI, Varese N, Rolland JM, O'Hehir RE. Recent developments and highlights in immune monitoring of allergen immunotherapy. Allergy. 2019;74:2342‐2354. [DOI] [PubMed] [Google Scholar]
- 9. O'Hehir RE, Varese NP, Deckert K, et al. Epidemic thunderstorm asthma protection with five‐grass pollen tablet sublingual immunotherapy: a clinical trial. Am J Respir Crit Care Med. 2018;198:126‐128. [DOI] [PubMed] [Google Scholar]
- 10. Heeringa JJ, McKenzie CI, Varese N, et al. Induction of IgG2 and IgG4 B‐cell memory following sublingual immunotherapy for ryegrass pollen allergy. Allergy. 2020;75:1121‐1132. [DOI] [PMC free article] [PubMed] [Google Scholar]
- 11. Shamji MH, Kappen J, Abubakar‐Waziri H, et al. Nasal allergen‐neutralizing IgG4 antibodies block IgE‐mediated responses: novel biomarker of subcutaneous grass pollen immunotherapy. J Allergy Clin Immunol. 2019;143:1067‐1076. [DOI] [PubMed] [Google Scholar]
- 12. Shamji MH, Ljørring C, Francis JN, et al. Functional rather than immunoreactive levels of IgG4 correlate closely with clinical response to grass pollen immunotherapy. Allergy. 2012;67:217‐226. [DOI] [PubMed] [Google Scholar]
- 13. James LK, Bowen H, Calvert RA, et al. Allergen specificity of IgG4‐expressing B cells in patients with grass pollen allergy undergoing immunotherapy. J Allergy Clin Immunol. 2012;130:663‐670. [DOI] [PubMed] [Google Scholar]
- 14. MacGlashan D Jr, Alvarez‐Arango S, Tversky J. Subclasses of allergen‐specific IgG: serum IgG2 and IgG3 levels are not predicted by IgG1/IgG4 levels. Clin Exp Allergy. 2021;51:1093‐1095. [DOI] [PMC free article] [PubMed] [Google Scholar]
- 15. Sánchez Acosta G, Kinaciyan T, Kitzmüller C, Möbs C, Pfützner W, Bohle B. IgE‐blocking antibodies following SLIT with recombinant mal d 1 accord with improved apple allergy. J Allergy Clin Immunol. 2020;146:894‐900. [DOI] [PubMed] [Google Scholar]
- 16. Gowthaman U, Chen JS, Zhang B, et al. Identification of a T follicular helper cell subset that drives anaphylactic IgE. Science. 2019;365:eaaw6433. [DOI] [PMC free article] [PubMed] [Google Scholar]
- 17. Boonpiyathad T, van de Veen W, Wirz O, et al. Role of Der p 1–specific B cells in immune tolerance during 2 years of house dust mite–specific immunotherapy. J Allergy Clin Immunol. 2019;143:1077‐1086. [DOI] [PubMed] [Google Scholar]
- 18. Croote D, Darmanis S, Nadeau KC, Quake SR. High‐affinity allergen‐specific human antibodies cloned from single IgE B cell transcriptomes. Science. 2018;362:1306. [DOI] [PubMed] [Google Scholar]
- 19. van Zelm MC, McKenzie CI, Varese N, Rolland JM, O'Hehir RE. Advances in allergen‐specific immune cell measurements for improved detection of allergic sensitization and immunotherapy responses. Allergy. 2021;76(11):3374‐3382. [DOI] [PubMed] [Google Scholar]
- 20. Whitrow MJ, Moore VM, Rumbold AR, Davies MJ. Effect of supplemental folic acid in pregnancy on childhood asthma: a prospective birth cohort study. Am J Epidemiol. 2009;170:1486‐1493. [DOI] [PubMed] [Google Scholar]
- 21. Hew M, Lee J, Varese N, et al. Epidemic thunderstorm asthma susceptibility from sensitization to ryegrass (Lolium perenne) pollen and major allergen lol p 5. Allergy. 2020;75(9):2369‐2372. [DOI] [PMC free article] [PubMed] [Google Scholar]
- 22. Smart IJ, Heddle RJ, Zola H, Bradley J. Development of monoclonal mouse antibodies specific for allergenic components in ryegrass (Lolium perenne) pollen. Int Arch Allergy Appl Immunol. 1983;72:243‐248. [DOI] [PubMed] [Google Scholar]
- 23. McKenzie CI, Varese N, Aui PM, et al. CytoBas: precision component‐resolved diagnostics for allergy using flow cytometric staining of basophils with recombinant allergen tetramers. Allergy. 2021;76(10):3028‐3040. [DOI] [PMC free article] [PubMed] [Google Scholar]
- 24. Chan SK, Pomes A, Hilger C, et al. Keeping allergen names clear and defined. Front Immunol. 2019;10:2600. [DOI] [PMC free article] [PubMed] [Google Scholar]
- 25. Pomes A, Davies JM, Gadermaier G, et al. WHO/IUIS allergen nomenclature: providing a common language. Mol Immunol. 2018;100:3‐13. [DOI] [PMC free article] [PubMed] [Google Scholar]
- 26. Grobe K, Pöppelmann M, Becker WM, Petersen A. Properties of group I allergens from grass pollen and their relation to cathepsin B, a member of the C1 family of cysteine proteinases. Eur J Biochem. 2002;269:2083‐2092. [DOI] [PubMed] [Google Scholar]
- 27. Seidl KJ, MacKenzie JD, Wang D, et al. Frequent occurrence of identical heavy and light chain Ig rearrangements. Int Immunol. 1997;9:689‐702. [DOI] [PubMed] [Google Scholar]
- 28. Tiller T, Busse CE, Wardemann H. Cloning and expression of murine Ig genes from single B cells. J Immunol Methods. 2009;350:183‐193. [DOI] [PubMed] [Google Scholar]
- 29. Berkowska MA, Heeringa JJ, Hajdarbegovic E, et al. Human IgE(+) B cells are derived from T cell‐dependent and T cell‐independent pathways. J Allergy Clin Immunol. 2014;134:688‐697. [DOI] [PubMed] [Google Scholar]
- 30. de Jong BG, IJ H, Marques L, et al. Human IgG2‐ and IgG4‐expressing memory B cells display enhanced molecular and phenotypic signs of maturity and accumulate with age. Immunol Cell Biol. 2017;95:744‐752. [DOI] [PMC free article] [PubMed] [Google Scholar]
- 31. Heeringa JJ, Karim AF, van Laar JAM, et al. Expansion of blood IgG(4)(+) B, T(H)2, and regulatory T cells in patients with IgG(4)‐related disease. J Allergy Clin Immunol. 2018;141:1831‐1843. [DOI] [PubMed] [Google Scholar]
- 32. Kalina T, Flores‐Montero J, van der Velden VHJ, et al. EuroFlow standardization of flow cytometer instrument settings and immunophenotyping protocols. Leukemia. 2012;26:1986‐2010. [DOI] [PMC free article] [PubMed] [Google Scholar]
- 33. Edwards ESJ, Bosco JJ, Aui PM, et al. Predominantly antibody‐deficient patients with non‐infectious complications have reduced naive B, Treg, Th17, and Tfh17 cells. Front Immunol. 2019;10:2593. [DOI] [PMC free article] [PubMed] [Google Scholar]
- 34. Dranitsaris G, Ellis AK. Sublingual or subcutaneous immunotherapy for seasonal allergic rhinitis: an indirect analysis of efficacy, safety and cost. J Eval Clin Pract. 2014;20:225‐238. [DOI] [PubMed] [Google Scholar]
- 35. Shamji MH, Durham SR. Mechanisms of allergen immunotherapy for inhaled allergens and predictive biomarkers. J Allergy Clin Immunol. 2017;140:1485‐1498. [DOI] [PubMed] [Google Scholar]
- 36. Haniuda K, Fukao S, Kodama T, Hasegawa H, Kitamura D. Autonomous membrane IgE signaling prevents IgE‐memory formation. Nat Immunol. 2016;17:1109‐1117. [DOI] [PubMed] [Google Scholar]
- 37. Schmitt MER, Lutz J, Haase P, et al. The B‐cell antigen receptor of IgE‐switched plasma cells regulates memory IgE responses. J Allergy Clin Immunol. 2020;146:642‐651. [DOI] [PubMed] [Google Scholar]
- 38. Yang Z, Robinson MJ, Chen X, et al. Regulation of B cell fate by chronic activity of the IgE B cell receptor. Elife. 2016;5:e21238. [DOI] [PMC free article] [PubMed] [Google Scholar]
- 39. Rigley KP, Thurstan SM, Callard RE. Independent regulation of interleukin 4 (IL‐4)‐induced expression of human B cell surface CD23 and IgM: functional evidence for two IL‐4 receptors. Int Immunol. 1991;3:197‐203. [DOI] [PubMed] [Google Scholar]
- 40. Sarfati M, Fournier S, Christoffersen M, Biron G. Expression of CD23 antigen and its regulation by IL‐4 in chronic lymphocytic leukemia. Leuk Res. 1990;14:47‐55. [DOI] [PubMed] [Google Scholar]
- 41. Chung JB, Sater RA, Fields ML, Erikson J, Monroe JG. CD23 defines two distinct subsets of immature B cells which differ in their responses to T cell help signals. Int Immunol. 2002;14:157‐166. [DOI] [PubMed] [Google Scholar]
- 42. Kamata T, Puzon W, Takada Y. Identification of putative ligand‐binding sites of the integrin alpha 4 beta 1 (VLA‐4, CD49d/CD29). Biochem J. 1995;305(Pt 3):945‐951. [DOI] [PMC free article] [PubMed] [Google Scholar]
- 43. McNulty CA, Symon FA, Wardlaw AJ. Characterization of the integrin and activation steps mediating human eosinophil and neutrophil adhesion to chronically inflamed airway endothelium. Am J Respir Cell Mol Biol. 1999;20:1251‐1259. [DOI] [PubMed] [Google Scholar]
- 44. Petecchia L, Serpero L, Silvestri M, Sabatini F, Scarso L, Rossi GA. The histamine‐induced enhanced expression of vascular cell adhesion molecule‐1 by nasal polyp‐derived fibroblasts is inhibited by levocetirizine. Am J Rhinol. 2006;20:445‐449. [DOI] [PubMed] [Google Scholar]
- 45. Eweiss A, Dogheim Y, Hassab M, Tayel H, Hammad Z. VCAM‐1 and eosinophilia in diffuse sino‐nasal polyps. Eur Arch Otorhinolaryngol. 2009;266:377‐383. [DOI] [PubMed] [Google Scholar]
- 46. Ying S, Humbert M, Meng Q, et al. Local expression of ϵ germline gene transcripts and RNA for the ϵ heavy chain of IgE in the bronchial mucosa in atopic and nonatopic asthma. J Allergy Clin Immunol. 2001;107:686‐692. [DOI] [PubMed] [Google Scholar]
- 47. Glass DR, Tsai AG, Oliveria JP, et al. An integrated multi‐omic single‐cell atlas of human B cell identity. Immunity. 2020;53:217‐232. [DOI] [PMC free article] [PubMed] [Google Scholar]
- 48. Majumdar S, Bhattacharjee S, Jana T, Saha S. DAAB‐V2: updated database of allergy and asthma biomarkers. Allergy. 2021;76(12):3829‐3832. [DOI] [PubMed] [Google Scholar]
- 49. Noh S, Jin S, Park CO, et al. Elevated Galectin‐10 expression of IL‐22‐producing T cells in patients with atopic dermatitis. J Invest Dermatol. 2016;136:328‐331. [DOI] [PubMed] [Google Scholar]
- 50. Vargas JE, Porto BN, Puga R, Stein RT, Pitrez PM. Identifying a biomarker network for corticosteroid resistance in asthma from bronchoalveolar lavage samples. Mol Biol Rep. 2016;43:697‐710. [DOI] [PubMed] [Google Scholar]
Associated Data
This section collects any data citations, data availability statements, or supplementary materials included in this article.
Supplementary Materials
Figure S1
Figure S2
Figure S3
Figure S4
Figure S5
Appendix S1
Appendix S2