Abstract
Purpose
Quantitative susceptibility mapping (QSM) is used increasingly for clinical research where oblique image acquisition is commonplace, but its effects on QSM accuracy are not well understood.
Theory and Methods
The QSM processing pipeline involves defining the unit magnetic dipole kernel, which requires knowledge of the direction of the main magnetic field with respect to the acquired image volume axes. The direction of is dependent on the axis and angle of rotation in oblique acquisition. Using both a numerical brain phantom and in vivo acquisitions in 5 healthy volunteers, we analyzed the effects of oblique acquisition on magnetic susceptibility maps. We compared three tilt‐correction schemes at each step in the QSM pipeline: phase unwrapping, background field removal and susceptibility calculation, using the RMS error and QSM‐tuned structural similarity index.
Results
Rotation of wrapped phase images gave severe artifacts. Background field removal with projection onto dipole fields gave the most accurate susceptibilities when the field map was first rotated into alignment with . Laplacian boundary value and variable‐kernel sophisticated harmonic artifact reduction for phase data background field removal methods gave accurate results without tilt correction. For susceptibility calculation, thresholded k‐space division, iterative Tikhonov regularization, and weighted linear total variation regularization, all performed most accurately when local field maps were rotated into alignment with before susceptibility calculation.
Conclusion
For accurate QSM, oblique acquisition must be taken into account. Rotation of images into alignment with should be carried out after phase unwrapping and before background‐field removal. We provide open‐source tilt‐correction code to incorporate easily into existing pipelines: https://github.com/o‐snow/QSM_TiltCorrection.git.
Keywords: electromagnetic tissue properties, oblique acquisition, QSM, QSM accuracy, quantitative susceptibility mapping, tilted slices
Short abstract
Click here for author‐reader discussions
Abbreviations
- FANSI
Fast nonlinear susceptibility inversion
- FLIRT
FMRIB's Linear Image Registration Tool
- FSL
FMRIB Software Library
- LBV
Laplacian boundary value
- MEDI
Morphology Enabled Dipole Inversion
projection onto dipole fields
- PE
phase encoding
- PRELUDE
Phase Region Expanding Labeler for Unwrapping Discrete Estimates
- QSM
Quantitative Susceptibility Mapping
- RMSE
root mean square error
- ROI
region of interest
- ROMEO
Rapid Opensource Minimum spanning treE algOrithm
- SEGUE
Speedy rEgion‐Growing algorithm for Unwrapping Estimated phase
- TKD
thresholded k‐space division
- TV
total variation
- V‐SHARP
variable‐kernel sophisticated harmonic artifact reduction for phase data
- XSIM
QSM‐tuned structural similarity index metric
1. INTRODUCTION
The acquisition of oblique image slices, or an oblique slab or volume in 3D MRI, is common in clinical practice to facilitate radiological viewing of brain MRI. For example, axial slices are often aligned along the subcallosal line for longitudinal studies that require consistent repositioning of acquired images. 1 Alternatively, slices may be aligned perpendicular to the principal axis of the hippocampus for accurate hippocampal volume measurements and sharper hippocampal boundary delineation. 2 Oblique slices are also acquired to reduce image artifacts from, for example, eye motion, resulting in localized blurring around the eyes and ghosting along the phase‐encode direction. 3 Note that acquiring oblique slices does not require the subject to rotate their head, as only the acquisition volume is tilted.
Quantitative susceptibility mapping (QSM) 4 , 5 , 6 , 7 uses the information in the (conventionally discarded) phase component, , of the complex MRI signal from a gradient‐echo sequence to calculate the tissue magnetic susceptibility, . A typical QSM pipeline includes three key steps: (1) phase unwrapping of wraps present due to being constrained to the interval; (2) background field removal separating the local field perturbations due to internal sources inside the volume of interest (eg, the brain), , from unwanted background field perturbations due to external sources, ; and (3) a local field–to‐ calculation to solve an ill‐posed inverse problem:
| (1) |
| (2) |
where is the Fourier transform; is its inverse; is the magnetic field strength in Tesla; and is the ‐component of the magnetic dipole in k‐space (see Equation 5).
Calculation of requires knowledge of the “ z ” direction of the main magnetic field, , with respect to the image volume acquired. Therefore, oblique acquisition must be taken into account within the QSM pipeline; otherwise, incorrect estimates arise, as suggested by a preliminary study 8 and our preliminary data. 9 With the increase in clinical applications of QSM, 10 , 11 accuracy in estimates for oblique acquisition, typical in clinical protocols, is of paramount importance in ensuring smooth translation of QSM into clinical practice. However, accurate QSM accounting for oblique acquisition is nontrivial, and there are a number of techniques proposed to account for oblique acquisition in QSM, 12 , 13 , 14 , 15 including the most common methods of rotating the k‐space dipole or the image volume into alignment with . The effect of these proposed tilt‐correction techniques on susceptibility values has not been evaluated, and it is not known at which point in the QSM pipeline these techniques should be applied. Furthermore, it is not clear what is the optimal method for taking oblique acquisition into account in the QSM pipeline: Simply defining the dipole at an angle (see DipK or DipIm subsequently) has been shown to be nonoptimal. 8 Therefore, the research presented here is the first quantitative and comparative evaluation of correction methods for oblique acquisition in QSM. We used a numerical phantom to carry out a comprehensive analysis of the effect of oblique acquisition on each step of the QSM pipeline, and propose three tilt correction schemes, analyzing their effects on susceptibility values when applied at different points in the QSM pipeline. We also acquired several images, in 5 healthy volunteers, with volumes tilted at different angles and performed the same analysis of the effects of tilting and correction schemes in vivo. We provide open‐source tilt‐correction code at https://github.com/o‐snow/QSM_TiltCorrection.git, which uses the header information from NIfTI 16 format images to correctly orient image volumes and account for tilted acquisition for accurate QSM.
2. THEORY
To accurately model the magnetic dipole kernel required for the field‐to‐ calculation and, in some cases, for background field removal, it is necessary to know where the magnetic field lies in the acquired MR images. Defining the two coordinate systems of interest 8 as the acquired image frame and the scanner frame , the main magnetic field can be written as and in the image and scanner frames, respectively, as follows:
| (3) |
| (4) |
In the case of nonoblique acquisition, the coordinate systems are aligned and in the image frame (Figure 1, left).
FIGURE 1.
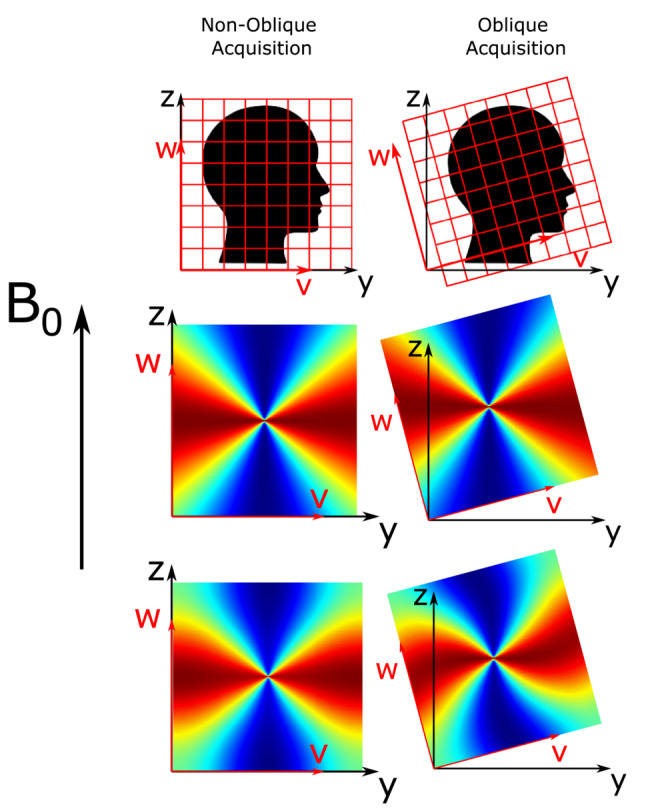
Nonoblique and oblique acquisition about the ‐axis (‐axis) of axial slices (top row) with corresponding k‐space dipoles (middle row) and image‐space dipoles (bottom row). The image axes and scanner axes are shown in red and black, respectively. Note that the rotation axis is at the center of the image
For the local field, , to calculation (Equation 2), the magnetic dipole kernel must be calculated. Throughout this paper, references will be made to the dimensionless k‐space dipole, (Figure 1, middle row), and the dimensionless “image‐space dipole” defined in image space and Fourier‐transformed into k‐space, (Figure 1, bottom row), kernels defined as follows 17 , 18 :
| (5) |
| (6) |
where is the unit vector of ; is the unit vector of ; is the voxel volume; is the angle between and , the unit vector of in image space, where ; and is the Fourier transform. The periodicity of the discrete Fourier transform constrains the boundaries of k‐space, resulting in the dipole pattern becoming fixed along those boundaries. This causes a rotated image‐space dipole to appear twisted, sheared, or distorted (Figure 1, bottom row). It is possible to obtain the direction of relative to the (tilted) image axes from the image headers (eg, DICOM or Nifti format), and therefore to correctly calculate the magnetic dipole kernel using either Equation 5 or 6.
3. METHODS
To determine the optimal method for taking oblique acquisition into account in the QSM pipeline, we investigated three proposed tilt‐correction schemes, and, for comparison, an uncorrected analysis pipeline (Figure 2):
RotPrior: Rotation of the oblique image into alignment with the scanner frame before phase unwrapping, background field removal, or the susceptibility calculation method. In this method, the dipole is defined in k‐space in the scanner frame (using Equation 5);
DipK: The image is left unaligned to the scanner frame, and the dipole used is defined in k‐space in the oblique image frame (using Equation 5). This is the default tilt‐correction method implemented in popular QSM toolboxes. 15 , 19 , 20 However, this method often requires the user to input the corrected direction, which is optional in many of these toolboxes;
DipIm: The image is left unaligned to the scanner frame, and the dipole used is defined in image space in the oblique image frame (using Equation 6); and
NoRot: The oblique image is left unaligned to the scanner frame, and the k‐space dipole is mistakenly defined in the scanner frame (by wrongly assuming in Equation 5) and is thereby misaligned to the true magnetic field direction, . This is the uncorrected method, which can easily result from users failing to input (the correct) direction.
These schemes are the general names of the methods that we applied at different points in the pipeline (ie, before phase unwrapping, background field removal, or susceptibility calculation) and for different methods or algorithms. For example, as no dipole kernel is necessary for phase unwrapping (and we substitute the dipole operations illustrated in Figure 2 with orientation–independent unwrapping operations), we have called the only two schemes appropriate before unwrapping RotPrior and NoRot, where the image volume is rotated before unwrapping and after, respectively.
FIGURE 2.
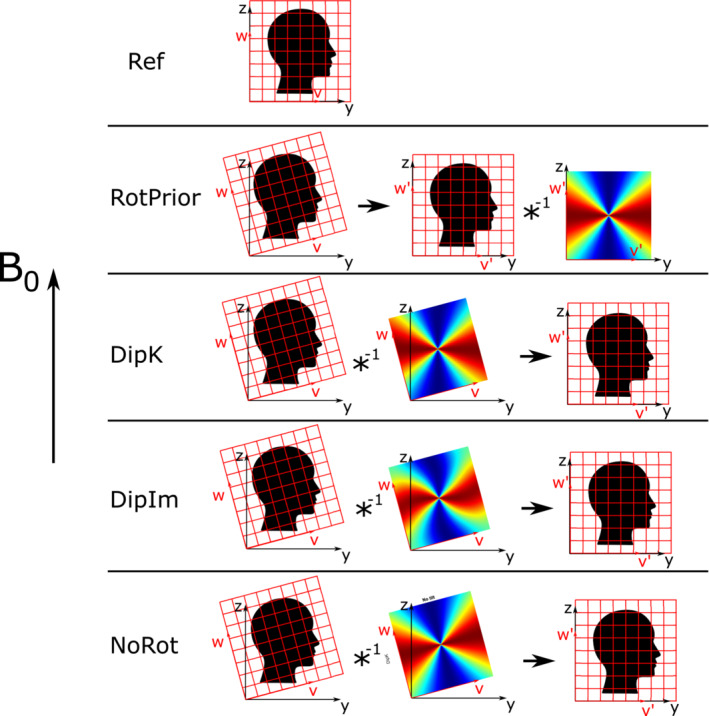
All tilt‐correction schemes including the reference, nonoblique acquisition for rotations about the x‐axis. The native (oblique) image space was transformed to aligned with the scanner frame. The black arrow denotes rotation into the scanner frame of reference. DipK, DipIm, and NoRot were rotated back into the reference (scanner) frame after correction to facilitate comparisons. RotPrior and NoRot still apply when no dipole is used
All rotations were carried out about the ‐axis (‐axis) to simulate single oblique acquisition, the ‐axis (‐axis) for confirmation, and about the ‐axis (‐ axis) to simulate double oblique acquisition. Rotations were undertaken using FSL FLIRT 21 with trilinear interpolation. To facilitate comparisons, all images left in the image frame after correction (DipK, DipIm, and NoRot) were rotated back into alignment with the scanner axes (see black arrow in Figure 2). Unless stated otherwise, all processing and analysis operations were carried out using MATLAB (MathWorks, Natick, MA, USA).
3.1. Numerical phantom investigations
Multi‐echo ( ms) magnitude and phase images, from a numerical phantom, 22 with (originally) no phase wraps or background fields present, were used to independently investigate the effect of the three tilt‐correction methods (described previously), and no correction, on each step in the QSM pipeline.
We carried out these investigations with two image volumes: one unpadded with the original matrix size 164 × 205 × 205, and a second volume padded to 357 × 357 × 357. The padded matrix size was chosen as the long diagonal of the initial volume (padded to a cube: 205 × 205 × 205) and rounded up to the nearest odd integer. This was to ensure that none of the original frequency coefficients of the unit dipole field were cut off due to rotations about any of the three axes. An odd matrix size meant that there was a true center of rotation correctly located within a single central voxel.
3.1.1. Numerical phantom: susceptibility calculation
Local field maps, , were calculated from a non‐linear fit 23 over all echo times (for the most accurate field estimates 24 ) of the complex data set created by combining the magnitude and background field‐free phase images. These local field maps, obtained from the supplied raw numerical phantom data, were free of any (synthetic) background fields or phase wraps, and therefore allowed investigation of the effect of oblique acquisition on calculation alone. To simulate oblique acquisition, local field maps were rotated between ±45° in 5° increments. All tilt correction methods described (and no correction) were compared for three calculation methods chosen to cover the two main approaches: direct non‐iterative solutions (in k‐space) and iterative solutions (in image‐space).
The first method tested was direct, thresholded k‐space division (TKD) 25 , 26 (from open‐source software) where a modified dipole kernel was generated in k‐space with values below a threshold, , replaced by the signed threshold value:
| (7) |
The dipole was originally defined according to DipK and DipIm and then always thresholded in k‐space. Susceptibility underestimation was corrected by multiplication with a correction factor, , calculated according to. 27
The second and third calculation methods aim to iteratively solve for through the minimisation of
| (8) |
where is a binary mask, is a weighting term and is the data regularization term that reflects some prior information about . Iterative Tikhonov regularization 26 , 28 (open‐source) was chosen as it has performed well in a variety of QSM applications including outside the brain. 29 , 30 , 31 It was applied with , a regularization parameter α = 0.003 (chosen through an L‐Curve analysis 32 ), and W reflecting the spatially varying noise, and was also corrected for underestimation. 27 Weighted linear total variation regularization (from the FANSI toolbox 19 , 33 ) with , (chosen through an L‐Curve analysis) and W the magnitude of the complex data 33 was also tested. This method was chosen as total variation based iterative approaches were shown to produce the most accurate susceptibility maps in the 2019 QSM challenge 2.0. 34
Mean values were calculated in five deep gray matter regions of interest (ROIs): the caudate nucleus, globus pallidus, putamen, thalamus and red nucleus. All susceptibility maps were compared using the root mean square error (RMSE) and QSM‐tuned structural similarity index (XSIM) 35 metrics relative to the ground‐truth susceptibility map at 0°.
3.1.2. Numerical phantom: background field removal
For the background field removal step, local field maps from the numerical phantom required the addition of synthetic background fields, which were then removed following the three different tilt‐correction methods (and no correction). After background field removal, the susceptibility maps were calculated from the resulting field maps using the calculation method found to be optimal in the assessment described previously.
To investigate the effect of tilt‐correction schemes on the background field removal step, synthetic background fields, (Figure 3, bottom left), were added to the local field maps used in section 3.1.1. The background fields were calculated using the forward model, which is through a convolution, formulated as a multiplication in Fourier space, between the unit magnetic dipole field and a head‐shaped susceptibility map 17 , 18 as follows:
| (9) |
FIGURE 3.
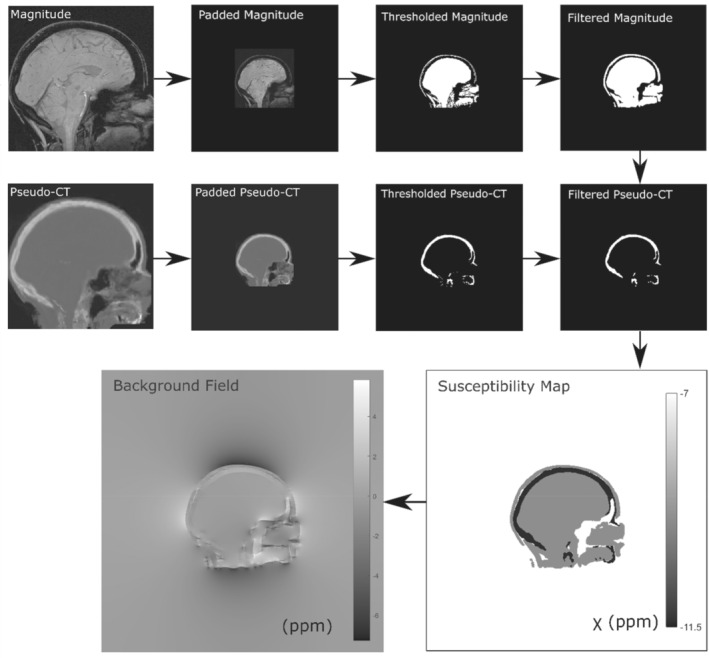
Method for calculating the synthetic background field from a head‐shaped susceptibility map obtained by thresholding the numerical phantom magnitude image and a pseudo‐CT image to delineate soft tissue and bone, respectively. The thresholded magnitude and pseudo‐CT images were filtered for smoothness using a 3 × 3 × 3 box filter
where is the head‐shaped susceptibility map, with soft tissue (−9.4 ppm) and bone (−11.4 ppm) 8 , 36 regions obtained by thresholding the magnitude (sum of squares over all echoes) and a pseudo‐CT 37 , 38 , 39 image, respectively (Figure 3). The magnitude and pseudo‐CT images were padded from their original matrix size of 164 × 205 × 205 to 512 × 512 × 512 to ensure that the edge effects from the periodic Fourier transform were minimized around the volume of interest. These synthetic background fields were then cropped back to their original matrix size and added to the local field maps obtained previously simulating a total field map, . To simulate oblique acquisition, total field maps were rotated between ±45° in 5° increments. To remove the synthetic background fields, , from the tilted total field maps, three different state‐of‐the‐art background field removal methods 40 were used, based on their widespread use, robustness, and accuracy. 40 , 41 Projection onto dipole fields (PDF) 42 from the MEDI Toolbox 15 was used following tilt correction with all three correction schemes and no correction, because PDF is orientation‐dependent (ie, it uses the dipole field (Equation 5)). Laplacian boundary value (LBV) 43 from the MEDI Toolbox, 15 and variable‐kernel sophisticated harmonic artifact reduction for phase data (V‐SHARP) 44 from STI Suite, 20 were tested with RotPrior and NoRot only, as LBV and V‐SHARP are orientation‐independent methods (ie, they do not use the dipole field). Following rotation back into the reference frame (equivalent to RotPrior for the susceptibility calculation step), susceptibility maps were calculated from all local field maps using the iterative Tikhonov regularization (regularization parameter ), as this was found to be optimal. Susceptibility maps were compared using RMSE and XSIM 35 relative to the ground‐truth susceptibility map at 0°.
3.1.3. Numerical phantom: phase unwrapping
To investigate the effect of tilt correction on phase unwrapping, the synthetic background fields added in section 3.1.2 induced phase wraps when the phase was constrained to the interval, which were then unwrapped. Susceptibility maps were then calculated from these unwrapped field maps using background field removal and susceptibility calculation algorithms found to be optimal in the experiments described in sections 3.1.1 and 3.1.2.
To investigate the effect of tilt correction on phase unwrapping, phase wraps were introduced into the wrap‐free numerical phantom images through the additional synthetic background field described previously. From each total field map at each angle, , multi‐echo unwrapped phase images were simulated by scaling the tilted total field maps at each TE according to . At every tilt angle, a complex data set () was made from the multi‐echo magnitude images () and simulated phase images () using which constrained the phase to the range , resulting in phase wraps. A wrapped total field map was calculated via a nonlinear fit over all TEs, 23 which then underwent phase unwrapping using the commonly used Laplacian, 15 , 45 SEGUE 46 (https://xip.uclb.com/product/SEGUE), and ROMEO 47 (https://github.com/korbinian90/ROMEO) techniques with the NoRot and RotPrior tilt‐correction methods. After rotating all of the unwrapped images back into the reference frame (equivalent to RotPrior for the background field removal step and susceptibility calculation step), susceptibility maps were then calculated with PDF 42 background field removal and susceptibility calculation using iterative Tikhonov regularization (regularization parameter ), as we found these to provide optimal results.
3.2. Investigations in vivo
3.2.1. In vivo: MRI acquisition
All acquisitions were performed having obtained informed consent, and with approval by the local ethics committee.
The 3D gradient‐echo brain images of 5 healthy volunteers were acquired on a 3T Siemens Prisma‐Fit MR system (National Hospital for Neurology and Neurosurgery, London, United Kingdom) using a 64‐channel head coil across a range of image volume orientations. Note that the volunteers did not tilt their head but remained in the same position throughout the experiment. The image volume was tilted about the ‐axis, as this is the most common in clinical practice, from −45 to +45° in 10° increments, with the reference image at 0° representing a nonoblique acquisition (subject 5 angles were between ±15°) . Each image volume was acquired in 3 min 23 s with TR = 30 ms, TEs = 4.92, 9.84, 14.76, 19.68, and 24.60 ms, 1.23 mm isotropic voxels, FOV = 256 × 192 × 216.6 mm, matrix size = 208 × 156 × 176, bandwidth = 280 Hz/pixel, flip angle = 15°, 6/8 partial Fourier along PE1 and PE2, on the scanner ASPIRE coil combination, 48 monopolar readout, and GRAPPAPE1 acceleration = 3 (frequency‐encode direction, anterior–posterior; phase‐encode 1 direction, right–left; phase‐encode 2 direction, feet–head).
3.2.2. In vivo: phase unwrapping
For all angles/volumes, a total field map and a noise map were obtained using a nonlinear fit of the complex data 23 from the MEDI toolbox. 15 A brain mask was created using the brain extraction tool 49 with default settings applied to the final echo magnitude image of the reference 0° volume for a conservative brain mask estimate. This brain mask was then registered to all oblique‐acquired volumes to maintain consistency. As with the numerical phantom, both the RotPrior and NoRot correction schemes were applied. Residual phase wraps were then removed using Laplacian unwrapping, 45 SEGUE, 46 and ROMEO. 47 To investigate the effect of the correction schemes on this step in the pipeline, unwrapped total field maps were rotated back into the reference frame (equivalent to RotPrior for the background field removal step and susceptibility calculation step), and susceptibility maps were created using PDF background field removal and susceptibility calculation with iterative Tikhonov regularization ( chosen through an L‐curve analysis).
As in the numerical phantom, and also due to very slight unavoidable changes in subject position between scans, the unwrapped field maps and susceptibility maps were registered into the reference image space to facilitate comparisons of results in vivo. To carry out this registration, the magnitude image (added in quadrature over all echoes) for each angle was rigidly registered to the 0° magnitude using NiftyReg, 50 resulting in a transformation matrix per angle/volume, which was applied to bring all angles/volumes into the same common reference space.
3.2.3. In vivo: background field removal
The ROMEO unwrapped field maps described in section 3.2.2 for volumes at all angles, and before any registrations or rotations, were used to investigate the effect of oblique acquisition on background field removal. The ROMEO technique was chosen because it has been shown to outperform 47 PRELUDE 51 and BEST‐PATH. 52 As for the numerical phantom, for each field map, at each angle, background fields were removed using PDF 42 with all tilt‐correction schemes and no correction, and using LBV 43 and V‐SHARP 44 with only RotPrior and NoRot. For all three background field removal methods, the brain mask was eroded by four outer voxels. 53 RotPrior was performed twice: with mask erosion either before or after the rotation, to compare the effects of interpolation, particularly along the boundaries of the field map on PDF and V‐SHARP, as it is known that boundary effects arise in these background field removal methods. 40
For comparison purposes, after rotation and registration of the local field maps back into the reference frame (equivalent to RotPrior for the susceptibility calculation step), susceptibility maps were calculated from the local field maps using iterative Tikhonov regularization (, chosen with an L‐Curve). Local field maps and susceptibility maps were compared with RMSE and XSIM metrics (XSIM only for the susceptibility maps) averaged across all subjects relative to the 0° reference image.
3.2.4. In vivo: susceptibility calculation
To investigate the effect of oblique acquisition on the calculation step in the pipeline, we used the local field maps following ROMEO unwrapping and LBV background field removal (described in section 3.2.3), before any registrations or rotations. The LBV method was chosen because it is orientation‐independent, thereby allowing our analysis to focus on the effect of oblique acquisition and the different correction schemes on the calculation step alone. The three tilt correction schemes (and no correction) were compared using the same three calculation methods as for the numerical phantom: TKD, iterative Tikhonov regularization with a regularization parameter from an L‐curve analysis, and weighted linear TV with a regularization parameter found also from an L‐curve.
The resulting susceptibility maps were transformed into the reference space as described in section 3.2.2. The same regions of interest (ROIs) as in the numerical phantom were investigated and obtained by registering the EVE 54 magnitude image with the reference magnitude image (at the first TE) and applying the resulting transformation to the EVE ROIs. Mean values were calculated in these ROIs for all tilt angles and all correction schemes. The RMSE and XSIM measures averaged across all subjects were also used to compare the susceptibility maps.
4. RESULTS
4.1. Numerical phantom
All numerical phantom results shown here are for rotations of image volumes about the x‐axis with unpadded matrices. Note that acquisitions tilted about the y‐axis and y = x‐axis, as well as images with padded matrices, all gave similar results (see Supporting Information Figures S1–S3). We chose to display these results as the padded matrix size leads to increased computation time, which is not recommended in a practical setting, and the x‐axis is the most common axis of rotation for oblique acquisition.
When wrapped phase images are rotated before phase unwrapping with the correction scheme RotPrior, artifacts arise for Laplacian, SEGUE, and ROMEO unwrapping (Figure 4). The SEGUE and ROMEO techniques appear to fail with RotPrior, with SEGUE removing a portion of the brain mask and ROMEO leaving residual phase wraps (Figure 4C).
FIGURE 4.
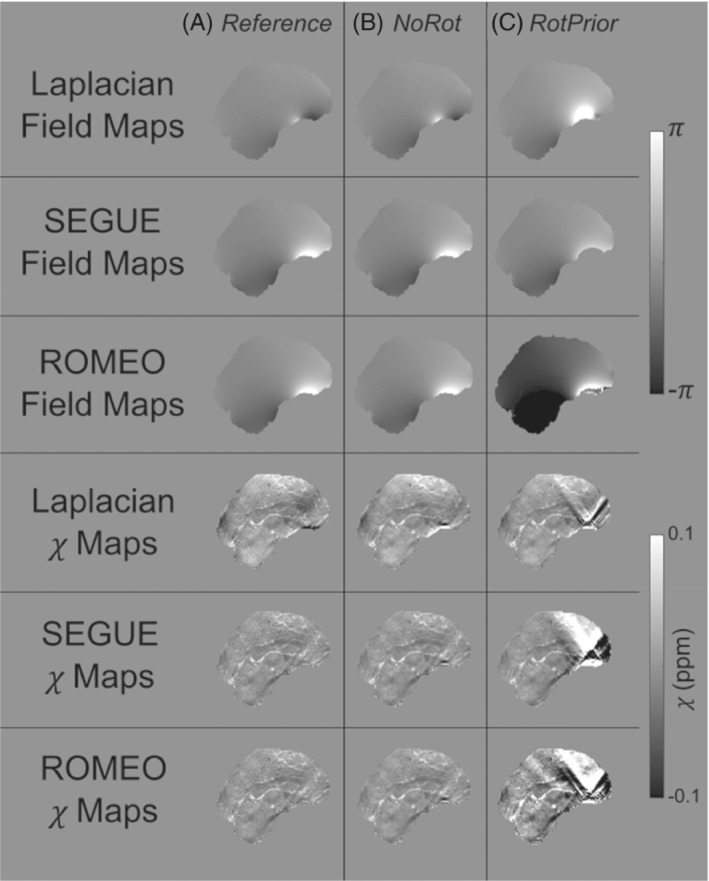
Effect of tilt correction before phase unwrapping in the numerical phantom. Phase‐unwrapped field maps and the resulting susceptibility maps at 15° for the NoRot (column b) and RotPrior (column c) tilt‐correction methods relative to the reference (column a). Rotation of the wrapped field maps before phase unwrapping with Laplacian, SEGUE, and ROMEO techniques results in errors along phase wraps and incorrect unwrapping, leading to prominent artifacts in the final susceptibility maps
When using PDF for background field removal, RotPrior is the most accurate method, and the largest errors arise from DipIm and NoRot (Figure 5). Striping artifacts are present in the local field map from the DipK method (Figure 5C). The LBV and V‐SHARP are shown to be largely unaffected by oblique acquisition.
FIGURE 5.
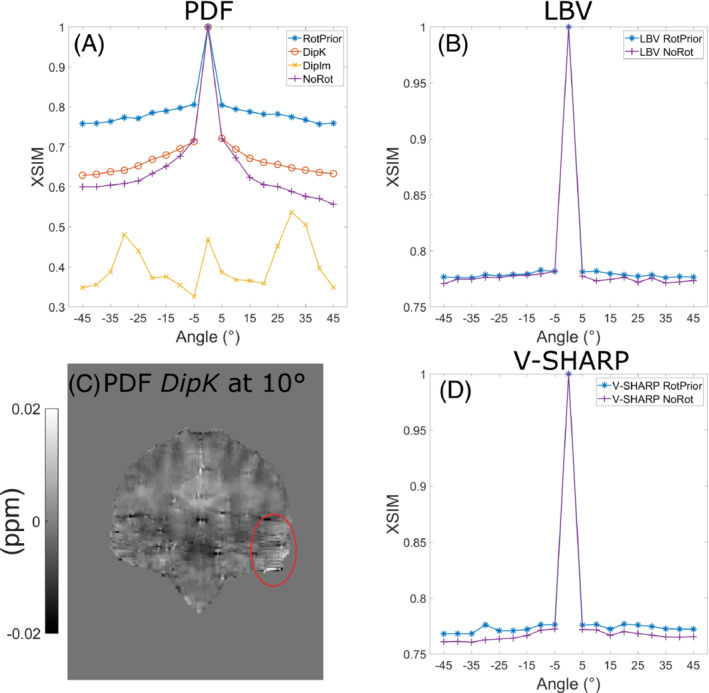
Effect of different tilt‐correction schemes on QSM with three background field removal methods in a numerical phantom. Susceptibility maps for QSM‐tuned structural similarity index (XSIM) comparisons were calculated with iterative Tikhonov regularization. For projection onto dipole fields (PDF) (A), the XSIM metric shows that RotPrior gives the most accurate susceptibilities, with DipIm performing the worst. When using PDF with DipK, striping artifacts (C, red ellipse) arise in the local field maps for tilted acquisitions. Laplacian boundary value (LBV) and variable‐kernel sophisticated harmonic artifact reduction for phase data (V‐SHARP) (C,D) are shown to be largely unaffected by oblique acquisition with differences arising primarily from rotation interpolations
Figure 6 summarizes the mean susceptibility in the caudate nucleus and thalamus, alongside XSIM measurements across all angles for all three calculation methods (RMSE results are similar and are shown in Supporting Information Figure S4). The TKD and iterative Tikhonov methods are most accurate with RotPrior, and least accurate when the dipole is misaligned to the main magnetic field (NoRot). Weighted linear TV is relatively robust to oblique acquisition with RotPrior and DipK performing similarly. However, DipK shows more variability in at the ROI level than RotPrior. Weighted linear TV with DipIm fails at nonzero angles, and NoRot results in the largest errors. Example susceptibility maps are shown in Figure 7, highlighting the widespread errors that arise when the magnetic dipole is defined incorrectly (NoRot).
FIGURE 6.
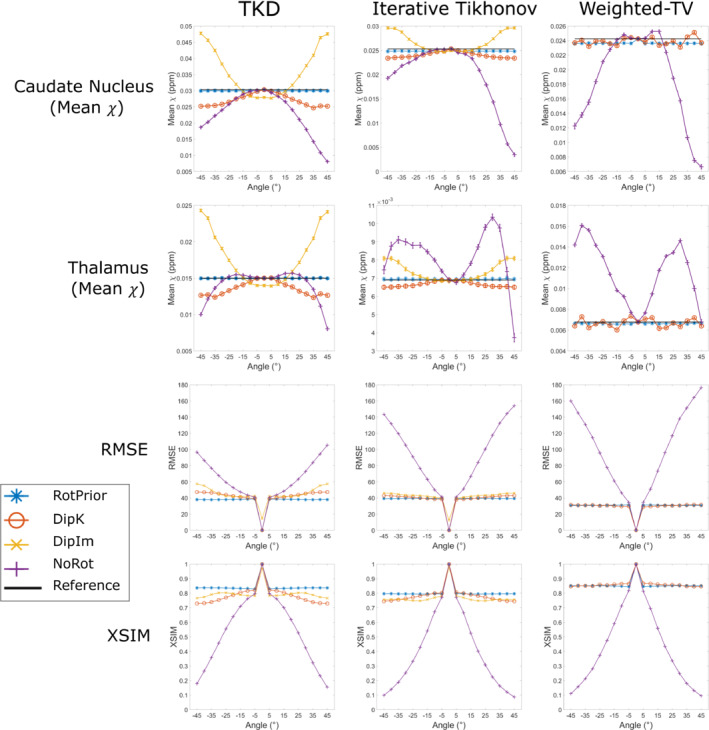
Mean susceptibilities in the caudate and thalamus (top rows), and XSIM (bottom row) across all tilt angles for all tilt‐correction schemes, plus all three calculation methods in the numerical phantom. The RMS error (RMSE) measurements shown in Supporting Information Figure S4 agree with the XSIM findings. NoRot performs worst across all angles. RotPrior is the most accurate tilt‐correction scheme. For weighted linear total variation (TV), DipK and RotPrior have similar XSIM values but the mean thalamus varies more over angles with DipK. Note that DipIm is not shown for weighted linear TV, as this method fails
FIGURE 7.
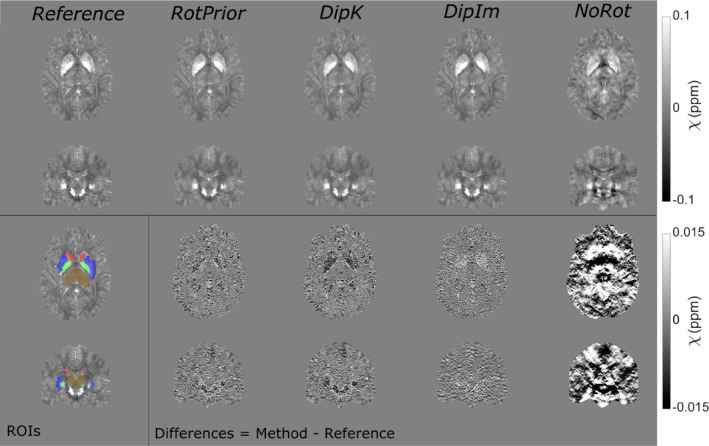
χ maps and difference images illustrating the effects of all tilt correction schemes in the numerical phantom. An axial and a coronal slice are shown for a volume tilted at 25° and a reference 0° volume with all χ maps calculated using the iterative Tikhonov method. The ROIs analysed are also shown (bottom left). RotPrior performs the best while NoRot results in substantial χ errors across the whole brain. The results from TKD and weighted linear TV (not shown) are very similar
4.2. In vivo
In vivo, Laplacian, SEGUE, and ROMEO phase unwrapping with RotPrior have the same image artifacts as in the numerical phantom (not shown here) compared with NoRot, with incorrect identification of phase wraps when wrapped field maps are rotated before phase unwrapping.
Figure 8 shows that PDF background field removal is most accurate with RotPrior and least accurate with DipIm followed by NoRot, confirming the results obtained in the numerical phantom (Figure 5). The average XSIM differences between tilt‐correction schemes in vivo (Figures 8 and 9) are smaller than in the numerical phantom (Figures 5 and 6), most likely due to issues inherent to in vivo acquisition, including motion and greater noise. Striping artifacts are present in the DipK method for PDF in the local field maps before re‐orientation for comparison purposes (Figure 8C). Rotation interpolation obscures these artifacts in the in vivo images. The LBV and V‐SHARP methods are shown to be largely orientation‐independent in the in vivo case, as expected.
FIGURE 8.
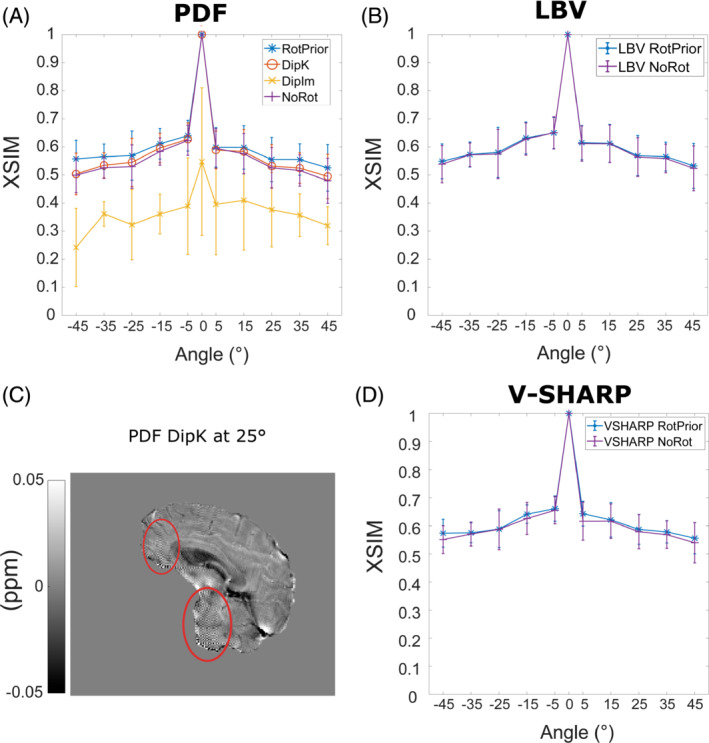
Effect of different tilt‐correction schemes on background field removal in vivo. The average XSIM measurements across all subjects were used to compare the maps calculated with iterative Tikhonov regularization after background field removal to the nonoblique (0°) reference map. The PDF method (A) has the highest XSIM with RotPrior and the lowest XSIM with DipIm, followed by NoRot, confirming the results in the numerical phantom (Figure 5). Striping artifacts are found in local field maps when using DipK and PDF (C, red ellipses) but are obscured after rotation and registration back into the reference 0° space due to interpolation. The LBV (B) and V‐SHARP (D) methods are shown to be unaffected by oblique acquisition in vivo as well as in the numerical phantom (Figure 5B and 5D). Error bars represent the SD of the mean XSIM across subjects
FIGURE 9.
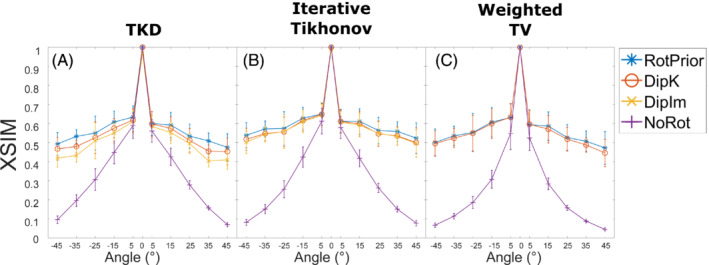
Average XSIM plots over all angles for all tilt‐correction schemes and all three calculation methods across all subjects in vivo. The RMSE measurements in Supporting Information Figure S4 agree with these XSIM findings. These results are similar to those in the numerical phantom (Figure 3), with RotPrior consistently reporting higher XSIM measures than other methods and NoRot performing worst across all methods. At nonzero tilt angles, XSIM has a respectively high/low baseline level arising from rotation and registration interpolations. DipIm fails for weighted linear TV, and therefore is omitted from the plots in the last column. Error bars represent the SD of the mean XSIM across subjects
When RotPrior was performed with mask erosion before rotating the total field map, artifacts arose along the boundaries of the PDF local field map (Supporting Information Figure S5). The PDF method performs more robustly if mask erosion is carried out after rotation, whereas V‐SHARP appears to perform equally well in both scenarios.
Figure 9 shows the effect of all tilt‐correction schemes on susceptibility calculation in vivo and confirms that NoRot results in the largest susceptibility errors and that RotPrior is consistently the most robust tilt‐correction method compared with other methods. Both RotPrior and DipK perform better than DipIm, in agreement with results in the numerical phantom (Figure 6). Difference images (Figure 10) also confirm those obtained in the numerical phantom (Figure 7). Subtle effects found in several of the numerical phantom ROIs (Figure 6) were not apparent in vivo.
FIGURE 10.
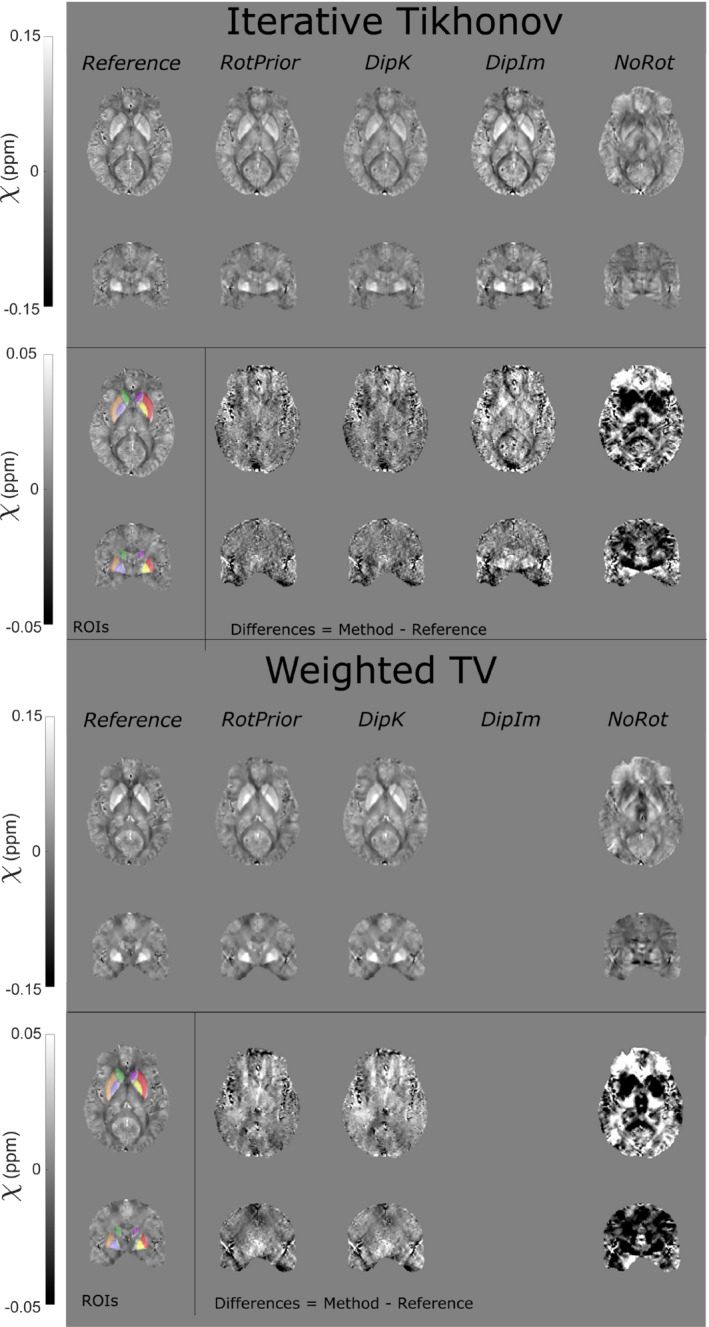
The χ maps and difference images illustrating the effects of all tilt‐correction schemes on susceptibility calculation in vivo. An axial and a coronal slice are shown for a volume tilted at 45° and a reference (0°) volume with all χ maps calculated using the iterative Tikhonov method (top) and weighted linear TV (bottom). Weighted linear TV with DipIm fails at nonzero angles and is therefore omitted from the figure. NoRot leads to the largest differences and image artifacts throughout the brain for iterative Tikhonov and weighted linear TV methods. The EVE ROIs used are shown (bottom left). Results from TKD (Supporting Information Figure S6) are very similar
5. DISCUSSION
We have shown that oblique acquisition must be accounted for in the QSM pipeline to ensure accurate susceptibility estimates throughout the brain. For all background field removal and susceptibility calculation methods tested, if the magnetic dipole kernel is left misaligned to the direction (NoRot), which can arise from user error in popular QSM toolboxes, then significant susceptibility errors result.
Through the analysis of the effect of tilted acquisition on a numerical phantom and 5 healthy volunteers in vivo, we have shown that any rotations that are applied to a wrapped field map before phase unwrapping will result in incorrect unwrapping, using Laplacian, SEGUE and ROMEO unwrapping techniques, and subsequent artifacts in the resulting QSMs. Results indicate that, for PDF background field removal, rotating the image into the scanner frame and using a k‐space dipole defined in the scanner frame (RotPrior correction method) provides the most accurate susceptibility maps. If no image rotations are desired, due to unwanted interpolation effects, LBV or V‐SHARP are recommended, as they are largely unaffected by oblique acquisition. Both TKD and iterative Tikhonov susceptibility calculation methods provide the most accurate results when local field maps are rotated into alignment with the scanner axes and a k‐space dipole, defined in the scanner frame, is used (RotPrior). The same conclusion holds for weighted linear TV, but susceptibility calculation can be carried out in the oblique image frame without any rotations, provided the correct direction is used in defining the k‐space dipole (DipK correction method). We therefore recommend rotating the total field map into alignment with the scanner frame after phase unwrapping but before background field removal.
Both the numerical phantom and in vivo results indicate that when wrapped phase images are rotated before phase unwrapping (with the correction scheme RotPrior), artifacts arise for the Laplacian, SEGUE, and ROMEO unwrapping methods. This is probably due to interpolation errors along phase wraps (Figure 4). Therefore, any phase unwrapping must be carried out in images left in the same orientation as acquired, with rotations only being applied afterward to avoid artifacts.
When using PDF for background field removal, numerical phantom and in vivo results show that RotPrior consistently provides the most accurate susceptibility maps, while NoRot performs the worst (Figures 5 and 8). Striping artifacts arise in local field maps in both the numerical phantom and in vivo when using PDF with the DipK method. First identified by Dixon, 8 these striping artifacts are present due to the violations in circular continuity when defining the tilted dipole in k‐space and using the inverse discrete Fourier transform to transform the susceptibility maps into image space (which enforces periodicity; see Supporting Information Figure S7). Striping artifacts arise from regions of high susceptibility changes, such as on the brain boundaries (Figures 5C and 8C). DipIm also resulted in poor background field removal, most likely due to fitting to the incorrect twisted or sheared unit dipole field (bottom row of Figure 1). To avoid artifacts and robustly achieve background field removal with PDF, total field maps must be rotated into alignment with the scanner frame before PDF background field removal, as it is then possible to use the nonoblique dipole, which does not violate circular continuity (Supporting Information Figure S8). We showed that LBV and V‐SHARP were mostly unaffected by oblique acquisition, with the differences between zero and nonzero tilt angles arising solely from rotation interpolation effects.
Given that RotPrior is the most accurate method for PDF, the typically necessary mask erosion must be carried out after rotation into the reference space. Artifacts that arise along the boundaries of the local field map if erosion is carried out before rotation (Supporting Information Figure S5A,B) probably arise from distortion of the dipolar background fields due to interpolation at the edges. In contrast, V‐SHARP does not show substantial differences with mask erosion before v. after rotation, which suggests that the interpolation may not substantially affect the harmonic nature of the background fields on which this method relies.
We found that TKD and iterative Tikhonov regularization are affected by oblique image orientation and most accurate with RotPrior. We showed weighted linear TV to be relatively robust to oblique acquisition; however, RotPrior is still maintained to be the most consistently robust method (Figure 9). For all susceptibility calculation methods tested, a unit dipole field misaligned to the main magnetic field (NoRot) leads to artifacts and substantial errors in susceptibility maps. The subtle differences between correction methods found in the numerical phantom ROIs (Figure 6) were not apparent in vivo, probably due to noise, motion, and the expected variability in susceptibility maps over repeated acquisitions. 28 , 55
At nonzero tilt angles, XSIM (and RMSE in Supporting Information Figure S4) values have a respectively high (or low) baseline level arising from rotation (no matter how small the angle) and registration interpolations, and imperfections inherent to in vivo acquisition. Additional discrepancies in similarity measures between rotated and unrotated QSM may also have occurred due to slight differences in repeated acquisitions, as evidenced by the slightly larger (0–5°) XSIM discrepancy in vivo than in the numerical phantom (Figures 8 and 9 compared with Figures 5 and 6). The effect of these discrepancies has been minimized by averaging across all 5 healthy volunteers.
Our results also indicate that at larger tilt angles in the numerical phantom, DipK is less accurate than RotPrior; therefore, for certain imaging applications including cardiac imaging 56 and pelvic imaging, 57 , 58 where large tilt angles up to and exceeding 45° are often required, tilt correction is likely to be essential for accurate susceptibility mapping.
Therefore, we recommend accounting for oblique acquisition by using the RotPrior tilt‐correction method before background field removal, as this method gave the most accurate susceptibility maps in both the numerical phantom and in vivo. If desired, the susceptibility map can be rotated back into the original orientation after susceptibility calculation to facilitate comparison with other (processed) images. In the future, it would be interesting to carry out a similar investigation of tilt‐correction methods for total field inversion, 59 , 60 in which background field removal and susceptibility calculation are combined into a single step. Due to the reliance of total field inversion on the correct definition of the magnetic dipole, we would expect to see similar results, with RotPrior being more robust to oblique acquisition. However, this would need to be confirmed with further work. It is possible to build an alternative rotation‐free pipeline of methods relatively unaffected by oblique acquisition (such as LBV and weighted linear TV), but those methods must be checked to ensure true independence of image orientation. However, such an approach limits the choice of methods for the steps in the QSM pipeline, which could lead to suboptimal susceptibility maps. For example, LBV's highly specific boundary approximations can be easily violated, making it easier to simply rotate the field maps in some cases. These aspects must be considered carefully when designing a QSM pipeline.
6. CONCLUSIONS
Oblique acquisition must be accounted for in the QSM pipeline to avoid artifacts and erroneous susceptibility estimates. We recommend rotating the total field map into alignment with the scanner frame after phase unwrapping but before background field removal (and then rotating the final susceptibility map back into the original orientation). Alternatively, a QSM pipeline relatively robust to oblique acquisition can be built from a more limited number of image orientation–independent methods (eg, LBV or V‐SHARP for background field removal and weighted linear TV for susceptibility calculation). However, care must be taken in weighing up the minimal effects of image interpolation (from tilt‐correction rotations) versus choosing from a smaller range of methods that are orientation‐independent and may not be as robust to oblique acquisition, as they may not be as accurate nor optimal for a given data set. It would also be vital to ensure a chosen method is independent of slice orientation, which may require further investigation. Our recommended correction scheme ensures that all methods developed for each stage of the QSM pipeline can be used and optimized.
FUNDING INFORMATION
O.C.K.: EPSRC Doctoral Training Partnership (EP/R513143/1) and EPSRC‐funded UCL Center for Doctoral Training in Intelligent, Integrated Imaging in Healthcare (i4health) (EP/S021930/1). J.T.: support from the National Institute for Health Research University College London Hospitals Biomedical Research Center. A.K. and K.S.: European Research Council Consolidator Grant DiSCo MRI SFN 770939.
Supporting information
Figure S1. Results in the numerical phantom from oblique image volumes tilted about the x‐axis. The volumes were padded to ensure no parts of the original image volume were cut off during rotations. The QSM‐tuned structural similarity index (XSIM) measurements of QSM calculated with tilt corrections before background field removal with projection onto dipole fields (PDF) (A), Laplacian boundary value (LBV) (B), and variable‐kernel sophisticated harmonic artifact reduction for phase data (V‐SHARP) (C) agree with the unpadded results (Figure 5). The XSIM measurements comparing tilt correction schemes before susceptibility calculation with thresholded k‐space division (TKD) (D), iterative Tikhonov regularization (E), and linear weighted linear total variation (TV) (F) methods are also in agreement with the unpadded results (Figure 6, bottom row)
Figure S2. Results in the numerical phantom from oblique image volumes tilted about the y‐axis with padded image volumes to ensure no parts of the original image volume were cut off during rotations. The XSIM measurements of QSM calculated with tilt corrections before background field removal with PDF (A), LBV (B), and V‐SHARP (C) agree with the unpadded results and rotations about the x‐axis (Figure 5, Supporting Information Figure S1A–C). The XSIM measurements comparing tilt‐correction schemes before susceptibility calculation with TKD (D), iterative Tikhonov regularization (E), and linear weighted linear TV (F) methods are also in agreement with the unpadded results and x‐axis rotations (Figure 6, bottom row; Supporting Information Figure S1D–F)
Figure S3. Numerical phantom results from rotations about the y = x‐axis with padded image volumes to ensure no parts of the original image volume were cut off during rotations. The XSIM measurements of QSM during the background field removal part of the pipeline for PDF (A), LBV (B), and V‐SHARP (C) agree with the unpadded results and rotations about the x‐axes and y‐axes. The XSIM measurements comparing susceptibility calculation methods TKD (D), iterative Tikhonov regularization (E), and weighted linear TV (F) are also in agreement with the unpadded results and x‐axis and y‐axis rotations (Figure 6, bottom row; Supporting Information Figures S1 and S2D–F)
Figure S4. The RMS error (RMSE) plots over all angles for all tilt‐correction schemes and all three susceptibility calculation methods in the numerical phantom (A–C) and averaged across all healthy volunteers (D–F). These results agree with the XSIM measurements found in Figures 6 and 9 for the numerical phantom and the in vivo results, respectively. The error bars in (D)–(F) represent the SD on the mean across all volunteers
Figure S5. For improved PDF performance, the brain mask is typically eroded. If this erosion takes place before rotating the field map into alignment with (A) compared with after (B), artifacts arise along the edges of the local field map following background field removal with PDF (A, orange arrows), increasing the RMSE and decreasing the XSIM. These artifacts do not arise when using V‐SHARP (C, erosion before; D, erosion after)
Figure S6. The χ maps and difference images illustrating the effects of all tilt‐correction schemes on susceptibility calculation in vivo. An axial and a coronal slice are shown for a volume tilted at 45° and a reference (0°) volume with all χ maps calculated using the TKD method. NoRot leads to the largest differences and image artifacts throughout the brain. The EVE regions of interest (ROIs) used are shown (bottom left). These results are very similar to iterative Tikhonov and weighted linear TV susceptibility maps (Figure 10)
Figure S7. Oblique k‐space magnetic dipole kernels laid side by side to illustrate the violations in circular continuity. These dipoles are used in the DipK correction method, which leads to striping artifacts due to the violations in circular continuity (ie, discontinuities at the boundaries of the rotated k‐space dipoles; white square and arrows)
Figure S8. Nonoblique k‐space magnetic dipole kernels laid side by side to illustrate circular continuity. When there is no oblique acquisition, there are no violations in circular continuity (ie, identical values and no discontinuities at the boundaries of the k‐space dipoles; white square)
ACKNOWLEDGMENT
The authors thank Dr. Carlos Milovic for his help with the FANSI toolbox, and the healthy volunteers for their time.
Kiersnowski OC, Karsa A, Wastling SJ, Thornton JS, Shmueli K. Investigating the effect of oblique image acquisition on the accuracy of QSM and a robust tilt correction method. Magn Reson Med. 2023;89:1791‐1808. doi: 10.1002/mrm.29550
Click here for author‐reader discussions
Funding information Engineering and Physical Sciences Research Council, Grant/Award Numbers: EP/R513143/1; EP/S021930/1; European Research Council, Grant/Award Number: DiSCo MRI SFN 770939
[Correction added after online publication [16 March 2023]: The authors have revised the caption to Figure 7.]
DATA AVAILABILITY STATEMENT
An open‐source MATLAB function that can be easily incorporated into existing MATLAB‐based QSM pipelines and used both to align oblique 3D volumes with the scanner frame and to rotate image volumes (eg, susceptibility maps) back into the original oblique image orientation is freely available at https://github.com/o‐snow/QSM_TiltCorrection.git.
REFERENCES
- 1. Traboulsee A, Simon JH, Stone L, et al. Revised recommendations of the consortium of MS centers task force for a standardized MRI protocol and clinical guidelines for the diagnosis and follow‐up of multiple sclerosis. Am J Neuroradiol. 2016;37:394‐401. [DOI] [PMC free article] [PubMed] [Google Scholar]
- 2. Jack CR, Theodore WH, Cook M, McCarthy G. MRI‐based hippocampal volumetrics: data acquisition, normal ranges, and optimal protocol. Magn Reson Imaging. 1995;13:1057‐1064. [DOI] [PubMed] [Google Scholar]
- 3. Chen W, Zhu XH. Suppression of physiological eye movement artifacts in functional MRI using slab presaturation. Magn Reson Med. 1997;38:546‐550. [DOI] [PubMed] [Google Scholar]
- 4. Deistung A, Schweser F, Reichenbach JR. Overview of quantitative susceptibility mapping. NMR Biomed. 2017;30:e3569. [DOI] [PubMed] [Google Scholar]
- 5. Wang Y, Liu T. Quantitative susceptibility mapping (QSM): decoding MRI data for a tissue magnetic biomarker. Magn Reson Med. 2015;73:82‐101. [DOI] [PMC free article] [PubMed] [Google Scholar]
- 6. K. S. Quantitative susceptibility mapping. Quantitative Magnetic Resonance Imaging. 1st ed. Amsterdam, Netherlands: Elsevier; 2020. [Google Scholar]
- 7. de Rochefort L, Liu T, Kressler B, et al. Quantitative susceptibility map reconstruction from MR phase data using bayesian regularization: validation and application to brain imaging. Magn Reson Med. 2010;63:194‐206. [DOI] [PubMed] [Google Scholar]
- 8. Dixon EC. Applications of MRI Magnetic Susceptibility Mapping in PET‐MRI Brain Studies. Doctoral thesis, UCL (University College London). 2018. http://discovery.ucl.ac.uk/10053515/.
- 9. Kiersnowski OC, Karsa A, Thornton JS, Shmueli K. The effect of oblique image slices on the accuracy of quantitative susceptibility mapping and a robust tilt correction method. In: Proceedings of the Annual Meeting of ISMRM [Virtual], 2021. Abstract #794.
- 10. Eskreis‐Winkler S, Zhang Y, Zhang J, et al. The clinical utility of QSM: disease diagnosis, medical management, and surgical planning. NMR Biomed. 2017;30:e3668. [DOI] [PubMed] [Google Scholar]
- 11. Liu C, Wei H, Gong N, Cronin M, Dibb R, Decker K. Quantitative susceptibility mapping: contrast mechanisms and clinical applications. Tomography. 2015;1:3‐17. [DOI] [PMC free article] [PubMed] [Google Scholar]
- 12. Haacke EM, Liu S, Buch S, Zheng W, Wu D, Ye Y. Quantitative susceptibility mapping: current status and future directions. Magn Reson Imaging. 2015;33:1‐25. [DOI] [PubMed] [Google Scholar]
- 13. Liu C, Li W, Tong KA, Yeom KW, Kuzminski S. Susceptibility‐weighted imaging and quantitative susceptibility mapping in the brain. J Magn Reson Imaging. 2015;42:23‐41. [DOI] [PMC free article] [PubMed] [Google Scholar]
- 14. Bray TJP, Karsa A, Bainbridge A, et al. Association of bone mineral density and fat fraction with magnetic susceptibility in inflamed trabecular bone. Magn Reson Med. 2019;81:3094‐3107. [DOI] [PMC free article] [PubMed] [Google Scholar]
- 15. MEDI Toolbox . Accessed 9 January 2020. http://pre.weill.cornell.edu/mri/pages/qsm.html.
- 16. Neuroimaging Informatics Technology Initiative . Accessed 23 September 2022. https://nifti.nimh.nih.gov/.
- 17. Marques JP, Bowtell RW. Using forward calculations of the magnetic field perturbation due to a realistic vascular model to explore the bold effect. NMR Biomed. 2008;21:553‐565. [DOI] [PubMed] [Google Scholar]
- 18. Salomir R, de Senneville BD, Moonen CTW. A fast calculation method for magnetic field inhomogeneity due to an arbitrary distribution of bulk susceptibility. Concepts Magn Reson Part B Magn Reson Eng. 2003;19B:26‐34. [Google Scholar]
- 19. FANSI Toolbox . Accessed 24 March 2022. https://gitlab.com/cmilovic/FANSI‐toolbox.
- 20. STI Suite . http://people.duke.edu/∼cl160/.
- 21. Jenkinson M, Beckmann CF, Behrens TEJ, Woolrich MW, Smith SM. FSL. Neuroimage. 2012;62:782‐790. [DOI] [PubMed] [Google Scholar]
- 22. Marques JP, Meineke J, Milovic C, et al. QSM reconstruction challenge 2.0: a realistic in silico head phantom for MRI data simulation and evaluation of susceptibility mapping procedures. Magn Reson Med. 2021;86:526‐542. [DOI] [PMC free article] [PubMed] [Google Scholar]
- 23. Liu T, Wisnieff C, Lou M, Chen W, Spincemaille P, Wang Y. Nonlinear formulation of the magnetic field to source relationship for robust quantitative susceptibility mapping. Magn Reson Med. 2013;69:467‐476. [DOI] [PubMed] [Google Scholar]
- 24. Biondetti E, Karsa A, Thomas DL, Shmueli K. Investigating the accuracy and precision of TE‐dependent versus multi‐echo QSM using Laplacian‐based methods at 3 T. Magn Reson Med. 2020;84:3040‐3053. [DOI] [PubMed] [Google Scholar]
- 25. Shmueli K, De Zwart JA, Van Gelderen P, Li TQ, Dodd SJ, Duyn JH. Magnetic susceptibility mapping of brain tissue in vivo using MRI phase data. Magn Reson Med. 2009;62:1510‐1522. [DOI] [PMC free article] [PubMed] [Google Scholar]
- 26. Karsa, A, Shmueli K. MRI Susceptibility Calculation Methods . Accessed 5 December 2019. https://xip.uclb.com/i/software/mri_qsm_tkd.html.
- 27. Schweser F, Deistung A, Sommer K, Reichenbach JR. Toward online reconstruction of quantitative susceptibility maps: superfast dipole inversion. Magn Reson Med. 2013;69:1581‐1593. [DOI] [PubMed] [Google Scholar]
- 28. Karsa A, Punwani S, Shmueli K. An optimized and highly repeatable MRI acquisition and processing pipeline for quantitative susceptibility mapping in the head‐and‐neck region. Magn Reson Med. 2020;84:3206‐3222. [DOI] [PubMed] [Google Scholar]
- 29. Chary K, Nissi MJ, Nykänen O, et al. Quantitative susceptibility mapping of the rat brain after traumatic brain injury. NMR Biomed. 2021;34:1‐15. [DOI] [PubMed] [Google Scholar]
- 30. Stone AJ, Tornifoglio B, Johnston RD, Shmueli K, Kerskens C, Lally C. Quantitative susceptibility mapping of carotid arterial tissue ex vivo: assessing sensitivity to vessel microstructural composition. Magn Reson Med. 2021;86:2512‐2527. [DOI] [PubMed] [Google Scholar]
- 31. Berg RC, Preibisch C, Thomas DL, Shmueli K, Biondetti E. Investigating the effect of flow compensation and quantitative susceptibility mapping method on the accuracy of venous susceptibility measurement. Neuroimage. 2021;240:118399. [DOI] [PubMed] [Google Scholar]
- 32. Hansen PC, O'Leary DP. The use of the L‐curve in the regularization of discrete ill‐posed problems. SIAM J Sci Comput. 1993;14:1487‐1503. [Google Scholar]
- 33. Milovic C, Bilgic B, Zhao B, Acosta‐Cabronero J, Tejos C. Fast nonlinear susceptibility inversion with variational regularization. Magn Reson Med. 2018;80:814‐821. [DOI] [PubMed] [Google Scholar]
- 34. Bilgic B, Langkammer C, Marques JP, Meineke J, Milovic C, Schweser F. QSM reconstruction challenge 2.0: design and report of results. Magn Reson Med. 2021;86:1241‐1255. [DOI] [PubMed] [Google Scholar]
- 35. Milovic C, Tejos C, Irarrazaval P. Structural similarity index metric setup for QSM applications (XSIM). In: Proceedings of the 5th International Workshop on MRI Phase Contrast & Quantitative Susceptibility Mapping, Seoul, Korea, 2019.
- 36. Buch S, Liu S, Ye Y, Cheng YCN, Neelavalli J, Haacke EM. Susceptibility mapping of air, bone, and calcium in the head. Magn Reson Med. 2015;73:2185‐2194. [DOI] [PubMed] [Google Scholar]
- 37. Burgos N, Cardoso MJ, Thielemans K, et al. Attenuation correction synthesis for hybrid PET‐MR scanners: application to brain studies. IEEE Trans Med Imaging. 2014;33:2332‐2341. [DOI] [PubMed] [Google Scholar]
- 38. NiftyWeb . Accessed 24 February 2021. http://niftyweb.cs.ucl.ac.uk/.
- 39. Prados F, Cardoso MJ, Burgos N, et al. 2016. NiftyWeb: web based platform for image processing on the cloud. In: Proceedings of the 24th Annual Meeting of ISMRM, Singapore, 2016. Abstract #1049.
- 40. Schweser F, Robinson SD, de Rochefort L, Li W, Bredies K. An illustrated comparison of processing methods for phase MRI and QSM: removal of background field contributions from sources outside the region of interest. NMR Biomed. 2017;30:e3604. [DOI] [PMC free article] [PubMed] [Google Scholar]
- 41. Fortier V, Levesque IR. Phase processing for quantitative susceptibility mapping of regions with large susceptibility and lack of signal. Magn Reson Med. 2018;79:3103‐3113. [DOI] [PubMed] [Google Scholar]
- 42. Liu T, Khalidov I, de Rochefort L, et al. A novel background field removal method for MRI using projection onto dipole fields (PDF). NMR Biomed. 2011;24:1129‐1136. [DOI] [PMC free article] [PubMed] [Google Scholar]
- 43. Zhou D, Liu T, Spincemaille P, Wang Y. Background field removal by solving the Laplacian boundary value problem. NMR Biomed. 2014;27:312‐319. [DOI] [PubMed] [Google Scholar]
- 44. Li W, Wu B, Liu C. Quantitative susceptibility mapping of human brain reflects spatial variation in tissue composition. Neuroimage. 2011;55:1645‐1656. [DOI] [PMC free article] [PubMed] [Google Scholar]
- 45. Schofield MA, Zhu Y. Fast phase unwrapping algorithm for interferometric applications. Opt Lett. 2003;28:1194‐1196. [DOI] [PubMed] [Google Scholar]
- 46. Karsa A, Shmueli K. SEGUE: a speedy rEgion‐growing algorithm for unwrapping estimated phase. IEEE Trans Med Imaging. 2019;38:1347‐1357. [DOI] [PubMed] [Google Scholar]
- 47. Dymerska B, Eckstein K, Bachrata B, et al. Phase unwrapping with a rapid opensource minimum spanning tree algorithm (ROMEO). Magn Reson Med. 2021;85:2294‐2308. [DOI] [PMC free article] [PubMed] [Google Scholar]
- 48. Eckstein K, Dymerska B, Bachrata B, et al. Computationally efficient combination of multi‐channel phase data from multi‐echo acquisitions (ASPIRE). Magn Reson Med. 2018;79:2996‐3006. [DOI] [PubMed] [Google Scholar]
- 49. Smith SM. Fast robust automated brain extraction. Hum Brain Mapp. 2002;17:143‐155. [DOI] [PMC free article] [PubMed] [Google Scholar]
- 50. Modat M, Cash DM, Daga P, Winston GP, Duncan JS, Ourselin S. Global image registration using a symmetric block‐matching approach. J Med Imaging. 2014;1:24003. [DOI] [PMC free article] [PubMed] [Google Scholar]
- 51. Jenkinson M. Fast, automated, N‐dimensional phase‐unwrapping algorithm. Magn Reson Med. 2003;49:193‐197. [DOI] [PubMed] [Google Scholar]
- 52. Abdul‐Rahman HS, Gdeisat MA, Burton DR, Lalor MJ, Lilley F, Moore CJ. Fast and robust three‐dimensional best path phase unwrapping algorithm. Appl Optics. 2007;46:6623‐6635. [DOI] [PubMed] [Google Scholar]
- 53. Schweser F, Deistung A, Reichenbach JR. Foundations of MRI phase imaging and processing for quantitative susceptibility mapping (QSM). Z Med Phys. 2016;26:6‐34. [DOI] [PubMed] [Google Scholar]
- 54. Lim IAL, Faria AV, Li X, et al. Human brain atlas for automated region of interest selection in quantitative susceptibility mapping: application to determine iron content in deep gray matter structures. Neuroimage. 2013;82:449‐469. [DOI] [PMC free article] [PubMed] [Google Scholar]
- 55. Feng X, Deistung A, Reichenbach JR. Quantitative susceptibility mapping (QSM) and R2* in the human brain at 3 T: evaluation of intra‐scanner repeatability. Z Med Phys. 2018;28:36‐48. [DOI] [PubMed] [Google Scholar]
- 56. Russo V, Lovato L, Ligabue G. Cardiac MRI: technical basis. Radiol Med. 2020;125:1040‐1055. [DOI] [PubMed] [Google Scholar]
- 57. Balleyguier C, Sala E, da Cunha T, et al. Staging of uterine cervical cancer with MRI: guidelines of the European Society of Urogenital Radiology. Eur Radiol. 2011;21:1102‐1110. [DOI] [PubMed] [Google Scholar]
- 58. Jans L, van Langenhove C, van Praet L, et al. Diagnostic value of pelvic enthesitis on MRI of the sacroiliac joints in spondyloarthritis. Eur Radiol. 2014;24:866‐871. [DOI] [PubMed] [Google Scholar]
- 59. Liu Z, Kee Y, Zhou D, Wang Y, Spincemaille P. Preconditioned total field inversion (TFI) method for quantitative susceptibility mapping. Magn Reson Med. 2017;78:303‐315. [DOI] [PMC free article] [PubMed] [Google Scholar]
- 60. Chatnuntawech I, McDaniel P, Cauley SF, et al. Single‐step quantitative susceptibility mapping with variational penalties. NMR Biomed. 2017;30:e3570. [DOI] [PMC free article] [PubMed] [Google Scholar]
Associated Data
This section collects any data citations, data availability statements, or supplementary materials included in this article.
Supplementary Materials
Figure S1. Results in the numerical phantom from oblique image volumes tilted about the x‐axis. The volumes were padded to ensure no parts of the original image volume were cut off during rotations. The QSM‐tuned structural similarity index (XSIM) measurements of QSM calculated with tilt corrections before background field removal with projection onto dipole fields (PDF) (A), Laplacian boundary value (LBV) (B), and variable‐kernel sophisticated harmonic artifact reduction for phase data (V‐SHARP) (C) agree with the unpadded results (Figure 5). The XSIM measurements comparing tilt correction schemes before susceptibility calculation with thresholded k‐space division (TKD) (D), iterative Tikhonov regularization (E), and linear weighted linear total variation (TV) (F) methods are also in agreement with the unpadded results (Figure 6, bottom row)
Figure S2. Results in the numerical phantom from oblique image volumes tilted about the y‐axis with padded image volumes to ensure no parts of the original image volume were cut off during rotations. The XSIM measurements of QSM calculated with tilt corrections before background field removal with PDF (A), LBV (B), and V‐SHARP (C) agree with the unpadded results and rotations about the x‐axis (Figure 5, Supporting Information Figure S1A–C). The XSIM measurements comparing tilt‐correction schemes before susceptibility calculation with TKD (D), iterative Tikhonov regularization (E), and linear weighted linear TV (F) methods are also in agreement with the unpadded results and x‐axis rotations (Figure 6, bottom row; Supporting Information Figure S1D–F)
Figure S3. Numerical phantom results from rotations about the y = x‐axis with padded image volumes to ensure no parts of the original image volume were cut off during rotations. The XSIM measurements of QSM during the background field removal part of the pipeline for PDF (A), LBV (B), and V‐SHARP (C) agree with the unpadded results and rotations about the x‐axes and y‐axes. The XSIM measurements comparing susceptibility calculation methods TKD (D), iterative Tikhonov regularization (E), and weighted linear TV (F) are also in agreement with the unpadded results and x‐axis and y‐axis rotations (Figure 6, bottom row; Supporting Information Figures S1 and S2D–F)
Figure S4. The RMS error (RMSE) plots over all angles for all tilt‐correction schemes and all three susceptibility calculation methods in the numerical phantom (A–C) and averaged across all healthy volunteers (D–F). These results agree with the XSIM measurements found in Figures 6 and 9 for the numerical phantom and the in vivo results, respectively. The error bars in (D)–(F) represent the SD on the mean across all volunteers
Figure S5. For improved PDF performance, the brain mask is typically eroded. If this erosion takes place before rotating the field map into alignment with (A) compared with after (B), artifacts arise along the edges of the local field map following background field removal with PDF (A, orange arrows), increasing the RMSE and decreasing the XSIM. These artifacts do not arise when using V‐SHARP (C, erosion before; D, erosion after)
Figure S6. The χ maps and difference images illustrating the effects of all tilt‐correction schemes on susceptibility calculation in vivo. An axial and a coronal slice are shown for a volume tilted at 45° and a reference (0°) volume with all χ maps calculated using the TKD method. NoRot leads to the largest differences and image artifacts throughout the brain. The EVE regions of interest (ROIs) used are shown (bottom left). These results are very similar to iterative Tikhonov and weighted linear TV susceptibility maps (Figure 10)
Figure S7. Oblique k‐space magnetic dipole kernels laid side by side to illustrate the violations in circular continuity. These dipoles are used in the DipK correction method, which leads to striping artifacts due to the violations in circular continuity (ie, discontinuities at the boundaries of the rotated k‐space dipoles; white square and arrows)
Figure S8. Nonoblique k‐space magnetic dipole kernels laid side by side to illustrate circular continuity. When there is no oblique acquisition, there are no violations in circular continuity (ie, identical values and no discontinuities at the boundaries of the k‐space dipoles; white square)
Data Availability Statement
An open‐source MATLAB function that can be easily incorporated into existing MATLAB‐based QSM pipelines and used both to align oblique 3D volumes with the scanner frame and to rotate image volumes (eg, susceptibility maps) back into the original oblique image orientation is freely available at https://github.com/o‐snow/QSM_TiltCorrection.git.


