Abstract
After myocardial infarction (MI), mammalian hearts do not regenerate, and the microenvironment is disrupted. Hippo signaling loss of function with activation of transcriptional co-factor YAP induces heart renewal and rebuilds the post-MI microenvironment. In this study, we investigated adult renewal-competent mouse hearts expressing an active version of YAP, called YAP5SA, in cardiomyocytes (CMs). Spatial transcriptomics and single-cell RNA sequencing revealed a conserved, renewal-competent CM cell state called adult (a)CM2 with high YAP activity. aCM2 co-localized with cardiac fibroblasts (CFs) expressing complement pathway component C3 and macrophages (MPs) expressing C3ar1 receptor to form a cellular triad in YAP5SA hearts and renewal-competent neonatal hearts. Although aCM2 was detected in adult mouse and human hearts, the cellular triad failed to co-localize in these non-renewing hearts. C3 and C3ar1 loss-of-function experiments indicated that C3a signaling between MPs and CFs was required to assemble the pro-renewal aCM2, C3+ CF and C3ar1+ MP cellular triad.
Long-lived adult mammalian cardiomyocytes (CMs) turn over less than 1% annually. This poor renewal capacity of CMs results from CM-intrinsic characteristics1. Sarcomeres provide essential pumping function and are a physical barrier to cytokinesis2. CMs use oxidative phosphorylation, which contributes to poor renewal as a metabolic barrier3. Other CM renewal barriers are thought to be an inaccessible chromatin landscape and CM polyploidy4. The neonatal mouse heart can renew postnatally due to CM-intrinsic characteristics, including immature sarcomeres, diploidy and a more glycolytic metabolism compared to adult CMs5. Exceptions to CM-centric paradigms include the requirement of nerves for CM proliferation6 and pro-renewal function of resident macrophages (RMPs)7.
The Hippo signaling pathway, a kinase cascade that phosphorylates and inactivates YAP8 and inhibits heart renewal, has low neonatal activity9. Hippo signaling pathway inhibition to activate YAP, in adult mouse and pig hearts after myocardial infarction (MI), promotes heart renewal8,10. In pigs, local viral delivery of small hairpin RNAs to knock down the Hippo signaling pathway gene Sav (Salvador) in border zone (BZ) CMs after MI suggested that YAP induces a pro-renewal microenvironment10. Expressing YAP5SA in adult mouse CMs increases chromatin accessibility and enhances fetal gene expression, reprogramming adult CMs to an embryonic day (E) 14.5 fetal cell state11. YAP5SA CMs exhibited sarcomere disassembly and reduced fatty acid oxidation. Similarly, expression of Yamanaka factors or inhibiting CM fatty acid oxidation induced heart renewal12-14.
Using spatial transcriptomics (ST), a data-driven, genome-wide interrogation of the myocardial microenvironment, combined with single-cell RNA sequencing (scRNA-seq), we discovered a YAP-driven adult CM cell state, aCM2, which co-localized with cardiac fibroblasts (CFs) expressing complement pathway gene C3 (C3+ CF). A third co-localizing cell type, complement C3a receptor 1 expressing MPs (C3ar1+ MP), was also required for renewal. Our data reveal that, in the adult YAP5SA heart and renewing neonatal heart after MI, YAP activity in CMs drives co-localization of three cell states, a cellular triad composed of distinct CMs, CFs and MPs, establishing a pro-renewal myocardial niche15,16.
Results
Spatially resolved transcriptomes of adult YAP5SA hearts
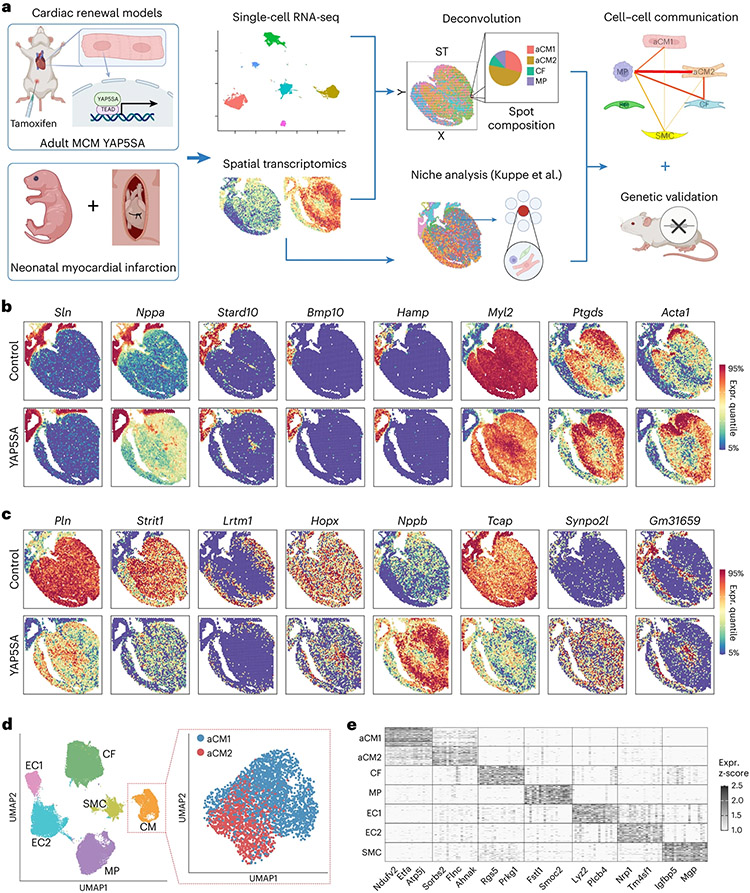
We examined two mouse models of cardiac renewal: CM-specific activation of YAP5SA11 and neonatal MI. Cell types were identified by scRNA-seq and provided a reference for ST deconvolution. We performed unsupervised clustering of spots15 in parallel with ligand–receptor and co-localization analyses to infer cell–cell interactions of the myocardial microenvironment. We used genetic models to assay gene function (Fig. 1a).
Fig. 1 ∣. Combining single-cell and ST to assay in vivo cardiac renewal.
a, Experimental workflow for the integration of scRNA-seq and ST data in two different cardiac renewal models: CM-specific expression of YAP5SA and neonatal MI. The scRNA-seq data were used as a reference for performing deconvolution on ST data to obtain the cellular composition per spot. Niche analysis, as described by Kuppe et al.15, was also performed to find spatial cellular niches. Ligand–receptor and correlation analyses were performed to infer cell–cell interactions between each cell type for each spot. The importance of the ligand/receptor genes was tested using genetic knockout mouse models. b, Spatial RNA-seq shows known representative atrial (Sln, Nppa and Stard10), right atrial (Bmp10) and ventricular (Myl2) genes and novel right atrial (Hamp) and left-sided (Ptgds and Acta1) genes. c, Dysregulated genes in YAP5SA hearts compared to control hearts, including regulators of cardiac contractility (Pln and Strit1), sarcomere formation (Tcap and Synpo2l), cardiac development (Hopx) and cardiac stress (Nppb). Gm31659 is a predicted long non-coding RNA with unknown function and is spatially restricted to the atria, RV and left ventricular subendocardium. Lrtm1 has homology to Slit3, and expression is excluded from the atria and subendocardium. d, UMAP projection of scRNA-seq data identified six distinct cell types: CMs, SMCs, CFs, MPs and ECs (EC1 and EC2). The CM population was reclustered into two populations (aCM1 and aCM2) by using control and YAP5SA data. e, Heat map of cell-type-specific marker genes (column) across cells in different cell types (rows). Expr., expression.
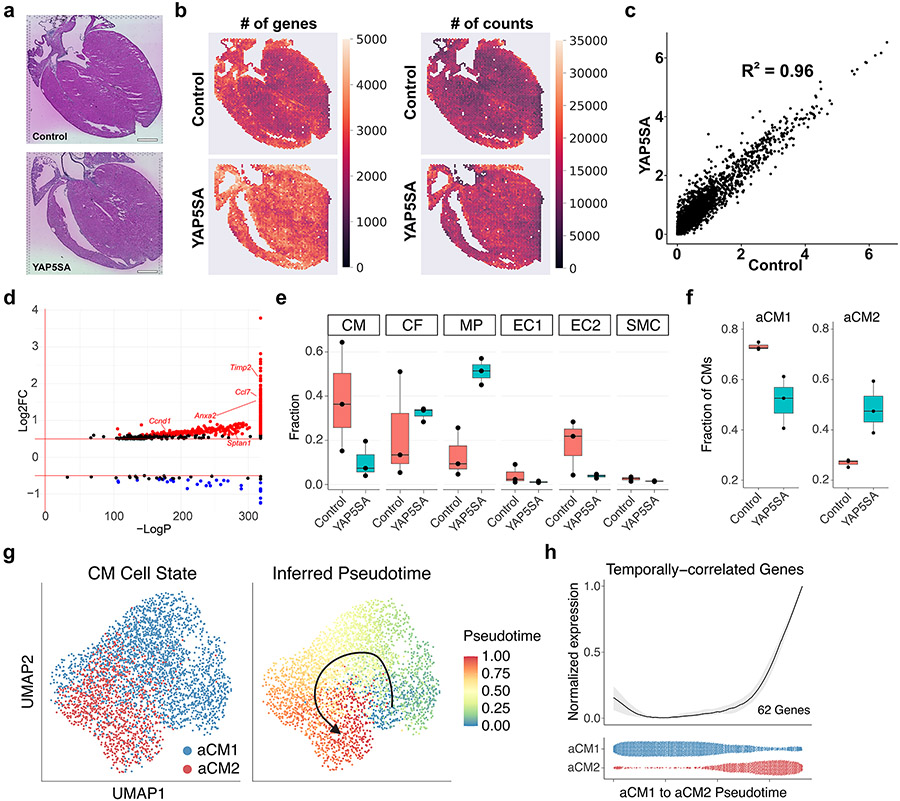
The adult ST dataset contained 3,391 spots with a median of 2,371 genes per spot for control hearts and 3,221 spots with an average of 3,109 genes per spot for YAP5SA hearts (Extended Data Fig. 1a,b). Correlation of gene expression between control and YAP5SA hearts was strong (R2 = 0.96; Extended Data Fig. 1c). YAP target gene expression, such as Ccnd1, Anxa2, Sptan1, Ccl7 and Timp1, was increased in YAP5SA as compared to control (Extended Data Fig. 1d)11. We identified region-specific genes, including Sln, Nppa and Stard10 in the atria; Bmp10 and the Bmp target gene Hamp, which encodes iron metabolism regulator Hepcidin, in the right atrium; Myl2 in the ventricles; and Ptgds and Acta1 in the left ventricle (LV) and interventricular septum (Fig. 1b).
Expression of phospholamban (Pln) and Strit1, encoding SERCA regulator DWORF, was downregulated in YAP5SA hearts (Fig. 1c)17. Hopx, encoding a protein that inhibits CM proliferation, was downregulated in YAP5SA (Fig. 1c)18. Nppb, encoding a cardiac hormone, is expressed in atria, ventricular septum and LV of control hearts and was upregulated in YAP5SA (Fig. 1c). Genes encoding proteins that regulate T-tubules and sarcomere formation were dysregulated in YAP5SA, including decreased expression of Tcap, encoding Telethonin, which stabilizes T-tubules, and increased Synpo2l expression, encoding CHAP, which disrupts sarcomere organization when overexpressed (Fig. 1c)19,20.
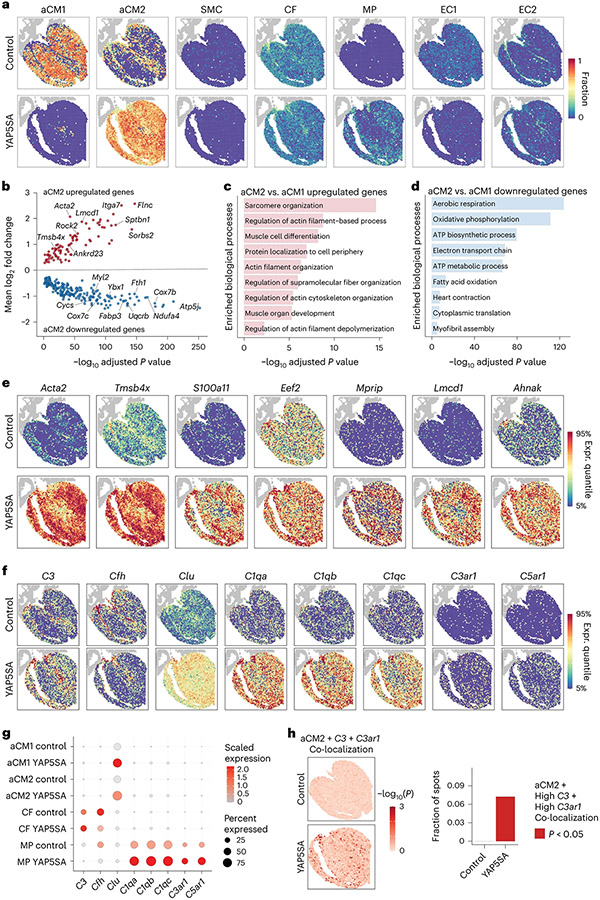
To determine cell type composition of spots, we integrated scRNA-seq data from control and YAP5SA and available datasets as a reference for ST deconvolution (Methods). We identified seven cell states: CMs were subclustered into two populations with distinct gene signatures (Supplementary Table 1): adult (a) CMs (aCM1 and aCM2). We identified smooth muscle cells (SMC), CFs, MPs and two endothelial cell (EC) states (EC1 and EC2) (Fig. 1d,e). YAP5SA hearts showed decreased EC2 and increases in MP and aCM2 states (Extended Data Fig. 1e,f). To test if aCM1 transitioned to aCM2 upon YAP5SA induction, we inferred cell state trajectory. By projecting pseudotime of single cells onto the CM uniform manifold approximation and projection (UMAP) using Slingshot21, we found a linear progression from aCM1 to aCM2 (Extended Data Fig. 1g). We modeled gene expression as a function of progression through the pseudo-temporal trajectory and discovered a 62-gene module that correlated with aCM1-to-aCM2 transition (Extended Data Fig. 1h and Supplementary Table 2), including genes involved in sarcomere disassembly22. The assembly and disassembly of sarcomeres is a poorly understood area. Deconvolution of gene expression per ST spot yielded spatial cell type localization (Fig. 2a). In controls, most CMs were classified as aCM1, and the less abundant CM population was classified as aCM2, which was localized to subendocardium and right ventricle (RV). Almost all YAP5SA CMs were classified as the aCM2 state (Fig. 2a).
Fig. 2 ∣. scRNA-seq and ST integration identifies two distinct CM populations.
a, Deconvolution of spatial gene expression spots showing the spatial localization of each cell type (fraction: 0–1) in control and YAP5SA hearts. b, Volcano plot of differentially regulated genes in aCM2 versus aCM1. c, GO analysis reveals increased expression of structural organization genes in aCM2. d, GO analysis reveals decreased aerobic metabolic processes in aCM2. e, Representative aCM2 marker gene expression. f, Complement pathway gene expression is restricted to aCM2-localized spots, including the main effector gene C3, complement pathway regulators (Cfh and Clu), complement component 1q (C1qa, C1qb and C1qc) and receptors (C3ar1 and C5ar1). g, Expression of complement pathway genes in different cell types. C3 is expressed only in CFs; Clu is expressed only in CMs; and C1q complex (C1qa, C1qb and C1qc) and receptors (C3ar1 and C5ar1) are expressed only in MPs. Expression levels of these genes are increased in YAP5SA compared to control hearts. h, aCM2, spots with high C3 expression and spots with high C3ar1 expression are significantly co-localized in YAP5SA hearts. Expr., expression.
Renewal-competent adult CM cell state is conserved in humans
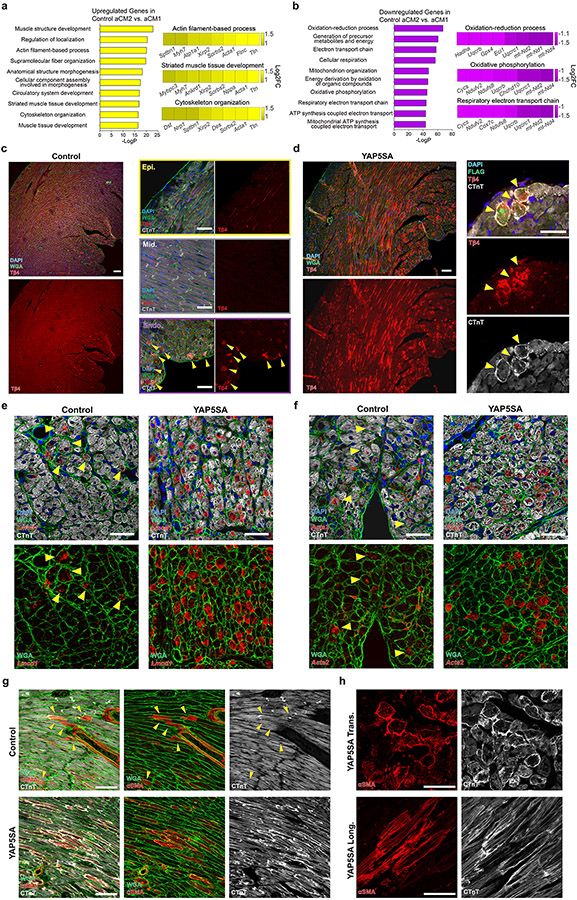
Comparison between aCM2 and aCM1 showed increased expression of fetal structural genes, including sarcomere organization genes (Fig. 2b,c and Supplementary Table 3). Downregulated genes in aCM2 versus aCM1 were associated with oxidative metabolism (Fig. 2b,d and Supplementary Table 3). Comparison of aCM2 versus aCM1 in controls revealed similar gene categories distinguishing aCM2 from aCM1 (Extended Data Fig. 2a,b). Increased expression of fetal genes and decreased expression of oxidative metabolism genes suggests that aCM2 is a fetal-like CM population, consistent with our previous study11. The existence of aCM2, fetal-like CMs in controls was previously unappreciated.
Upregulated genes in aCM2 recapitulated the aCM2 spatial pattern in control and YAP5SA hearts although with higher expression in YAP5SA aCM2 compared to control aCM2 (Fig. 2e). aCM2 markers were validated by immunofluorescence (IF). Thymosin β4 (Tβ4), a secreted peptide associated with cardiac renewal23, was expressed by CMs in the subendocardium of controls (Extended Data Fig. 2c) and increased in YAP5SA aCM2s (Extended Data Fig. 2d). aCM2 marker genes Lmcd1 and Acta2 were expressed in control subendocardial CMs and increased in YAP5SA hearts (Extended Data Fig. 2e,f). Alpha-smooth muscle actin (α-SMA) was detected in control subendocardial CMs and increased in YAP5SA CMs with sarcomere disassembly, identified by co-staining for cardiac troponin-T (CTnT) (Extended Data Fig. 2g,h).
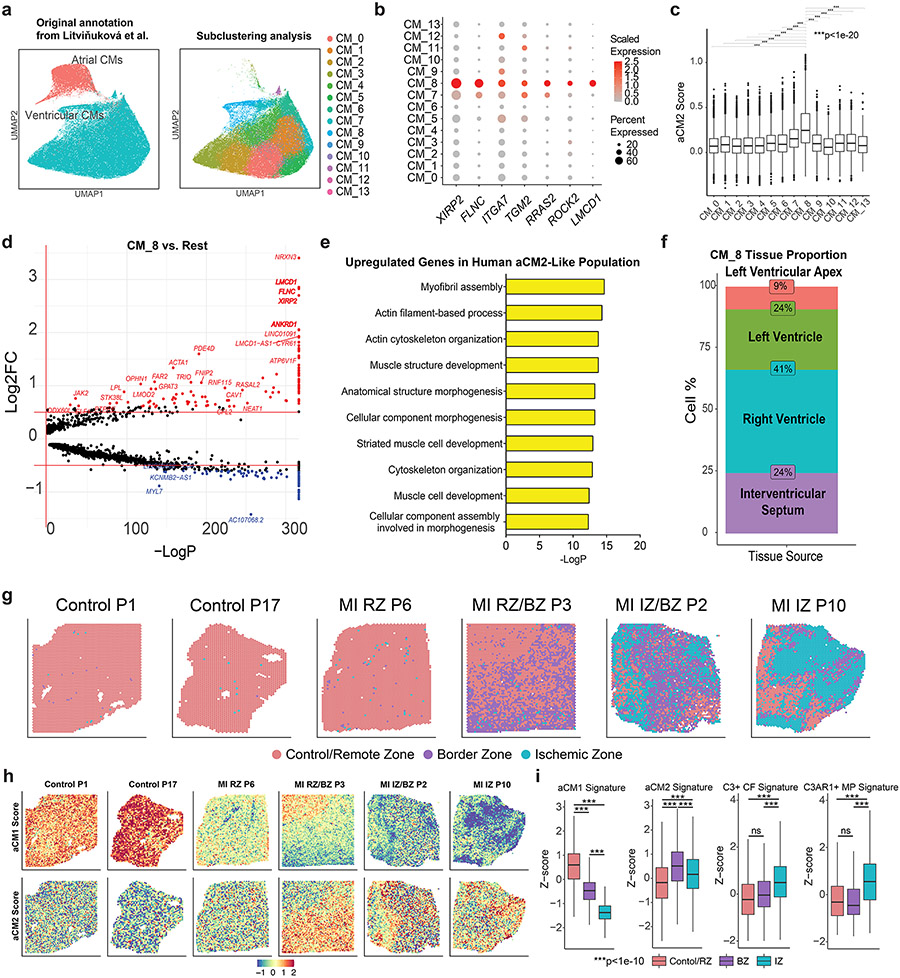
Analysis of adult human CM data revealed that human CMs (CM_8) expressed aCM2 marker genes24 (Extended Data Fig. 3a,b). The mean aCM2 gene score, based on all highly expressed aCM2 genes, was higher for CM_8 than for other human CMs (Extended Data Fig. 3c). Differentially expressed genes between CM_8 and other human CMs were aCM2 marker genes, such as XIRP2, FLNC and LMCD1 (Extended Data Fig. 3d). Gene Ontology (GO) analysis of CM_8 upregulated genes revealed terms associated with myofibril assembly, actin cytoskeletal organization and cytoskeleton organization, which are similar to murine aCM2 (Extended Data Fig. 3e). Within the CM_8 cluster, 24% of cells originated from the interventricular septum, 41% from the RV, 24% from the LV and 9% from the apex (Extended Data Fig. 3f).
We examined aCM1 and aCM2 expression in ST data from human MI samples15. We annotated 18 uninjured and injured human tissues into Control/Remote Zone (RZ), Border Zone (BZ) and Ischemic Zone (IZ) using signature genes from mouse MI models25 (Supplementary Table 4) (six representative sections in Extended Data Fig. 3g). We examined aCM1 and aCM2 scores across all 18 sections in Kuppe et al.15 and found that aCM1 is downregulated in BZ and IZ compared to RZ, whereas aCM2 is upregulated in BZ compared to IZ and RZ (Extended Data Fig. 3h,i). We conclude that the aCM2 cell state exists in renewal-competent YAP5SA hearts and in non-renewal contexts, including BZ of the post-MI human heart, indicating that other cell types in myocardial microenvironment promote heart renewal in combination with aCM2 cell state, which we explore further.
aCM2-localized spots express complement system genes
We focused on aCM2-containing spots of controls by performing differential testing enrichment (non-parametric Wilcoxon rank-sum test; false discovery rate (FDR) < 0.05) of genes in control aCM2-localized spots versus non-aCM2-localized spots. Of 346 differentially upregulated genes in aCM2-localized spots, eight were complement pathway genes (Cfh, Apoe, Serping1, C3, C1qb, C1qc, C1qa and Clu), with four in the top 25 based on average log2 fold change (FC) (Cfh, 1.45; Apoe, 1.31; Serping1, 1.03; C3, 0.95; Supplementary Table 5). We used the list of differentially upregulated genes to test the odds ratio of co-localization with aCM2 and found complement genes Cfh, Apoe, Serping1 and C3 ranked in the top 50 genes in aCM2-localized spots (Supplementary Table 6 and Methods).
The complement system functions in immune surveillance and immune cell activation and recruitment26. Complement also has a cell-intrinsic role in maintaining metabolic state in tissue homeostasis27,28. In control and YAP5SA, expression of C3, encoding C3, the central component of complement, was restricted to CFs of aCM2-localized spots, whereas expression of component C1 genes involved in classical pathway activation was enriched in MPs of aCM2-localized spots (Fig. 2f,g). Expression of C3ar1 and C5ar1, encoding receptors for activated complement fragments C3a and C5a, was low in control MPs but increased in aCM2-localized spots in YAP5SA MPs (Fig. 2f,g). Cfh, encoding Complement Factor H, the C3 convertase inhibitor, was expressed in control CFs and MPs within aCM2 spots, suggesting inhibition of complement pathway activation in controls (Fig. 2f,g). In contrast, in aCM2 spots from YAP5SA, Cfh was reduced in C3+ CFs and C3ar1+ MPs, indicating de-repression of C3 convertase in YAP5SA (Fig. 2f,g). Clu (Clusterin), encoding a protein that protects cells from complement-mediated apoptosis, was enriched in aCM1 and aCM2 in YAP5SA, suggesting that YAP5SA CMs are resistant to cell killing by complement activation (Fig. 2f,g).
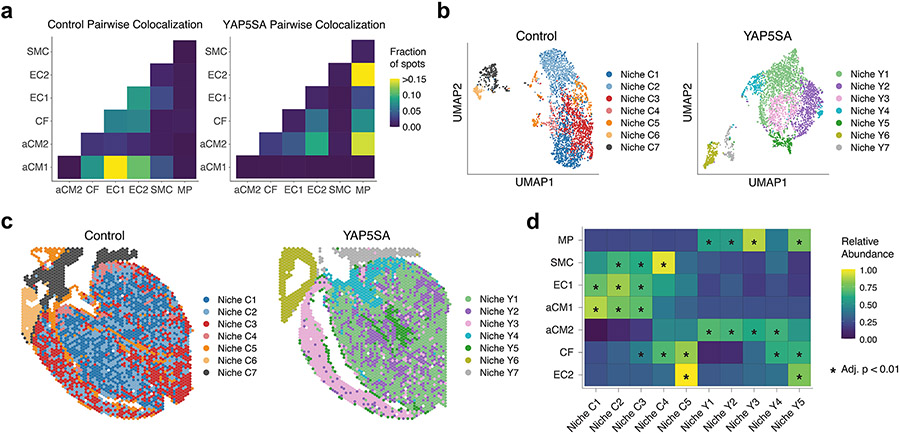
We tested the co-localization of C3 expression and C3ar1 expression in aCM2-containing spots and found co-localization in YAP5SA but not controls, suggesting that aCM2, C3ar1+ MPs and C3+ CFs establish a pro-renewal microenvironment (Fig. 2h). Pairwise co-localization between major cell types shows MPs co-localized with CF and aCM2 but not with aCM1 in YAP5SA (Extended Data Fig. 4a). We also examined co-localization of C3+ CF and C3AR1+ MP in 18 human ST sections described above, a non-renewal context. Consistent with the requirement for co-localization of these three cell types for cardiac renewal, we found that C3+ CFs and C3AR1+ MPs failed to co-localize with aCM2 in BZ (Extended Data Fig. 3i).
We performed unsupervised clustering of spots based on distinct transcriptional profiles (Supplementary Table 7). As characterized by Kuppe et al.15, distinct clusters of spots represent spatial organization of niches. Seven spatial niches were identified in each genotype, with two in atria (niches C6, C7, Y6 and Y7) and five in ventricles (Extended Data Fig. 4b,c). Control niche 5 (niche C5) and YAP5SA niche 5 (niche Y5) are localized to subendocardium and harbor most EC2 cells (Extended Data Fig. 4c,d). Although niche C5 contains abundant aCM2, CF and EC2, we observed that niches Y3 and Y5 contain abundant aCM2, CF and MP compared to other niches, indicating that the cellular triad is co-localized in the renewal-competent niche (Extended Data Fig. 4c,d).
C3+ CFs express anti-fibrotic genes
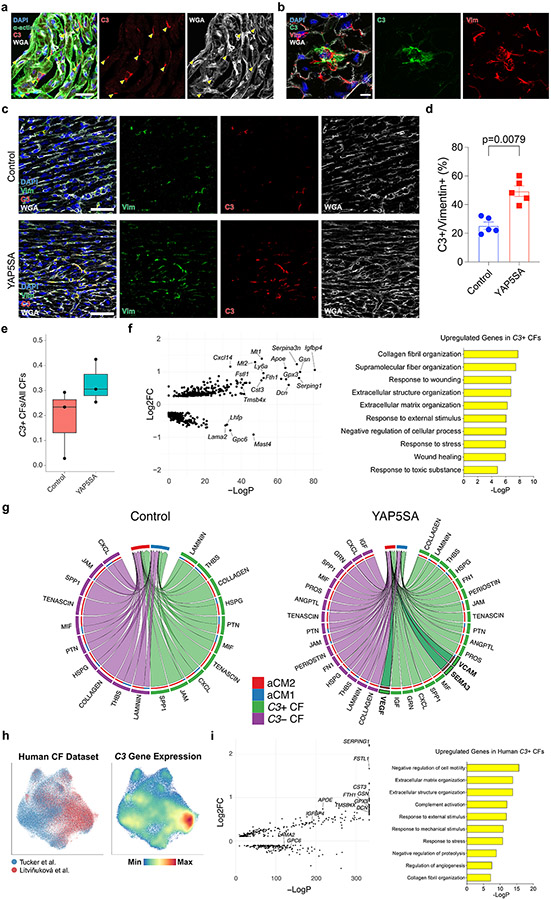
IF staining revealed C3+ CFs in control subendocardium (Extended Data Fig. 5a) and C3 in the extracellular matrix (ECM) (Extended Data Fig. 5b). The percentage of vimentin-expressing CFs that were C3+ (C3+ CFs) was higher in YAP5SA compared to controls and consistent with our scRNA-seq data (Extended Data Fig. 5c-e). Comparison of C3+ CFs to C3− CFs revealed that C3+ CFs expressed anti-fibrotic genes, including Dcn, Igfbp4 and Cst3, which encode TGF-β inhibitors29,30. Fstl1, expressed in aCM2-localized spots in control and YAP5SA hearts (Extended Data Fig. 5f), promotes adult cardiac renewal and regulates the ECM31,32. GO terms for upregulated genes in C3+ CFs included ECM organization and wound healing, suggesting that C3+ CFs modulate the ECM (Extended Data Fig. 5f). Ligand–receptor analysis, to infer signaling from CFs to CMs, revealed that VCAM, SEMA3 and VEGF were upregulated signals from C3+ CF to aCM2 in YAP5SA hearts (Extended Data Fig. 5g).
Using human heart data24,33, we found high C3 expression in human CF subcluster (Extended Data Fig. 5h). We compared expression profiles of human C3+ CFs with C3− CFs and found upregulated genes and GO terms in human C3+ CFs that were similar to murine C3+ CFs, including FSTL1, DCN, GPX3, CST3 and IGFBP4. GO terms included ECM organization (Extended Data Fig. 5i). We conclude that the C3+ CF cell state has a pro-renewal function and is conserved in humans.
Assembly of cellular triad in neonatal hearts after injury
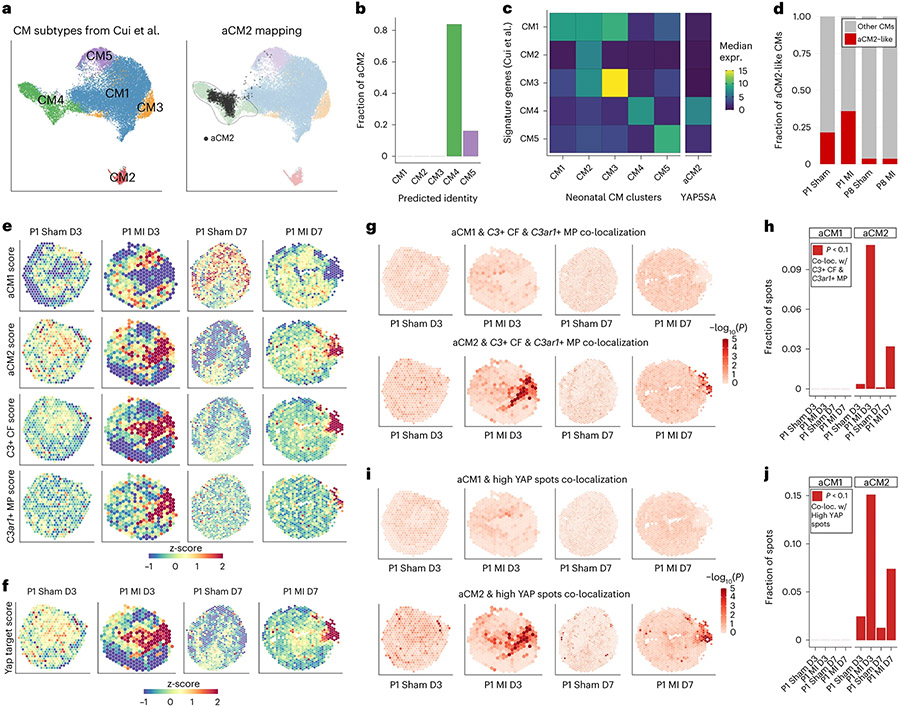
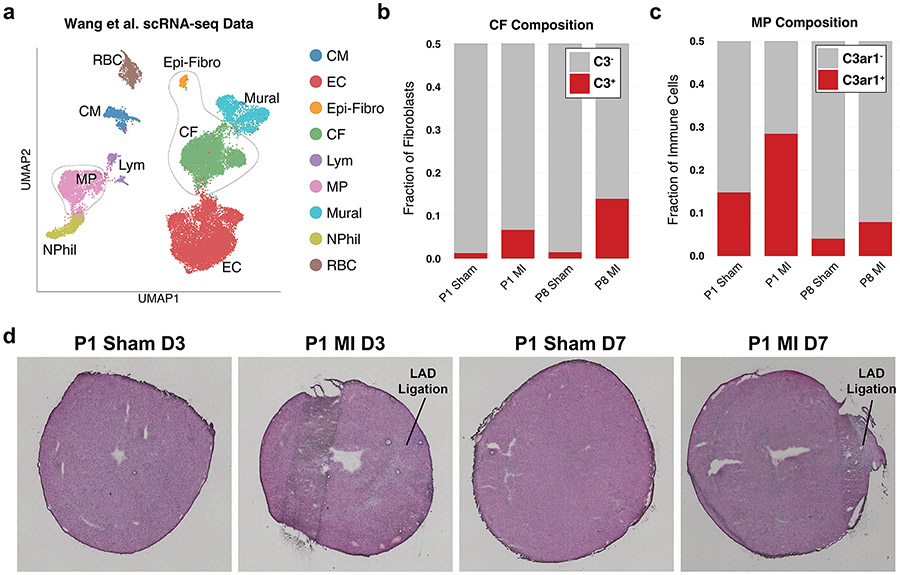
To investigate the cellular triad in neonatal heart renewal, we used available single-nucleus RNA sequencing (snRNA-seq) data from sham and MI neonatal hearts to determine whether the aCM2 cell state can be detected in neonatal heart renewal34. Cui et al.34 identified five CM subtypes, with CM4 and CM5 associated with heart renewal after MI injury (Fig. 3a). Transcriptome-wide correlation indicated that aCM2 is highly similar to the regenerative CM4 cell state (Fig. 3a). This similarity is corroborated by unbiased label transfer prediction, showing aCM2 being predominantly mapped to CM4 (Fig. 3b). We examined the median expression of signature genes from five neonatal CM clusters and found aCM2 to be similar to CM4 (Fig. 3c). Postnatal day 1 (P1) hearts have a greater fraction of aCM2 compared to P8 hearts, and aCM2 is increased in P1 MI but not in P8 MI (Fig. 3d). Next, we examined the available scRNA-seq data of non-CMs35 (Extended Data Fig. 6a) and found that C3+ CFs are increased in both P1 and P8 MI but that C3ar1+ MPs are increased only in P1 MI, consistent with the conclusion that co-localization of the cellular triad establishes the renewal-competent microenvironment (Extended Data Fig. 6b,c). These data reveal that the aCM2 cell state exists in the neonatal heart and is induced after P1 MI but not in non-regenerative P8 MI. Likewise, the C3ar1+ MPs are induced in regenerative P1 heart but not in P8 heart.
Fig. 3 ∣. aCM2 is induced by injury in the neonatal heart and co-localizes with C3-expressing CFs and C3ar1-expressing MPs.
a, scRNA-seq data of P1 Sham and MI and P8 Sham and MI from Cui et al.34 identify five CM populations. Transcriptome-wide correlation indicates that aCM2 is most like CM4. b, Unbiased label transfer predicts that 80% of aCM2 is CM4-like, with the remaining CM5-like. c, Median expression of CM1–CM5 signature genes shows aCM2 having the greatest similarity to CM4. d, Proportion of aCM2-like CMs in P1 Sham/MI and P8 Sham/MI. e, aCM1, aCM2, C3+ CF and C3ar1+ MP scoring based on ST gene expression at 3 d or 7 d after P1 Sham and MI (data adapted from Cui et al.36). aCM2, C3+ CF and C3ar1+ MP scores are increased near the injury region after MI. f, YAP target gene scores are increased near the injury region. g,h, aCM2, but not aCM1, significantly co-localizes with C3+ CF and C3ar1+ MP in post-MI hearts. i,j, Compared to aCM1, aCM2 co-localization with high YAP target gene expression spots is high and sharply increased after MI. C-loc., co-localization; expr., expression.
Using available ST data after neonatal sham or MI36 and marker genes to score spots with aCM1, aCM2, C3+ CF and C3ar1+ MP scores, we found in P1 sham hearts 3 d after (P1 Sham D3) that aCM1 was enriched in mid-myocardium, with more aCM2 in subendocardium, similar to adult controls (Fig. 3e and Extended Data Fig. 6d). In P1 Sham D7, the aCM1 cell state became more prominent, consistent with myocardial maturation. In 3d after MI and 7 d after MI (P1 MI D3 and P1 MI D7) hearts, aCM1 diminished and aCM2 cell state was induced in peri-infarct microenvironment (Fig. 3e). Likewise, C3+ CF and C3ar1+ MP cell states were increased in the peri-infarct microenvironment in P1 MI D3 and P1 MI D7 hearts (Fig. 3e). Cell state changes were more pronounced in the P1 MI D3 hearts. YAP target gene score increased in peri-infarct microenvironment of P1 MI D3 and P1 MI D7 hearts, supporting a role for YAP activation in CMs for assembly of the cellular triad (Fig. 3f).
We measured aCM1 or aCM2 co-localization probability with C3+ CF and C3ar1+ MP and found aCM2, C3+ CF and C3ar1+ MP co-localization in P1 MI D3 and P1 MI D7 in peri-infarct microenvironment (Fig. 3g). In contrast, aCM1 did not co-localize with C3+ CFs or C3ar1+ MPs. The fraction of spots satisfying stringent co-localization criteria was more than 10% in P1 MI D3 and was reduced to 3% in P1 MI D7 as cardiac healing progressed (Fig. 3h). In shams, cellular triad co-localization failed to be detected, indicating that cellular triad assembly is induced by MI. Likewise, YAP activity is induced in aCM2 spots after MI, supporting the conclusion that YAP functions in CMs to induce peri-infarct triad co-localization. YAP activity is broader at D3 and reduced at D7 after MI as cardiac healing progresses. Co-localization probability of aCM2 with spots of high YAP activity was also significant in peri-infarct microenvironment, with up to 15% of spots co-localized in P1 MI D3 (Fig. 3i,j). We conclude that aCM2, expressing YAP target genes, C3+ CFs and C3ar1+ MPs, co-localizes in neonatal cardiac renewal after MI.
aCM2 and fibroblast to macrophage signaling in YAP5SA hearts
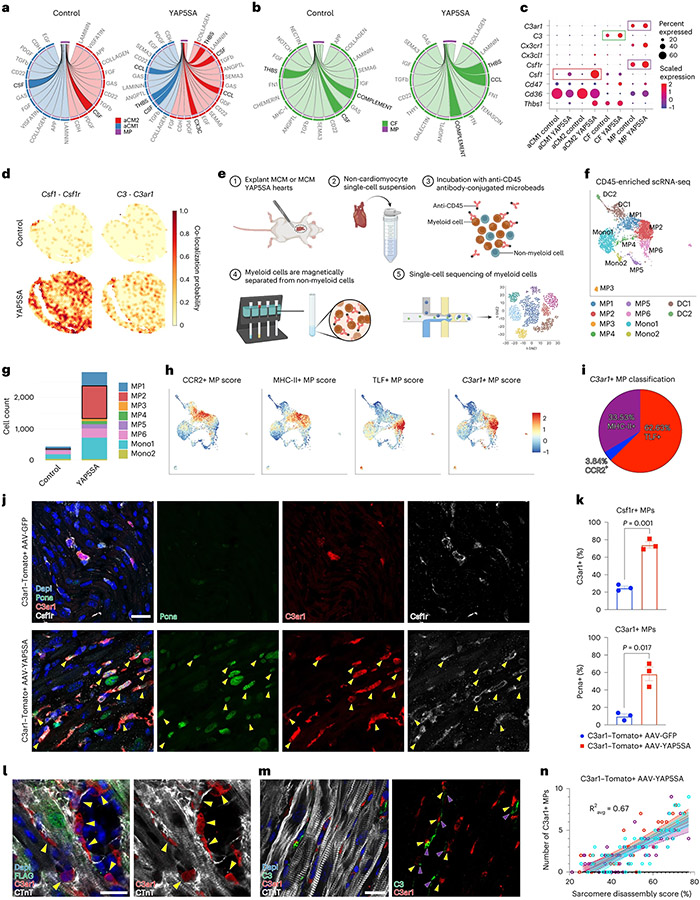
Using ligand–receptor analysis, we focused on signals from CMs and CFs to receiving MPs in control and YAP5SA hearts. In YAP5SA hearts, increased outgoing signals from aCM2 to MPs include chemokine (CX3C and CCL), thrombospondin (THBS) and colony-stimulating factor (CSF) (Fig. 4a). Signaling from CFs to MPs in YAP5SA hearts was enriched for complement, CCL and THBS signaling (Fig. 4b). Expression of ligand–receptor pair genes for each signaling pathway revealed that the complement ligand gene C3 was restricted to CFs and was increased in YAP5SA hearts. The complement receptor gene C3ar1 was restricted to MPs, and C3ar1 expression was increased in MPs in YAP5SA hearts (Fig. 4c).
Fig. 4 ∣. Signaling among CMs, CFs and MPs in YAP5SA hearts.
a, aCM1 and aCM2 to MP ligand–receptor analysis reveals increased THBS, CSF and chemokine (CCL and CX3C) signaling in YAP5SA compared to control hearts. b, CF to MP ligand–receptor analysis shows increased complement and THBS signaling in YAP5SA compared to control hearts. c, Ligand and receptor gene expression for significantly affected pathways in YAP5SA hearts versus control hearts in indicated cell types. Complement signaling genes (C3 from CFs to C3ar1 from MPs) and CSF signaling genes (Csf1 from CMs to Csf1r from MPs) are highlighted. d, Spatial co-localization probabilities of ligand–receptor gene pairs (Csf1–Csf1r and C3–C3ar1) are increased in YAP5SA compared to controls. e, scRNA-seq strategy via CD45 enrichment. f, scRNA-seq of CD45-enriched cells reveals 10 cardiac myeloid populations, including six macrophage (MP1–6), two monocyte (Mono1–2) and two dendritic cell (DC1–2) clusters. g, MP2s are the most highly increased in total number in YAP5SA hearts. h, CCR2+, MHC-II+ and TLF+ MPs (as defined in Dick et al.37) compared to C3ar1+ MPs. i, Most C3ar1+ MPs are tissue-resident TLF+ MPs. j, C3ar1 reporter mice (C3ar1-Tomato38) injected with AAV-YAP5SA show an increased number of proliferating C3ar1+ MPs (yellow arrowheads, Pcna+, C3ar1+ and Csf1r+) compared to AAV-GFP controls. k, C3ar1+Csf1r+ MPs in AAV-YAP5SA (74.26%) compared to AAV-GFP (25.09%) injected controls. Pcna+C3ar1+ MPs in AAV-YAP5SA (58.41%) versus AAV-GFP (9.84%). n = 3, Welch’s two-sided t-test. l, C3ar1+ MPs envelop de-differentiated, YAP5SA-induced CMs (FLAG+ CMs with disorganized CTnT). m, C3+ (purple arrowheads) and C3ar1+ (yellow arrowheads) cells are co-localized near CMs with disassembled sarcomeres. n, Sarcomere disassembly score and number of neighboring C3ar1+ MPs positively correlate in YAP5SA hearts (n = 3, Ravg = 0.67). Average correlation coefficient was calculated using Fisher’s z-transform. Scale, 20 μm for all images. Error bars indicate means ± s.e.m. Error bands represent 95% confidence intervals.
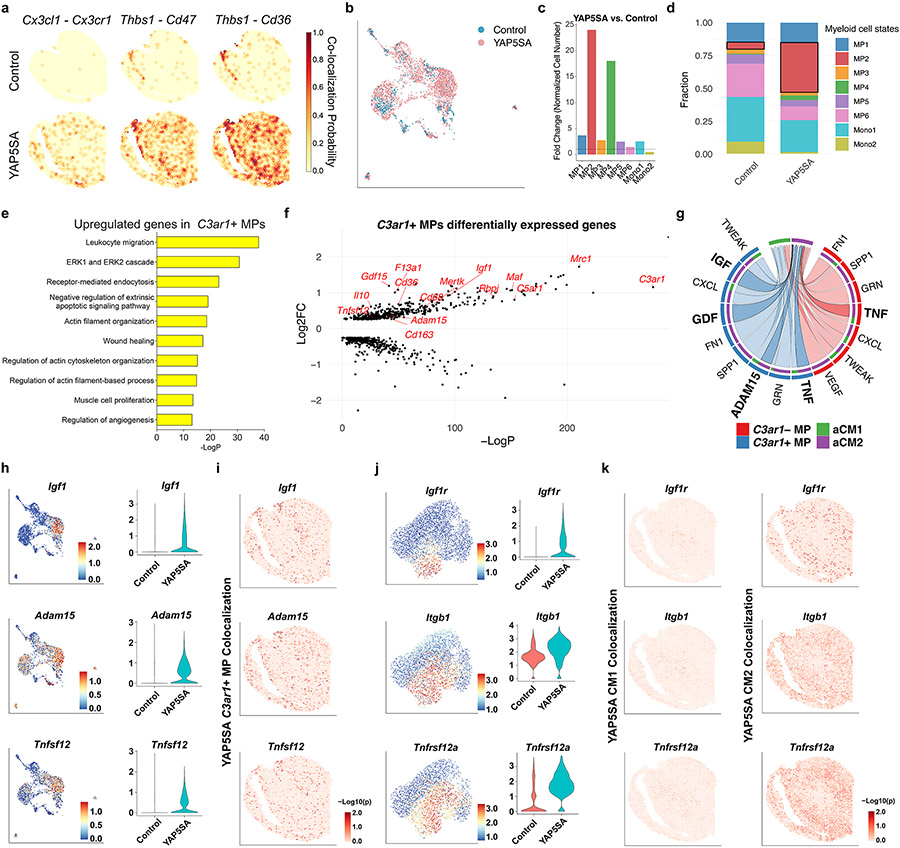
Csf1 was expressed by YAP5SA aCM2 and was lowly expressed in control aCM2; the receptor gene Csf1r was expressed in control MPs, and its expression was increased in MPs in YAP5SA hearts, suggesting that Csf1 signaling from YAP5SA aCM2 induces MP expansion in YAP5SA hearts (Fig. 4c). Expression of the selected ligand–receptor pair genes (CX3C: Cx3cl1 to Cx3cr1; CSF: Csf1 to Csf1r; THBS: Thbs1 to Cd47 and Cd36; complement C3: C3 to C3ar1) showed an increased probability of co-localization in YAP5SA hearts (Fig. 4d and Extended Data Fig. 7a). Together, the ligand–receptor analysis supports the conclusion that YAP5SA aCM2 and C3+ CF signal to C3ar1+ MPs within the cellular triad.
Cardiac-resident MPs signal to CMs in YAP5SA hearts
To further investigate C3ar1+ MPs, we performed scRNA-seq on CD45-enriched cells in control and YAP5SA hearts and identified 10 subclusters, including six macrophage, two monocyte and two dendritic cell (Fig. 4e,f and Extended Data Fig. 7b). Of eight myeloid cell states, MP2 was enriched in YAP5SA in both cell count and fraction (Fig. 4g and Extended Data Fig. 7c,d). The C3ar1+ MPs clustered within the YAP5SA-enriched MP2 population (Fig. 4f,h).
C3ar1+ MPs had anti-inflammatory and reparative signatures, similar to M2-polarized RMPs. We used marker genes for CCR2+, MHC-II+ and TLF+ classes of RMPs identified by Dick et al.37 and found that C3ar1+ MPs are primarily reparative, tissue-resident TLF+ RMPs (Fig. 4h,i). We used a C3ar1 reporter mouse line (C3ar1-Tomato38) and injected either AA9-CTnT-GFP (AAV-GFP) or AAV9-CTnT-YAP5SA (AAV-YAP5SA) virus in P8 mice and examined C3ar1 expression. AAV-YAP5SA-injected mice showed an increase of C3ar1+ MPs compared to controls (Fig. 4j,k). Proliferating C3ar1+ MPs increased to more than 50% in AAV-YAP5SA hearts (Fig. 4k), supporting our conclusion that C3ar1+ MPs expand locally in YAP5SA hearts.
GO analysis of differentially expressed genes between C3ar1+ MPs and C3ar1− MPs revealed terms associated with actin filament organization, muscle proliferation, wound healing, angiogenesis and anti-apoptosis (Extended Data Fig. 7e). Moreover, C3ar1+ MPs express markers of reparative RMPs (Mertk, Mrc1, Il10, Maf, Cd163, Cd68and Cd36), cardiac proliferation (Igf1), angiogenesis (Tnfsf12) and ECM degradation (Adam15), suggesting that C3ar1+ MPs modulate the local ECM and signal to aCM2s to enhance proliferative and injury responses (Extended Data Fig. 7f and Supplementary Table 8).
Ligand–receptor analysis to discover outgoing signals from C3ar1+ MPs to aCM2 revealed enriched TNF, ADAM15, GDF and IGF signaling from C3ar1+ MPs to aCM2 compared to aCM1 (Extended Data Fig. 7g). Genes encoding ligands (Igf1, Adam15 and Tnfsf12) were specifically expressed in C3ar1+ MPs from YAP5SA hearts, and spots expressing Igf1, Adam15 and Tnfsf12 were co-localized with C3ar1+ MP spots in YAP5SA ST data (Extended Data Fig. 7h,i). Similarly, spots expressing receptor genes (Igf1r, Itgb1 and Tnfrsf12a), which are increased in YAP5SA aCM2, were co-localized with aCM2 but not aCM1 spots (Extended Data Fig. 7j,k). Our data support the conclusion that C3ar1+ MPs are RMPs and signal via Igf1, Adam15 and Tnfsf12 to aCM2 and via Adam15 to ECM.
In AAV-YAP5SA hearts, C3ar1+ MPs and C3+ CFs frequently surrounded YAP5SA CMs with sarcomere disassembly (Fig. 4l,m). We calculated the correlation between CM sarcomere disassembly score (Methods) and the number of surrounding C3ar1+ MPs in AAV-YAP5SA-injected hearts and found that greater disassembly correlated with more co-localizing C3ar1+ MPs (; Fig. 4n), further validating co-localization of cellular triad in the pro-renewal microenvironment.
Loss of C3 inhibits YAP5SA CM disassembly and proliferation
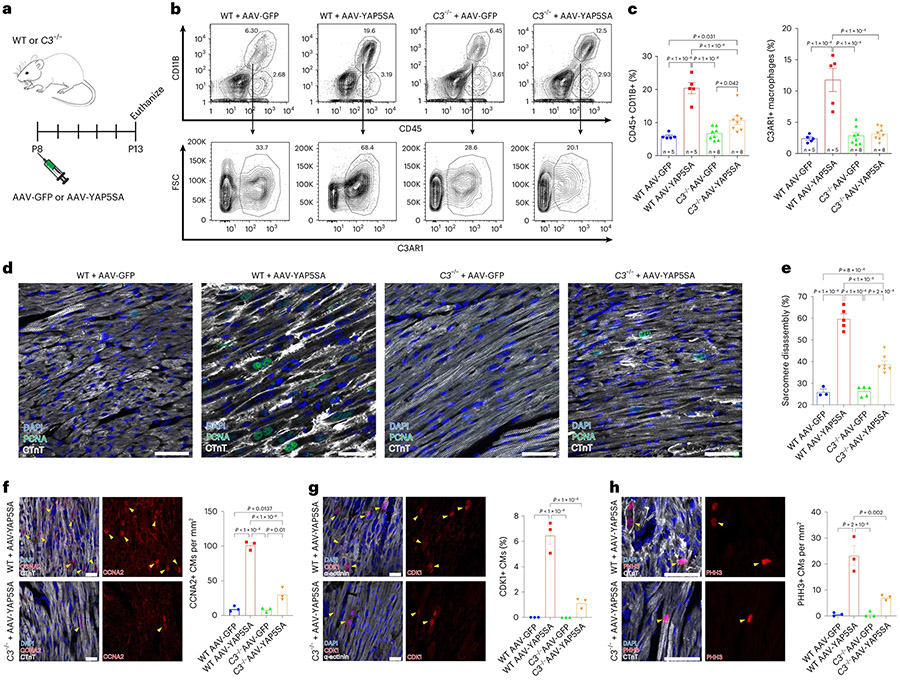
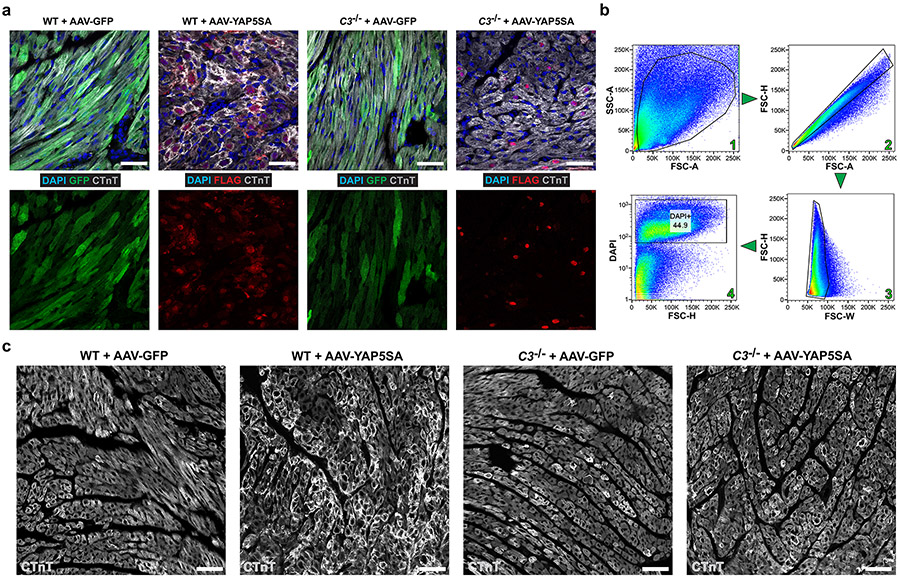
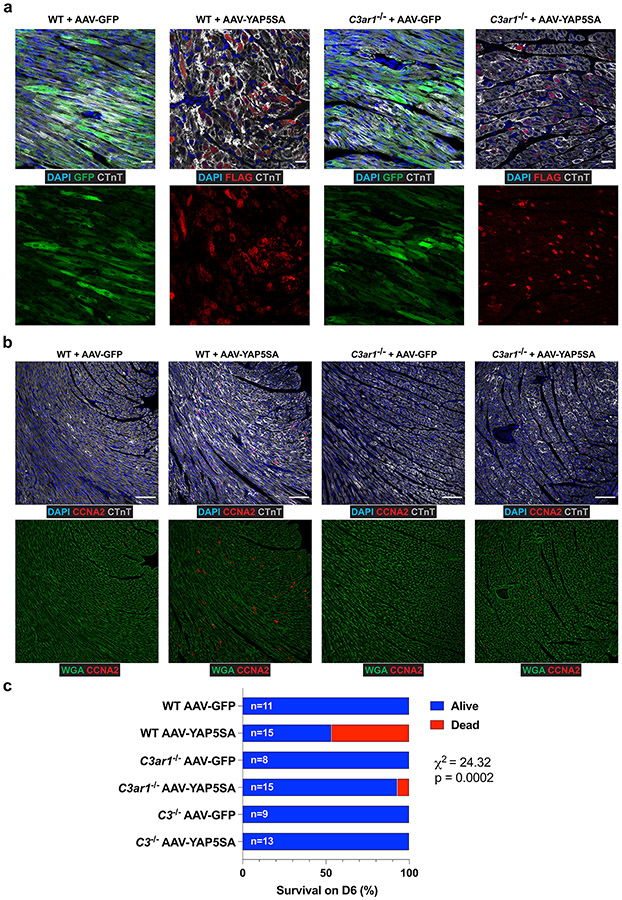
To study C3+ CFs during CM renewal, we injected P8 wild-type (WT) or C3−/− mice with AA9-GFP or AAV9-YAP5SA (Fig. 5a). GFP and YAP5SA expression levels were similar in WT and C3−/− hearts injected with AAV-GFP or AAV-YAP5SA (Extended Data Fig. 8a). Flow cytometry sorting of non-CMs (Extended Data Fig. 8b) revealed that CD45+ and CD11B+ MPs increased by more than three-fold in WT + AAV-YAP5SA hearts compared to WT + AAV-GFP hearts, whereas, in C3−/− + AAV-YAP5SA hearts, MPs increased by less than two-fold of AAV-GFP hearts (Fig. 5b,c). In WT + AAV-5SA hearts, C3ar1+ MPs composed 12% of non-CMs (Fig. 5b,c), whereas, in C3−/− + AAV-5SA hearts, C3ar1+ MPs remained at the baseline 2–3% of non-CMs (Fig. 5b,c), showing that C3 loss of function prevents C3ar1+ MP expansion.
Fig. 5 ∣. C3 loss of function in AAV-YAP5SA mice leads to decreased cell cycle progression.
a, P8-stage WT or C3−/− mice were injected with AAV-GFP or AAV-YAP5SA and killed at P13. b,c, Flow cytometry with quantification. In WT hearts, CD45+, CD11B + MP population increases in AAV-YAP5SA (n = 5) compared to AAV-GFP (n = 5) controls. In C3−/− + AAV-YAP5SA (n = 8) hearts, the MP increase was less than WT + AAV-YAP5SA. The increase in C3ar1+ MPs observed in WT + AAV-YAP5SA hearts is absent in C3−/− + AAV-YAP5SA hearts. d,e, IF and quantification of sarcomere disassembly in indicated hearts (n = 3 for WT + AAV-GFP, n = 5 for WT + AAV-YAP5SA, n = 5 for C3−/− + AAV-GFP and n = 7 for C3−/− + AAV-YAP5SA). f–h, IF and quantification of cell cycle markers (n = 3 for each group). f, Decreased number of CCNA2 (S/G2 phase) positive CMs in C3−/− + AAV-YAP5SA compared to WT + AAV-YAP5SA. g, Reduced numbers of CDK1 (G2) positive CMs in C3−/− + AAV-YAP5SA compared to WT + AAV-YAP5SA. h, Decreased number of PHH3 (M phase) positive CMs in C3−/− + AAV-YAP5SA compared to WT + AAV-YAP5SA. Scale bars in all panels, 50 μm. Statistical significance was calculated using one-way ANOVA. Error bars indicate means ± s.e.m. FSC, forward scatter.
IF revealed less sarcomere disassembly in C3−/− + AAV-YAP5SA compared to WT + AAV-YAP5SA hearts (Fig. 5d,e and Extended Data Fig. 8c). Sarcomere disassembly score (Methods) was higher in WT + AAV-YAP5SA compared to C3−/− + AAV-YAP5SA (Fig. 5e), supporting the conclusion that C3 activity in CFs, with induction of C3ar1+ MPs, is required for YAP5SA CM sarcomere disassembly. Because sarcomere disassembly is thought to be a precursor to CM cell cycle progression8, we quantified CM cell cycle marker expression. CCNA2, an S to G2 phase marker, was decreased in C3−/− + AAV-YAP5SA compared to WT + AAV-YAP5SA hearts (Fig. 5f). CDK1, G2-phase marker, and pHH3, M-phase marker, were decreased in C3−/− + AAV-YAP5SA compared to WT + AAV-YAP5SA hearts, indicating that C3 loss of function results in reduced YAP5SA CM cell cycle progression (Fig. 5g,h).
C3ar1 is required for CM disassembly and proliferation
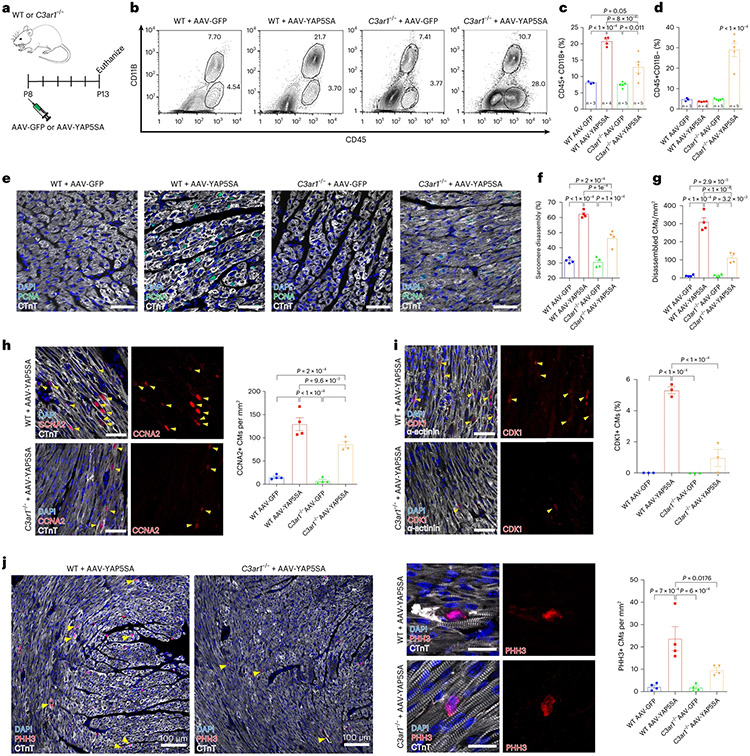
P8 WT or C3ar1−/− mice were injected with AAV-GFP or AAV-YAP5SA and killed at P13 (Fig. 6a). GFP and YAP5SA expression levels were similar in WT and C3ar1−/− hearts (Extended Data Fig. 9a). Similar to what we observed in C3−/− hearts, flow cytometry revealed a three-fold increase in MPs in WT + AAV-YAP5SA hearts compared to WT + AAV-GFP hearts (Fig. 6b,c), whereas the increase in MPs was reduced in C3ar1−/− + AAV-YAP5SA hearts compared to C3ar1−/− + AAV-GFP hearts (12.8% versus 7.6%, P = 0.01; Fig. 6b,c). IF revealed less sarcomere disassembly in C3ar1−/− + AAV-YAP5SA compared to WT + AAV-YAP5SA hearts (Fig. 6e-g). Moreover, expression of S-phase marker CCNA2 was decreased as was G2-phase and M-phase markers CDK1 and pHH3 in C3ar1−/− + AAV-YAP5SA compared to WT + AAV-YAP5SA hearts, suggesting that loss of C3ar1 delays YAP5SA CM cell cycle progression (Fig. 6h-j and Extended Data Fig. 9b). We conclude that C3ar1+ MP deficiency reduces both sarcomere disassembly and cell cycle progression in YAP5SA CMs.
Fig. 6 ∣. Knockout of C3ar1 in AAV-YAP5SA-injected mice leads to decreased sarcomere disassembly and prolongation of cell cycle progression.
a, WT and C3ar1−/− P8 mice were injected with AAV-GFP or AAV-YAP5SA. Animals were killed at P13 for flow cytometry (b,c) or IF (e–j). b, Macrophage population (CD45+ and CD11B+) is increased three times in AAV-YAP5SA (n = 4) compared to WT (n = 3) or C3ar1−/− (n = 5) + AAV-GFP. In C3ar1−/− + AAV-YAP5SA (n = 5), the MP fraction was less than WT + AAV-YAP5SA; however, the lymphocyte fraction (CD45+ and CD11B−) was significantly increased compared to the other populations. c, Quantification reveals an increase in MPs in AAV-YAP5SA compared to AAV-GFP-injected hearts. The MP population is significantly decreased in C3ar1−/− + AAV-YAP5SA compared to WT + AAV-YAP5SA. d, Lymphocytes are significantly increased in C3ar1−/− + AAV-YAP5SA hearts compared to all other groups. e, IF shows extensive sarcomere disorganization in WT + AAV-YAP5SA hearts. Sarcomere disassembly is substantially reduced in C3ar1−/− + AAV-YAP5SA hearts compared to WT + AAV-YAP5SA. f, Quantification of sarcomere disassembly shows a significant decrease in C3ar1−/− + AAV-YAP5SA compared to WT + AAV-YAP5SA CMs (n = 4 for all groups). g, Disassembled CMs significantly decreased in C3ar1−/− + AAV-YAP5SA compared to WT + AAV-YAP5SA (n = 4 for all groups). h–j, Decreased CCNA2+ (h, n = 4 for all groups), CDK1+ (i, n = 3 for all groups) and PHH3+ (j, n = 4 for all groups) CMs in C3ar1−/− + AAV-YAP5SA compared to WT + AAV-YAP5SA. Scale bars, 50 μm (e,h,i) and 20 μm (j, right). Statistical significance was calculated using one-way ANOVA. Error bars indicate means ± s.e.m.
Mice expressing YAP5SA in CMs have reduced viability from more CMs11. Because both C3−/− and C3ar1−/− hearts expressing YAP5SA had less sarcomere disassembly and expression of CM cell cycle markers compared to WT hearts, we calculated survival rate on day 6 of mice injected with either AAV-GFP or AAV-YAP5SA. In the WT + AAV-YAP5SA group, 53.3% (8/15) survived, whereas 93.3% (14/15) and 100% (13/13) survived in the C3ar1−/− and C3−/− + AAV-YAP5SA groups, respectively, supporting the conclusion that C3 and C3ar1 loss of function disrupt the pro-renewal microenvironment (Extended Data Fig. 9c).
Loss of C3ar1 impairs neonatal cardiac renewal after injury
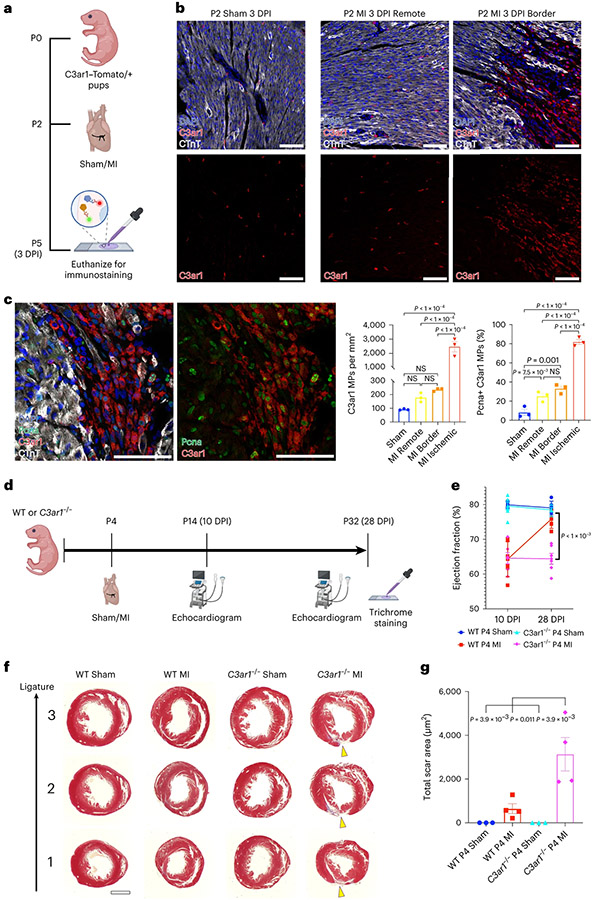
We performed sham or MI in C3ar1–Tomato/+ pups at P2 and collected hearts 3 d after MI (P2 sham/MI 3 days post injury (DPI); Fig. 7a). C3ar1+ MPs were enriched in IZ of P2 MI 3 DPI hearts compared to RZ or P2 sham 3 DPI hearts (Fig. 7b). IF for tdTomato, which labels C3ar1+ MPs, revealed a 10–20-fold increase in C3ar1+ MPs in IZ compared to other regions, and most C3ar1+ MPs were in cell cycle (Fig. 7c). To determine if C3ar1 function is required for neonatal cardiac renewal, we performed MI or sham in WT and C3ar1−/− neonatal mice at P4 regenerative stage and studied hearts at P14 (10 DPI) and P32 (28 DPI) (Fig. 7d). Histology at 28 DPI showed more fibrosis in C3ar1−/− MI hearts (Fig. 7f,g). Echocardiography (ECHO) at 10 DPI showed depressed ejection fraction (EF) in both MI groups, whereas, at 28 DPI, the EF of WT MI hearts recovered to sham levels while the EF of C3ar1−/− MI hearts remained depressed (Fig. 7e).
Fig. 7 ∣. Knockout of C3ar1 impairs neonatal cardiac renewal after MI.
a, Sham or MI surgery was performed in C3ar1–Tomato/+ reporter mice at P2 to determine if C3ar1+ MPs expand after injury. b, Marked increase of C3ar1+ MPs in the P2 MI IZ (lack of cTnT staining) compared to MI RZ and sham. Scale bars, 50 μm c, Representative images of tdTomato and Pcna IF in BZ and IZ of a 3 DPI heart. Scale bars, 50 μm. Quantification reveals increased C3ar1+ MPs in the P2 MI IZ compared to other indicated groups. Proliferating C3ar1+ MPs (Pcna+) is increased in all MI zones compared to sham (n = 3 all groups). d, Sham or MI surgeries were performed on P4 WT and C3ar1−/− pups. Echocardiograms were collected at 10 DPI and 28 DPI. Trichrome staining was performed at 28 DPI. e, ECHO at 10 DPI and 28 DPI. EF of WT hearts is decreased at 10 DPI compared to sham controls and recover to sham levels at 28 DPI. C3ar1−/− MI hearts have reduced EF at 10 DPI and 28 DPI compared to sham controls (n = 6 each group, P < 0.001, three-way ANOVA). f, Trichrome staining of representative sections below the permanent ligation (and similar locations in sham hearts). Scarred regions (yellow arrowheads). Scale bar, 1,000 μm g, Scar area quantification. Increased total scar area in C3ar1−/− MI hearts compared to all other groups (n = 3 for sham and n = 4 for MI groups). Statistical significance was calculated using one-way ANOVA unless stated otherwise. Error bars indicate means ± s.e.m. NS, not significant.
Loss of C3 results in altered fibroblast and CM metabolism
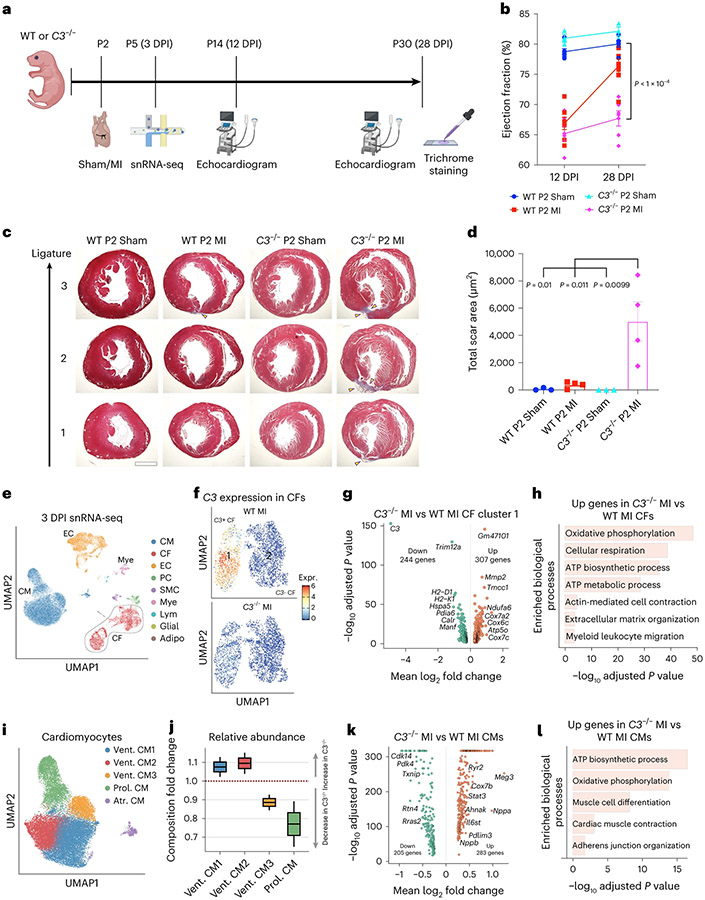
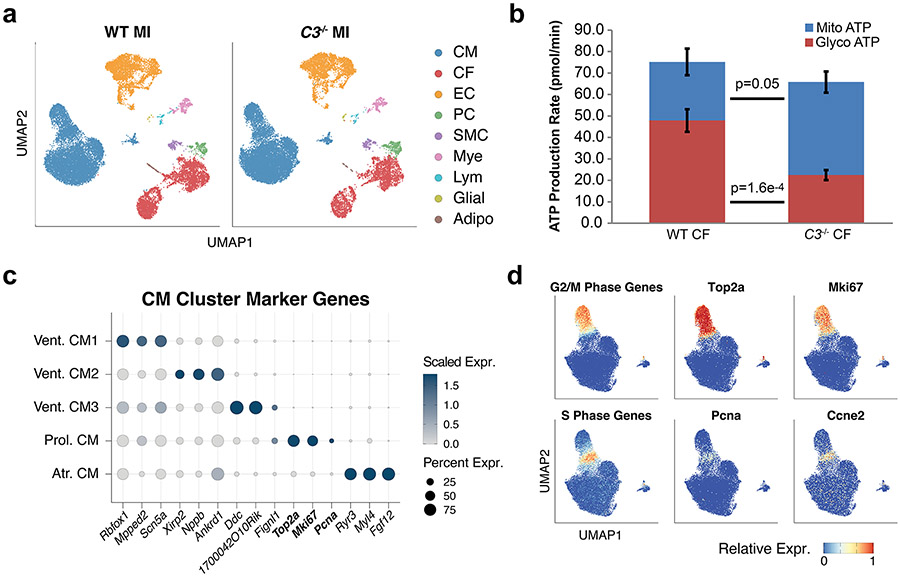
We performed P2 sham/MI in WT or C3ar1−/− pups to determine if C3 function is required for neonatal cardiac renewal and used snRNA-seq to investigate CF-specific C3 functions (Fig. 8a). At 28 DPI, WT + MI hearts showed efficient repair with little fibrosis, whereas C3−/− + MI hearts had failed repair and fibrosis (Fig. 8b-d). ECHO showed decreased EF in both WT + MI and C3−/− + MI at 12 DPI and recovery of cardiac function to sham levels for WT but not for C3−/− hearts at 28 DPI (Fig. 8c). Using snRNA-seq at 3 DPI in WT and C3−/− hearts after MI, we identified nine cell types, including CMs, ECs, CFs and myeloid (Mye) cells (Fig. 8e and Extended Data Fig. 10a). We subclustered the CFs and found a CF cluster (cluster 1) with high C3 expression in WT MI hearts, and C3 expression was abolished in C3−/− MI hearts (Fig. 8f). Comparison of gene expression between C3−/− and WT MI cluster 1 CFs revealed increased expression of oxidative metabolism genes (Atp5o, Cox7a2 and Ndufa6) and decreased expression of immune-regulatory genes (Trim12a, H2-D1 and H2-K1) in C3−/− CFs after MI, suggesting that C3−/− CFs fail to activate glycolysis after MI, as occurs in activated CFs (Fig. 8g,h and Supplementary Table 9)39. To investigate C3−/− CF metabolism, we performed Seahorse metabolic assay of primary CFs. Quantification of basal ATP production rate showed greater mitochondrial and reduced glycolytic ATP production in C3−/− CFs compared to WT CFs, indicating that C3−/− CFs had a more aerobic metabolic state (Extended Data Fig. 10b).
Fig. 8 ∣. Knockout of C3 alters metabolism-related transcription and reduces CM proliferation in the neonatal heart.
a, Experimental strategy. b, Echocardiograms show decreased EF in both WT + MI (n = 7) and C3−/− + MI (n = 6) compared to sham (n = 6 for WT and n = 3 for C3−/−) at 12 DPI, with recovery to levels similar to sham for WT but not for C3−/− hearts at 28 DPI (three-way ANOVA). c, Representative trichrome staining of three sections below the permanent ligation (and similar locations in sham hearts). Scarred regions (yellow arrowheads). Scale bar, 1,000 μm. d, Increased total scar area in C3−/− MI (n = 4) hearts compared to WT MI (n = 4) and both sham groups (n = 3). e, Integrated UMAP projection of WT and C3−/− MI 3 DPI snRNA-seq data (n = 2 each group) showing nine distinct cell types identified. f, Subclustering of CFs into cluster 1 (C3+) and cluster 2 (C3−). g, Differentially expressed genes between C3−/− MI versus WT MI CF cluster 1. h, GO analysis of upregulated genes in C3−/− MI CF cluster 1 shows categories related to oxidative phosphorylation, ECM organization and myeloid leukocyte migration. i, CMs subclustered into five populations: three ventricular (Vent. CM1, CM2 and CM3), a ventricular proliferative (Prol. CM) and an atrial (Atr. CM). j, In C3−/− MI hearts, Prol. CMs are substantially decreased compared to WT MI hearts. Statistical significance was determined by Pearson’s chi-squared test with continuity correction. k, Differentially expressed genes between all ventricular C3−/− MI CMs versus WT MI CMs. l, Comparison between C3−/− MI and WT MI CMs, excluding Atr. CM, showed upregulated genes related to metabolism and maturation, such as ‘Oxidative phosphorylation’, ‘Muscle cell differentiation’ and ‘Adherens junction organization’. Statistical significance was calculated using one-way ANOVA unless stated otherwise. Error bars indicate means ± s.e.m. Center lines in all box plots are shown as mean values, and whiskers extend to a maximum of 1.5× IQR beyond the boxes.
We found five subclusters of CMs (Fig. 8i): three ventricular CMs (Vent. CM1, CM2 and CM3); a proliferative population expressing Top2a, Mki67 and Pcna (Prol. CM; Extended Data Fig. 10c); and an atrial population (Atr. CM). G2/M and S phase marker genes are expressed by Prol. CM (Extended Data Fig. 10d). In C3−/− MI hearts, there was a decrease in abundance of Prol. CMs compared to WT MI (Fig. 8j). Comparison between C3−/− MI and WT MI CMs, excluding Atr. CM, showed upregulated genes related to ‘Oxidative phosphorylation’, ‘Muscle cell differentiation’ and ‘Adherens junction organization’ in C3−/− MI (Fig. 8k,l and Supplementary Table 10). These findings suggest that loss of C3-expressing CFs induces CMs to become more mature and less proliferative in the neonatal heart.
Discussion
Our data provide insight into the pro-renewal microenvironment of the mammalian heart. In YAP5SA adult and control neonatal hearts, spatial co-localization and signaling interplay among the cellular triad are essential to induce a pro-renewal myocardial niche. The YAP-induced cellular triad is found in the endogenous neonatal mouse heart but fails to assemble in the control adult mouse heart and human heart. We provide detailed insight into co-localized cells required to establish the pro-renewal niche and reveal that the YAP-driven aCM2 cell state on its own is insufficient to induce the pro-renewal niche. Our investigation revealed a pro-renewal function for complement system signaling between C3+ CFs and C3ar1+ MPs. In addition to signaling to C3ar1+ MPs, C3+ CFs concurrently provide anti-fibrotic signals to the microenvironment and a CF-intrinsic capacity to induce glycolytic metabolism after MI.
YAP activity in CMs establishes a pro-renewal niche
The YAP-driven aCM2 cell state is distinguished by fetal cytoskeletal and metabolic characteristics and expression of cytokines, including Csf1, which signal to surrounding cells11.
Sarcomere disassembly, observed in aCM2, was reported in CMs in other pro-renewal contexts, including Sav loss of function40, CMs overexpressing Erbb2 or Yamanaka factors12,41. Likewise, reduced lipid utilization, also a characteristic of aCM2, promotes CM renewal13.
In adult hearts, YAP activity is limiting in aCM1, which has mature sarcomeres and undergoes oxidative metabolism. One reason for failure to induce the cellular triad is that, in control hearts, C3+ CFs and C3ar1+ MPs express high levels of Complement Factor H, which inhibits C3 convertase and prevents complement pathway activation42. Notably, Cfh is strongly reduced in YAP5SA hearts. Moreover, aCM2 in the control heart expresses low levels of Csf1 as compared to aCM2 from YAP5SA hearts, suggesting another mechanism for failure to induce C3ar1+ MPs in control non-renewing hearts. Together, our data support the conclusion that localized complement signaling between C3+ CFs and C3ar1+ MPs is required for pro-renewal activity in the adult and neonatal heart.
C3ar1-expressing MPs promote the pro-renewal niche
C3ar1+ MPs in YAP5SA hearts expressed genes associated with migration, anti-apoptosis, muscle cell proliferation, wound healing and angiogenesis. Moreover, C3ar1+ MPs expressed RMP markers, including TLF, CCR2 and MHC-II (ref. 43). Ligand–receptor analysis combined with spatial co-localization suggest that C3ar1+ MPs signal to aCM2 through Igf1–Igf1r, Adam15–Itgb1 and Tnfsf12–Tnfrsf12a signaling pathways to promote aCM2 proliferation.
RMPs function in neonatal myocardial renewal and in adult myocardial homeostasis, including protective signaling to CMs and phagocytosis of damaged mitochondria43. We show that C3ar1+ RMPs enhance CM proliferation by expressing signals, including Tnfsf12 and Igf1, that induce CM proliferation44,45. Our data support the conclusion that aCM2s, which are poised for proliferation and express Igf1r, are induced to proliferate by Igf1 and Tweak expression from C3ar1+ RMPs. C3ar1+ MPs also express Adam15, which is a metalloproteinase that may facilitate CM release from ECM and allow mitotic rounding, sarcomere disassembly and CM division46.
C3-expressing fibroblasts promote the pro-renewal niche
Our C3 and C3ar1 inactivation studies reveal the importance of complement pathway signaling for a pro-renewal myocardial niche and implicate C3+ CFs and C3a signaling to MPs. CFs of neonatal C3−/− hearts failed to upregulate glycolytic genes after MI, suggesting a block in transition to become myofibroblasts. CMs in C3−/− hearts had an early shift to oxidative phosphorylation, suggesting accelerated CM maturation with fewer proliferative CMs compared to WT hearts. Previous work revealed that C5ar1 mediates a response to promote CM proliferation after injury, although it was concluded that C5ar1 was expressed by CMs rather than MPs47. Our findings suggest that signaling through C3ar1 induces RMP proliferation and adoption of a pro-renewal MP cell state.
Methods
Animal models
Mouse studies were performed in accordance with the National Institutes of Health Guide for the Care and Use of Laboratory Animals and the Institutional Animal Care and Use Committee at Baylor College of Medicine. The animals were housed with access to food and water ad libitum on a 12-h light/12-h dark cycle at 21 °C and 50–60% humidity.
The inducible mouse model of CM-specific YAP5SA overexpression (αMHC–MCM;YAP5SA) used in this study was previously described11. FLAG sequences are fused to the C-terminus of YAP5SA for detection by antibodies. CM-specific expression of Cre recombinase was induced by intraperitoneally administering tamoxifen (40 μg g−1) daily for 4 d in 8-week-old adult mice of both sexes. Littermate control mice (αMHC–MCM) treated with tamoxifen were used as controls. All mice were killed at 6 d after the first tamoxifen injection. Single-cell RNA sequencing (Drop-seq) and ST experiments were performed using these mice.
For scRNA-seq profiling of CD45-enriched cardiac immune cells, we used adult mice retro-orbitally injected with 1 × 10¹¹ viral particles of AAV9 vectors expressing GFP or YAP5SA driven by the cardiac-specific troponin T promoter (AAV-GFP or AAV-YAP5SA). The hearts were collected on the sixth day. AAV-GFP vector was obtained from Addgene (plasmid 105543). AAV-YAP5SA vector was obtained by replacing the GFP coding sequence of AAV-GFP with corresponding coding sequence of YAP5SA. These vectors were packaged by the Baylor College of Medicine Viral Core.
C3ar1−/− and C3−/− mice were obtained from The Jackson Laboratory (strains 005712 and 029661). WT C57BL/6 mice were used as controls. P8 WT, C3ar1−/− or C3−/− mice were subcutaneously injected with 1 × 10¹¹ viral particles of AAV-GFP or AAV-YAP5SA, and hearts were collected after 5 d. The C3ar1-TDTomato reporter mouse was previously described38 and was a gift from Hui Zheng of Baylor College of Medicine. We used the protocol described in Heallen et al.9 to perform P2 sham and MI surgeries on WT, C3−/− and C3ar1-TDTomato pups. For the C3ar1−/− strain, there was excessive lethality after P2 MI. Therefore, we opted to perform P4 sham/MI on WT and C3ar1−/− mice, which is technically easier to perform.
snRNA-seq was performed on WT and C3−/− P2 MI hearts at 3 DPI. ECHO (VisualSonics, Vevo 3100) was performed at P14 (10 DPI or 12 DPI) and at 28 DPI to assess cardiac function.
Histology and IF
Freshly dissected hearts were perfused with 20 mM KCl-PBS and then fixed overnight with 10% formalin or flash frozen. Histology and IF were performed on fixed, paraffin-embedded sections and optimal cutting temperature (OCT)-embedded frozen sections (Sakura, 4583). Standard section-processing protocols for immunostaining were used11. In brief, paraffin sections were deparaffinized and rehydrated through ethanol gradients, followed by H2O2 treatment, antigen retrieval with citrate buffer and permeabilization with 0.2% Triton-X PBS. Sections were blocked in 0.1% Tween PBS with 10% donkey serum before overnight incubation with primary antibodies and subsequent incubation with secondary antibodies. Frozen sections were washed in PBS, briefly fixed in 10% formalin, treated with H2O2 and permeabilized with 0.2% Triton-X PBS before blocking and primary/secondary antibody incubation. Primary antibodies used included C3 (1:200, Abcam, ab200999 and 1:200, Novus, NBP1-32080); C3ar1 (1:200, Novus, MAB10417-100); Tβ4 (1:200, Abcam, ab167650 and ab14335); CTnT-AF647 (1:200, BD Biosciences, 565744); PCNA (1:200, Santa Cruz Biotechnology, sc-56, AF488); CCNA2 (1:200, Abcam, ab32386); CDK1 (1:200, Abcam, ab18), vimentin (1:100, Abcam, ab194719); PHH3 (1:200, Cell Signaling Technology, 29237); FLAG (1:200, Cell Signaling Technology, 14793); α-SMA (1:200, Abcam, ab5694); Csf1r (1:200, Abcam, ab221684) and tdTomato (1:200, MyBioSource, 448092). Secondary antibodies included Alexa Fluor 488 (1:200, Thermo Fisher Scientific, A27034 and A28175), Alexa Fluor 568 (1:200, Thermo Fisher Scientific, A10036 and A11035) and Alexa Fluor 647 (1:200, Thermo Fisher Scientific, A31573). Cell membrane labeling was performed by using wheat germ agglutinin (WGA; 1:200, Vector Labs, RL-1022, and Thermo Fisher Scientific, W32466). DAPI (Thermo Fisher Scientific, 62248) was used as a nuclear counterstain.
For RNAscope assays, formalin-fixed, paraffin-embedded (FFPE) tissue samples on slides (5 μm thickness) were stained according to the manufacturer’s protocol (ACDBio). Nuclei were stained with DAPI; cell membranes were stained with WGA-AF488 (Thermo Fisher Scientific, W11261); and sarcomeres were stained with CTnT-AF647 (1:200, BD Biosciences, 565744). The probes used were Acta2 (ACDBio, 319531) and Lmcd1 (ACDBio, 484761). Transcripts were visualized using Opal 570 dye (Akoya Biosciences, FP1488001KT).
Trichrome staining was performed on FFPE tissue sections using the Masson’s Trichrome Kit, according to the manufacturer’s protocol (Sigma-Aldrich, HT15-1KT).
Sarcomere disassembly score
Sarcomere disassembly was quantified by using CTnT and WGA immunostaining. CTnT expression is localized at the membrane of cardiomyocytes undergoing de-differentiation. We used WGA to determine cell boundaries of individual cardiomyocytes and then created a binary mask for CTnT staining using the area selection tool in ImageJ. The percentage area devoid of CTnT staining was measured, which we refer to as the sarcomere disassembly score.
Flow cytometry
Mouse hearts were explanted and perfused with cold PBS (20 mM KCl). The hearts were then minced with a razor blade and digested using 30 ml of HBSS with type II collagenase (100 U μl−1; Worthington, LS004177) at 37 °C for 30 min. The samples were filtered through 40-μm strainers and then centrifuged at 500g for 10 min. Red blood cells in the pellet were lysed by ACK lysing buffer (Thermo Fisher Scientific, A1049201). The samples were then washed in 1% BSA/PBS and fixed in 4% paraformaldehyde for 10 min before being permeabilized using 0.1% saponin/PBS for 10 min and then incubated with conjugated primary antibodies, including CD45 (BioLegend, 103111), CD11B (BioLegend, 101207) and C3AR1 (BD Biosciences, 568276) for 30 min. Cell sorting was performed using a BD FACSAria III flow cytometer. Analysis was performed using FlowJo version 10 software.
Drop-seq
Three adult αMHC–MCM;YAP5SA mice and three adult αMHC–MCM control mice were used for scRNA-seq profiling, based on the Drop-seq method previously described48. Adult hearts were dissected, cannulated and dissociated into a single-cell suspension via collagenase digestion (Collagenase A, Roche) on a custom-built Langendorff apparatus as described previously11, with minor modifications. Hearts were cut into small pieces and digested in collagenase for 20 min with agitation. CM enrichment was performed by allowing CMs to settle by gravity for 5 min at room temperature after washes in a calcium-free Tyrode’s buffer. The supernatant containing non-CMs was put into a new tube and spun down at 700g, and the pellet containing CMs was washed and spun down at300 r.p.m. Finally, cells were combined and counted before being diluted and input into the Drop-seq rig. Dissociated cells were diluted to a concentration of 200 cells per microliter in PBS with 0.01% BSA. Then, using a custom microfluidics device, cells were co-encapsulated into nanoliter-sized droplets containing barcoded microparticles (ChemGenes, Macosko201110) and lysis buffer (FlowJEM). After droplet breakage, reverse transcription (Thermo Fisher Scientific) and exonuclease treatment (New England Biolabs), all cDNA was amplified by using PCR (KAPA), pooled and purified with AMPure XP beads (Beckman Coulter). The cDNA was then analyzed on a fragment analyzer (Advanced Analytical Technologies) for quality control, quantification and size determination. Library preparation was performed with the Illumina Nextera XT kit, and libraries were triple-purified with AMPure XP beads. The libraries were sequenced on an Illumina NextSeq 500 instrument.
scRNA-seq of CD45-enriched cardiac cells
Hearts from AAV-YAP5SA-injected adult mice (n = 3) and AAV-GFP-injected adult mice (n = 3) as controls were explanted and perfused with cold PBS (20 mM KCl). The hearts were then minced with a razor blade and digested using 30 ml of HBSS with type II collagenase (100 U μl−1; Worthington, LS004177) at 37 °C for 30 min. The samples were then filtered through 40-μm strainers and centrifuged at 500g for 10 min. Red blood cells in the pellet were lysed by ACK lysing buffer (Thermo Fisher Scientific, A1049201). The samples were suspended in 1% BSA/PBS, with dead cells removed by using a dead cell removal kit (Miltenyi Biotec, 130-052-301). Then, the samples were diluted to obtain 15,000–18,000 live cells for single-cell library construction according to the 10x single-cell gene expression workflow (10x Genomics, Chromium Next GEM Single Cell 3′ Kit version 3.1, 1000269). The libraries were sequenced on an Illumina NovaSeq 6000 instrument.
snRNA-seq
MI surgeries were performed on WT and C3−/− mice at P2 (n = 2 for each condition, four total mice) and collected for nuclei isolation at P5 (3 DPI). Nuclei were collected from the entire heart using a Chromium Nuclei Isolation Kit (10x Genomics, PN-1000493). In total, 15,000 nuclei per sample were loaded onto the 10x Genomics Chromium Controller to obtain the gel beads in emulsion. The sequencing libraries were then prepared according to the manufacturer’s protocols for the Single Cell 3′ Reagents Kit (10x Genomics, Chromium Next GEM Single Cell 3′ Kit version 3.1, 1000269). Sequencing was performed by using the NovaSeq 6000 instrument.
scRNA-seq and snRNA-seq quality control and filtering
After sequencing, Drop-seq data were processed according to published pipelines (https://mccarrolllab.org/dropseq/). Data generated on the 10x Genomics platforms were processed by using Cell Ranger version 7.0.0. All reads were aligned to the mm10 mouse reference genome. To remove background signals from ambient transcripts, the raw unique molecular identifier (UMI) count matrices were further processed by CellBender version 0.1.0 (ref. 49) (cellbender remove-background) with –total-droplets-included = 25,000, –low-count-threshold = 15 and –epochs = 200. To minimize the loss of valid cell barcodes called by Cell Ranger, we also set expected-cells at 1.5 times of Cell Ranger output nuclei number. The output matrices from CellBender were filtered to include only valid cell barcodes that were also identified by Cell Ranger. This allowed for the removal of ambient RNA background molecules and random barcode swapping from (raw) scRNA-seq gene-by-cell-count matrices. To minimize the loss of valid cell barcodes called by Cell Ranger, we also set –expected-cells for CellBender at 1.5 times of Cell Ranger output nuclei number. The output matrices from CellBender were filtered to include only valid cell barcodes that were also identified by Cell Ranger. Additional quality controls at single-nucleus level were performed for each library. In brief, we first identified low-quality nuclei based on fixed cutoffs of UMI count per nucleus > 200, gene count per nucleus > 150 and mitochondria gene-derived UMI < 5%. Then, a set of cutoffs based on per-library data distribution was calculated, which is essential to account for heterogeneity between samples. In brief, for each library, an upper bound and a lower bound were set at the 75th percentile plus 1.5 times the interquartile range (IQR) and the 25th percentile minus 1.5 times the IQR, respectively, for UMI count and gene count per nuclei. Cells or nuclei outside of the upper and lower bounds were removed from the datasets. Next, the remaining cells or nuclei were evaluated by the Scrublet tool to identify potential doublets, with parameters expected_doublet_rate = 0.1 and call_doublets threshold = 0.25. Seurat toolkit version 4.0 (ref. 50) in R version 4.1 was used to perform downstream analyses. The UMI count matrices of cells that passed previous filtering were normalized by using the Seurat function SCTransform, regressing out unwanted sources of variation (UMI count, mitochondrial % and cell cycle scoring). For each sequenced library, we calculated the top 5,000 most variable features for dimensional reduction and graph-based clustering.
Batch alignment
To find anchors across subsets, also known as mutual nearest neighbors, we used the Seurat function FindIntegrationAnchors. Integration was performed by using canonical correlation analysis (CCA)50 implemented in Seurat by using the IntegrateData function. In brief, the algorithm first jointly reduces the dimensionality of both datasets by using diagonalized CCA and then applies L2 normalization to the canonical correlation vectors. Finally, it searches for mutual nearest neighbors in this shared low-dimensional representation. Ultimately, an integrated matrix is constructed for each cell by applying a correction vector that is based on anchor score and similarity score50. For CD45+ scRNA-seq and C3−/− snRNA-seq, we used the algorithm ‘Harmony’, which allows for accurate integration of single-cell sequencing data by projecting cells into a shared embedding by grouping cell types51.
Principal component analysis and unsupervised clustering
The resulting integrated data were scaled, and principal component analysis was performed to reduce the dimension into 100 principal components (PCs). Clusters were identified by using k-nearest neighbor graph-based clustering implemented in Seurat as FindNeighbors and FindClusters. A grid search of different combinations of parameters was performed to optimize the biologic relevance of the resulting clusters. The final clustering was based on the top 40 PCs, with a resolution of 0.8. For CD45+ scRNA-seq and C3−/− snRNA-seq, we used the top 25 PCs, with optimized resolutions between 0.2 and 1.0. The optimal resolutions were determined by clear separation in the UMAP dimensions, robust identification of more than 30 significantly differentially expressed genes across subclusters as well as >0.8 AUCmin determined by the Single-Cell Clustering Assessment Framework (SCCAF).
GO and pathway enrichment analysis
GO and pathway analysis were performed using clusterProfiler52. We extracted enriched GO terms in the biological process category. MSigDB enrichment, Pathway enrichment and the related gene network were determined by the MSigDB Database and the KEGG Pathway Database, respectively, by using the clusterProfiler package in R. All enriched terms and pathways were filtered at a threshold of FDR (Benjamini–Hochberg correction) < 0.05.
Cell–cell interactions
A systematic analysis of cell communication was based on the network analysis and pattern recognition approaches provided by the CellChat version 1.5.0 R package53. The standard workflow was used to predict major signaling inputs and outputs of cells and how these cells and signals coordinate with each other for functions. Subsequently, signaling pathways were classified, and conserved and context-specific pathways were depicted between control and YAP5SA hearts. To examine interactions between subpopulations of cells expressing specific genes, we calculated the signaling interactions between cells expressing or cells not expressing the specified gene and another cell type.
CM trajectory and pseudotime inference
Inference of pseudo-temporal trajectories within the CM population was performed using Slingshot R package version 2.8.0 (ref. 21). Slingshot trajectory was calculated based on the top 50 harmonized PCs. The inferred trajectory was visualized on CM subcluster UMAP as an arrowed curve. Trajectory-coupled pseudotime was inferred and visualized on the UMAP. A beeswarm plot was generated by ordering aCM1 and aCM2 cells on the trajectory based on their respective pseudotime.
Temporal gene module identification
Normalized gene expression matrices were used for clustering co-expressed gene modules. We first created a similarity matrix by computing pairwise Pearson correlation between gene expression and Slingshot pseudotime. To set a stringent significance threshold for defining pseudotime-correlated gene modules, we computed the z-scores of all Pearson’s correlation coefficients of each gene and excluded genes that have a z-score lower than 2 from the modules. The expression values of the remaining 62 genes were overlayed on top of the respective pseudo-temporal trajectories and annotated into aCM1-to-aCM2 transition gene module.
Spatial RNA sequencing
Frozen tissue sections from control (αMHC–MCM) and YAP5SA (αMHC–MCM;YAP5SA) hearts were mounted on 10x Visium slide capture areas (n = 1 for each genotype), each with 5,000 barcoded RNA capture spots. Hematoxylin and eosin (H&E)-stained images of whole tissue sections were obtained by using BioTek Cytation 5 with image stitching. Optimal permeabilization time for the release of mRNA from 10-μm-thick tissue sections for both genotypes was 12 min, determined by using a Visium Tissue Optimization Kit. Spatially barcoded cDNA libraries were generated from mRNA released from each tissue section by using a Visium Spatial Gene Expression Reagent Kit, before being sequenced on the Illumina NovaSeq 6000 with 150-cycle paired-end setting (read 1 = 28 cycles, read 2 = 90 cycles, index 1 = 10 cycles, index 2 = 10 cycles). H&E images were manually aligned to spots selected by Loupe Browser version 4.0.0 (10x Genomics). The Space Ranger version 1.0.0 pipeline (10x Genomics) was then used to generate feature-spot matrices from the sequencing data aligned to the mm10 mouse reference genome.
Spatial transcriptomics quality control and filtering
Spatial transcriptomic data were integrated using the Seurat workflow as described above. Seurat toolkit version 4.0 in R version 4.1 was used to perform integration, quality control and downstream analysis. Spots were filtered for UMI counts (5,000 < UMI count < 30,000), genes (number of genes > 500) and mitochondrial genes (mitochondrial % < 40%). The UMI count matrices of cells that passed previous filtering were normalized by using the Seurat function SCTransform to regress out unwanted sources of variation (mitochondrial % and cell cycle scoring).
Spatial niche identification
ST spots were clustered based on the similarity of transcriptome based on the same principle used in scRNA-seq analysis25,54. To minimize noise, the top 3,000 highly variable features were calculated in the integrated data and used in subsequent clustering. Spots from the control slide and the YAP5SA slide were clustered separately. In brief, we reduced the normalized expression matrix of each slide into 50 PC dimensions and generated a shared nearest neighbor graph. Using an optimized resolution = 0.5, we identified seven robust spatial clusters on each slide.
Deconvolution of spots
To estimate the cell type composition of each spot, we leveraged the scRNA-seq to deconvolve Visium ST spots by using Spotlight version 1.0 (ref. 55) by NMFreg. To train the model, we provided the top 20 markers per cell type in 500 cells per cell type and a minimum contribution of 1% to the mixture. The final result was a matrix with the coefficients of the spatial mixtures of all cell types per spot.
aCM1, aCM2, C3ar1+ MPs, C3+ CFs and Yap target scoring
We used Seurat’s AddModuleScore function provided by the Seurat suite to score each cell or spot for the expression of genes in a given gene set. AddModuleScore is an implementation of Tirosh et al.’s gene set scoring approach56. In each spot, this function computes a score equal to the mean expression of genes in the given gene set, subtracted by the average expression of genes in a background gene set. For each gene, the method randomly selects 100 background genes with similar average expressions (computed over all spots).
For our analyses, genes differentially and specifically expressed in aCM1 (Atp5j, Cox6b1, Atp5g1, Chchd10, Atp5c1, Cox7b, Ndufb10, Mpc2, Sdhb, Uqcrb, Ndufv2, Etfa, Acadm, Ckmt2, Mgst3, Cox7a1, Mrpl42, Eci1, Phyh and Fabp3-ps1), aCM2 (Flnc, Sorbs2, Itga7, Ahnak, Tgm2, Prnp, Tns1, Ddb1, Eef2, Rtn4, Serpinh1, Ccn2, Jam2, Rras2, Cavin1, Lmcd1, Rock2, Acta2 and Parm1), C3ar1+ MP (C3ar1, Cx3cr1, C5ar1, Rbpj, F13a1 and Mrc1) and C3+ CF (C3, Fstl1, Serpina3n, Cxcl14 and Serping1) were used to score the spots. Yap target score was calculated based on the 302 Yap1 target genes identified in Monroe et al.11. A similar scoring strategy was employed in scRNA-seq and snRNA-seq analyses.
Spatial co-localization analysis
We used a two-step approach to test for spatial co-localization between multiple gene sets, where each gene set represents markers of a cell state or genes targeted by Yap.
First, for each gene set, we computed a P value for its score at every spot. To this end, we confirmed that each gene set’s score distribution in the current study follows a normal distribution. Subsequently, for every gene set, we transformed its scores into z-scores and used those to calculate P values per spot.
In the second step, we used these per-spot P values to test if multiple gene sets co-localize at a given spot. For this purpose, there are several classical approaches that would ‘combine’ the P values of the gene sets under consideration57. However, a common concern in this field is how to combine high (not significant) and low (significant) P values. Given the absence of gold standard ST data with known co-localization signals, the most suitable approach for combining P values in ST data is as yet unclear. Thus, we chose to remain conservative, and, at every spot, we combine the P values as:
where is the maximum P value of all gene sets under consideration.
Ligand–receptor co-localization analysis
To account for potential paracrine signaling that is transmitted across several adjacent spots, we performed co-localization of ligand–receptor gene pairs using a window-based approach (central spot plus nearest four spots). The co-localization of ligand–receptor gene pairs was calculated per spot by determining the intersection of two sets denoted by Gene A and Gene B (Gene A ∩ Gene B) in a window of central spot plus nearest four spots. Co-localization was also calculated across all spots to detail the overall tissue co-localization of gene pairs. An odds ratio was calculated to determine the likelihood of genes or gene pairs co-localizing in a spatial transcriptomic area of spots. The maximum likelihood ratio chi-square test was performed to test whether the odds ratio was statistically significant (P < 0.05).
Reanalysis of neonatal mouse ST, snRNA-seq and scRNA-seq data
We obtained neonatal mouse ST data from the Gene Expression Omnibus (GEO) repository under accession number GSE163631. The raw UMI count matrices were normalized using the SCTransform function provided by Seurat version 4.1. During the normalization process, per-spot UMI count and feature count were regressed out. All subsequent analyses were performed using the SCTransform-normalized expression matrices.
For the neonatal mouse scRNA-seq data, we downloaded the processed data from GSE153481 and used them directly without any additional modifications. We defined C3+ cells as cells exhibiting a normalized expression value greater than 0 for the C3 gene, and, similarly, C3ar1+ cells were defined as cells with a normalized expression value greater than 0 for the C3ar1 gene.
We obtained the neonatal mouse snRNA-seq data from GSE130699. The downloaded matrices were pre-filtered and normalized, allowing us to proceed with clustering without any further processing. To reproduce the CM1–5 clusters from the original publication, we employed the Seurat Integration workflow with provided parameters. Non-CMs were removed from the data, and then 30 PCs were computed. From these PCs, we retained the top 15 dimensions, which were further reduced to generate UMAP embeddings. Graph-based clustering was performed using the 15 PCs with a resolution of 0.8.
Comparison of aCM2 and neonatal CMs snRNA-seq data
To assess the transcriptomic similarity between neonatal CMs (Cui et al.36) and aCM2, we used two independent strategies:
Coordinate mapping based on Pearson’s correlation coefficient. In this approach, we generated a similarity matrix by calculating the correlation between each nucleus of aCM2 and each nucleus of neonatal CMs. To perform this calculation, we selected the top 2,000 highly variable genes from the neonatal dataset. Next, for each aCM2 cell, we determined the center (mean) position of the top 20 most correlated neonatal CMs based on their UMAP embedding. This center position represented the ‘mapped’ position of the aCM2 cell. By overlaying the mapped aCM2 cells onto the neonatal CM UMAP, we visualized their distribution. Notably, most aCM2 cells were mapped in close proximity to the neonatal CM4 cluster.
Seurat label transfer. In this strategy, we employed the Seurat label-transferring approach. Initially, we used the neonatal CM data as a reference and applied the FindTransferAnchors function to identify a set of anchors using gene expression profiles from aCM2 and neonatal CMs. Subsequently, we transferred the cell labels from neonatal CMs to aCM2 by executing the TransferData function. To assess the proportions of aCM2 cells labeled as neonatal CM1–5, we calculated these proportions and represented them visually as a bar graph.
Reanalysis of human snRNA-seq data
We performed a reanalysis of human snRNA-seq data, specifically focusing on CMs and CFs. The reference data used for this analysis were obtained from two sources: Litviňuková et al. in their publication ‘Cells of the adult human heart’24 and Tucker et al. in their publication ‘Transcriptional and cellular diversity of the human heart’33. We obtained the data from the Human Cell Atlas data portal (https://www.heartcellatlas.org) with the kind assistance of Patrick Ellinor.
To analyze the CMs, we reclustered the CM data from Litviňuková et al. at a granular resolution of 0.5. This resulted in the identification of 14 distinct clusters within the CM population. For the CF analysis, we integrated the CF data from Litviňuková et al. and Tucker et al. and accounted for any batch effects using the Harmony algorithm. Subsequently, the integrated CF population was subsetted and re-embedded into UMAP dimensions for visualization purposes. To visualize the density of C3 expression, we used the Nebulosa package in R.
Reanalysis of human ST data
Processed human cardiac ST data generated in post-MI patients were downloaded from the CELLxGENE data portal (https://cellxgene.cziscience.com/collections/8191c283-0816-424b-9b61-c3e1d6258a77). The original spot-level metadata, such as tissue location and donor condition, were directly used for analyses without additional modification. We performed integration of 18 ST slides from MI and control patients and scored aCM1 and aCM2 signature gene expression. To compare aCM2 signature expression across different zones relative to the ischemic injury site, we categorized spots on each slide into RZ, BZ and IZ based on the expression of zone-specific gene sets reported in recent mouse studies25,54. These include 57 genes for BZ (for example, Nppa and Myh7), 50 genes for RZ (for example, Ckm and Cox7a1) and 50 genes for IZ (for example, Spp1 and Apoe). All gene set expression z-scores were calculated using the AddModuleScore function provided by Seurat, as described above. Representative slides from two control and four post-MI samples were visualized to illustrate the annotated zones and aCM1 and aCM2 scores.
Seahorse metabolic assay of cardiac fibroblasts
Primary CFs were isolated from WT and C3−/− hearts and plated at 3 × 10⁴ cells per well on a Seahorse XF Microplate. Standard XF Real-Time ATP Rate Assay was performed using a Sea horse XFe96 Analyzer (Agilent Technologies). Cells were sequentially treated with oligomycin (1.5 μM), rotenone and antimycin A (0.5 μM) to assess ATP production rate according to the manufacturer’s instructions. The ATP production from mitochondria and glycolysis were calculated by a Seahorse XF Real-Time ATP Rate Assay Report Generator.
Statistics and reproducibility
For scRNA-seq and snRNA-seq analyses, differentially expressed genes were identified by using the Wilcoxon rank-sum test implemented in the Seurat workflow as FindMarkers (Supplementary Tables 1,3,5 and 7-10). A gene was considered to be differentially expressed if it had a log2FC >0.25 and an FDR (Benjamini–Hochberg correction) < 0.05, unless stated otherwise.
For the other data, the specific statistical test used is presented in the figure legend. For the comparison of more than two experimental groups, the statistical significance of the observed differences in mean was evaluated by using a one-way or two-way ANOVA and the post hoc Tukey’s multiple comparisons test. For the comparison of two experimental groups, an equal variance Student’s t-test was used, and a two-tailed P value less than 0.05 was considered statistically significant. To average correlation coefficients, a Fisher’s z-transform was used, and z-scores were averaged and transformed back to a mean correlation coefficient. For comparing data with technical and biologic replicates, a nested t-test or nested ANOVA was used.
For representative images in which no explicit quantification is provided (that is, Fig. 4l and Extended Data Fig. 2h), a minimum of three biological replicates (mouse) and five technical replicates (images) therein were used to select a reproducible and representative image.
Extended Data
Extended Data Fig. 1 ∣. Spatial transcriptomics and scRNAseq quality control.
a, H&E staining of tissue sections showing no gross morphologic differences between control and YAP5SA hearts. Scale = 1000 μm. b, Spatial transcriptomics dataset (n = 1 per genotype) with the number of genes (median: control, 2358; YAP5SA, 3323) and counts (average: control, 12,804; YAP5SA, 15,101) captured per spot. c, Correlation of gene expression between control and YAP5SA hearts (R2 = 0.96). d, Differentially expressed genes between YAP5SA and control hearts with increased expression of representative Yap target genes Ccnd1, Anxa2, Sptan1, Ccl7, and Timp1 in YAP5SA hearts. e, Single-cell RNA-seq cell-type composition across replicates shows increased MPs in YAP5SA hearts (n = 3 per genotype). f, aCM1 proportion is decreased and aCM2 proportion is increased in YAP5SA compared to Control hearts (n = 3 per genotype). g, Pseudotime analysis using Slingshot trajectory inference showing potential transition from aCM1 to aCM2. h, Gene expression module modeled as a function of progression through the pseudotemporal trajectory. The 62 temporally correlated genes increasing during the transition from aCM1 to aCM2 are listed in Supplementary Table 2. Center lines in all box plots are shown as mean values and whiskers extended to a maximum of 1.5 x interquartile range beyond the boxes.
Extended Data Fig. 2 ∣. Validation of aCM2 marker genes.
a, GO analysis of upregulated genes in control murine aCM2 versus aCM1 showing increased structural gene expression, with the top GO terms and associated upregulated genes shown. b, GO analysis of downregulated genes in control murine CM2 versus control CM1 showing decreased metabolic processes, with the top GO terms and associated downregulated genes shown. c, Immunostaining showing Tβ4 (red) in the subendocardium and subepicardium of a wildtype control heart (left, scale = 100 μm). WGA (green) and DAPI (blue) stains were used for cell membrane and nuclei staining. Zoomed-in regions showing Tβ4 expression in cardiomyocytes of the subendocardium, no Tβ4 expression in the midmyocardium, and Tβ4 expression in the subepicardium (right, scale = 50 μm). d, Tβ4 expression is greatly increased in YAP5SA hearts (left, scale = 100 μm). High magnification images showing expression of Tβ4 in YAP5SA-activated CMs (FLAG positive, green) with sarcomere disassembly (CTnT, grey) (right, scale = 20 μm). e, aCM2 marker gene Lmcd1 (red) is expressed in some control subendocardial CMs (yellow arrows) and is increased in YAP5SA CMs. Scale = 50 μm. f, aCM2 marker gene Acta2 (red) is expressed in some control subendocardial CMs (yellow arrows) and is increased in YAP5SA CMs. Scale = 50 μm. g, Smooth muscle actin (;SMA), encoded by Acta2, is expressed in control subendocardial CMs (yellow arrowheads) and significantly increased in dedifferentiating YAP5SA CMs, identified by disorganized CTnT expression. Scale = 100 μm. h, High magnification images of transverse and longitudinal axes show colocalization of α-SMA with CMs undergoing sarcomere disassembly. Scale = 50 μm. Statistical significance for enriched GO terms was determined using a one-sided Fisher’s exact test, with an adjusted p value (Benjamini-Hochberg correction) < 0.05.
Extended Data Fig. 3 ∣. The adult human heart contains aCM2-like CMs.
a, Original annotation of human scRNA-seq data by Litviňuková et al.24 showing atrial and ventricular CMs (left). Subclustering of ventricular CMs revealed 14 distinct CM populations (right). b, Expression profile of CM2 marker genes in the 14 CM populations showed the highest expression in CM_8. The complement regulator CLU was also highly expressed in CM_8. c, Compared with the other CM populations, CM_8 showed the highest CM2 similarity score (***p < 0.001, one-way ANOVA with multiple comparisons, cell numbers in the 14 CM clusters range from 545 to 21,334). d, Volcano plot of differentially expressed genes between CM_8 and all other CM populations showing the upregulation of multiple CM2 marker genes. e, The top GO terms for upregulated genes in CM_8 were cytoskeletal organization terms, similar to those in CM2. f, Cellular origin composition of CM_8 showing that 9% of cells originated from the left ventricular apex, 24% from the left ventricle, 41% from the right ventricle, and 24% from the interventricular septum. g, Representative human heart ST control and MI samples from Kuppe et al.15 with annotations of remote, border, and ischemic zones based on Calcagno et al.25. h, aCM1 and aCM2 scores for the representative tissue sections showing an increase of aCM2 signature in border zones of MI hearts. i, Quantification of 18 hearts from Kuppe et al.15 shows aCM1 is downregulated in both border and ischemic zones, while aCM2 is upregulated in the border zone compared to ischemic and remote zones. C3+ CF and C3ar1+ MP scores are increased in the ischemic zone but not in the border zone compared to the remote zone. Statistical significance was determined using a two-sided pairwise t-test. Center lines in all box plots are shown as mean values and whiskers extended to a maximum of 1.5 × interquartile range beyond the boxes.
Extended Data Fig. 4 ∣. Spatial niche analysis of Control versus YAP5SA hearts.
a, Pairwise co-localization between the major cell types based on deconvolved proportions shows MP significantly co-localizes with EC2, CF and aCM2 but not with aCM1. b, Unsupervised clustering of spots in the ST data yielded seven spatial niches for each genotype. c, Spatial niches mapped onto Control and YAP5SA hearts. d, Control Niche 5 (C5) is abundant in aCM2, CF, and EC2, while YAP5SA Niche 3 and 5 (Y3 & Y5) contains higher amount of aCM2, CF, and MP than other niches. Asterisks indicate increased composition of a cell type in a niche compared with other niches (one-sided Wilcoxon rank sum test, adjusted (adj.) P < 0.01).
Extended Data Fig. 5 ∣. C3+ CFs express cardioprotective and antifibrotic genes and is conserved between mouse and human.
a, immunofluorescence staining of CM marker α-actinin (green), C3 (red), nuclei counterstain DAPI (blue), and cell membrane marker wheat germ agglutinin (WGA, grey) shows expression of C3 in the subendocardium of control hearts. Scale = 50 μm. b, C3 (green) is colocalized with fibroblast marker vimentin (red). Scale = 20 μm. c, C3 (red) expression is increased in YAP5SA compared to Control hearts. Scale = 50 μm. d, Quantification of C3+ and vimentin+ cells in Control and YAP5SA hearts (n = 5 per genotype). e, Proportion of CFs expressing C3 in Control and YAP5SA hearts (n = 3 per genotype). f, Volcano plot (left) showing differentially expressed genes between C3-positive and C3-negative CFs and categorized as GO terms (right) showing increased expression of anti-fibrotic genes (Dcn, Igfbp4, and Cst3) and cardioprotective genes (Mt1, Mt2, and Fstl1) by C3-positive CFs. g, Ligand-receptor analysis from C3− or C3+ CFs to aCM1 and aCM2. VCAM, SEMA3, and VEGF pathway genes are upregulated in YAP5SA hearts. h, CFs from Litviňuková et al. and Tucker et al. shows a subpopulation of CFs with high C3 expression24,33. i, Volcano plot of differentially expressed genes between human C3+ CFs and C3− CFs shows the upregulation of many of the same genes as in the mouse, including FSTL1, DCN, CST3, and IGFBP4. GO analysis of genes upregulated in human C3+ versus C3− CFs shows extracellular matrix organization and immune activation terms, similar to the categories observed in murine C3+ CFs. Error bars indicate means ± s.e.m. Statistical significance was determined using a two-tailed Wilcoxon rank sum test. Center lines in all box plots are shown as mean values and whiskers extended to a maximum of 1.5 × interquartile range beyond the boxes.
Extended Data Fig. 6 ∣. aCM2 is induced following myocardial infarction.
a, UMAP projection of single-cell RNA sequencing data from Wang et al.35. b, The proportion of C3-expressing CFs increase after MI in both P1 and PS hearts. c, P1 sham hearts have higher proportion of C3ar1-expressing MPs compared to P8 sham hearts. P1 MI induces a greater increase in C3ar1-expressing MPs compared to PS MI. d, H&E staining of P1 sham and MI heart sections 3 days and 7 days postsurgery (P1 Sham D3, P1 MI D3, P1 Sham D7, P1 MI D7) used for ST in Cui et al.36.
Data adapted from Cui et al.
Extended Data Fig. 7 ∣. C3ar1+ macrophages are anti-inflammatory and signal to cardiomyocytes.
a, Spatial colocalization probability of ligand-receptor gene pairs (Cx3cl1-Cx3cr1, Thbs1-Cd47, and Thbs1-Cd36) are increased in YAP5SA compared to Control hearts. b, UMAP projection of Control and YAP5SA myeloid cells. c, Most MP populations are increased in YAP5SA compared to Control hearts, with MP2 being most increased. d, MP2 macrophages are the most increased fraction in YAP5SA compared to control hearts. e, GO analysis of upregulated genes in C3ar1+ MPs versus C3ar1− MPs reveals terms associated with anti-inflammatory M2 MPs, such as anti-apoptosis, wound healing, and angiogenesis. Statistical significance was determined by one-sided Fisher’s exact test, with an adjusted p value (Benjamini-Hochberg correction) < 0.05. f, Differentially expressed genes include markers of M2 (Mertk, Mrc1, Il10, Maf, Cd163, Cd68, Cd36), cardiac growth (Igf1), anti-apoptosis (Gdf15), wound healing (F13a1), angiogenesis (Tnfsf12), and ECM degradation (Adam15). Statistical significance was determined by two-tailed Wilcoxon rank sum test. g, Ligand-receptor analysis from C3ar1+ MPs to aCM2 shows increased TNF, ADAM15, GDF, and IGF signaling. h, The expression of the MP ligand genes Igf1, Adam15, and Tnfsf12 are specific to C3ar1+ MPs increased in YAP5SA compared to Control. i, Colocalization of Igf1, Adam15, and Tnfsf12 expressing spots with C3ar1+ MPs in YAP5SA ST data. j, The expression of the aCM2 receptor genes Igf1r, Itgb1, and Tnfrsf12a are increased in YAP5SA compared to Control. k, Igf1r, Itgb1, and Tnfrsf12a expressing spots colocalize with aCM2 but not aCM1 in YAP5SA ST data. Statistical significance was determined by spatial colocalization testing (detailed in Methods).
Extended Data Fig. 8 ∣. AAV-GFP and AAV-YAP5SA are induced robustly in wildtype and C3−/− hearts.
a, Wildtype (WT) and C3−/− mice injected with AAV-GFP shows high transduction efficiency in cardiomyocytes, as seen in GFP expression (green). Wildtype (WT) and C3−/− mice injected with AAV-YAP5SA shows high transduction efficiency of YAP5SA, as evidenced by FLAG expression (red), in cardiomyocytes. Scale = 100 μm. b, Flow cytometry gating strategy for obtaining DAPI+ singlets (Non-CMs). c, Low magnification images showing increased sarcomere disassembly (CTnT, grey) in WT + AAV-YAP5SA compared to C3−/− + AAV-YAP5SA hearts. Scale = 50 μm.
Extended Data Fig. 9 ∣. AAV-GFP and AAV-YAP5SA are induced robustly in wildtype and C3ar1−/− hearts.
a, Wildtype (WT) and C3ar1−/− mice injected with AAV-GFP shows high transduction efficiency in cardiomyocytes, as seen in GFP expression (green). Wildtype (WT) and C3ar1−/− mice injected with AAV-YAP5SA shows high transduction efficiency of YAP5SA, as evidenced by FLAG expression (red), in cardiomyocytes. Scale bars = 100 μm. b, Representative images of S to G2 marker CCNA2 (red) shows a decrease in C3ar1−/− + AAV-YAP5SA CMs compared to WT + AAV-YAP5SA CMs. Scale bars = 100 μm. c, Survival of mice injected with AAV-GFP or AAV-YAP5SA. WT mice have reduced survival at D6 compared to C3ar1−/− and C3−/− mice injected with AAV-YAP5SA (53.3% vs. 93.3% and 100%). Statistical significance was determined using a chi-squared test.
Extended Data Fig. 10 ∣. Single-nucleus RNA sequencing of WT and C3−/− P2 MI 3 DPI hearts.
a, integrated UMAP projection of WT MI and C3−/− MI hearts 3 DPI (n = 2 each group). b, Quantification of basal ATP production rate, comprised of mitochondrial and glycolytic ATP production, in cultured WT and C3−/− cardiac fibroblasts (n = 20 wells). c, Cardiomyocyte marker genes showing a proliferative cluster expressing Top2a, Mki67, and Pcna. d, Feature plots showing aggregated proliferative gene signatures and example genes expressed by the Prol. CM cluster. Statistical significance was determined using a two-sided t-test. Error bars indicate means ± s.e.m.
Supplementary Material
Acknowledgements
This work is supported by the National Heart, Lung, and Blood Institute (HL127717, HL130804 and HL118761 to J.F.M.); the American Heart Association (849706 to S.L., 903651 to R.G.L. and 903411 to F.M.); the Don McGill Gene Editing Laboratory of the Texas Heart Institute (X.L.); and the Vivian L. Smith Foundation (J.F.M.).
We thank T. T. Tran of Baylor College of Medicine for assistance with animal surgical procedures, H. Zheng of Baylor College of Medicine for providing C3ar1-TDTomato mice and N. Stancel of the Scientific Publications Department of the Texas Heart Institute for editorial support. Figures 1a, 4e, 7a, 7d and 8a were created with BioRender.
Footnotes
Reporting summary
Further information on research design is available in the Nature Portfolio Reporting Summary linked to this article.
Competing interests
J.F.M. is a co-founder of and owns shares in YAP Therapeutics. He is a co-inventor on the following patents associated with this study: patent no. US-20200206327-A1 (‘Hippo pathway deficiency reverses systolic heart failure post-infarction’), allowed, not issued yet, applicant: Baylor College of Medicine, inventor: James F. Martin; patent covers Figs. 4-6 and Extended Data Figs. 8 and 9 of the present manuscript; patent no. US-20220411798-A1 (‘Hippo and dystrophin complex signaling in cardiomyocyte renewal’), still in prosecution, applicants: Baylor College of Medicine and Texas Heart Institute, inventor: James F. Martin; patent covers Figs. 4-6 and Extended Data Figs. 8 and 9 of the present manuscript; and patent no. US-11459565-B2 (‘Hippo and dystrophin complex signaling in cardiomyocyte renewal’), granted, applicants: Baylor College of Medicine and Texas Heart Institute, inventor: James F. Martin; patent covers Figs. 4-6 and Extended Data Figs. 8 and 9 of the present manuscript. Y.M. is a co-inventor on the above-indicated patents associated with this study. The remaining authors declare no competing interests.
Extended data is available for this paper at https://doi.org/10.1038/s44161-024-00428-w.
Supplementary information The online version contains supplementary material available at https://doi.org/10.1038/s44161-024-00428-w.
Data availability
All data generated or analyzed during this study are included in this published article and its supplementary information files. Source Data are provided with the manuscript. All raw and processed sequencing data are deposited at the National Center for Biotechnology Information’s Gene Expression Omnibus (GEO): GSE217828 and GSE152856. Previously published datasets used in this study include SCP498 deposited in the Broad Institute’s Single Cell Portal, ERP12313 deposited in the Human Cell Atlas Data Coordination Platform and GSE130699 and GSE163631 deposited in the GEO.
Code availability
In-house code for reproducing all bioinformatics analyses is available at GitHub (https://github.com/XL-Genomics/2023_YAP_Induced_Regenerative_Cardiac_Niche).
References
- 1.Bergmann O et al. Dynamics of cell generation and turnover in the human heart. Cell 161, 1566–1575 (2015). [DOI] [PubMed] [Google Scholar]
- 2.Ali H, Braga L & Giacca M Cardiac regeneration and remodelling of the cardiomyocyte cytoarchitecture. FEBS J. 287, 417–438 (2020). [DOI] [PubMed] [Google Scholar]
- 3.Puente BN et al. The oxygen-rich postnatal environment induces cardiomyocyte cell-cycle arrest through DNA damage response. Cell 157, 565–579 (2014). [DOI] [PMC free article] [PubMed] [Google Scholar]
- 4.Tzahor E & Poss KD Cardiac regeneration strategies: staying young at heart. Science 356, 1035–1039 (2017). [DOI] [PMC free article] [PubMed] [Google Scholar]
- 5.Porrello ER et al. Transient regenerative potential of the neonatal mouse heart. Science 331, 1078–1080 (2011). [DOI] [PMC free article] [PubMed] [Google Scholar]
- 6.Mahmoud AI et al. Nerves regulate cardiomyocyte proliferation and heart regeneration. Dev. Cell 34, 387–399 (2015). [DOI] [PMC free article] [PubMed] [Google Scholar]
- 7.Lavine KJ et al. Distinct macrophage lineages contribute to disparate patterns of cardiac recovery and remodeling in the neonatal and adult heart. Proc. Natl Acad. Sci. USA 111, 16029–16034 (2014). [DOI] [PMC free article] [PubMed] [Google Scholar]
- 8.Wang J, Liu S, Heallen T & Martin JF The Hippo pathway in the heart: pivotal roles in development, disease, and regeneration. Nat. Rev. Cardiol 15, 672–684 (2018). [DOI] [PubMed] [Google Scholar]
- 9.Heallen T. et al. Hippo signaling impedes adult heart regeneration. Development 140, 4683–4690 (2013). [DOI] [PMC free article] [PubMed] [Google Scholar]
- 10.Liu S. et al. Gene therapy knockdown of Hippo signaling induces cardiomyocyte renewal in pigs after myocardial infarction. Sci. Transl. Med 13, eabd6892 (2021). [DOI] [PMC free article] [PubMed] [Google Scholar]
- 11.Monroe TO et al. YAP partially reprograms chromatin accessibility to directly induce adult cardiogenesis in vivo. Dev. Cell 48, 765–779 (2019). [DOI] [PMC free article] [PubMed] [Google Scholar]
- 12.Chen Y. et al. Reversible reprogramming of cardiomyocytes to a fetal state drives heart regeneration in mice. Science 373, 1537–1540 (2021). [DOI] [PubMed] [Google Scholar]
- 13.Cardoso AC et al. Mitochondrial substrate utilization regulates cardiomyocyte cell cycle progression. Nat. Metab 2, 167–178 (2020). [PMC free article] [PubMed] [Google Scholar]
- 14.Li X. et al. Inhibition of fatty acid oxidation enables heart regeneration in adult mice. Nature 622, 619–626 (2023). [DOI] [PMC free article] [PubMed] [Google Scholar]
- 15.Kuppe C. et al. Spatial multi-omic map of human myocardial infarction. Nature 608, 766–777 (2022). [DOI] [PMC free article] [PubMed] [Google Scholar]
- 16.Kanemaru K. et al. Spatially resolved multiomics of human cardiac niches. Nature 619, 801–810 (2023). [DOI] [PMC free article] [PubMed] [Google Scholar]
- 17.Makarewich CA et al. The DWORF micropeptide enhances contractility and prevents heart failure in a mouse model of dilated cardiomyopathy. eLife 7, e38319 (2018). [DOI] [PMC free article] [PubMed] [Google Scholar]
- 18.Chen F. et al. Hop is an unusual homeobox gene that modulates cardiac development. Cell 110, 713–723 (2002). [DOI] [PubMed] [Google Scholar]
- 19.Ibrahim M. et al. A critical role for Telethonin in regulating t-tubule structure and function in the mammalian heart. Hum. Mol. Genet 22, 372–383 (2013). [DOI] [PMC free article] [PubMed] [Google Scholar]
- 20.Beqqali A et al. CHAP is a newly identified Z-disc protein essential for heart and skeletal muscle function. J. Cell Sci. 123, 1141–1150 (2010). [DOI] [PubMed] [Google Scholar]
- 21.Street K. et al. Slingshot: cell lineage and pseudotime inference for single-cell transcriptomics. BMC Genomics 19, 477 (2018). [DOI] [PMC free article] [PubMed] [Google Scholar]
- 22.Xiao F. et al. Adducin regulates sarcomere disassembly during cardiomyocyte mitosis. Preprint at bioRxiv 10.1101/2020.12.24.424022 (2020). [DOI] [PubMed] [Google Scholar]
- 23.Srivastava D, Saxena A, Dimaio JM & Bock-Marquette I Thymosin β4 is cardioprotective after myocardial infarction. Ann. N. Y. Acad. Sci 1112, 161–170 (2007). [DOI] [PubMed] [Google Scholar]
- 24.Litvinukova M. et al. Cells of the adult human heart. Nature 588, 466–472 (2020). [DOI] [PMC free article] [PubMed] [Google Scholar]
- 25.Calcagno DM et al. Single-cell and spatial transcriptomics of the infarcted heart define the dynamic onset of the border zone in response to mechanical destabilization. Nat. Cardiovasc. Res 1, 1039–1055 (2022). [DOI] [PMC free article] [PubMed] [Google Scholar]
- 26.Reis ES, Mastellos DC, Hajishengallis G & Lambris JD New insights into the immune functions of complement. Nat. Rev. Immunol 19, 503–516 (2019). [DOI] [PMC free article] [PubMed] [Google Scholar]
- 27.West EE, Kunz N & Kemper C Complement and human T cell metabolism: location, location, location. Immunol. Rev 295, 68–81 (2020). [DOI] [PMC free article] [PubMed] [Google Scholar]
- 28.Friščič J. et al. The complement system drives local inflammatory tissue priming by metabolic reprogramming of synovial fibroblasts. Immunity 54, 1002–1021 (2021). [DOI] [PubMed] [Google Scholar]
- 29.Kim YI et al. Epithelial cell-derived cytokines CST3 and GDF15 as potential therapeutics for pulmonary fibrosis. Cell Death Dis. 9, 506 (2018). [DOI] [PMC free article] [PubMed] [Google Scholar]
- 30.Su Y. et al. Insulin-like growth factor binding protein-4 exerts antifibrotic activity by reducing levels of connective tissue growth factor and the C-X-C chemokine receptor 4. FASEB Bioadv. 1, 167–179 (2019). [DOI] [PMC free article] [PubMed] [Google Scholar]
- 31.Wei K. et al. Epicardial FSTL1 reconstitution regenerates the adult mammalian heart. Nature 525, 479–485 (2015). [DOI] [PMC free article] [PubMed] [Google Scholar]
- 32.Maruyama S. et al. Follistatin-like 1 promotes cardiac fibroblast activation and protects the heart from rupture. EMBO Mol. Med 8, 949–966 (2016). [DOI] [PMC free article] [PubMed] [Google Scholar]
- 33.Tucker NR et al. Transcriptional and cellular diversity of the human heart. Circulation 142, 466–482 (2020). [DOI] [PMC free article] [PubMed] [Google Scholar]
- 34.Cui M. et al. Dynamic transcriptional responses to injury of regenerative and non-regenerative cardiomyocytes revealed by single-nucleus RNA sequencing. Dev. Cell 53, 102–116 (2020). [DOI] [PMC free article] [PubMed] [Google Scholar]
- 35.Wang Z. et al. Cell-type-specific gene regulatory networks underlying murine neonatal heart regeneration at single-cell resolution. Cell Rep. 33, 108472 (2020). [DOI] [PMC free article] [PubMed] [Google Scholar]
- 36.Cui M. et al. Nrf1 promotes heart regeneration and repair by regulating proteostasis and redox balance. Nat. Commun 12, 5270 (2021). [DOI] [PMC free article] [PubMed] [Google Scholar]
- 37.Dick SA et al. Three tissue resident macrophage subsets coexist across organs with conserved origins and life cycles. Sci. Immunol 7, eabf7777 (2022). [DOI] [PubMed] [Google Scholar]
- 38.Quell KM et al. Monitoring C3aR expression using a floxed tdTomato-C3aR reporter knock-in mouse. J. Immunol 199, 688–706 (2017). [DOI] [PubMed] [Google Scholar]
- 39.Gibb AA, Lazaropoulos MP & Elrod JW Myofibroblasts and fibrosis: mitochondrial and metabolic control of cellular differentiation. Circ. Res 127, 427–447 (2020). [DOI] [PMC free article] [PubMed] [Google Scholar]
- 40.Morikawa Y. et al. Actin cytoskeletal remodeling with protrusion formation is essential for heart regeneration in Hippo-deficient mice. Sci. Signal 8, ra41 (2015). [DOI] [PMC free article] [PubMed] [Google Scholar]
- 41.D’Uva G. et al. ERBB2 triggers mammalian heart regeneration by promoting cardiomyocyte dedifferentiation and proliferation. Nat. Cell Biol 17, 627–638 (2015). [DOI] [PubMed] [Google Scholar]
- 42.Medjeral-Thomas N & Pickering MC The complement factor H-related proteins. Immunol. Rev 274, 191–201 (2016). [DOI] [PubMed] [Google Scholar]
- 43.Zaman R & Epelman S Resident cardiac macrophages: heterogeneity and function in health and disease. Immunity 55, 1549–1563 (2022). [DOI] [PubMed] [Google Scholar]
- 44.Novoyatleva T. et al. TWEAK is a positive regulator of cardiomyocyte proliferation. Cardiovasc. Res 85, 681–690 (2010). [DOI] [PubMed] [Google Scholar]
- 45.Li P. et al. IGF signaling directs ventricular cardiomyocyte proliferation during embryonic heart development. Development 138, 1795–1805 (2011). [DOI] [PMC free article] [PubMed] [Google Scholar]
- 46.Jana S. et al. ADAM (a disintegrin and metalloproteinase) 15 deficiency exacerbates Ang II (angiotensin II)–induced aortic remodeling leading to abdominal aortic aneurysm. Arterioscler. Thromb. Vasc. Biol 40, 1918–1934 (2020). [DOI] [PMC free article] [PubMed] [Google Scholar]
- 47.Natarajan N. et al. Complement receptor C5aR1 plays an evolutionarily conserved role in successful cardiac regeneration. Circulation 137, 2152–2165 (2018). [DOI] [PMC free article] [PubMed] [Google Scholar]
- 48.Macosko EZ et al. Highly parallel genome-wide expression profiling of individual cells using nanoliter droplets. Cell 161, 1202–1214 (2015). [DOI] [PMC free article] [PubMed] [Google Scholar]
- 49.Fleming SJ, Marioni JC & Babadi M CellBender remove-background: a deep generative model for unsupervised removal of background noise from scRNA-seq datasets. Preprint at bioRxiv 10.1101/791699 (2019). [DOI] [Google Scholar]
- 50.Stuart T. et al. Comprehensive integration of single-cell data. Cell 177, 1888–1902 (2019). [DOI] [PMC free article] [PubMed] [Google Scholar]
- 51.Korsunsky I. et al. Fast, sensitive and accurate integration of single-cell data with Harmony. Nat. Methods 16, 1289–1296 (2019). [DOI] [PMC free article] [PubMed] [Google Scholar]
- 52.Yu G, Wang LG, Han Y & He QY clusterProfiler: an R package for comparing biological themes among gene clusters. OMICS 16, 284–287 (2012). [DOI] [PMC free article] [PubMed] [Google Scholar]
- 53.Jin S. et al. Inference and analysis of cell–cell communication using CellChat. Nat. Commun 12, 1088 (2021). [DOI] [PMC free article] [PubMed] [Google Scholar]
- 54.Yamada S et al. Spatiotemporal transcriptome analysis reveals critical roles for mechano-sensing genes at the border zone in remodeling after myocardial infarction. Nat. Cardiovasc. Res 1, 1072–1083 (2022). [DOI] [PMC free article] [PubMed] [Google Scholar]
- 55.Elosua-Bayes M, Nieto P, Mereu E, Gut I & Heyn H SPOTlight: seeded NMF regression to deconvolute spatial transcriptomics spots with single-cell transcriptomes. Nucleic Acids Res. 49, e50–e50 (2021). [DOI] [PMC free article] [PubMed] [Google Scholar]
- 56.Tirosh I. et al. Dissecting the multicellular ecosystem of metastatic melanoma by single-cell RNA-seq. Science 352, 189–196 (2016). [DOI] [PMC free article] [PubMed] [Google Scholar]
- 57.Cousins RD Annotated bibliography of some papers on combining significances or p-values. Preprint at arXiv 10.48550/arXiv.0705.2209 (2008). [DOI] [Google Scholar]
Associated Data
This section collects any data citations, data availability statements, or supplementary materials included in this article.
Supplementary Materials
Data Availability Statement
All data generated or analyzed during this study are included in this published article and its supplementary information files. Source Data are provided with the manuscript. All raw and processed sequencing data are deposited at the National Center for Biotechnology Information’s Gene Expression Omnibus (GEO): GSE217828 and GSE152856. Previously published datasets used in this study include SCP498 deposited in the Broad Institute’s Single Cell Portal, ERP12313 deposited in the Human Cell Atlas Data Coordination Platform and GSE130699 and GSE163631 deposited in the GEO.
In-house code for reproducing all bioinformatics analyses is available at GitHub (https://github.com/XL-Genomics/2023_YAP_Induced_Regenerative_Cardiac_Niche).


