Abstract
The coexistence of brown adipocytes with low and high thermogenic activity is a fundamental feature of brown adipose tissue heterogeneity and plasticity. However, the mechanisms that govern thermogenic adipocyte heterogeneity and its significance in obesity and metabolic disease remain poorly understood. Here we show that in male mice, a population of transcription factor jun-B (JunB)-enriched (JunB+) adipocytes within the brown adipose tissue exhibits lower thermogenic capacity compared to high-thermogenic adipocytes. The JunB+ adipocyte population expands in obesity. Depletion of JunB in adipocytes increases the fraction of adipocytes exhibiting high thermogenic capacity, leading to enhanced basal and cold-induced energy expenditure and protection against diet-induced obesity and insulin resistance. Mechanistically, JunB antagonizes the stimulatory effects of PPARγ coactivator-1α on high-thermogenic adipocyte formation by directly binding to the promoter of oestrogen-related receptor alpha, a PPARγ coactivator-1α downstream effector. Taken together, our study uncovers that JunB shapes thermogenic adipocyte heterogeneity, serving a critical role in maintaining systemic metabolic health.
Brown adipose tissue (BAT), which dissipates chemical energy in the form of heat, increases energy expenditure and exerts anti-obesity and cardioprotective properties1–4. Following activation, brown adipocytes within the BAT also function as an effective energy sink that disposes of excess lipids and glucose, leading to a profound improvement in energy and glucose homeostasis5–9. Emerging evidence reveals the presence of distinct subsets of brown adipocytes, exhibiting a high degree of diversity in identity and function10–14. However, many questions remain unanswered regarding the biology of these distinct subpopulations, including the origin, identity and fate, as well as how they impact energy and glucose metabolism.
Recent attention has focused on the coexistence of low-thermogenic and high-thermogenic adipocytes within BAT13. The low-thermogenic brown adipocytes, which do not exhibit typical brown adipocyte morphology (low UCP1 expression and low in mitochondrial content)13, have a distinct physiological function and display a unique metabolic profile with regard to thermogenic gene expression, mitochondrial content, active metabolic pathways and the secretome11,13,14. A subset of obesity-associated brown adipocytes with lower thermogenic capacity has recently been identified in humans, and they have been shown to exert inhibitory effects on their neighbouring adipocytes by producing juxtracrine signals14. In addition to lower levels of UCP1 and adiponectin expression, and decreased mitochondrial content, the low-thermogenic brown adipocytes also have larger lipid droplets, decreased basal mitochondrial respiration and specialized fatty acid uptake13. Environmental stimuli such as cold stress can promote the conversion of low-thermogenic adipocytes to high-thermogenic adipocytes13, yet the underlying mechanisms regulating such interconversion of low-thermogenic and high-thermogenic adipocytes have not been fully characterized. Transcriptional co-factors PPARγ coactivator-1α (PGC-1α encoded by the Ppargc1a gene) and PRDM16 are well-studied thermogenic programme determinants and have been shown to co-activate C/EBPβ, PPARγ and PPARα to promote brown fat differentiation and thermogenic gene expression15–18. However, there remains a knowledge gap regarding the developmental patterns of high-thermogenic and low-thermogenic adipocytes as well as the interconversion of these unique cell populations.
JunB is a member of the Jun transcription factor family (c-Jun, JunB and JunD) and plays a critical role in multiple physiological processes including placentation, bone formation, cell proliferation, inflammation and skin homeostasis19–24. As part of the activating protein (AP)-1 complex, JunB contains a highly charged DNA binding domain and an amphipathic dimerization domain referred to as a ‘leucine zipper’25. JunB regulates downstream target gene transcription mainly through binding to consensus-specific DNA regulatory elements, namely, tetradecanoylphorbol-13-acetate-responsive elements (TREs) TGA(C/G) TCA26. The dysregulation of JunB is associated with various diseases such as atherosclerosis, hepatitis, cardiovascular disease, autoimmune disease and cancer23,24,27–30. The expression and activity levels of JunB are increased in response to environmental stimuli such as insulin and interleukin (IL)-6 in a variety of cell types31,32, both of which are associated with measures of obesity. However, whether JunB upregulation exacerbates obesity and diabetes is poorly understood. Moreover, although JunB has been shown to suppress lipolysis in gonadal white adipose tissue (gWAT) through regulation of adipose triglyceride lipase and hormone-sensitive lipase33, a cellular process affecting energy metabolism, little is known on whether JunB dysregulation plays a direct role in thermogenesis.
In the present study, we found that JunB is enriched in the interscapular BAT versus inguinal white adipose tissue (iWAT or beige fat) and gWAT. JunB-expressing ( JunB+) adipocytes exhibit low-thermogenic (UCP1loPGC-1αlo) properties with smaller lipid droplets and show increased abundance in obesity, possibly mediated by pro-inflammatory cytokines tumour necrosis factor (TNF) and IL-6. JunB directs metabolic and inflammatory signalling in governing thermogenic adipocyte heterogeneity through antagonizing PGC-1α action, providing a mechanism linking inflammation to BAT dysfunction in obesity. Targeting JunB may be a potential therapeutic approach to increase adipocyte thermogenic capacity and to treat obesity and its related metabolic disorders.
Results
JunB expression in BAT is associated with obesity
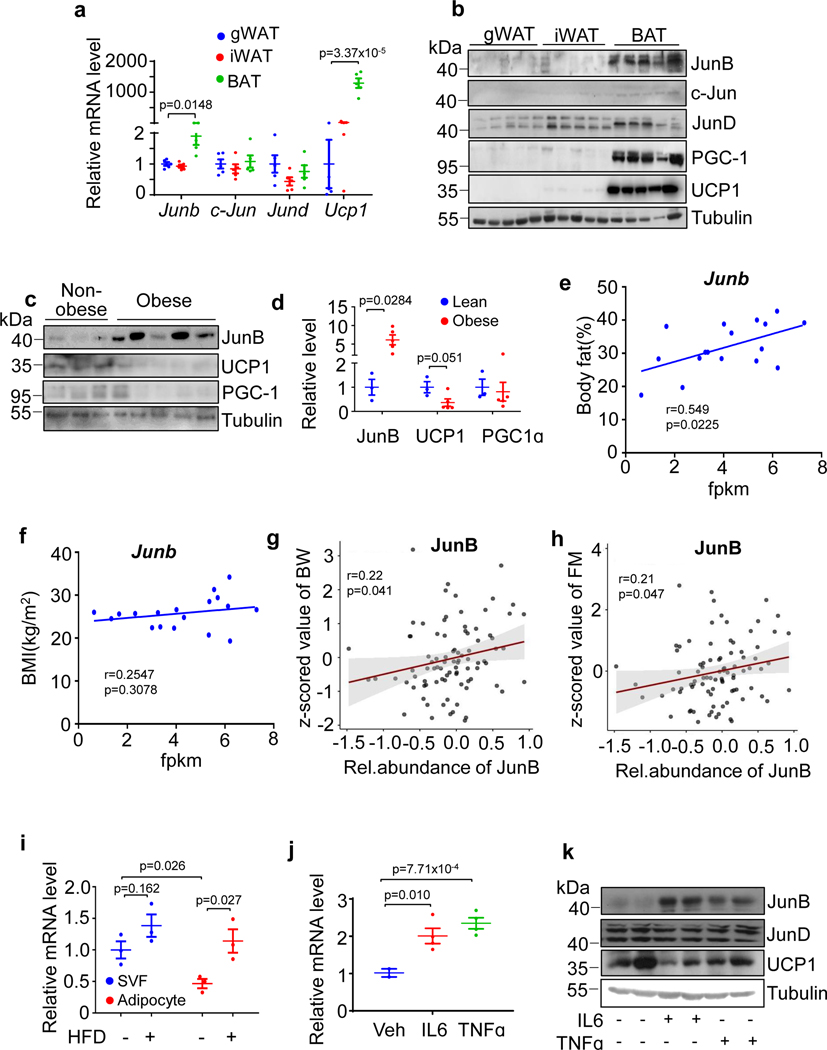
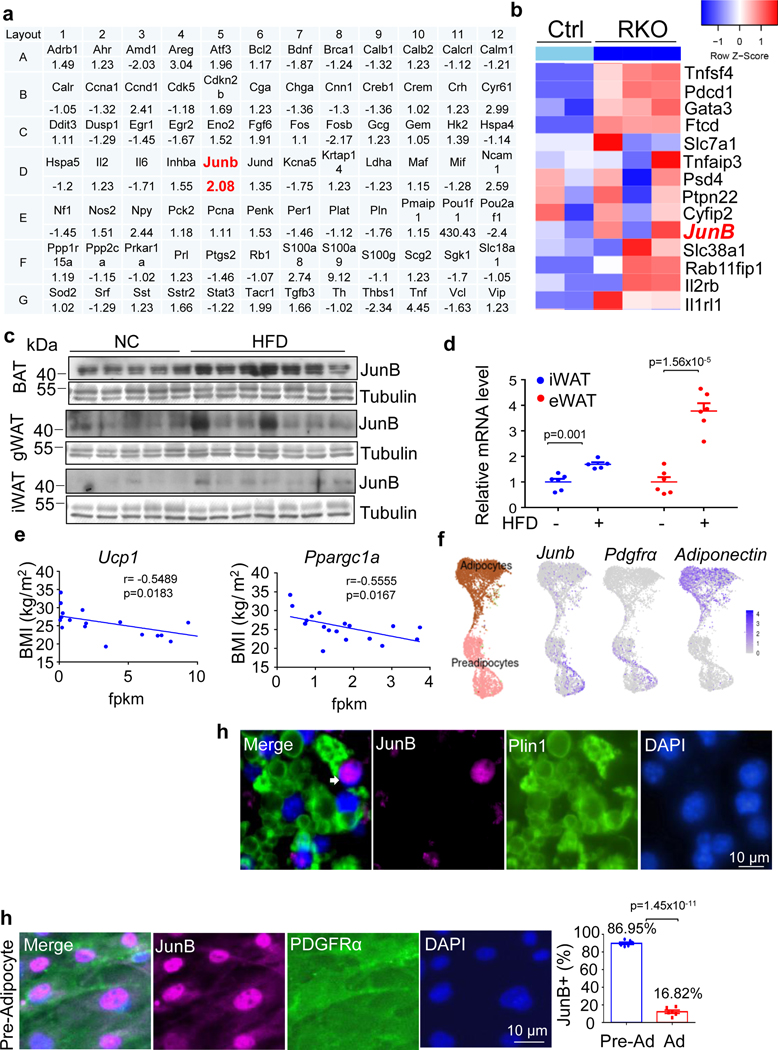
The results from others and our studies suggest the role of mammalian target of rapamycin complex 1 (mTORC1) in the regulation of thermogenesis in BAT and iWAT34–40. However, whether mTORC1 modulates thermogenesis by cross-talk with protein kinase A (PKA) signalling remains controversial36,37. To further dissect the interaction of mTORC1 and PKA pathways, we performed microarray assay of cAMP-responsive genes in rapamycin-treated BAT, and RNA-sequencing (RNA-seq) analysis of Raptor knockout (KO) in iWAT (Extended Data Fig. 1a,b)37. Both assays indicate that the cAMP-responsive gene Junb, a member of the activator protein 1 family, is inactivated by mTORC1 in thermogenic fat, suggesting a potential role for JunB regulating metabolism. To determine if JunB is implicated in obesity, we examined the expression levels of Jun family members JunB, c-Jun and JunD in various fat depots in mice. The mRNA and protein levels of JunB were notably higher in BAT than that in iWAT and gWAT, while there was no significant difference in the mRNA levels of JunD and c-Jun between various fat depots with a slight increase in their protein levels in BAT (Fig. 1a,b).
Fig. 1 |. JunB expression in thermogenic fat is positively correlated with obesity.
a,b, mRNA (n = 6 mice per group) (a) and protein (n = 5 mice per group) (b) levels of JunB, Jun, JunD and UCP1 in gWAT, iWAT and BAT of 10-week-old male mice. c, JunB protein expression was induced in the deep neck fat of obese individuals (n = 3 (non-obese), n = 5 (obese)). d, The quantified data of JunB expression in c. e,f, The mRNA levels of JunB in human deep neck fat were positively correlated with body fat (%) (e) and BMI (f). g,h, Protein levels of JunB in brown fat were positively correlated with body weight (BW) (g) and fat mass (FM) (h) in rodents. i, mRNA levels of JunB in the BAT fractions of adipocytes and SVFs were enhanced in diet-induced obesity (n = 3 mice per group). j,k, Expression levels of JunB in mRNA (n = 3, independent experiments) (j) and protein (n = 4, independent experiments) (k) were induced by the treatment of 20 ng ml−1 IL-6 or 20 ng ml−1 TNF for 24 h in day-6 differentiated brown adipocytes. The loading control tubulin in one membrane was used as the processing control for different gels with identical loading volumes for the sample in b and k. Data represent the mean ± s.e.m. Statistical analysis was performed using Pearson’s correlation coefficient (d–h) and an unpaired two-sided t-test. FPKM, fragments per kilobase of transcript per million mapped reads.
Moreover, we found that JunB expression levels were induced by obesity in human deep neck fat and inversely correlated with thermogenic markers UCP1 and PGC-1α (Fig. 1c,d). In addition, a positive correlation between JunB expression in deep neck fat and fat mass/body mass index (BMI) was observed by Sun et al. in the human study despite no significance in the correlation between JunB expression and BMI (Fig. 1e,f)14, and such correlation was also observed by Xiao et al. in their proteomic datasets (Fig. 1g,h)41. In line with these results, the protein and mRNA levels of JunB were both induced by a high-fat diet (HFD) in mice (Extended Data Fig. 1c–e). In contrast, JunB expression in deep neck fat was inversely correlated with thermogenic markers UCP1 and PGC-1α, and JunB was more enriched in stromal vascular fractions (SVFs) than in adipocytes in humans (Extended Data Fig. 1f,g)14. Given the fundamental role of JunB in cell proliferation42, we asked if JunB is expressed in adipocytes or adipocyte progenitor cells (APCs). The mRNA levels of JunB in SVFs were higher than in adipocytes isolated from BAT (Fig. 1i), while both were upregulated by diet-induced obesity in mouse BAT (Fig. 1i). Consistent with this, pro-inflammatory cytokines TNF and IL-6 significantly induced JunB expression in mRNA (j) and protein (k) in brown adipocytes (Fig. 1j,k and Extended Data Fig. 1h). These results suggest that JunB may play a role in regulating thermogenesis and obesity development.
JunB-enriched adipocytes expand in obesity
We then explored the expression of JunB in brown adipocytes in single-cell resolution given its differential expression in SVFs versus adipocytes in humans and rodents (Extended Data Fig. 1g and Fig. 1i). Using AdipoChaser-GFP mice, the existence of a distinct population of adiponectin+ adipocytes that express JunB was observed primarily in BAT (Fig. 2a)13. Moreover, the percentages of JunB+ adipocytes varied in different fat depots, with the highest level (11.8% ± 1.4%) found in BAT and the lowest level (0.9% ± 0.3%) observed in gWAT of adult male mice (Fig. 2b). The distinct adipocyte population that expresses JunB was localized at both the edge of and within the brown fat pad, although a significant reduction in the number of JunB-positive cells was found in iWAT and gWAT compared to BAT (Fig. 2b). The presence of JunB+ adipocytes was also evidenced by immunostaining for JunB and perilipin 1 (Plin1) in BAT, and the abundance of JunB+ adipocytes in BAT was increased from 8.7% to 24.9% by HFD feeding for 4 weeks in mice (Fig. 2c,d). The existence of JunB+ adipocytes (multilocular cells) with smaller lipid droplets was also verified by co-staining with the adipocyte marker Plin1 in primary differentiated adipocytes (Extended Data Fig. 1i). Although 87.0% of inherent SVF cells isolated from BAT were JunB positive, as indicated by immunostaining, the enrichment of JunB+ cells was significantly reduced to 16.8% in differentiated adipocytes (Extended Data Fig. 1j).
Fig. 2 |. A distinct adipocyte subset that expresses JunB is present in the brown and inguinal fat depots and increased by obesity in abundance.
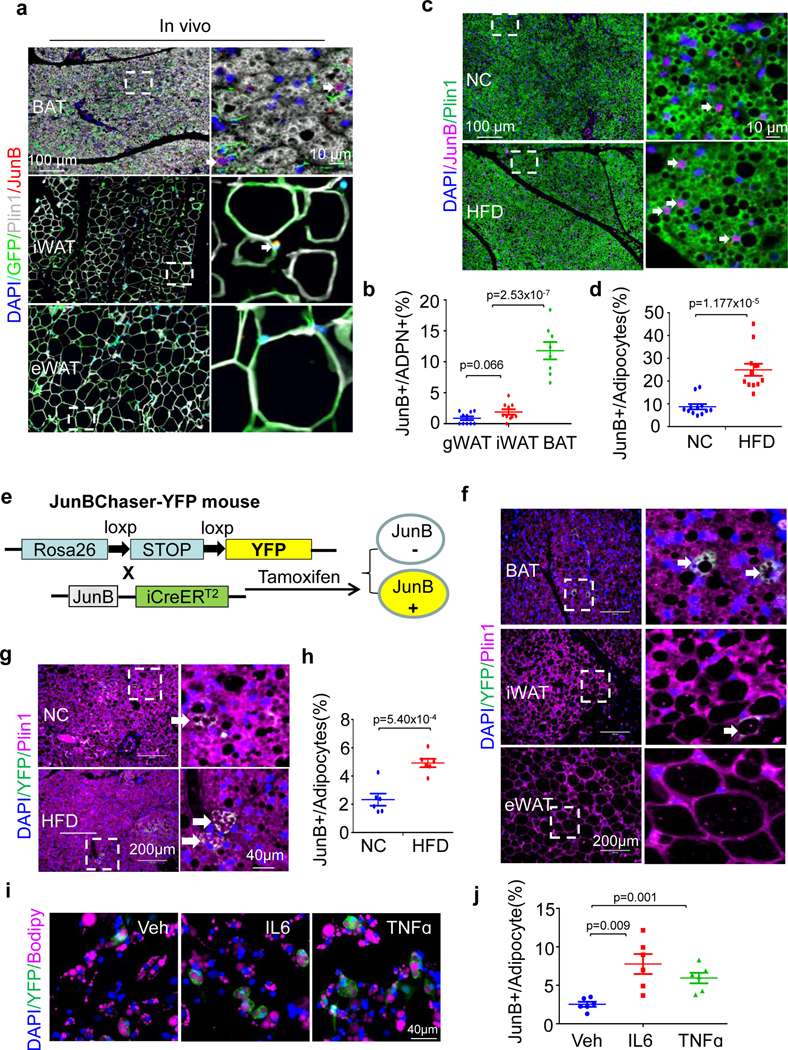
a, Immunostaining shows the localization of JunB+ adipocytes in BAT, iWAT and gWAT of AdipoChaser mice. Antibodies against JunB (red), Adipoq (green), Plin1 (white) and nucleus (blue) were used for the staining. b, Quantification of JunB-expressing adipocytes in various fat depots as indicated in a (n = 4 mice per group). c, Immunostaining of BAT from mice fed with normal chow (NC) or HFD for 4 weeks. Antibodies recognizing JunB (red), Plin1 (green) and nucleus (blue) were used. d, Quantification of BAT JunB-expressing adipocytes in c (n = 6 mice per group). e, The generation strategy of JunBChaser-YFP mice. f, YFP-expressing adipocytes (green) were more enriched in BAT, albeit in modest numbers in iWAT and gWAT in JunBChaser-YFP mice. Antibodies recognizing perilipin 1 (red) and nucleus (blue) were used. g, YFP+ adipocytes were increased in BAT of JunBChaser-YFP mice after 4 weeks of HFD feeding. Antibodies recognizing YFP (green), perilipin 1 (red) and nucleus (blue) were used. White arrows in a, c, f and g indicate the JunB+ cells h, Quantification of BAT YFP+ adipocytes in g (n = 4 mice per group). i, YFP+ adipocytes (green) were increased by the treatment of 20 ng ml−1 TNF or 20 ng ml−1 IL-6 for 24 h in primary differentiated brown adipocytes. j, Quantification of YFP+ adipocytes in i (n = 3 per group). n = 3 per group for a, c, f, g and i. Microscopic images (×20 objective) were taken. Data in b, d, h and j are presented as the mean ± s.e.m. An unpaired two-sided t-test was used for analysis.
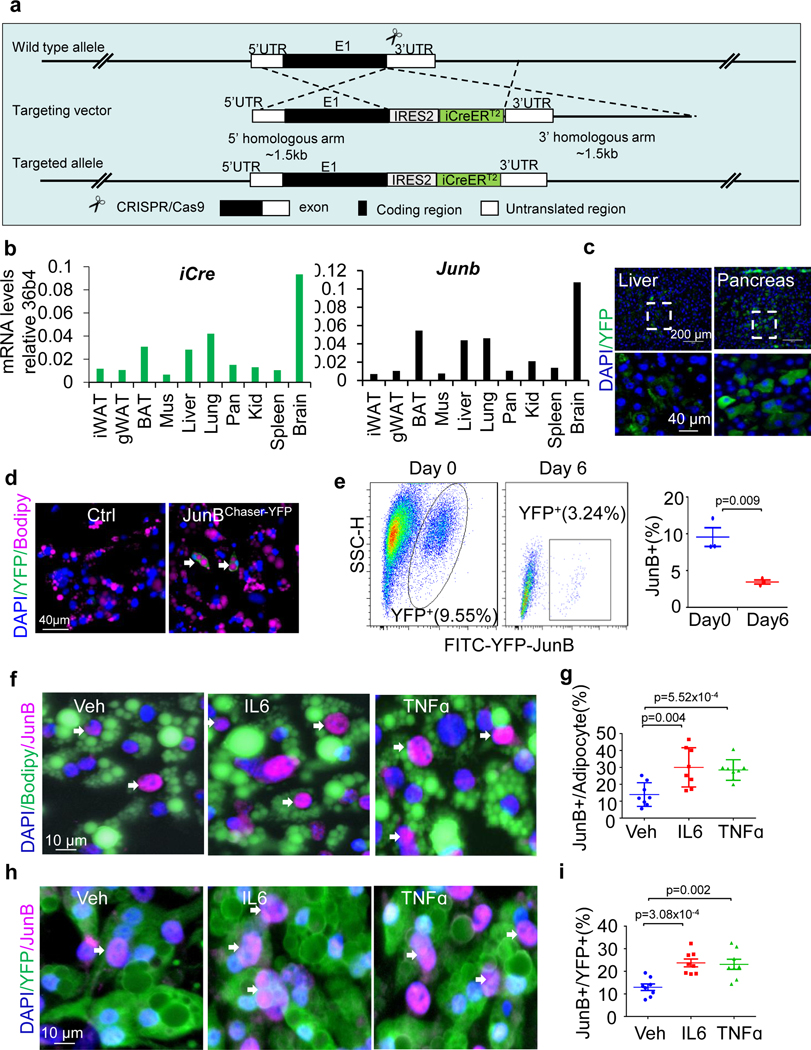
To track the JunB-expressing cells genetically, we generated JunBCreERT2 knock-in mice (Fig. 2e and Extended Data Fig. 2a). The expression pattern of Junb is aligned with iCre in various tissues in JunBCreERT2 mice (Extended Data Fig. 2b), suggesting that Cre expression is driven by Junb. The JunBChaser-YFP mice were generated by crossing JunBCreERT2 knock-in and Rosa26-YFP floxed mice and used to track JunB-expressing cells. After administration of tamoxifen, a higher fraction (2.3%) of adipocytes were YFP+ in brown fat with a lesser number in iWAT and gWAT, and YFP was expressed in the cytoplasm of the cells (Fig. 2f). YFP+ cells were observed in other tissues such as liver and pancreas (Extended Data Fig. 2c). Moreover, the YFP+ adipocyte fraction showed a significant increase (4.9%) by 4 weeks of HFD feeding in BAT (Fig. 2g,h). Consistent with this, 3.24% of differentiated brown adipocytes were YFP+ indicated by imaging and flow cytometry after primary adipogenesis (Extended Data Fig. 2d,e and Supplementary Fig 1a,b). Moreover, the treatment of TNF and IL-6 notably increased the fraction of YFP+ (or JunB+) adipocytes to 5.5% and 7.9%, respectively (Fig. 2i,j and Extended Data Fig. 2f–i). These results suggest that JunB+ adipocytes are increased by obesity in abundance, possibly mediated by an obesity-associated pro-inflammatory state.
JunB deficiency in adipocytes enhances thermogenesis
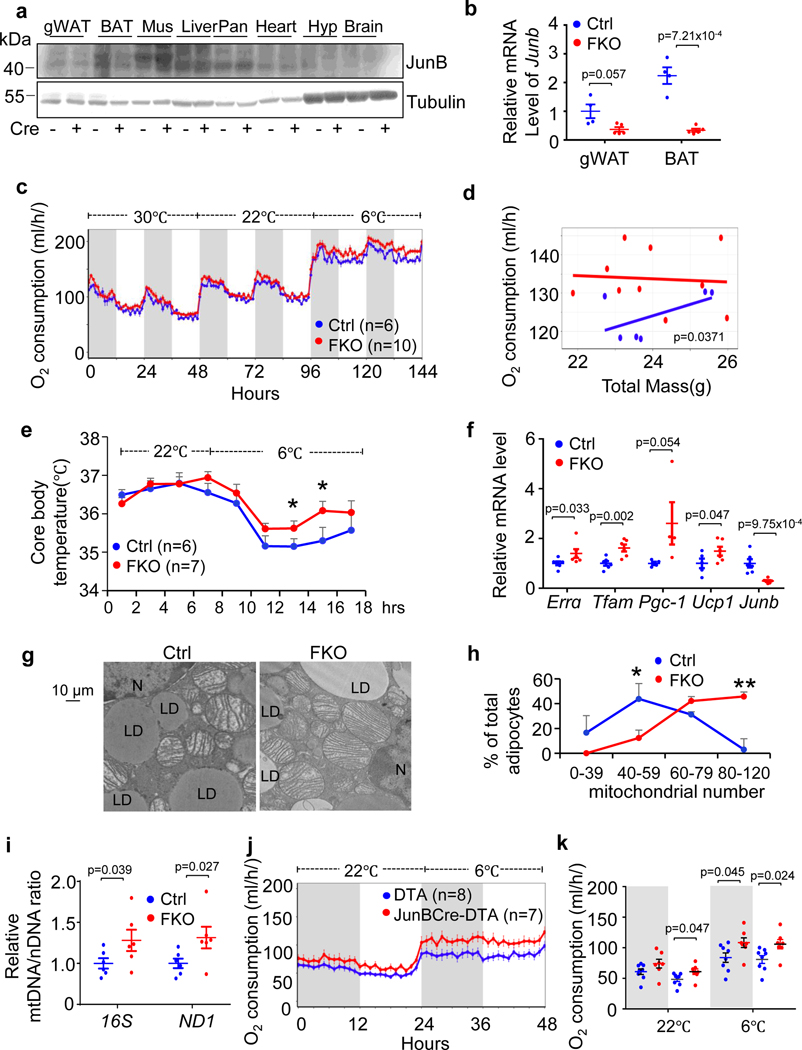
To investigate the in vivo role of JunB in regulating energy metabolism, we generated adipose-specific JunB KO (JunB FKO) mice by crossing JunB-floxed mice with adiponectin-Cre transgenic mice; 10-week-old mice were used for the following studies. Adipocyte-specific ablation of JunB led to a robust suppression of JunB in BAT and reduced levels of JunB in gWAT (Fig. 3a,b) but not in other tissue/organs. JunB deficiency overall increased energy expenditure under room temperature conditions and this was more pronounced under cold stress despite no significant effect on thermoneutrality (Fig. 3c,d). Consistent with this, the respiratory exchange ratio was decreased, whereas similar levels of food intake and activity levels were observed in JunB FKO mice compared to control mice (Extended Data Fig. 3a–c). JunB FKO mice also displayed an increased core body temperature during cold exposure (Fig. 3e). Moreover, JunB depletion significantly upregulated expression of thermogenic/mitochondrial markers UCP1, PGC-1α, TFAM and oestrogen-related receptor alpha (ERRα) in BAT concurrent with a significant increase in the fraction of mitochondria-rich adipocytes (Fig. 3f–h) and the ratio of mitochondrial DNA (mtDNA) to nuclear DNA (nDNA; Fig. 3i) in BAT.
Fig. 3 |. Adipose-specific JunB-deficient ( JunB FKO) mice exhibit enhanced thermogenesis and cold adaptation.
a,b, Expression levels of JunB in protein (n = 3, independent experiments) (a) and mRNA (n = 4 mice per group) (b) in BAT and WAT were notably suppressed by depletion of JunB in adipocytes with little effect on other tissues. Mus, skeletal muscle; Liv, liver; Pan, pancreas; Hyp, hypothalamus; Ctrl, control. c, JunB deficiency enhanced cold-induced oxygen consumption at both light and dark cycles. d, Data analysis of oxygen consumption from c using the CaIR website as described64. e, JunB deficiency prevented the decrease in core body temperature under cold stress conditions. f, JunB deficiency induced mRNA expression of mitochondria and thermogenic markers in BAT compared to controls (n = 6 mice per group). g, Depletion of JunB increased the average copy number of mitochondria and the proportion of high-mitochondria cells in BAT (n = 4 per group). LD, lipid droplet; N, nucleus. h, Quantification of mitochondrial number in individual cells from g. i, JunB deficiency significantly increased the ratio of mtDNA/nDNA (n = 8 mice per group). j, Elimination of JunB+ adipocytes significantly increased oxygen consumption at both light and dark cycles. k, Analysis of oxygen consumption from j using CaIR. Data in e and h were analysed by analysis of variance (ANOVA). The other data were analysed by unpaired two-sided t-test. Data are presented as the mean ± s.e.m. *P < 0.05 or **P < 0.01.
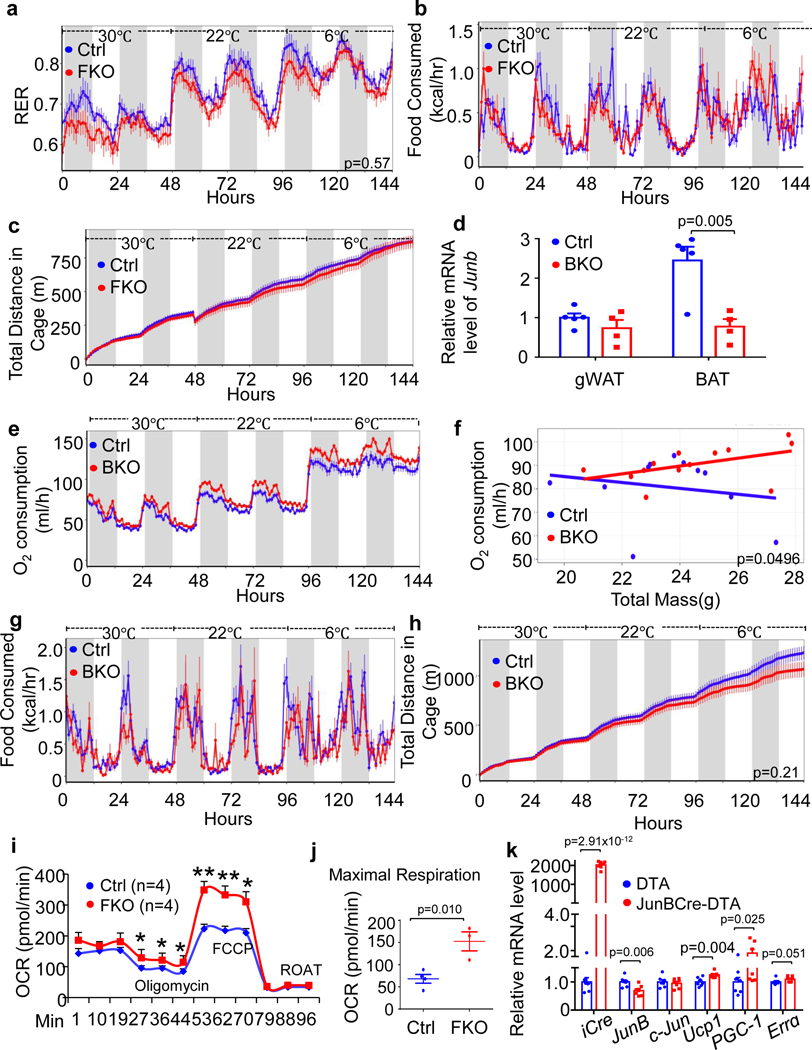
Consistent with this, the mice lacking JunB in UCP1+ cells (JunB BKO) also displayed significantly increased basal and cold-induced O2 consumption with little effect on food intake and a slight decrease in activity (Extended Data Fig. 3d–h). Additionally, JunB deficiency significantly increased the oxygen consumption rate in primary brown adipocytes (Extended Data Fig. 3i,j). Along this line, the elimination of JunB+ adipocytes increased oxygen consumption (Fig. 3j,k) and thermogenic gene expression (Extended Data Fig. 3k) in tamoxifen-treated JunBCreERT2-DTA+ mice compared to the controls. The basal oxygen consumption declined in tamoxifen-treated mice compared to non-treated animals (Fig. 3j,c), which may explain tamoxifen-caused toxicity. These results suggest a critical role for JunB and JunB-expressing adipocytes in regulating BAT function and energy expenditure.
Depleting JunB in UCP1+ cells prevents insulin resistance
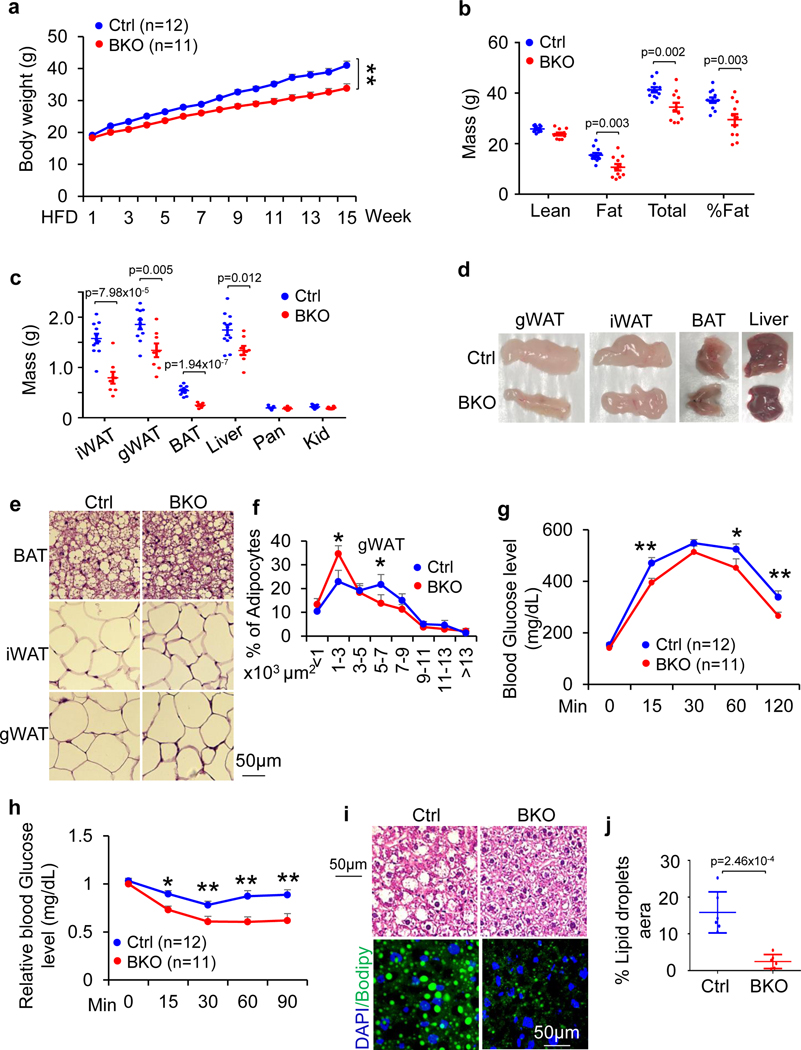
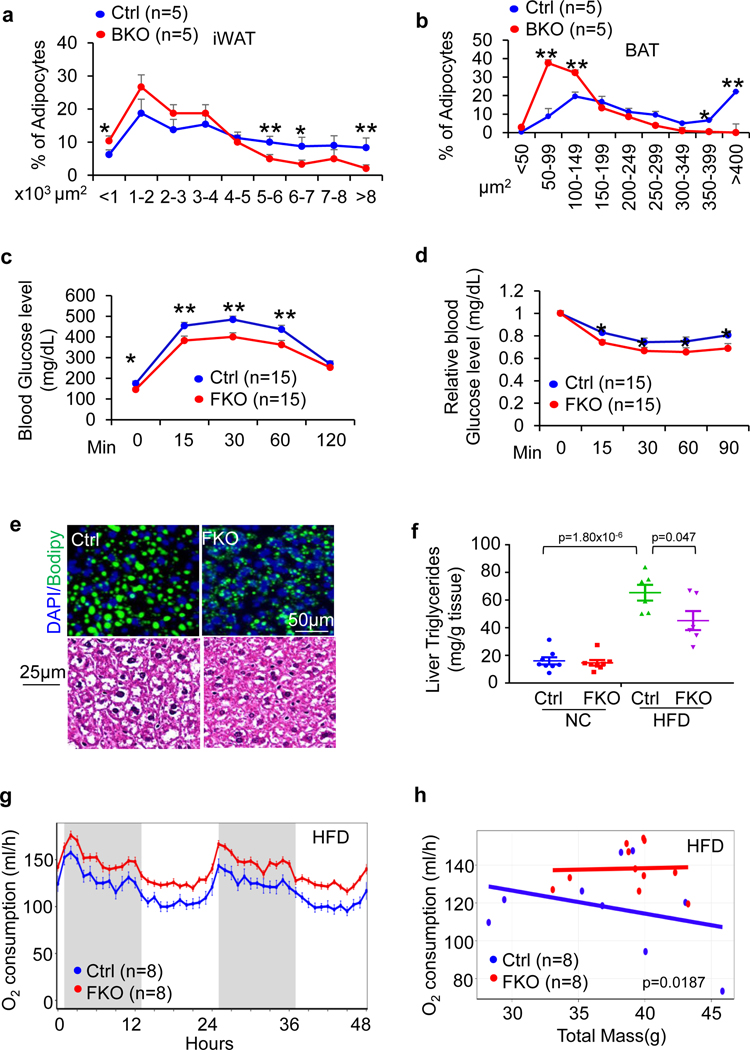
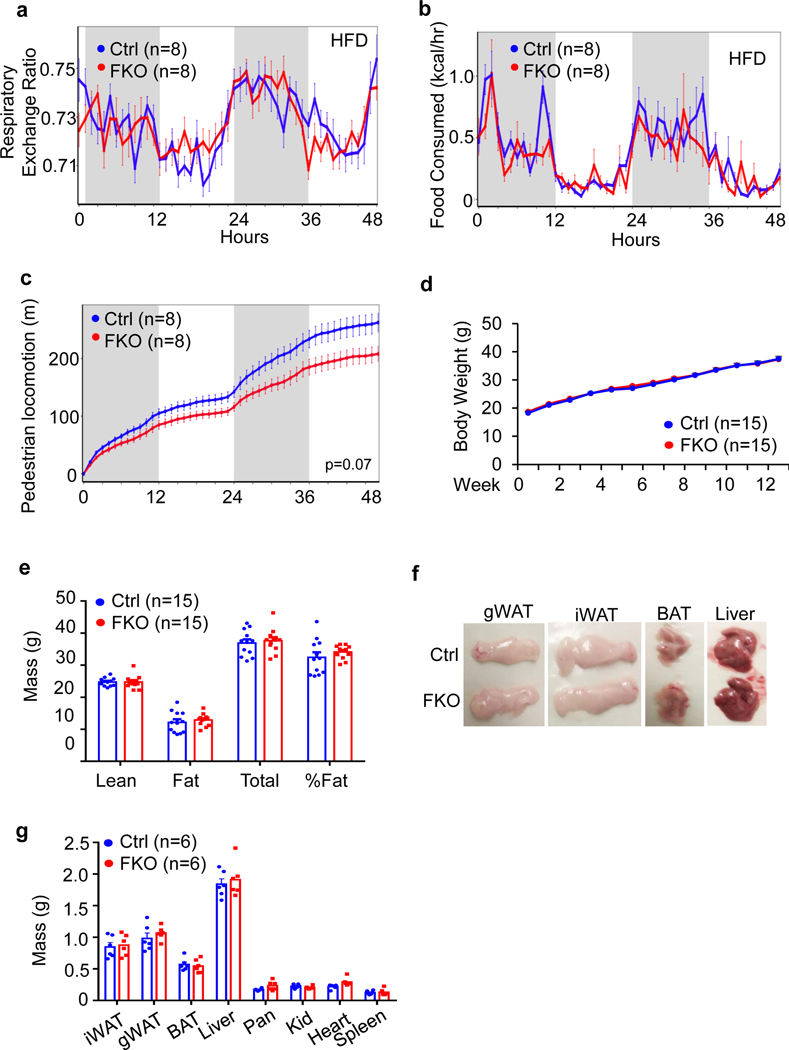
To further investigate the physiological role of JunB in thermogenic adipocytes, 6-week-old JunB BKO and control mice were fed with an HFD for 16 weeks. JunB BKO mice displayed a significant decrease in body mass, fat mass and fat percentage during HFD feeding (Fig. 4a–d). Moreover, adipocyte size in iWAT, gWAT and BAT was decreased by JunB deficiency in UCP1+ adipocytes (Fig. 4e,f and Extended Data Fig. 4a,b). JunB BKO mice exhibited enhanced glucose and insulin tolerance compared to control mice under HFD conditions (Fig. 4g,h), suggesting the improved glucose metabolism after JunB depletion. Consistent with this, diet-induced hepatic steatosis was improved by JunB deficiency in UCP1+ cells (Fig. 4c,d,i,j). Similarly, increased insulin sensitivity and diet-induced hepatic steatosis were improved in JunB FKO mice (Extended Data Fig. 4c–f). The increased energy expenditure was also observed in JunB FKO mice with no significant effect on respiratory exchange ratio or food intake following HFD for 16 weeks (Extended Data Figs. 4g,h and 5a,b). Interestingly, locomotor activities were decreased in HFD-fed JunB FKO mice, although the difference did not reach significance, which may partially explain why the expected protection against obesity is diminished at certain level in FKO mice (Extended Data Fig. 5c–g). These data suggest that JunB serves a critical role in regulating BAT function and systemic metabolic homeostasis.
Fig. 4 |. Specific depletion of JunB in UCP1+ adipocyte ( JunB BKO) enhances energy expenditure and protects against diet-induced obesity and insulin resistance.
Six-week-old male JunB BKO and control mice were fed with an HFD for 16 weeks for the following studies. a, JunB deficiency in UCP1+ cells protected against HFD-induced obesity. b, JunB BKO mice displayed decreased body mass, fat mass and fat percentage compared to control littermates after HFD feeding. The lean mass, fat mass, total mass and fat percentage were measured using dual-energy X-ray absorptiometry (n = 12, control; n = 11, BKO). c, The mass of gWAT, iWAT, BAT and liver was reduced by JunB deficiency after HFD feeding. The organs were weighed after mice were euthanized (n = 11, control; n = 8, BKO). d, Representative images of gWAT, iWAT, BAT and liver in JunB BKO and control mice. e, H&E staining of gWAT, iWAT and BAT of HFD-fed JunB BKO and control mice. f, Quantification of fat cell size of HFD-fed JunB BKO and control mice in e (n = 6 per group). g,h, Depletion of JunB in UCP1+ adipocytes improved glucose tolerance (n = 12, control; n = 11, BKO) (g) and insulin tolerance (n = 12, control; n = 11, BKO) (h). i, JunB BKO mice displayed improved diet-induced hepatic steatosis and fatty liver as reflected in the H&E staining and Bodipy/DAPI immunofluorescence staining. j, Quantification of lipid droplet area in the liver in i (n = 6 per group). Data in a and f-h were analysed by ANOVA. Data in b, c and j were analysed using an unpaired two-sided t-test. Data are presented as the mean ± s.e.m. *P < 0.05; **P < 0.01.
JunB KO induces high-thermogenic adipocyte formation
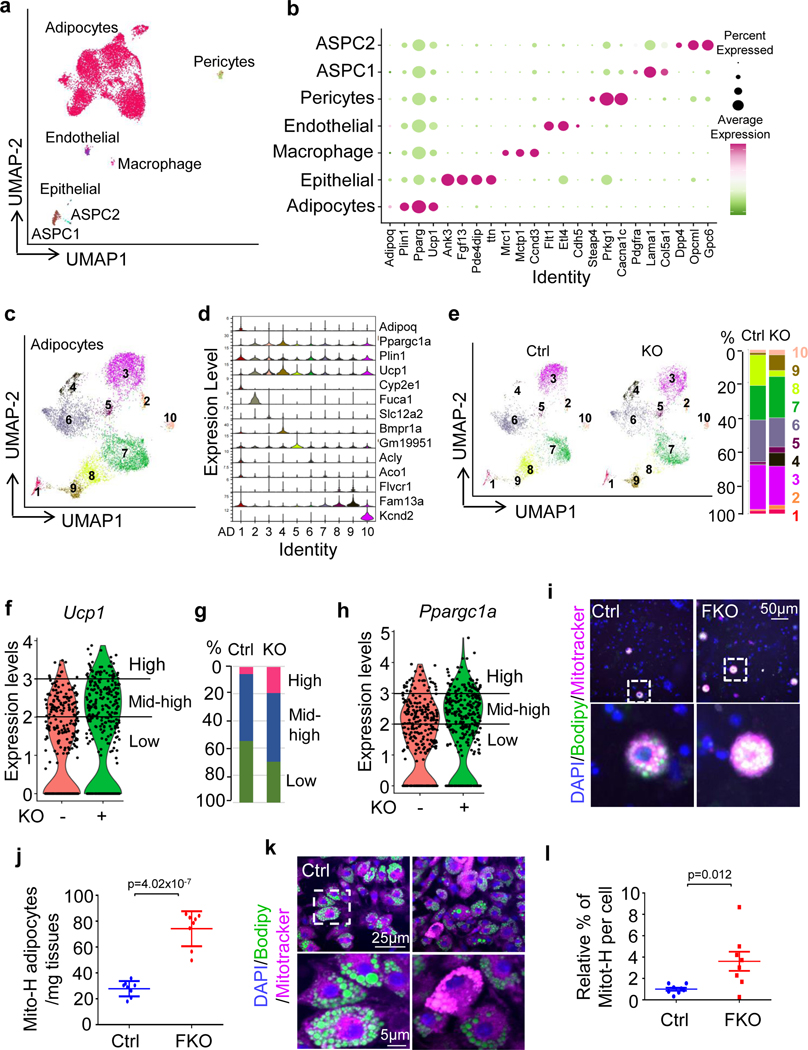
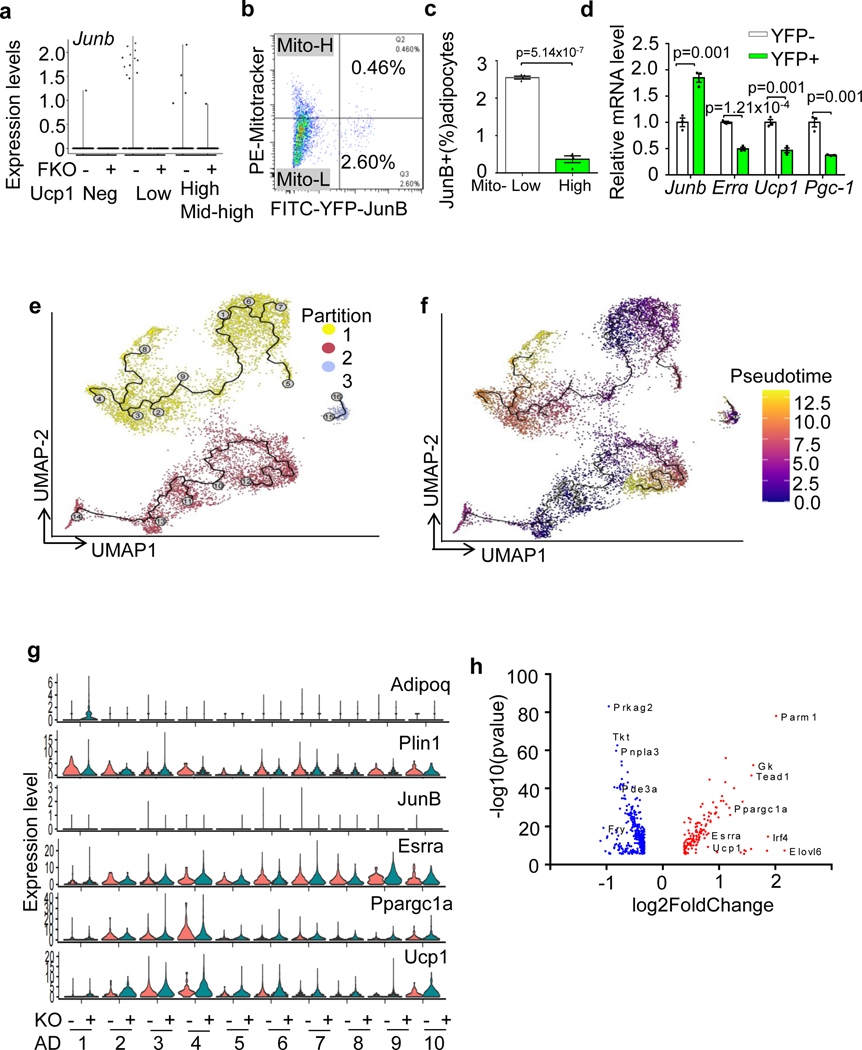
To determine if JunB plays a role in the control of brown adipocyte heterogeneity in thermogenesis, we performed single-nucleus RNA-seq (snRNA-seq) of BAT from JunB FKO and control mice (3-month-old male mice; n = 5 per group) housed at room temperature using the strategy as described (Extended Data Fig. 6a). An integrated analysis and unsupervised clustering of 9,863 nuclei (control = 4,988, KO = 4,875) revealed the dominance of adipocyte clusters and subpopulations of epithelial, macrophage, endothelial, pericytes and adipose stem and progenitor cells, yielding 1,040 genes (median) for control and 913 genes for KO (Fig. 5a,b) as described recently43. Further analysis of adipocytes revealed ten adipocyte clusters (AD1–AD10), based on the gene signature and distinct marker genes (Fig. 5c,d, Extended Data Fig. 6b,c and Supplementary Table 1). The recently discovered Cyp2e1-expressing adipocytes were annotated as the AD1 cluster in our datasets (Fig. 5c,d)14. Among those distinct subpopulations, the average expression levels of Ucp1 and Ppargc1a in the clusters AD2, AD3, AD4 and AD10 were notably higher compared with clusters AD1, AD8 and AD9 (Fig. 5c,d and Extended Data Fig. 6c). Clusters AD5, AD6 and AD7 were intermediate adipocytes with mid-range expression of Ucp1 and Ppargc1α (Fig. 5c,d and Extended Data Fig. 6c). JunB+ cells (3.0% in control sample) were mainly present in the adipocyte fraction with lower thermogenic activities (expression levels < 2 described in Fig. 5f; Extended Data Figs. 6c and 7a). In the agreement with this, primary YFP+ differentiated JunB-expressing adipocytes displayed less mitochondrial content (Extended Data Fig. 7b,c and Supplementary Fig 1c) and lower thermogenic capacity (Extended Data Fig. 7d). In addition, JunB depletion dramatically increased the fraction of the subpopulation with higher average thermogenic markers (AD4) from 0.4% to 8.1% in BAT (Fig. 5e).
Fig. 5 |. JunB deficiency induces a shift of low-thermogenic to high-thermogenic adipocytes in BAT.
a, Uniform manifold approximation and projection (UMAP) plots and seven distinct cell clusters of BAT by unsupervised clustering. ASPC, adipose stem and progenitor cell. b, Dot plot showing the average expression of marker genes for each cluster in BAT. c, UMAP showing the ten adipocyte subpopulations formed by 8,324 nuclei (4,177 for control, 4,147 for KO). d, Violin plots for Adipoq, Ucp1, Ppargc1α and marker genes for each subpopulation of adipocytes. Expression level (y axis) refers to the log-normalized ratio of gene expression reads, normalized to the sum of all reads within each nucleus. e, UMAPs of adipocytes for control and KO BAT and the percentage of each adipocyte fraction in total adipocytes. f, Analysis of UCP1hi, UCP1int–hi and UCP1lo adiponectin-positive cells in JunB KO BAT. −, control; +, FKO. n = 5 per group. g, Quantification of UCP1hi, UCP1int–hi and UCP1lo adiponectin-positive cells in f. h, The fraction of PGC-1αhiadiponectin+ cells was increased in JunB KO BAT. i, The number of high-mitochondrial content cells in an isolated adipocyte fraction was significantly increased in JunB KO BAT. j, Quantification of mitochondriahi adipocytes in i (n = 6 per group). k, JunB deficiency increased the mitochondrial mass indicated by the fluorescence staining of MitoTracker using a high-content cell scanning system. Primary differentiated JunB KO and control brown adipocytes were incubated with 100 nM MitoTracker for 20 min.
l, Quantification of mitochondrial intensity per cell in k (n = 3, independent experiments). Data in j and l were analysed using an unpaired two-sided t-test.
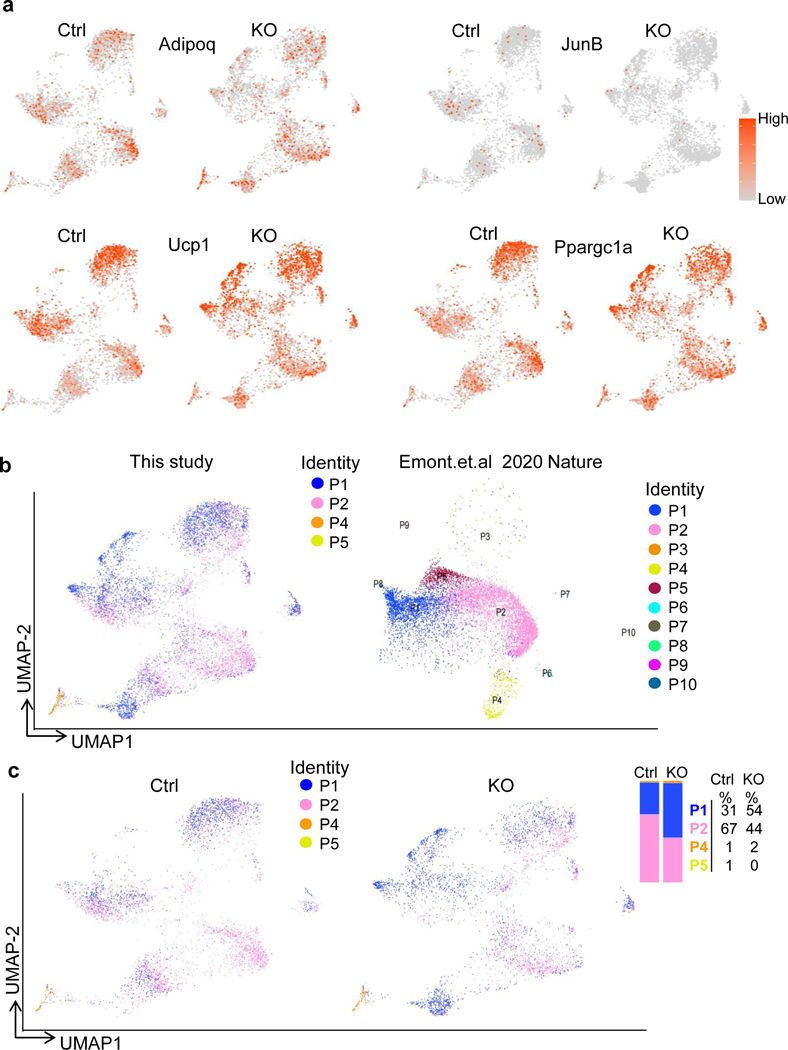
In support of this, the pseudotime trajectories analysis showed three partitions for adipocyte clusters and that each partition was initiated in the JunB-enriched cells with low thermogenic activity and shifted into JunB-negative cells with high thermogenic activity (Extended Data Fig. 7e,f). Furthermore, JunB depletion markedly upregulated expression levels of Ucp1, Ppargc1a and ERRα (encoded by Esrra) in the individual clusters (Extended Data Figs. 7g,h and 8a). By mapping our datasets with the recent BAT snRNA-seq according to ref. 14, we found that those high-thermogenic adipocyte fractions AD2, AD3, AD4 and AD10 appear to be P1 that favours cold stress, while low-thermogenic adipocyte cluster AD1 shared a gene signature with P4, a cluster of adipocytes that is dominant under thermoneutral conditions (Extended Data Fig. 8b). The intermediate adipocytes AD5, AD6 and AD7 and low-thermogenic AD8 are like P2 and associated with room temperature despite that another low-thermogenic cluster, AD9, reflected P1 better (Extended Data Fig. 8b). In addition, JunB KO notably increased the fraction of P1, while it decreased P2 (Extended Data Fig. 8b,c), pointing to a potent inhibition by JunB in the conversion from low-thermogenic to high-thermogenic adipocytes.
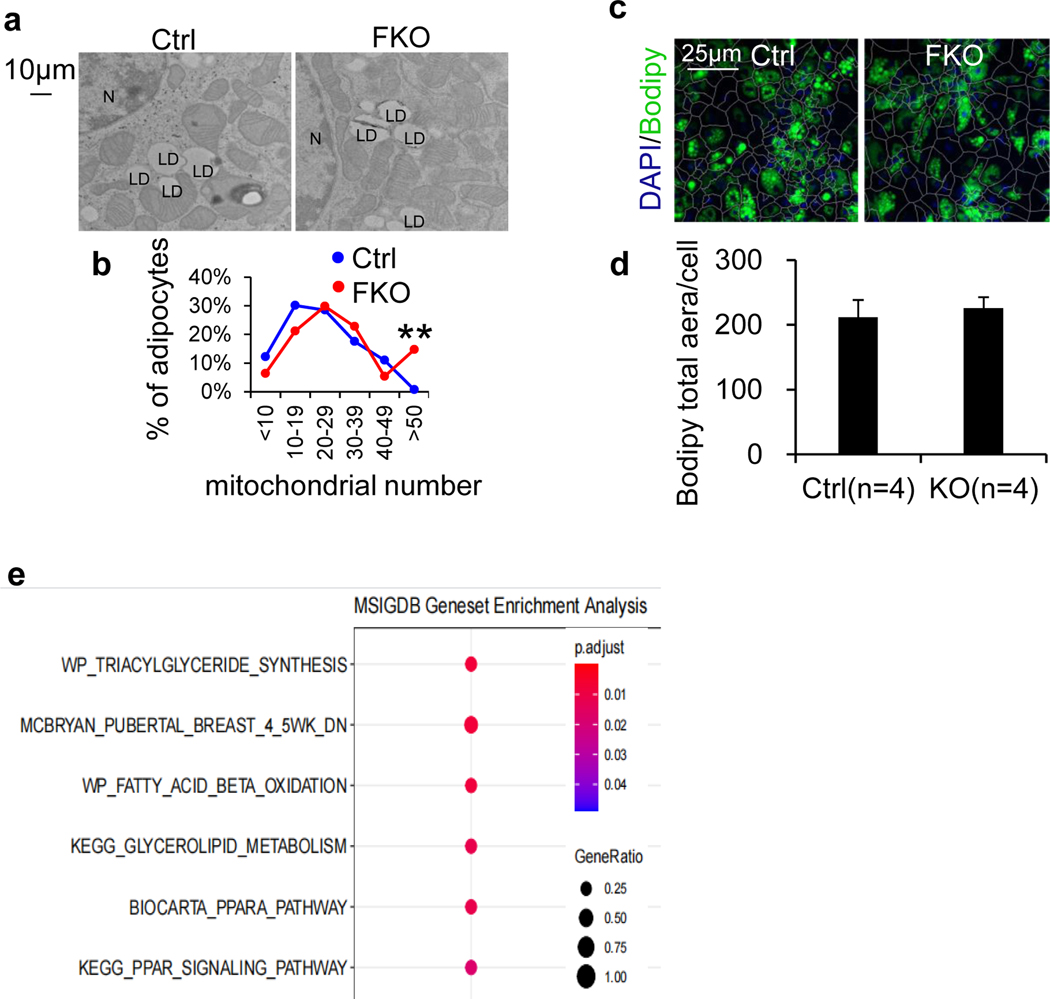
Considering that within each individual cluster, the adipocytes varied in the expression of thermogenic genes (Fig. 5d), we further analysed adiponectin-positive cells that differentially express Ucp1 and Ppargc1a, as we observed in snRNA-seq (Fig. 5d and Extended Data Fig. 6b,c). The adiponectin-positive cells with UCP1hi (≥3), UCP1int–hi (<3 and ≥2) and UCP1lo (<2) were defined as high-thermogenic, mid-high-thermogenic (or intermediate) and low-thermogenic adipocytes, respectively (Fig. 5f–h). In the control BAT, 45.3% of adipocytes are low-thermogenic cells (UCP1lo), 48.9% of adipocytes are mid-high-thermogenic cells (or intermediate) and 5.8% of adipocytes are high-thermogenic cells. However, the depletion of JunB led to a significant increase of high-thermogenic adipocytes from 5.8% to 19.5% and a decrease of low-thermogenic adipocytes from 45.3% to 30.0% despite no significant changes in mid-high (or intermediate) adipocytes (Fig. 5f–h), indicating a shift from low-thermogenic to high-thermogenic adipocytes. The PGC-1αhi adiponectin+ cells were also increased in JunB-deficient BAT (Fig. 5h). In agreement with this, the fraction of isolated primary adipocytes with high-thermogenic activity, presented by mitochondriahi cells with MitoTracker staining, was increased in JunB-deficient BAT compared to controls (Fig. 5i,j). Along these lines, depletion of JunB increased the frequency of mitochondriahi cells indicated by MitoTracker staining (Fig. 5k,l) and electron microscopy (Extended Data Fig. 9a,b) in differentiated primary brown adipocytes. However, JunB deficiency had little effect on adipogenesis (Extended Data Fig. 9c,d). Furthermore, gene-set enrichment analysis of significantly differentially expressed genes also suggested the primary functions of JunB+ adipocytes in the regulation of fatty acid metabolism, glycolysis and mitochondria biogenesis (Extended Data Fig. 9e). These results suggest that JunB plays a critical role in governing adipocyte heterogeneity and thermogenic capacity.
JunB represses thermogenic capacity via the PGC-1α–ERRα axis
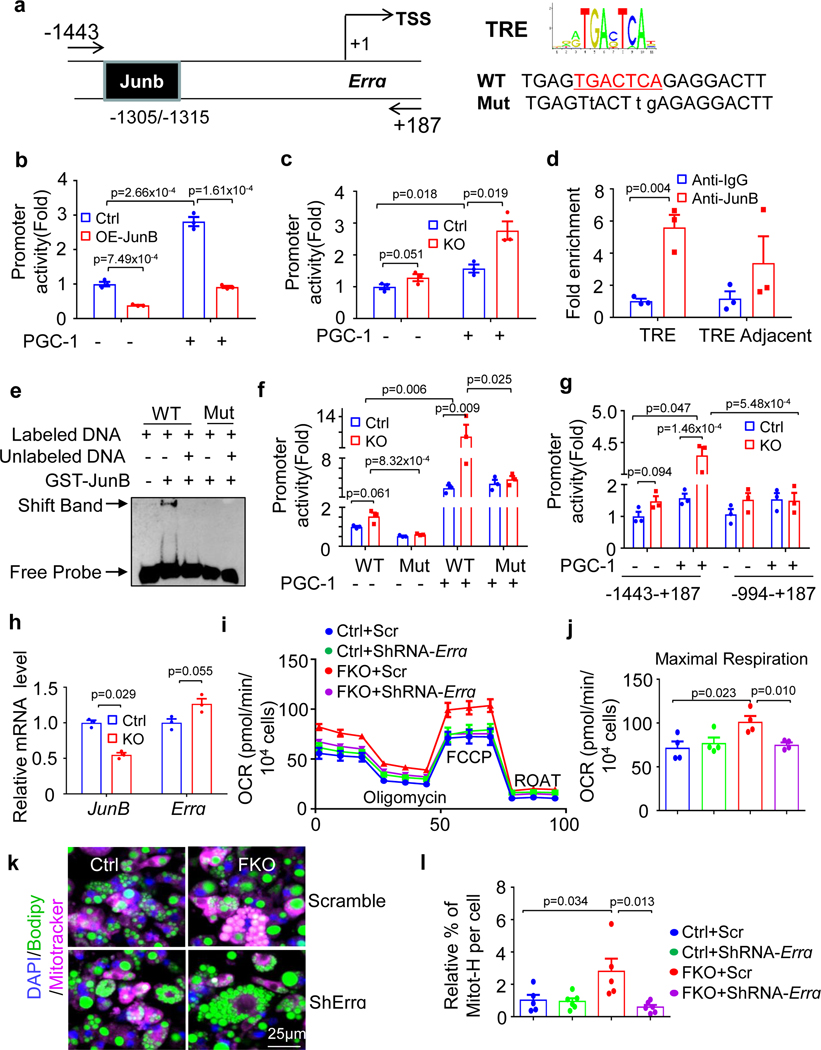
To elucidate the regulatory mechanisms exerted by JunB signalling in high-thermogenic adipocyte formation, a bioinformatic analysis of Ucp1 and mitochondrial master regulators Ppargc1a, Tfam and Errα, was performed using JASPAR (https://jaspar.genereg.net/), a widely used online bioinformatics tool for analysis of the potential binding sites of transcriptional factor44. The results showed that there is a JunB binding site TRE (TGA(C/G)TCA) on the Erra promoter (−1,305 to −1,315) despite no typical TREs on the promoters of Ucp1, Ppargc1a and Tfam (Fig. 6a), implying that JunB may suppress mitochondrial biogenesis by targeting Erra, a downstream effector of PGC-1α that is critical for mitochondrial respiration, oxidative phosphorylation and activation of thermogenic adipocytes45,46. In support of this hypothesis, JunB-deficient BAT displayed an enrichment of high-thermogenic adipocytes with higher levels of Erra as well as Ucp1 and Ppargc1a (Fig. 3f and Extended Data Figs. 7d,g,h and 8a), and overexpressing JunB decreased PGC-1α overexpression-induced luciferase activity of the Erra promoter in HEK293T cells (Fig. 6b). In contrast, knockdown of JunB increased basal and PGC-1α overexpression-induced luciferase activity of the Erra promoter in primary preadipocytes (Fig. 6c). Chromatin immunoprecipitation (ChIP) assays further verified that JunB can bind to the Erra promoter region (−1,305 to −1,315) containing the TRE site in BAT (Fig. 6d), and an electrophoretic mobility shift assay (EMSA) showed the direct interaction between JunB and Erra promoter region (−1,305 to −1,315; Fig. 6e). Consistent with this, the enhanced PGC-1α-mediated activation of the Erra gene by JunB deficiency was abolished by TRE site mutation (Fig. 6f) or TRE site depletion (Fig. 6g) of the Erra promoter. In support of this, the expression level of ERRα was significantly increased in JunB-suppressed preadipocytes (Fig. 6h). Moreover, knockdown of ERRα using shRNA abolished JunB deficiency-induced oxygen consumption and maximum respiration (Fig. 6i,j) and increased the frequency of mitochondriahi cells (Fig. 6k,l) in primary differentiated brown adipocytes. These results indicate that JunB suppresses high-thermogenic adipocyte formation by directly binding to the Erra promoter and substantially targeting the PGC-1α–ERRα axis.
Fig. 6 |. JunB suppresses the formation of high-thermogenic adipocytes by binding to PGC-1α effector ERRα.
a, Schematic showing the JunB binding site TRE (TGA(C/G)TCA) on the Erra promoter at the −1,305/−1,315 region. TSS, transcription start site. b, Overexpression of JunB suppressed basal and PGC-1α-induced activation of the Erra promoter in HEK293T cells (n = 3, independent experiments). c, Knockdown of JunB increased basal and PGC1α-induced activation of the Erra promoter in primary preadipocytes (n = 3, independent experiments). d, ChIP assay showed that JunB bound to the Erra promoter in BAT (n = 3 mice per group). e, The EMSA showed the direct interaction between JunB recombinant protein and DNA probe of the Erra promoter at the −1,305/−1,315 region (n = 3, independent experiments). WT, wild type. f,g, The ability of JunB to induce basal and PGC-1α-induced Erra gene activation was blocked when the TRE site was mutated (n = 3, independent experiments) (f) or TRE site was depleted (n = 3, independent experiments) (g) on the luciferase reporter of the Erra promoter. h, Suppressing JunB increased the mRNA of ERRα in primary preadipocytes. i–l, Suppressing ERRα abolished increased oxygen consumption (n = 3, independent experiments) (i), maximum respiration capacity (n = 3, independent experiments) (j) and mitochondriahi adipocytes (k and l) (n = 3, independent experiments) in JunB KO differentiated brown adipocytes. Data were analysed using an unpaired two-sided t-test. OCR, oxygen consumption rate.
Knockdown of ERRα in BAT abrogates JunB deficiency-induced high-thermogenic adipocyte formation and energy expenditure
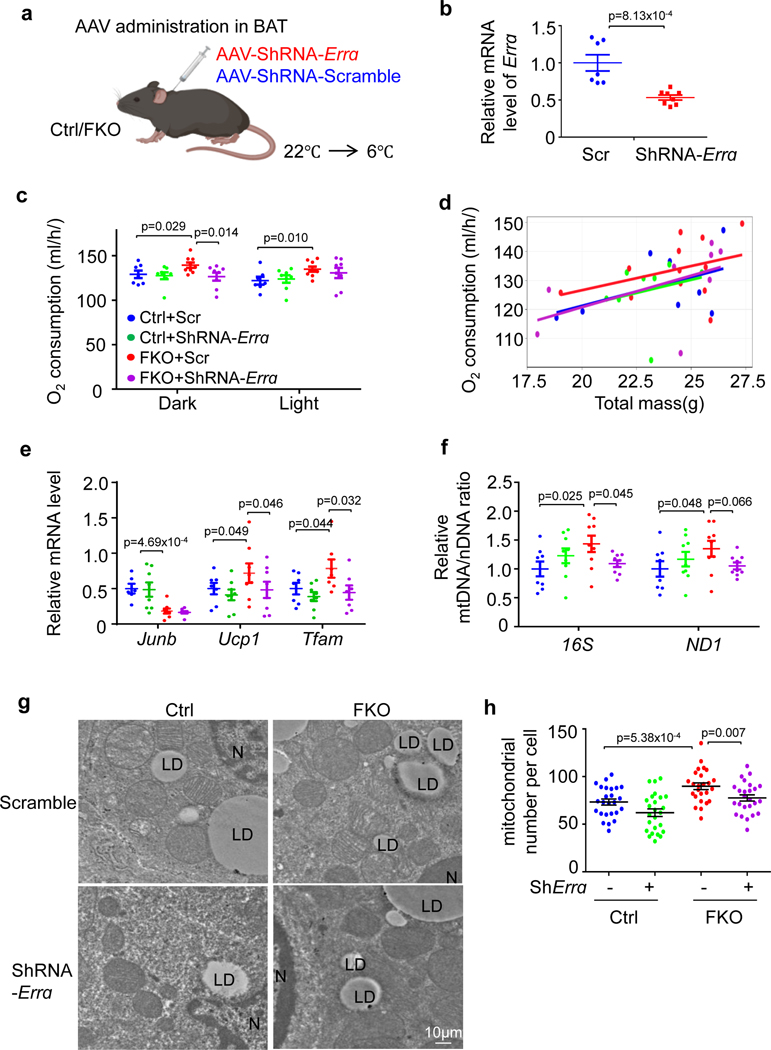
To dissect the role of ERRα in JunB suppression of high-thermogenic adipocyte formation, we administered adeno-associated virus (AAV)-ShRNA-ERRα (10 μl of 1013 viral genomes per millilitre) or scramble virus into the BAT of JunB FKO and control mice and performed metabolic phenotyping 3 weeks following injection (Fig. 7a). The administration of AAV-ShRNA-ERRα significantly suppressed ERRα expression in BAT as shown by quantitative PCR (qPCR; Fig. 7b). Consistent with the in vitro study (Fig. 6i,j), JunB deficiency-increased energy expenditure was compromised when ERRα was suppressed in BAT under cold stress conditions in vivo (Fig. 7c,d). In addition, suppressing ERRα attenuated cold-induced expression levels of UCP1 and TFAM in JunB-deficient BAT (Fig. 7e) and the ratio of mtDNA/nDNA (Fig. 7f). Moreover, the increased mitochondrial content was partially reversed by suppression of ERRα in JunB KO primary adipocytes (Fig. 7g,h), suggesting that JunB appears to suppress thermogenic capacity and energy expenditure via an ERRα-dependent mechanism.
Fig. 7 |. JunB suppresses BAT mitochondrial biogenesis and energy expenditure through ERRα in vivo.
a, Diagram of the following animal study. Created with BioRender.com. b, Administration of AAV-shRNA-Errα into BAT significantly suppressed ERRα expression compared to scramble group in JunB FKO mice (n = 7, control; n = 8, FKO). c, JunB deficiency-induced cold-induced oxygen consumption was compromised when ERRα was suppressed under cold stress conditions (n = 8 per group). d, Data analysis of oxygen consumption from c using CaIR software64 (n = 8 per group). e, The upregulated expression levels of UCP1 and TFAM were attenuated by Errα suppression in JunB KO BAT under cold stress conditions (n = 8 per group). f, The increased ratio of mtDNA/nDNA was diminished by Errα suppression in JunB KO BAT after cold stimulation (n = 8 per group). g, Suppressing ERRα partially reversed the increase in mitochondrial copy number in JunB-deficient BAT. h, Quantification of mitochondrial copy number in g (n = 5 per group). Data were analysed using an unpaired one-sided t-test.
Discussion
Studies in humans and rodents have highlighted the beneficial effects of BAT on cardiometabolic health4,47. As such, BAT has become a valuable area of research for understanding and treating obesity and its related disorders48,49. BAT is composed of heterogeneous adipocyte populations including low-thermogenic adipocytes (low in mitochondrial content and UCP1) and high-thermogenic adipocytes10,12–14. However, the mechanisms underlying adipocyte heterogeneity and the significance of these subpopulations in metabolism and disease remain poorly defined. Our studies uncover a mechanism involving JunB that integrates inflammatory and metabolic signals and suppresses the conversion from low-thermogenic to high-thermogenic adipocytes through the PGC-1α–ERRα pathway. Our present study also demonstrated a distinct subpopulation of thermogenic adipocytes that expresses JunB and is associated with obesity and inflammation, representing a noncanonical subpopulation of adipocytes that contributes to energy and metabolic health.
As an activator protein 1 family member (Fos, FosB, Fra1, C-Jun, JunB and JunD), JunB is induced by the cAMP–PKA–CREB pathway in various cell types50. JunB regulates downstream target gene transcription by binding to two consensus-specific DNA regulatory elements, namely, TREs TGA(C/G)TCA and cAMP-responsive elements (CREs, CREB binding sites) TGACGTCA, in hepatocytes and cancer cells26. We have shown that activation of JunB provides a negative regulatory mechanism on the β3-adrenoceptor-mediated thermogenic programme by targeting the PGC-1α–ERRα axis. Although there is no canonical JunB binding site TRE on Ucp1 and Ppargc1a promoters, the Errα promoter (−1,443 to +187) contains a TRE site based on our bioinformatics analysis. Through binding to this site, JunB suppresses Erra gene activity and antagonizes the stimulatory effects of PGC-1α–ERRα on thermogenesis and mitochondria biogenesis. The induction of JunB and JunB+ adipocytes also provides a potential mechanism by which pro-inflammatory cytokines suppresses thermogenesis.
JunB is selectively expressed in BAT rather than iWAT and gWAT (Fig. 1). Despite that JunB is involved in the control of adipogenesis in bone marrow and lipolysis in adipose tissue33,51, little is known about whether JunB plays a direct role in regulating thermogenesis. JunB directly binds to the promoter of Erra, a potent mediator of the PGC-1α pathway, and suppresses Erra gene activity in brown adipocytes, therefore antagonizing the effect of PGC-1α–ERRα on thermogenesis and mitochondrial function (Fig. 7). JunB has previously been characterized as a cAMP-responsive gene and is best known for its role in transcriptional control of cell proliferation and differentiation52–54. The antagonizing effects of JunB on thermogenesis suggest a potentially negative feedback mechanism on cold-induced thermogenesis at the transcriptional level, blocking high-thermogenic adipocyte formation. On the other hand, mTORC1 shows distinct regulatory effects on thermogenesis and energy expenditure in BAT and WAT36,37, and its inducing effects on BAT thermogenic programming may be partially mediated by JunB (Extended Data Fig. 1a,b).
In addition to shaping thermogenic adipocyte heterogeneity, JunB is likely involved in the early determination of differentiation in preadipocytes. This notion is supported by the high enrichment of JunB in preadipocytes and substantial declines during adipogenesis (Extended Data Fig. 2d,e). Moreover, whether JunB-expressing adipocytes originate from JunB-expressing preadipocytes is still a mystery. In addition, a third type of inducible adipocytes known as beige (or brite) adipocytes exist in iWAT and possess abundant cristae-dense mitochondria and multilocular lipid droplets, giving them an adaptive thermogenic function48,55. While BAT and beige fat share some APC markers, including EBF2, PGDFRα, CD34, CD24 and DPP4 (refs. 56–58), it is unclear whether JunB+ adipocytes have a distinct cellular origin compared to the current existing adipocyte subpopulations that reside within BAT and iWAT. The open questions regarding the identity, origin and development of JunB+ adipocytes necessitate future characterization.
The variation in UCP1 expression for the human neck fat has been widely considered4,59. In the current study, only a limited number of female participants were included. The detected differences are rather small, and replication is necessary before final conclusions can be drawn. We did not observe large variation on the UCP1 protein levels among these three control samples, although the variation of UCP1 in obese samples was slightly larger. One possibility is the limited number of samples in the present study. Another possible factor is the preselection, which excluded those individuals with related medical conditions such as diabetes in the present study. Therefore, we analysed available datasets, and the results also show a positive association between JunB mRNA levels in human neck fat and BMI14 (Fig. 1e,f).
In summary, this study uncovers a noncanonical subpopulation of adipocytes that express JunB with higher abundance in obesity. The aberrant induction of JunB is a checkpoint of impaired BAT function by shaping thermogenic adipocyte heterogeneity. As a transcriptional regulator, JunB integrates inflammatory and metabolic signals and governs the interconversion of low-thermogenic and high-thermogenic adipocytes via the PGC-1α–ERRα pathway-dependent mechanisms. The use of male mice for all the animal studies is a limitation of the study. These results provide insight into the biology of brown adipocytes and a solid foundation to aid in the development of therapeutic interventions for obesity, inflammation and its associated disorders.
Methods
The present studies received approval by the local ethics committees (Animal Care Committee and Institutional Biosafety Committee at the University of New Mexico Health Sciences Center) and complied with all relevant ethical regulations. All studies were conducted according to the relevant guidelines and regulations. All animal experimental protocols were reviewed and approved by the Animal Care Committee.
Reproducibility and transparency
For in vitro studies, a minimum of three independent experiments were conducted with triplicate measures for each experimental data point. For in vivo studies, we used age-matched littermates and included at least 8–10 mice from each genotype for each experimental condition. The mice were age and weight matched with no evidence of ill health unless the information is specified in some studies. To reduce bias in animal studies, the groups were coded, and the investigators were blinded to groups for in vivo and tissue analysis. All publications resulting from the work provided full and transparent descriptions of the methods and experimental design to ensure reproducibility of the results. Data distribution was assumed to be normal, but this was not formally tested.
Plasmids
The mouse Junb coding sequence was cloned into the pCDNA3.1B-Myc vector at the BamHI and XbaI sites and into pGEX-4T-1 vector at EcoRI and XhoI, respectively. The PGC-1α plasmid was kindly provided by E. Rosen at Harvard University. The mouse Errα promoter (−1,443/+187) named as pGL3-Errα was amplified from mouse genome DNA and inserted into the EcoRI and HindIII sites of pGL3-basic (Promega), and pGL3-Erra-Mut (−1,305/−1,315-TtACTtgA) was obtained through site-directed mutagenesis.
Generation of adipocyte-specific JunB-deficient, JunBCreERT2 knock-in, JunBChaser-YFP and JunBCreERT2-DTA+ mice
Adipose-specific JunB KO ( JunB FKO) mice were generated by crossing Junb-floxed ( Jackson Laboratory, stock no. 012369) and Adipoq-cre mouse (Jackson Laboratory, stock no. 010803), and UCP1+ adipocyte-specific JunB KO (JunB BKO) mice were generated by crossing Junb-floxed mice with Ucp1-cre mice (Jackson Laboratory, stock no. 024670). The strategy for the generation of mice was described in the genomic structure (Extended Data Fig. 2a). An internal ribosome entry site fused to a CreERT2 gene was inserted downstream of the internal stop codon of Junb (Extended Data Fig. 2a). To ablate JunB+ adipocytes in vivo, Adiponectin-Flex-DTA mice (kindly provided by Y. Chen at Tulane University) were crossed with JunBCreERT2 mice to generate JunBCreERT2; adiponectin-Flex-DTA mice (named as JunBCreERT2-DTA+ mice). JunB+ adipocytes were ablated after tamoxifen (no. 13258, Cayman) administration via intraperitoneal injection at the dose of 100 mg per kg body weight for 3 d (ref. 60). The adiponectin-Flex-DTA mice treated with tamoxifen were used as controls. After a 48-h recovery, mice underwent metabolic phenotyping. AdipoChaser-YFP or JunBChaser-YFP mice were generated by crossing Rosa26-EYFP mice (kindly provided by T. Yia Vue at UNM) with Adipoq-cre (Jackson Laboratory, stock no. 010803) or JunBCreERT2 mice, respectively. The generation of AdipoChaser-GFP (adiponectin rtTA;Tre Cre;R26RmT/mG) mice was described previously13. Ten-week-old male mice were used for the studies unless otherwise stated. Six-week-old mice were fed with NC (Teklad Diets, 2920X) or HFD with 45% kcal from fat (Research Diets, D12451) for up to 16 weeks. All animals were housed in a pathogen-free barrier facility at 22.0–22.5 °C, 50–60% humidity and a 12-h light/12-h dark cycle with food and water ad libitum.
Human study
Participants were identified before undergoing anterior cervical spine surgery, before undergoing parathyroidectomy or before undergoing thyroidectomy (18–60 years old for both male and female participants), and then were recruited in the ENT clinic at time of consent for primary surgery. Participant’s BMI was <25 (lean), >25 and ≤30 (overweight), or >30 (obese), and the participant information for sex, age and BMI is included in Supplementary Table 2. Ten participants were recruited into this study. Samples 1–8 were used for the western blot analysis, and samples 9–10 were paired (1 male and 1 female) for the primary culture study in our recent study37. This study has been reviewed and approved by Human Research Review Committee at UNMHSC. Around 5–10 μg neck fat was collected during anterior cervical spine surgery, parathyroidectomy or thyroidectomy.
Inclusion criteria were: English and/or Spanish speaking, male and female adults undergoing anterior cervical spine surgery, parathyroidectomy or thyroidectomy (18–60 years old), who are able to sign the consent form. Both male and female participants will be included in the proposed studies and the data will be analysed based on the sex.
Exclusion criteria were: bleeding diathesis, known allergy to any study medication including sedatives or analgesics, coagulopathy (the international normalized ratio of 1.5 or greater, platelet count of <50,000 per microlitre), pregnant women, prisoner, use of anticoagulant medication or diabetes mellitus (type I or II).
ChIP assay
Primary brown preadipocytes were lysed followed with sonication until DNA fragments of 200–1,000 bp were achieved. Sonicated solution was diluted for immunoprecipitation using an anti-JunB (ABclonal) antibody or IgG as the control. The amount of precipitated DNA was detected by semiquantitative PCR using the primer pairs TRE-F: 5′-GTAGGCACAGGCCGACTCAA-3′ and TRE-R 5′-GGAGTGAAGCAAAGCTACCCA-3′; TRE-Adjacent-F: 5′-TGTGGTTCCTCAAATGGGGG-3′ and TRE-Adjacent-R: 5′- CGCTTCCTGATCCCTTCGAT-3′.
Primary culture, differentiation and treatment of brown adipocytes
Primary SVFs were isolated from brown fat depots of 3-week-old mice, cultured and differentiated into adipocytes37. The SVFs of cells were seeded in a 12-well plate and started to be differentiated by adding induction medium containing 2 mg ml−1 dexamethasone, 0.25 mM IBMX and 0.125 M indomethacin for 72 h, following with differentiation medium containing 1 μM T3 and 20 μM insulin for 48 h. On day 6, primary differentiated adipocytes were treated with 20 ng ml−1 TNF (BioLegend, 575204) or 20 ng ml−1 IL-6 (BioLegend, 575702) for 24 h. Cells were then harvested for the extraction of RNA and protein or used for the staining.
Immunofluorescence staining
Adipose tissue samples were fixed and then processed into paraffin-embedded serial sections at 7 μm. Slides were stained with primary antibodies against GFP (1:500 dilution), perilipin 1 (Plin1; 1:500 dilution) or JunB (1:100 dilution) and followed with second antibody, and then mounted. The images were captured using the EVOS FL Cell Imaging System and analysed with ImageJ. For quantification of GFP+, YFP+ or JunB+ adipocytes, 10–12 images in each tissue sample were randomly chosen and underwent analysis. Microscopic images (×20 objective) were taken, and JunB+ adipocytes within each image were counted. For cell studies, primary preadipocytes or differentiated adipocytes were seeded in 96-well plates and fixed. Cells were then stained with primary anti-JunB (1:100 dilution), anti-Plin1 (1:500 dilution), anti-GFP (1:500 dilution) and/or anti-PDGFRA (1:100 dilution) followed with secondary antibodies (1:1,000 dilution) for 60 min, DAPI (1:1,000 dilution) and Bodipy (1:2,000 dilution). High-content microscopy with automated image acquisition and quantification was carried out using a Cellomics HCS scanner and iDEV software. All data collection, processing (object, region of interest and target mask assignments) and analyses were performed by software, independently of human operators.
BAT nuclei isolation and snRNA-seq analysis
Brown fat depots were collected from 10-week-old JunB FKO and control mice. Tissue samples were minced into 1 mm3pieces, homogenized in Nuclei EZ Lysis Buffer (NUC101, Sigma-Aldrich) with pre-chilled Dounce homogenizer. The homogenate was filtered using a 40-μm cell strainer (VWR, 76327–098). After centrifugation, the pellet was washed, resuspended and stained with DAPI, and the single and health nuclei were isolated using sorting. Reconstituted nuclei with a concentration of 700–1,200 nuclei per microliter were used for sequencing14. Single-nuclei RNA libraries were prepared according to the Chromium Single Cell 3′ Reagent Kits v2 User Guide (10x Genomics). Approximately 10,000 cells were loaded on a Chromium single Cell Controller Instrument (10x Genomics) to generate single-cell gel beads in emulsion. The barcoded sequencing libraries were constructed using the Chromium Single-Cell 3′ Library Kit (10x Genomics) for enzymatic fragmentation, end-repair, A-tailing, adaptor ligation, ligation cleanup, sample index PCR and PCR cleanup. Libraries were sequenced with the NovaSeq System with a depth of 50,000 to 100,000 reads per targeted cell. Raw sequencing data were processed using the 10x Genomics Cell Ranger Pipeline (version 2.0) to generate FASTQ files and aligned to the mm10 genome sequence file in the gene expression count.
Knockdown of Errα in brown fat and brown adipocytes
Ten-week-old JunB FKO and control mice underwent surgery for intra-BAT administration. A longitudinal incision at the interscapular region was performed followed by six injections with 10 μl of 1013 viral genomes per millilitre AAV that encoded shRNA of mouse Erra AAV8MP(VB220123–1046bap) or scramble shRNA AAV8MP(VB220126–1419adq) (VectorBuilder) into the brown fat depot. Mice were euthanized 21 d after virus administration. For the cell study, constructs encoding Erra, or scramble shRNA, were introduced into day-5 differentiated primary brown adipocytes using the Neon Transfection System18. Cells were then seeded in the Seahorse plate at a density of 20,000 cells per well for the respiration analysis.
MitoTracker staining of primary adipocytes
Primary differentiated JunB KO and control adipocytes were treated with 100 nM MitoTracker for 20 min. The mitochondria in live cells were assessed by quantifying MitoTracker Red CMXRos (M7512, Thermo Scientific) using automated high-content imaging and analysis. The average MitoTracker Red intensity was identified and counted by the system. In brief, 2,000 primary objects were randomly selected by the machine and counted by DAPI in each well. Adipocytes were determined by Bodipy area, and MitoTracker signal in each single cell was calculated by average intensity. Quantification of MitoTracker intensity was normalized by each field per well.
Transmission electron microscopy
For BAT, tissue samples were collected from 10-week-old mice either exposed or unexposed to cold stress for 2 d. For adipocytes, day-6 differentiated primary adipocytes were seeded on the coverslip. Tissue or cell samples were fixed, stained in 1% uranyl acetate, and dehydrated in a graded series of ethanol. The cell sample was then infiltrated with Epon-Araldite resin, embedded and heat-cured. After being mounted, samples were post-stained for imaging. Three images per cell were taken. For the quantification, the total number of mitochondria in the defined areas (272,475 μm2 per cell) was counted and analysed using the average number in each area. The number of mitochondria was expressed as the number of mitochondria and lysosomes per nucleus.
Analysis of mtDNA/nDNA ratio in BAT
Brown fat samples (10 mg) were collected from 10-week-old JunB FKO and control mice and used for DNA isolation. About 20 ng DNA was used for the qPCR analysis, and the ratio of mtDNA/nDNA was calculated using the copy number of mtDNA genes ND1 and 16S normalized against the nDNA hexokinase gene (HK)61.
Luciferase reporter assays
HEK293T(CRL-3216) cells from the American Type Culture Collection were cultured in 24-well plates and introduced with constructs that encode PGC-1α, JunB, luciferase reporter and pSV-β-galactosidase control vector (E1081, Promega) with Lipofectamine 3000 Transfection Reagent (L3000–008, Thermo Fisher). After 48 h, cells were harvested for the measurement of the luciferase with the Luciferase Assay Kit (Promega) and for the analysis of β-galactosidase activities using a Turner TD20/20 luminometer. The luciferase activity was normalized by β-galactosidase activity. To study the effect of JunB on the promoter activity of Erra, primary brown preadipocytes isolated from JunB-floxed BAT were transfected with reporter construct along with PCDNA3.1B or PCDNA3.1B-Cre, pcDNA-PGC-1α with pSV-β-galactosidase expression vector using electroporation with Neon Transfection System62. Cells were harvested and measured using the Luciferase Reporter assay system 48 h after transfection. For the luciferase assay, three independent experiments were performed with triplication in each single experiment37.
EMSA
The recombinant GST-JunB protein was expressed and purified. The specific DNA probes covering JunB binding sites in the Erra promoter region were synthesized and labelled with biotin at the 3′ end. The sequences of specific DNA probes WT (sense: 5′−3′AGTGAGTGACTCAGAGGACTT, anti-sense: 5′−3′AAGTCCTCTGAGTCACTCACT) and Mut (sense: 5′−3′AGTGAGTtACTtgAGAGGACTT; anti-sense: 5′−3′AAGTCCTCTcaAGTaACTCACT). Following the manufacturer’s instructions of the EMSA/Gel-Shift Kit (Beyotime), the binding reaction was carried out in a mixture containing 2 pmol biotin-labelled wild-type or mutated DNA sequences and 5 μg GST-JunB in 15 μl of binding buffer with or without unlabelled DNA probes for 30 min at room temperature. The reaction mixtures were loaded onto a 4% non-denatured gel at 100 V for 60 min and transferred onto nylon membrane to perform chromogenic reaction.
Seahorse assays
Primary preadipocytes from brown fat were cultured and differentiated into adipocytes. The differentiated adipocytes were then cultured in a plate with XF Assay media from Seahorse Bioscience. Seahorse XF24 Extracellular Analyser injection ports were loaded with oligomycin at a final concentration of 1.5 μM for 24 min followed by the addition of carbonyl cyanide p-[trifluoromethoxy ]-phenyl-hydrazone (FCCP) at a final concentration of 1.0 μM for 24 min. After FCCP measurements, rotenone was added in for another 24 min to achieve a 0.5 μM final concentration. Oxygen consumption rate was normalized by the cell number scanned using Cytation in each well.
Isolation of primary high-thermogenic adipocytes
Brown fat tissues were collected from 10-week-old JunB FKO and control mice exposed to cold stress (6 °C) for 4 d. In brief, tissue samples (100 mg) were minced into small pieces and digested in collagenase/Dispase buffer (17703034, Gibco) with water bath shaking at 70 r.p.m. and 37 °C for 1 h. The cell suspension was filtered through a 200-μm nylon filter (146487, Spectrum) to remove undigested tissues. The cell fraction in the pellets was collected as the fraction of high-thermogenic adipocytes13. The cell fraction was cultured in 96-well plates for cell counting after staining with DAPI/Bodipy/MitoTracker for the imaging using Cellomics.
Body composition
Ten-week-old mice were anaesthetised by intraperitoneal injection with ketamine–xylazine. Bone mineral density, fat mass, lean mass and percentage of fat were determined using dual-energy X-ray absorptiometry (GE Medical Systems).
H&E and Bodipy staining
For H&E staining, adipose tissues from 10-week-old mice were fixed with 4% formalin for 48 h and embedded in paraffin. Tissue sections (5-μm thick) were stained with H&E according to standard protocols and then analysed using the National Institutes of Health ImageJ software. For Bodipy staining of liver tissue, frozen tissue sections (6-μm thick) were fixed and stained with Bodipy (1:1,000 dilution) for 5 min. Slides were mounted with mounting medium using DAPI, and images were taken using EVOS FL Cell Imaging System.
Liver triglyceride content
Frozen liver tissue samples (100–300 mg) were digested using 350 μl potassium hydroxide (2:1 ratio of ethanol:30% potassium hydroxide) at 55 °C overnight. The solution (1:1 ratio of H2O:ethanol) was added into the tissue sample 1,000 μl of total volume followed with centrifugation. In total, 200 μl supernatant was mixed with 215 μl of 1 M MgCl2 and chilled on ice for 10 min. After centrifugation, the supernatant was used for the measurement of free glycerol levels using Free Glycerol Reagent (Sigma-Aldrich, F6428) to reflect triglyceride content, according to the protocol63.
Energy expenditure
The 10-week-old mice were individually housed in eight separate Promethion Metabolic Phenotyping Systems (Sable Systems International) coupled with a temperature-controlled chamber. Oxygen consumption (VO2), carbon dioxide release (VCO2), food intake, water intake and the activity of each animal were monitored at room temperature (22 °C) for 72 h, then in cold stress conditions (6 °C) for 7 d. The data were analysed using CaIR (version 1.3; https://calrapp.org/)64.
Telemetry study
The Mini-Mitter Telemetry System was used for the measurement of core body temperature in JunB FKO and control mice35. Briefly, a Mini-Mitter implantable biotelemetric thermosensor was surgically implanted into the peritoneal cavity of 10-week-old male mice. Ten days after surgery, mice were individually housed in the cage with free access to food and water at room temperature (22 °C) for 12 h (08:00 to 20:00) followed by exposure to cold stress (6 °C) for 12 h (20:00 to 08:00). The body temperature and locomotor activity were recorded every 5 min and analysed with VitalView software.
Analysis of adipocyte size
After H&E staining, tissue samples were visualized with NanoZoomer Slide Scanner. Eight representative images per section were used to determine adipocyte size with ImageJ analysis of H&E-stained tissues.
RNA extraction and real-time PCR
Total RNA was extracted from tissue samples using the PureLink RNA Mini Kit (12183025 Thermo Fisher). The purity and concentration of total RNA were determined by a Nano Drop spectrophotometer (Thermo Fisher). Real-time PCR amplification was detected using SYBR Green PCR master mixture (330502 Qiagen) on a Roche 480 Real-time PCR system. The relative expression levels of target genes were normalized to 36b4. Primer sequences are listed in Supplementary Table 3.
PCR arrays of BAT
To determine if there is cross-talk between mTOR and the cAMP signalling pathways in adipose tissue, cAMP-responsive gene expression was examined using PCR arrays. Four-month-old male C57BL/6 mice were treated with rapamycin by intraperitoneal injection with 4 mg per kg body weight of rapamycin or vehicle solution three times a week for 8 weeks. The mRNA from BAT of mice treated with or without rapamycin (n = 3 per group) was extracted and used for reverse transcription. The PCR array analysis was performed by using the synthesized cDNA and PCR array (Qiagen, PAMM-066Z) based on the procedure from Qiagen. The P values are calculated based on a Student’s t-test of the replicate 2−ΔCt values for each gene in the control and treatment groups, and P values less than 0.05 were considered significant. Although mRNA levels of several genes as indicated (Extended Data Fig. 1a) are upregulated or downregulated twofold more in rapamycin-treated mice compared to the control mice, some of the genes were not further considered due to the relatively high (>30) threshold cycle or greater variations for the fold-change.
Western blot
For tissue analysis, frozen samples of adipose tissue were sliced and about 1 mg of tissue sample was homogenized for Western blot analysis. The total proteins in the homogenate were normalized and separated with SDS gel followed with immunoblots. For the iWAT, tissue samples around the lymph nodes in the inguinal fat were used for the western blot considering the heterogeneity of iWAT in cell types. For cell analysis, cell lysates were prepared in ice-cold lysis buffer. When multiple target proteins had similar molecular weight or were unable to be obtained individually from the same gel, the gels were run in parallel with the same order and the same individual volume of samples. The loading control was performed for every membrane in the majority of western blots except those in Fig. 1b,k in which only one loading control was used for various membranes. All the presented blot images were cropped using Adobe Photoshop, and the x axis indicates the individual mouse or the individual cell treatment. Quantification of protein levels was performed using ImageJ. The expression level for a particular protein was normalized with the internal control protein, and the relative change in protein level was expressed as the percentage of control protein levels. The relative level of each control sample was arbitrarily set at 1.0 in the cell and in vivo studies. The antibody information is included in Supplementary Table 4.
Statistical analysis
Statistical analysis of the data was performed using a two-tailed Student’s t-test between two groups or one-way ANOVA among three different groups. All results indicate the mean ± s.e.m., and a P value of <0.05 was considered to be statistically significant.
Reporting summary
Further information on research design is available in the Nature Portfolio Reporting Summary linked to this article.
Extended Data
Extended Data Fig. 1 |. The mRNA levels of JunB were upregulated by inhibition of mTORC1 and by obesity in BAT, related to Fig. 1.
a. The layout of fold changes (rapamycin: control) of 96 genes that are cAMP responsive in PCR array analysis. The reverse transcription was performed with total RNA extracted from BAT in mice treated with or without rapamycin (n = 3/group), and then the synthesized cDNAs was used for PCR array analysis. b. RNA-sequencing gene expression signatures of iWAT from 10-week-old male Raptor KO and control mice. n = 2–3/group. c. The protein levels of JunB were upregulated by HFD feeding in adipose tissue. d. Quantification of JunB expression in Extended Data Figure c. e. mRNA levels of JunB were induced in WAT of HFD-fed mice (6 mice/group). f. mRNA levels of Ucp1 and Pgc-1α in human deep neck fat were negatively correlated with BMI. g. The expression pattern of JunB in adipocyte subsets and APCs in human BAT. h. Quantification the protein level in Fig. 1k. i. JunB is expressed in Plin1-enriched primary differentiated adipocytes. j. JunB was highly enriched in primary preadipocytes which declined during differentiation (n = 3, independent experiments). Statistical analysis was performed using Pearson’s correlation coefficient in Extended Data Fig. 1f. Extended Data Fig. 1d, e, h, j were analyzed using unpaired two-sided T-Test.
Extended Data Fig. 2 |. The JunB Chaser mouse model was generated to show the presence of JunB-expressing adipocytes in fat, related to Fig. 2.
a. The generation strategy for JunBCreERT2 mice as described in the genomic structure. An internal ribosome entry site (IRES) fused to a CreERT2 fusion gene was inserted downstream of the internal stop codon of Junb gene. b. Representative tissue distribution of iCre and Junb mRNA in adult JunBCreERT2 transgenic mice as determined by qPCR. c. Immunofluorescence staining of YFP+ cells in liver and pancreas of JunBCreERT2 mice. Differentiated YFP+ brown adipocytes were present during primary adipogenesis by imaging (d) and flow cytometry (e) in Primary brown adipocytes of JunBCreERT2 mice. f. JunB+ adipocytes were increased by the treatment of 20 ng/mL TNFα or 20 ng/mL IL-6 for 24 hrs post primary adipogenesis. g. Quantification of JunB-expressing adipocytes in Figure f. h. JunB+ adipocytes were increased by the treatment of 20 ng/mL TNFα or 20 ng/mL IL-6 for 24 hrs post primary adipogenesis. Preadiocytes were isolated from AdipoChaser-YFP mice and differentiated into adipocytes. i. Quantification of JunB-expressing adipocytes in Figure h. All data in this Figure were analyzed by unpaired two-sided T-Test.
Extended Data Fig. 3 |. Both JunB FKO and BKO mice display enhanced energy expenditure and cold adaptation, related to Fig. 3.
10-week-old male were individually housed in Phenotyping Systems (Sable Systems International) coupled with a temperature controllable chamber. a. Respiratory exchange ratio (RER) was decreased in adipocyte-specific JunB KO (JunB FKO) mice compared to control littermates under cold stress conditions. Food intake (b) and motor activities (c) were little affected by JunB deficiency in fat. d. mRNA levels of JunB were significantly downregulated in BAT but not in gWAT of UCP1+ cell-specific JunB KO (JunB BKO) mice compared to the controls. e. JunB BKO mice exhibited enhanced basal and cold-induced O2 consumption throughout light and dark cycles compared with controls. f. The quantified data of Extended Data Fig. 3e using CaIR. There was little difference in food intake (g) despite slightly reduced motor activities under cold stress conditions (h) between JunB BKO and control mice. i. JunB deficiency significantly increased oxygen consumption in primary brown adipocytes (4 mice/group). j. The quantified data of Extended Data Fig. 3i using CaIR. k. Ablation of JunB-expressing adipocytes upregulated the expression levels of Ucp1, Ppargc1α, and Errα (7 mice/group). Extended Data Fig. 3i was analyzed by ANOVA analysis and the unpaired two-sided T-Test was used for the rest figures. Data are presented as the mean ± SEM. *P < 0.05 or **P < 0.01.
Extended Data Fig. 4 |. Both JunB FKO and BKO mice exhibit improved diet-induced insulin resistance, related to Fig. 4.
6-week-old male JunB FKO and control mice were fed with HFD for 16 weeks and used for the studies (4a-h). The percentage of larger adipocytes was decreased accompanied with an increase in smaller adipocytes in iWAT (a) and BAT (b) of HFD-fed JunB BKO mice compared to controls. Depletion of JunB in adipocytes improved glucose (c) and insulin (d) tolerance after 16-week HFD feeding. JunB FKO mice displayed improved hepatic steatosis (e) and triglyceride content in the liver (8 mice for NC and 6 mice for HFD). (f) of JunB FKO mice compared with control mice under HFD feeding conditions. g-h. O2 consumption was significantly increased in JunB FKO mice compared to controls after feeding with HFD for 12 weeks. Extended Data Fig. 4a–d were analyzed by ANOVA analysis. Extended Data Fig. 4f was analyzed with unpaired two-sided T-Test. Data are presented as the mean ± SEM. *P < 0.05 or **P < 0.01.
Extended Data Fig. 5 |. Depletion of JunB in adipocytes increased O2 consumption with insignificant anti-obesity effect under HFD condition, related to Fig. 4.
Under HFD feeding conditions, JunB FKO displayed similar RER (a) and food intake (b), while exhibited a significant decrease in motor activities (c) compared to control mice. There was no significant difference in body mass (d), fat mass, fat percentage (e), the image (f) and weight (g) of individual organs such as gWAT, iWAT, BAT and liver between JunB FKO and control mice when challenged with HFD.
Extended Data Fig. 6 |. SnRNA-seq analysis of JunB KO BAT, related to Fig. 5.
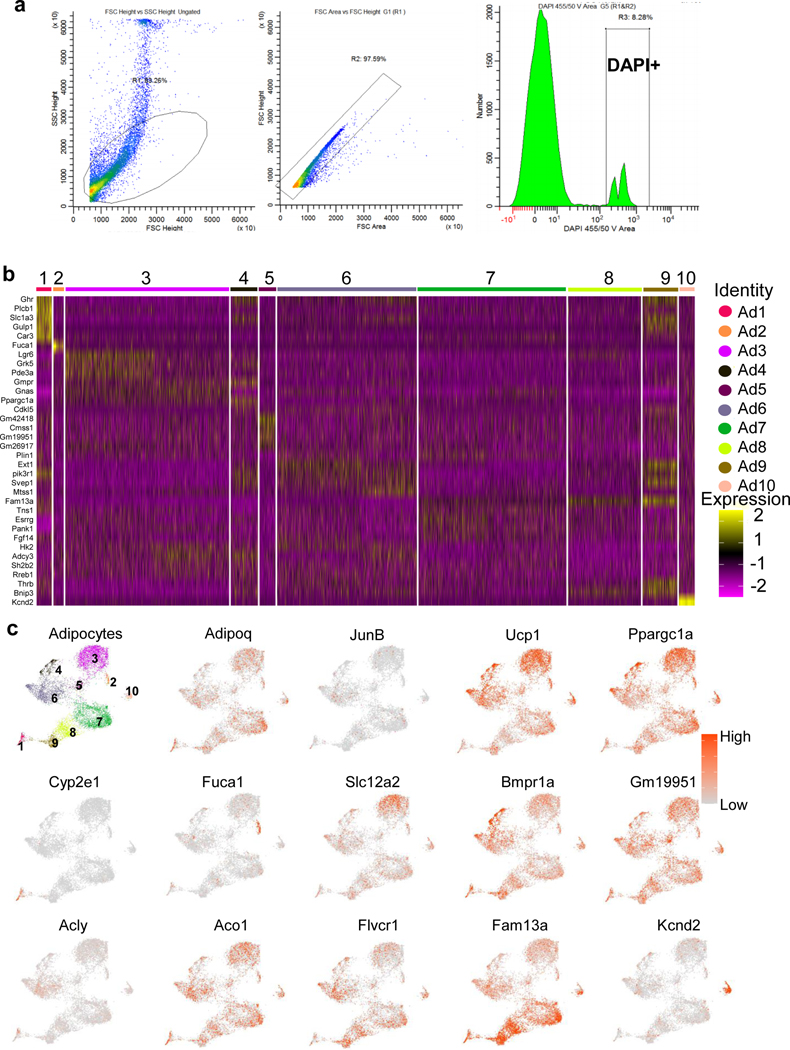
a. The sorting strategy of isolated nuclei. The nuclei were first sorted based on forward scatter height (FSC) and side scatter height (SSC), and singlets were then sorted based on the combination of area and heights of FSC followed with sorting of DAPI-positive events used for the snRNA-Seq. b. Heat map of gene signature for each population of brown adipocyte nuclei (AD1-AD10). c. Feature plots for Adipoq, JunB, Ucp1, Ppargc1a, Cyp2e1, Fuca1, Slc12a2, Bmpr1a, Gm19951, Acly, Aco1, Flvcr1, Fam13a and Kcnd2.
Extended Data Fig. 7 |. JunB deficiency induces a shift of low to high-thermogenic adipocytes in BAT, related to Fig. 5.
a. JunB is mainly expressed in UCP1low adipocytes (expression levels <2 described in Fig. 5f). b-c. Majority of YFP+ (JunB+) differentiated adipocytes are Mitochondriallow indicated by the staining with MitoTracker.(4 mice/group) d. YFP+ (JunB+) differentiated adipocytes showed significantly upregulated expression of thermogenic genes compared to YFP− (JunB−) adipocytes(3 mice/group). The partition (e) and pseudotime (f) trajectory of adipocytes analyzed by Monocle. g. Violin plots for Adipoq, Plin1, JunB, Ucp1, Erra, and Ppargc1α for each sub-population of adipocytes in JunB KO and control BAT. h. Volcano plot showing the up regulation of Ucp1, Erra and Ppargc1a in JunB KO BAT compared to control. The unpaired two-sided T-Test was used to analyze Extended Data Fig. 4c, d.
Extended Data Fig. 8 |. JunB deficiency enhances adipocyte thermogenic capacity in vivo, related to Fig. 5.
a. Feature plots for Adipoq, Junb, Ucp1 and Ppargc1a in JunB KO adipocytes and control cells. b. Mapping the present data sets of BAT snRNAseq with the published work by Sun et al (PMID: 33116305). c. UMAP of KO BAT adipocytes and controls after mapping with published work by Sun et al (PMID: 33116305).
Extended Data Fig. 9 |. JunB deficiency increases thermogenic capacity in primary brown adipocytes, related to Fig. 5.
a. JunB FKO mice displayed increased mitochondriahigh and decreased mitochondrialow adipocytes in BAT. LD, lipid droplet; N, nucleus. b. The quantified data of mitochondriahigh and mitochondrialow adipocytes from Figure a (n = 4, mice/group). c. JunB deficiency had little effect on the primary adipogenesis. d. Quantification of lipid droplet area of JunB FKO and control primary adipocytes in Figure c. e. Gene Set Enrichment Analysis (GSEA) of SnRNA-Seq in JunB FKO and Control mice. Extended Data Fig. 9b was analyzed by ANOVA analysis, Data are presented as the mean ± SEM. *P < 0.05; **P < 0.01.
Supplementary Material
Acknowledgements
This work is supported by R01 Awards (DK132643 and DK110439 to M.L. from NIDDK, HL148337 to X.Y. from NHLBI, and CA163890 and CA194496 to E.P. from NCI); Innovative Basic Science Award (1–17-IBS-261 to M.L.) from the American Diabetes Association; Grant in Aid (15GRNT24940018 to M.L.) and Postdoc Fellowship Awards (20POST35120020 to X.Z.) from American Heart Association; P20 Award (GM121176, Project Director: V. Deretic, to Mentored Principal Investigators, M.L.); CoBRE Pilot Award associated with P30 (P30GM103400 principal investigator, J. Liu; to M.L.), CVMD Pilot Award (to M.L.), CTSC pilot Award associated with grant (UL1TR001449) (principal investigators, M. Campen and N. Pandhi; to M.L.) and UNMCCC pilot Award associated with P30 (CA118100) (principal investigator, Y. Sanchez; to M.L.) at the University of New Mexico Health Sciences Center (UNMHSC). This project was supported in part by the Dedicated Health Research Funds from the University of New Mexico School of Medicine. We thank the Autophagy, Inflammation and Metabolism Center at UNMHSC for providing the Cellomics HCS scanner for our present study and technical support. We want to thank UNM Comprehensive Cancer Center (UNMCCC) for the core support on snRNA-seq (completed in the ATG Core), bioinformatic analysis (performed by K. Brayer at the Cancer Research Facility) and flow cytometry.
Footnotes
Code availability
No custom code was used.
Supplementary information The online version contains supplementary material available at https://doi.org/10.1038/s42255–023-00945–1.
Competing interests
The authors declare no competing interests.
Extended data is available for this paper at https://doi.org/10.1038/s42255-023-00945-1.
Data availability
The data generated during the current study are shared with researchers. The snRNA-seq datasets have been deposited in the Gene Expression Omnibus and are publicly available under accession https://www.ncbi.nlm.nih.gov/geo/query/acc.cgi?acc=GSE244239. Source data are provided with this paper.
References
- 1.Cypess AM et al. Identification and importance of brown adipose tissue in adult humans. N. Engl. J. Med 360, 1509–1517 (2009). [DOI] [PMC free article] [PubMed] [Google Scholar]
- 2.Yoneshiro T. et al. Recruited brown adipose tissue as an antiobesity agent in humans. J. Clin. Investig. 123, 3404–3408 (2013). [DOI] [PMC free article] [PubMed] [Google Scholar]
- 3.Hanssen MJ et al. Short-term cold acclimation improves insulin sensitivity in patients with type 2 diabetes mellitus. Nat. Med. 21, 863–865 (2015). [DOI] [PubMed] [Google Scholar]
- 4.Becher T. et al. Brown adipose tissue is associated with cardiometabolic health. Nat. Med. 27, 58–65 (2021). [DOI] [PMC free article] [PubMed] [Google Scholar]
- 5.Bartelt A. et al. Brown adipose tissue activity controls triglyceride clearance. Nat. Med. 17, 200–205 (2011). [DOI] [PubMed] [Google Scholar]
- 6.Stanford KI et al. Brown adipose tissue regulates glucose homeostasis and insulin sensitivity. J. Clin. Investig. 123, 215–223 (2013). [DOI] [PMC free article] [PubMed] [Google Scholar]
- 7.Kajimura S, Spiegelman BM & Seale P. Brown and beige fat: physiological roles beyond heat generation. Cell Metab. 22, 546–559 (2015). [DOI] [PMC free article] [PubMed] [Google Scholar]
- 8.Chondronikola M. et al. Brown adipose tissue activation is linked to distinct systemic effects on lipid metabolism in humans. Cell Metab. 23, 1200–1206 (2016). [DOI] [PMC free article] [PubMed] [Google Scholar]
- 9.Yoneshiro T. et al. BCAA catabolism in brown fat controls energy homeostasis through SLC25A44. Nature 572, 614–619 (2019). [DOI] [PMC free article] [PubMed] [Google Scholar]
- 10.Spaethling JM et al. Single-cell transcriptomics and functional target validation of brown adipocytes show their complex roles in metabolic homeostasis. FASEB J. 30, 81–92 (2016). [DOI] [PubMed] [Google Scholar]
- 11.Oguri Y. & Kajimura S. Cellular heterogeneity in brown adipose tissue. J. Clin. Investig. 130, 65–67 (2020). [DOI] [PMC free article] [PubMed] [Google Scholar]
- 12.Cinti S. et al. CL316,243 and cold stress induce heterogeneous expression of UCP1 mRNA and protein in rodent brown adipocytes. J. Histochem Cytochem. 50, 21–31 (2002). [DOI] [PubMed] [Google Scholar]
- 13.Song A. et al. Low- and high-thermogenic brown adipocyte subpopulations coexist in murine adipose tissue. J. Clin. Investig. 130, 247–257 (2020). [DOI] [PMC free article] [PubMed] [Google Scholar]
- 14.Sun W. et al. snRNA-seq reveals a subpopulation of adipocytes that regulates thermogenesis. Nature 587, 98–102 (2020). [DOI] [PubMed] [Google Scholar]
- 15.Puigserver P. et al. A cold-inducible coactivator of nuclear receptors linked to adaptive thermogenesis. Cell 92, 829–839 (1998). [DOI] [PubMed] [Google Scholar]
- 16.Seale P. et al. Transcriptional control of brown fat determination by PRDM16. Cell Metab. 6, 38–54 (2007). [DOI] [PMC free article] [PubMed] [Google Scholar]
- 17.Kajimura S. et al. Initiation of myoblast to brown fat switch by a PRDM16-C/EBP-beta transcriptional complex. Nature 460, 1154–1158 (2009). [DOI] [PMC free article] [PubMed] [Google Scholar]
- 18.Wang L. et al. Adiponectin restrains ILC2 activation by AMPK-mediated feedback inhibition of IL-33 signaling. J. Exp. Med. 218, e20191054 (2021). [DOI] [PMC free article] [PubMed] [Google Scholar]
- 19.Alcivar AA, Hake LE, Hardy MP & Hecht NB Increased levels of junB and c-jun mRNAs in male germ cells following testicular cell dissociation. Maximal stimulation in prepuberal animals. J. Biol. Chem. 265, 20160–20165 (1990). [PubMed] [Google Scholar]
- 20.Schorpp-Kistner M, Wang ZQ, Angel P. & Wagner EF JunB is essential for mammalian placentation. EMBO J. 18, 934–948 (1999). [DOI] [PMC free article] [PubMed] [Google Scholar]
- 21.Passegue E, Jochum W, Schorpp-Kistner M, Mohle-Steinlein U. & Wagner EF Chronic myeloid leukemia with increased granulocyte progenitors in mice lacking junB expression in the myeloid lineage. Cell 104, 21–32 (2001). [DOI] [PubMed] [Google Scholar]
- 22.Zenz R. et al. Psoriasis-like skin disease and arthritis caused by inducible epidermal deletion of Jun proteins. Nature 437, 369–375 (2005). [DOI] [PubMed] [Google Scholar]
- 23.Hasan Z. et al. JunB is essential for IL-23-dependent pathogenicity of Th17 cells. Nat. Commun. 8, 15628 (2017). [DOI] [PMC free article] [PubMed] [Google Scholar]
- 24.Carr TM, Wheaton JD, Houtz GM & Ciofani M. JunB promotes Th17 cell identity and restrains alternative CD4+ T-cell programs during inflammation. Nat. Commun. 8, 301 (2017). [DOI] [PMC free article] [PubMed] [Google Scholar]
- 25.Deng T. & Karin M. JunB differs from c-Jun in its DNA-binding and dimerization domains, and represses c-Jun by formation of inactive heterodimers. Genes Dev. 7, 479–490 (1993). [DOI] [PubMed] [Google Scholar]
- 26.Shaulian E. & Karin M. AP-1 in cell proliferation and survival. Oncogene 20, 2390–2400 (2001). [DOI] [PubMed] [Google Scholar]
- 27.Meijer CA et al. Activator protein-1 (AP-1) signalling in human atherosclerosis: results of a systematic evaluation and intervention study. Clin. Sci. 122, 421–428 (2012). [DOI] [PMC free article] [PubMed] [Google Scholar]
- 28.Thomsen MK et al. JUNB/AP-1 controls IFN-gamma during inflammatory liver disease. J. Clin. Investig. 123, 5258–5268 (2013). [DOI] [PMC free article] [PubMed] [Google Scholar]
- 29.Hyakusoku H. et al. JunB promotes cell invasion, migration and distant metastasis of head and neck squamous cell carcinoma. J. Exp. Clin. Cancer Res. 35, 6 (2016). [DOI] [PMC free article] [PubMed] [Google Scholar]
- 30.Yoshitomi Y. et al. JunB regulates angiogenesis and neurovascular parallel alignment in mouse embryonic skin. J. Cell Sci. 130, 916–926 (2017). [DOI] [PubMed] [Google Scholar]
- 31.Sartipy P. & Loskutoff DJ Expression profiling identifies genes that continue to respond to insulin in adipocytes made insulin-resistant by treatment with tumor necrosis factor-alpha. J. Biol. Chem. 278, 52298–52306 (2003). [DOI] [PubMed] [Google Scholar]
- 32.Nakajima K. & Wall R. Interleukin-6 signals activating junB and TIS11 gene transcription in a B-cell hybridoma. Mol. Cell. Biol. 11, 1409–1418 (1991). [DOI] [PMC free article] [PubMed] [Google Scholar]
- 33.Pinent M. et al. Adipose triglyceride lipase and hormone-sensitive lipase are involved in fat loss in JunB-deficient mice. Endocrinology 152, 2678–2689 (2011). [DOI] [PMC free article] [PubMed] [Google Scholar]
- 34.Polak P. et al. Adipose-specific knockout of raptor results in lean mice with enhanced mitochondrial respiration. Cell Metab. 8, 399–410 (2008). [DOI] [PubMed] [Google Scholar]
- 35.Liu M. et al. Grb10 promotes lipolysis and thermogenesis by phosphorylation-dependent feedback inhibition of mTORC1. Cell Metab. 19, 967–980 (2014). [DOI] [PMC free article] [PubMed] [Google Scholar]
- 36.Liu D. et al. Activation of mTORC1 is essential for beta-adrenergic stimulation of adipose browning. J. Clin. Investig. 126, 1704–1716 (2016). [DOI] [PMC free article] [PubMed] [Google Scholar]
- 37.Zhang X. et al. Adipose mTORC1 suppresses prostaglandin signaling and beige adipogenesis via the CRTC2–COX-2 pathway. Cell Rep. 24, 3180–3193 (2018). [DOI] [PMC free article] [PubMed] [Google Scholar]
- 38.Wada S. et al. The tumor suppressor FLCN mediates an alternate mTOR pathway to regulate browning of adipose tissue. Genes Dev. 30, 2551–2564 (2016). [DOI] [PMC free article] [PubMed] [Google Scholar]
- 39.Tran CM et al. Rapamycin blocks induction of the thermogenic program in white adipose tissue. Diabetes 65, 927–941 (2016). [DOI] [PMC free article] [PubMed] [Google Scholar]
- 40.Lee PL, Tang Y, Li H. & Guertin DA Raptor/mTORC1 loss in adipocytes causes progressive lipodystrophy and fatty liver disease. Mol. Metab. 5, 422–432 (2016). [DOI] [PMC free article] [PubMed] [Google Scholar]
- 41.Xiao H. et al. Architecture of the outbred brown fat proteome defines regulators of metabolic physiology. Cell 185, 4654–4673 (2022). [DOI] [PMC free article] [PubMed] [Google Scholar]
- 42.Bakiri L, Lallemand D, Bossy-Wetzel E. & Yaniv M. Cell cycle-dependent variations in c-Jun and JunB phosphorylation: a role in the control of cyclin D1 expression. EMBO J. 19, 2056–2068 (2000). [DOI] [PMC free article] [PubMed] [Google Scholar]
- 43.Emont MP et al. A single-cell atlas of human and mouse white adipose tissue. Nature 603, 926–933 (2022). [DOI] [PMC free article] [PubMed] [Google Scholar]
- 44.Cartharius K. et al. MatInspector and beyond: promoter analysis based on transcription factor binding sites. Bioinformatics 21, 2933–2942 (2005). [DOI] [PubMed] [Google Scholar]
- 45.Huss JM, Kopp RP & Kelly DP Peroxisome proliferator-activated receptor coactivator-1alpha (PGC-1alpha) coactivates the cardiac-enriched nuclear receptors estrogen-related receptor-alpha and -gamma. Identification of novel leucine-rich interaction motif within PGC-1alpha. J. Biol. Chem. 277, 40265–40274 (2002). [DOI] [PubMed] [Google Scholar]
- 46.Schreiber SN et al. The estrogen-related receptor alpha (ERRalpha) functions in PPARgamma coactivator 1alpha (PGC1alpha)-induced mitochondrial biogenesis. Proc. Natl. Acad. Sci. USA 101, 6472–6477 (2004). [DOI] [PMC free article] [PubMed] [Google Scholar]
- 47.Berbee JF et al. Brown fat activation reduces hypercholesterolaemia and protects from atherosclerosis development. Nat. Commun. 6, 6356 (2015). [DOI] [PMC free article] [PubMed] [Google Scholar]
- 48.Seale P. et al. Prdm16 determines the thermogenic program of subcutaneous white adipose tissue in mice. J. Clin. Investig. 121, 96–105 (2011). [DOI] [PMC free article] [PubMed] [Google Scholar]
- 49.Bostrom P. et al. A PGC1-alpha-dependent myokine that drives brown-fat-like development of white fat and thermogenesis. Nature 481, 463–468 (2012). [DOI] [PMC free article] [PubMed] [Google Scholar]
- 50.Nakajima K. et al. Identification of a novel interleukin-6 response element containing an Ets-binding site and a CRE-like site in the junB promoter. Mol. Cell. Biol. 13, 3027–3041 (1993). [DOI] [PMC free article] [PubMed] [Google Scholar]
- 51.Fan F. et al. JunB is a key regulator of multiple myeloma bone marrow angiogenesis. Leukemia 35, 3509–3525 (2021). [DOI] [PMC free article] [PubMed] [Google Scholar]
- 52.Kobierski LA, Chu HM, Tan Y. & Comb MJ cAMP-dependent regulation of proenkephalin by JunD and JunB: positive and negative effects of AP-1 proteins. Proc. Natl. Acad. Sci. USA 88, 10222–10226 (1991). [DOI] [PMC free article] [PubMed] [Google Scholar]
- 53.Hsu JC, Cressman DE & Taub R. Promoter-specific trans-activation and inhibition mediated by JunB. Cancer Res. 53, 3789–3794 (1993). [PubMed] [Google Scholar]
- 54.Lord KA, Abdollahi A, Hoffman-Liebermann B. & Liebermann DA Proto-oncogenes of the fos/jun family of transcription factors are positive regulators of myeloid differentiation. Mol. Cell. Biol. 13, 841–851 (1993). [DOI] [PMC free article] [PubMed] [Google Scholar]
- 55.Petrovic N. et al. Chronic peroxisome proliferator-activated receptor gamma (PPARgamma) activation of epididymally derived white adipocyte cultures reveals a population of thermogenically competent, UCP1-containing adipocytes molecularly distinct from classic brown adipocytes. J. Biol. Chem. 285, 7153–7164 (2010). [DOI] [PMC free article] [PubMed] [Google Scholar]
- 56.Rodeheffer MS, Birsoy K. & Friedman JM Identification of white adipocyte progenitor cells in vivo. Cell 135, 240–249 (2008). [DOI] [PubMed] [Google Scholar]
- 57.Berry R. & Rodeheffer MS Characterization of the adipocyte cellular lineage in vivo. Nat. Cell Biol. 15, 302–308 (2013). [DOI] [PMC free article] [PubMed] [Google Scholar]
- 58.Merrick D. et al. Identification of a mesenchymal progenitor cell hierarchy in adipose tissue. Science 364, eaav2501 (2019). [DOI] [PMC free article] [PubMed] [Google Scholar]
- 59.Jespersen NZ et al. A classical brown adipose tissue mRNA signature partly overlaps with brite in the supraclavicular region of adult humans. Cell Metab. 17, 798–805 (2013). [DOI] [PubMed] [Google Scholar]
- 60.Plummer NW, Ungewitter EK, Smith KG, Yao HH & Jensen P. A new mouse line for cell ablation by diphtheria toxin subunit A controlled by a Cre-dependent FLEx switch. Genesis 55, e23067 (2017). [DOI] [PMC free article] [PubMed] [Google Scholar]
- 61.Quiros PM, Goyal A, Jha P. & Auwerx J. Analysis of mtDNA/ nDNA ratio in mice. Curr. Protoc. Mouse Biol. 7, 47–54 (2017). [DOI] [PMC free article] [PubMed] [Google Scholar]
- 62.Luo Y. et al. Myeloid adrenergic signaling via CaMKII forms a feedforward loop of catecholamine biosynthesis. J. Mol. Cell Biol. 9, 422–434 (2017). [DOI] [PMC free article] [PubMed] [Google Scholar]
- 63.Wang C. et al. Adipocyte-derived PGE2 is required for intermittent fasting-induced Treg proliferation and improvement of insulin sensitivity. JCI Insight 7, e153755 (2022). [DOI] [PMC free article] [PubMed] [Google Scholar]
- 64.Mina AI et al. CalR: a web-based analysis tool for indirect calorimetry experiments. Cell Metab. 28, 656–666 (2018). [DOI] [PMC free article] [PubMed] [Google Scholar]
Associated Data
This section collects any data citations, data availability statements, or supplementary materials included in this article.
Supplementary Materials
Data Availability Statement
The data generated during the current study are shared with researchers. The snRNA-seq datasets have been deposited in the Gene Expression Omnibus and are publicly available under accession https://www.ncbi.nlm.nih.gov/geo/query/acc.cgi?acc=GSE244239. Source data are provided with this paper.


