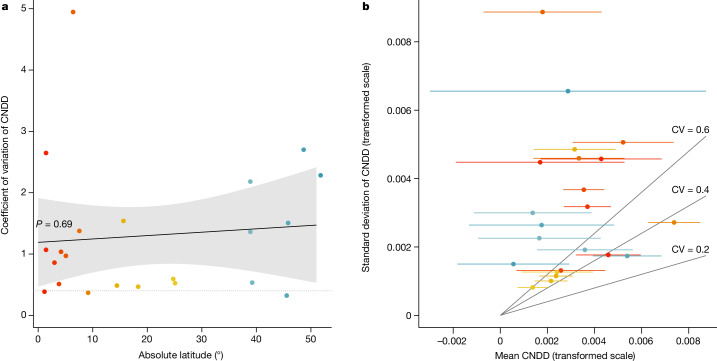
Fig. 4. Evaluation of the third hypothesized pattern, whereby interspecific variation in stabilizing CNDD decreases towards the tropics.
a, Coefficients of variation (CV = s.d./mean) per forest site showed no statistically significant latitudinal pattern (P = 0.69) but were on average greater than what theory suggests as a maximum for stable coexistence14,15 (CV > 0.4; dotted horizonal line; see ‘Stable coexistence and interspecific variation in CNDD’ in Methods) at all but three sites (Barro Colorado Island, La Planada and Wabikon), owing to large differences among species at comparatively weak CNDD (b). Mean CNDD and interspecific variation in CNDD (s.d.) per forest site were estimated using meta-regressions without predictors fitted separately for each forest site. Points are coloured by latitude (gradient from tropical forests in red–orange to subtropical forests in yellow–green and temperate forests in blue). The regression line, 95% CI and P value in a are based on a linear regression model. Grey lines in b indicate different CV values. Note that we excluded one site for which the average CNDD was less than 0 (Santa Cruz; Fig. 2), because positive conspecific density dependence is expected to be destabilizing, irrespective of species differences. Stabilizing CNDD is defined as in Fig. 1, but here means and s.d. are shown at the transformed scale; that is, log(rAME + 1).

