

Summary
Tree growth performance can be partly explained by genetics, while a large proportion of growth variation is thought to be controlled by environmental factors. However, to what extent DNA methylation, a stable epigenetic modification, contributes to phenotypic plasticity in the growth performance of long‐lived trees remains unclear. In this study, a comparative analysis of targeted DNA genotyping, DNA methylation and mRNAseq profiling for needles of 44‐year‐old Douglas‐fir trees (Pseudotsuga menziesii (Mirb.) Franco) having contrasting growth characteristics was performed. In total, we identified 195 differentially expressed genes (DEGs) and 115 differentially methylated loci (DML) that are associated with genes involved in fitness‐related processes such as growth, stress management, plant development and energy resources. Interestingly, all four intronic DML were identified in mega‐sized (between 100 and 180 kbp in length) and highly expressed genes, suggesting specialized regulation mechanisms of these long intron genes in gymnosperms. DNA repetitive sequences mainly comprising long‐terminal repeats of retroelements are involved in growth‐associated DNA methylation regulation (both hyper‐ and hypomethylation) of 99 DML (86.1% of total DML). Furthermore, nearly 14% of the DML was not tagged by single nucleotide polymorphisms, suggesting a unique contribution of the epigenetic variation in tree growth.
Keywords: Douglas‐fir, Pseudotsuga menziesii, DNA methylation, epigenetics, ddRADseq, growth performance
Introduction
Understanding how organisms adapt to environmental challenges and to what extent epigenetic regulation contributes to complex traits such as growth performance remains unclear (Richards et al., 2017). During their long lifespan, forest tree populations are exposed to variable and often challenging environmental conditions. Thus, the ability for rapid and long‐term genetic adaptation is crucial for the survival of the populations and species, especially in a scenario of climate change. Recently, accumulating evidence has shown that epigenetic regulations including DNA methylation (i.e. covalent attachment of a methyl group to the 5‐position of a cytosine) provide a source of heritable phenotypic variations in natural populations (Eichten et al., 2011; Schmitz et al., 2013) and thus may contribute to rapid local adaptation (de Kort et al., 2022; Dubin et al., 2015; Pecinka et al., 2013; Schmid et al., 2018). In plants, there are three classes of cytosine methylation: mCG, mCHG and mCHH, in which mC is methylated cytosine and H is any nucleotide residue other than guanine (G). Such DNA methylation is a pivotal epigenetic mechanism known to repress the movement of transposable genetic elements (Miura et al., 2001) and, in some cases, inhibit gene expression (Jaenisch and Bird, 2003). It also plays a role in heterochromatin formation (Lippman et al., 2004), genome organization (Huff and Zilberman, 2014; Zemach et al., 2013), regulation of plant development (Finnegan et al., 1996; Papareddy et al., 2021; Ronemus et al., 1996) and imprinting (Gehring et al., 2006; Jullien et al., 2008; Pignatta et al., 2018). DNA methylation‐free Arabidopsis mutants showed a suit of developmental defects (He et al., 2022) and size divergence (Liang et al., 2022). Similarly, some growth‐related traits, including plant height (Miura et al., 2009), and resistance to pathogens (Liegard et al., 2019) have been associated with naturally occurring epigenetic alleles (i.e. epialleles) which were neither associated with genetic nor with environmental features. Therefore, epigenetic mechanisms, by which the same genotype can produce divergent characteristics, can provide alternative molecular substrates for adaptive evolution, and understanding and mastering these mechanisms can possibly be instrumental for selective breeding. However, reported associations between heritable epigenetic or genetic signatures and the growth performance of forest trees remain scarce (Avanzi et al., 2019; Brautigam et al., 2013; Grattapaglia et al., 2009; Gugger et al., 2016; Miryeganeh et al., 2022; Platt et al., 2015; Thumma et al., 2009).
Douglas‐fir (Pseudotsuga menziesii (Mirb.) Franco) is one of the ecologically and economically most important conifers in its native range in western North America and has also been an important plantation species in many countries where the species was introduced (Lavender and Hermann, 2014). Its wide geographic range spans approximately 2200 km in latitude with sharp longitudinal and gradual latitudinal environmental gradients. In Central Europe, Douglas‐fir is the most important commercial non‐native tree species due to its superior growth performance and stress tolerance (Weller, 2012). Under future climates with warmer temperatures and more frequent summer droughts, Douglas‐fir is expected to serve as a suitable alternative for higher productivity and resistance to drought (Junker et al., 2017) and heat (Jansen et al., 2014) than the now widely distributed and commercially important Norway spruce. Therefore, a number of provenance trials and common garden experiments has been established for decades in Central Europe (Kleinschmit et al., 1991; Kleinschmit and Bastien, 1992). Intraspecific growth (Anekonda et al., 2004; Neophytou et al., 2016; Weller, 2012), physiological (Bansal et al., 2016; de La Torre et al., 2021; Kleiber et al., 2017) and phenological (Hawkins and Stoehr, 2009; Malmqvist et al., 2017) differences among Douglas‐fir provenances showed associations with original climates.
Moreover, identifying truly adaptive genetic or epigenetic variants in defined genome regions is of utmost importance, since adaptive markers or markers linked to adaptive loci have the potential to assist in breeding of more resistant genotypes and selection of climatically adapted genotypes for forest health and productivity in changing climates. However, this task is particularly difficult in large and highly repetitive genomes such as those of conifers.
The Douglas‐fir genome has been assembled from pair‐end short reads and long‐range linking libraries obtained from Illumina HiSeq 2500 (Neale et al., 2017). Recently, a high‐quality reference transcriptome and annotation of Douglas‐fir was reported using long‐read Iso‐Seq technology (Velasco et al., 2022). Nevertheless, the available 16‐Gbp assembly is rather fragmented (N50 scaffold = 340.7 kbp) and highly repetitive. Therefore, as a proxy to the prohibitive time and costs of genotyping by whole genome resequencing, a genotyping platform based on Douglas‐fir exome capture has been established (George et al., 2021; Thistlethwaite et al., 2017). Restriction site‐associated DNA sequencing (RADseq) could be another approach (Konar et al., 2017). Alternatively, whole genome bisulphite sequencing (WGBS) is ideal for unbiased genome‐wide profiling at the single‐base resolution but is still costly to perform on large numbers of samples. There are several options for genome complexity reduction such as reduced representation bisulphite sequencing (RRBS, Gu et al., 2011), targeted capture methods (Deng et al., 2009) or splinted adaptor tagging (SPLAT, Raine et al., 2017).
Focusing on a provenance trial established in Central Europe having separate entries concerning two different seed harvest years, we investigated the apparent growth divergence among 44‐year‐old Douglas‐fir trees from four coastal North American provenances in Washington, USA. In particular, we aimed to analyse the effects of DNA methylation patterns on the growth performance of individual trees. Given the obvious but quantitatively undetermined effect of genetics (via the source population and seed year factors) and local environments (via the position of trees in the forest trial) on growth rates, we included them as covariates in the linear regression model to identify truly growth‐associated genome regions containing specific DNA methylation patterns. Moreover, provided that DNA methylation levels of a certain genome region can influence surrounding genes, we annotated these candidate genes and discussed their biological functions in the relation to tree growth performance and gene expression levels from a complementary RNAseq analysis. Furthermore, we discuss the influence and association of genetic variations and repetitive sequences on variation in tree growth and potential epigenetic regulatory mechanisms of mega‐sized genes of gymnosperms.
Results
Experimental design for comparative analysis between contrasting growth Douglas‐fir trees in a provenance trial
In this study, the Douglas‐fir trees were from a provenance trial in Iloo forest, Neumünster, Germany (Table 1). The trial was established during the spring of 1982 by planting 4‐year‐old seedlings. For plants from four provenances (Ashford, Randle, Vancouver and Skykomish), two seed harvest years (1971 and 1976) were included as separate entries in the trial, and as such, they have been chosen for the present analysis.
Table 1.
Geographic origins and climate details for four Douglas‐fir (Pseudotsuga menziesii) provenances used in the study and those of the studied provenance trial
| Locations | Elevation (m) | MAP* | MAT † | Lat (N) | Lon (W) | Seed zone ‡ |
|---|---|---|---|---|---|---|
| Original provenance | ||||||
| Skykomish, Foss River (S) | 340 | 1805 | 5.8 | 47°42′N | 121°20′W | 411 |
| Ashford Nat. Park (A) | 510 | 1008 | 8.6 | 46°42′ N | 122°00′ W | 430 |
| Randle, Cowlitz (R) | 330 | 1858 | 8.4 | 46°33′ N | 122°03′ W | 430 |
| Vancouver, Portland (V) | 270 | 923 | 10.5 | 45°39′ N | 122°41′ W | 042 |
| Trial location | ||||||
| Iloo, Neumünster | 45 | 750 | 8.1 | 54°06′33″ N | 9°49′21″ E | |
MAP: Mean annual precipitation (mm) from 1900–1970 (CRU /World Clim 2.01 climate data).
MAT: Mean annual temperature (°C) from 1900–1970 (CRU /World Clim 2.01 climate data).
Tree Seed Transfer Zones USDA Forest Service 1966, 1973.
In November 2021, we collected needles from 16 representative trees with contrasting growth located in the same or close‐by plots (Figure S1). The tree height ranged from 6.4 to 14.6 m (n = 3), 5.9 to 25.7 m (n = 4), 15.7 to 27 m (n = 4) and 8.2 to 27 m (n = 5) for the origins in Ashford, Vancouver, Skykomish and Randle, respectively. The corresponding range of stem diameter at breast height (DBH) values was 9.7–19.5, 9.0–26.6, 16.1–35.5 and 9.5–39.4 cm, respectively (Figure 1). Overall, the tree heights were significantly correlated to their DBH values (R = 0.93, P‐value = 2.13e−07); therefore, DBH was used as a proxy for the growth performance of studied trees (Figure S2). Subsequently, the original provenances, seed harvesting years and tree locations in the forest trial were included as predictive covariates in a logistic regression model for growth‐associated comparative analysis (Table S1).
Figure 1.
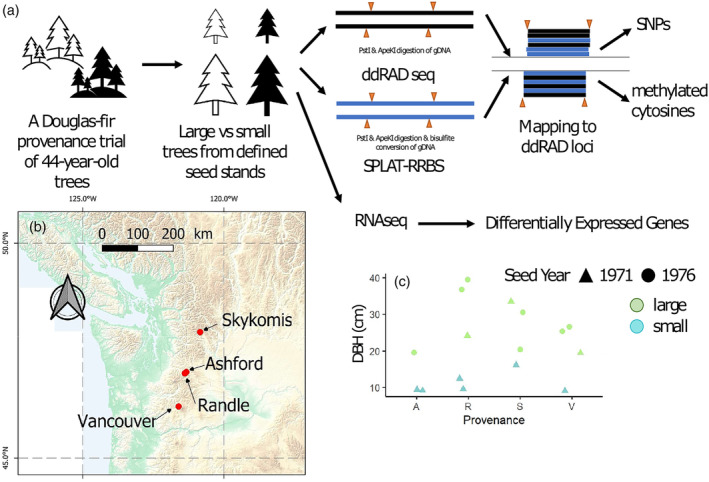
Overview of the study. (a) Schematic diagram of the experimental design and workflow to identify growth‐associated DNA methylation patterns and Differentially Expressed Genes in representatives of a Douglas‐fir provenance trial in Germany. (b) Geographic locations of the four original natural provenances Skykomish, Ashford, Randle and Vancouver in the northwestern USA. (c) Stem diameter at breast height (DBH) values (in cm) of studied trees were used for estimating the tree growth performance, given that diameter increment is the nearly constant non‐reversible feature of tree growth and its allometric correlation between stem diameter, tree height and timber volume.
Genome‐scale DNA methylation analysis in Douglas‐fir needles
High‐quality genomic DNA isolated from frozen needles was processed for deep sequencing, for DNA genotyping and methylation profiling. Targeting approximately 1 million genomic regions flanked by PstI and ApeKI sites in the Douglas‐fir genome (hereafter referred to as ddRAD loci), we obtained approximately 2.7 million 150‐bp pair‐end reads per sample for DNA methylation profiling using SPLAT‐RRBS and 3.6 million 150‐bp pair‐end reads for DNA genotyping by ddRADseq (Table S2). On average, 1.53 million high‐quality single nucleotide polymorphisms (SNPs) and 58 124 high‐quality mCG sites were identified with mean coverages of 13.77 and 16.09, respectively (Table S3).
In our approach, a total of 1.3 million methylated cytosines in all sequence contexts was found in at least one sample and belongs to a total of 48 406 ddRAD loci. These 48 406 ddRAD loci were associated with 23 225 genes, comprising approximately 45.2% of the 51 419 annotated Douglas‐fir genes (Velasco et al., 2022). For downstream comparative analysis, a unified dataset with values of at least three large trees and three small trees was used, including 7157 mCG sites, 13 412 mCHG sites and 76 554 mCHH sites (H = A, C or T) with global DNA methylation rates of 44.36% (SD ± 1.9), 47.69% (SD ± 1.479) and 9.6% (SD ± 1.7), respectively (Table S3; Figure S3). In general, similar to DNA methylation patterns of other plant species (Ausin et al., 2016; Mattei et al., 2022; Schmid et al., 2018), the DNA methylation status of each cytosine in mCG and mCHG contexts of Douglas‐fir needles followed a bimodal distribution (most of the cytosines were either not methylated or highly methylated, Figure S4). Variations in global DNA methylation levels among individual trees did not significantly correlate either with DBH values (Pearson correlation = −0.23, P‐value = 0.4 for mCG sites, others see Figure S5A–C) or with total RRBS read amounts (Pearson correlation = 0.3, P‐value = 0.25 for mCG sites, others see Figure S5D–F). A Principal Component Analysis (PCA) plot on all variant mCG sites from the RRBS dataset illustrated a high congruence across all four origins, without any specific cluster of DNA methylation profiles of large or small trees. However, DNA methylation profiles from small trees were more similar while those of large trees were more divergent in terms of genome‐wide DNA methylation differences. The highest variance was observed between two large trees, N167 and N355, both from Skykomish. Similar distribution patterns were observed at methylated cytosine sites in CHG and CHH contexts (Figure S6), except that the highest variance between two large trees, N256 and N175, both from Vancouver but representing different seed year collections, was found in mCHG.
Growth‐associated differentially methylated cytosines clustered into hundreds of distinct genomic context regions
Since methylated cytosines often tend to cluster together, we assessed the tendency of methylated cytosines to co‐occur along genomic blocks of 100 bp with 10‐bp step size and covering at least three methylated cytosines. By that, the DNA methylation data were summarized into 4536 mCG regions, 12 309 mCHG regions and 40 647 mCHH regions. The tree growth‐associated DMRs were identified for each of the three sequence contexts (i.e. mCG‐DMR, mCHG‐DMRs and mCHH‐DMRs). DMRs were determined by MethylKit pairwise comparison between large and small DBH trees if the overall DNA methylation of at least three cytosines within a 100‐bp region differed by 20% with corrected P‐values (Q‐values) less than 0.05 (Figure 2). A logistic regression model was deployed in the comparative analysis with corrections for data overdispersion and adjustment of the influence of the original population, seed harvesting year and tree location in the forest trial (as covariates). Within CG methylation contexts, 83 regions were found to be significantly growth‐associated, with 30 displaying a positive (i.e. hypermethylated DMRs) and 53 a negative correlation (i.e. hypomethylated DMRs) with DBH values. Among the mCHG regions analysed, 219 displayed growth‐associated DNA methylation, with 103 mCHG having positive correlations and 116 having negative correlations. For CHH‐methylation regions, 69 regions were associated, with 18 displaying positive correlations and 51 were negatively correlated with growth. When comparing genomic locations of DMRs with the target RAD loci, we identified 24, 73 and 30 DML for CG, CHG and CHH, respectively. While the majority (103 out of a total of 115 DML, 89.56%) of DML was distinct for the cytosine context, there are 12 RAD loci containing DMRs for different contexts (Figure 2d; Table S4). For instance, six DML contain DMRs of mCG and mCHG contexts, while mCHH‐DMRs were found in four and the other two loci co‐occur with DMRs in mCHG and mCG contexts, respectively. In Norway spruce, mCHG was also the major form of DMRs between needles and somatic embryo cultures (Ausin et al., 2016).
Figure 2.
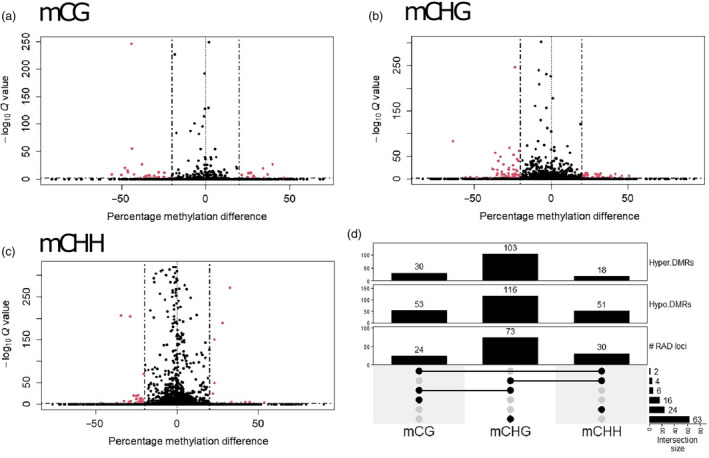
DNA Methylation analysis of Douglas‐fir needles from contrasting growth performance trees. (a–c) Volcano plots indicate differentially methylated CG‐, CHG‐ and CHH‐regions (DMRs) between large and small trees via the logistic regression test, while seed harvesting year, original population and tree location were included for separating the influence of these covariates from the tree growth. Dashed lines indicate cut‐offs for significance that exhibited DNA methylation difference >20% and Benjamini–Hochberg false discovery rate (FDR)‐adjusted P < 0.05. (d) Summary of mCG‐, CHG‐ and CHH‐DMRs with either increased or decreased DNA methylation levels in the large trees (Hyper.DMRs or Hypo.DMRs, respectively) revealed 16, 63 and 24 RAD loci containing DMRs for specific mCG, mCHG and mCHH contexts, respectively. The other 12 DML consist of methylated cytosines in different genomic contexts.
The relationship between DNA methylation and gene expression patterns in the differentially methylated regions
To investigate the potential functional consequences of DNA methylation variation, genes located at or adjacent to the DML (the closest gene in each direction from the DML) were identified (Figure 3a; Table S5). Among a total of 115 DML, there are six DML overlapping with coding regions of genes (two exonic and four intronic DML), another six DML in putative regulatory regions (one and five located within 5 kbp from the gene at 5′ upstream or 3′ downstream regions, respectively), and 56 intergenic DML that are located from 5 kbp up to 500 kbp of the nearest genes. In the scaffolds containing the other 47 DML (40.9% of total DML), no gene was predicted and annotated. Due to the fragmentation in the current genome assembly (with an N50 of 350 kbp for the complete assembly), we conservatively assigned the remaining DML as unclassified DML in terms of functional characterization. Considering that the average length of these scaffolds is 220 kbp, it is likely that a significant portion of these DML is situated within the gene‐poor regions of the Douglas‐fir genome.
Figure 3.
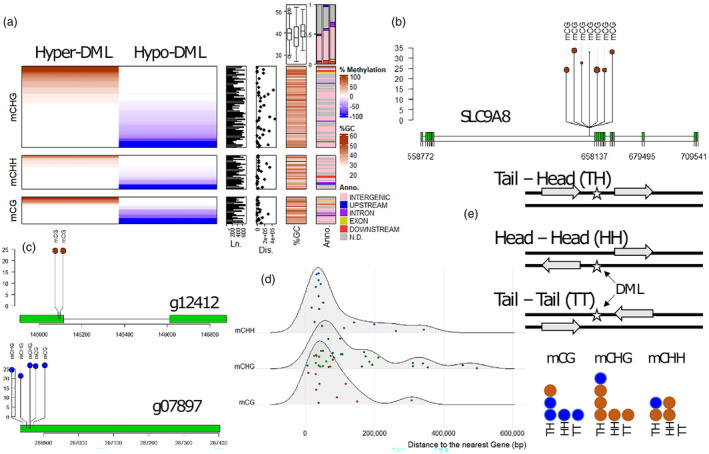
Enrichment and depletion of growth‐related DNA methylation within genomic regions of ddRAD loci. (a) Cytosines for which DNA methylation status was specifically and significantly associated with DBH are summarized for ddRAD loci. Dark brown shaded loci indicate the proportion of cytosines for which DNA methylation increased with DBH (Hypermethylated DML, Hyper‐DML) and light blue indicates cytosines for which DNA methylation decreased with DBH (Hypomethylated DML, Hypo‐DML). DML‐containing growth‐associated cytosine methylation that was enriched in different CG, CHG and CHH‐ contexts is highlighted by mark annotations. Length of DML (Ln. panel), distance (in bp) between DML and the corresponding nearest genes (Dis. panel), and %GC content of DML (%GC panel) are demonstrated as right panels. Based on the genomic locations of DML and the nearest genes, DML were annotated as Exon, Intron, Upstream or Downstream within 5 kbp to the start codon or stop codon, respectively (Anno. Panel). All other DML located on gene‐containing contigs were assigned as distal intergenic loci while the rest was considered as not determined (grey colour) due to the fragmented genome assembly. Two summary graphs for %GC (box plot), and Annotation (bar plot) compare corresponding data between cytosine contexts (from left to right: mCG, mCHG and mCHH). (b) All intronic DML are in very large genes (i.e. >35 kbp). The epigenetic regulation of the largest intron in the gene SLC9A8 (PSME_40274) is shown as an example. (c) The two exonic DML (PSME_12412 and PSME_07897 shown as g12412 and g07897, respectively) are in the first exon or the 5′ beginning of the coding sequences. The y‐axis presents the DNA methylation level (%) of DML. (d) Distal distances between intergenic DML and the corresponding nearest genes were up to 500 kbp but were mainly within 200 kbp. (e) Orientations of genes surrounding the intergenic DML suggest no enrichment of any preferential model. Hypermethylated DMLs are depicted in brown, while hypomethylated DMLs are represented in blue.
In our study, all four intronic DML are in mega‐sized genes from 100 to 180 kbp in length (Table S5). The epigenetic regulation of all these large genes was based on specific DNA methylation patterns of mCG, mCHG or mCHH sites in very large introns (i.e. > 20 kbp, Table S5). Surprisingly, in three out of these four genes, DML‐containing introns were the largest introns of the corresponding multi‐intronic genes (PPP22R5 [PSME_50711], PSME_51400 and SLC9A8 [PSME_40274], Figure 3b and Figure S7). The exceptional gene PSME_32889 has three other introns larger than the DML‐containing intron. In the needle transcriptomes, all these four genes having DML in the introns are highly expressed, while both exonic DML genes (Figure 3c) have low expression levels (Table S6). However, none of the twelve genes having DML overlapping with coding regions or within 5 kbp up/downstream regions were found significantly expressed between trees having contrasting growth performance.
Furthermore, among 56 intergenic DML, there are 21 DML‐containing hypermethylated DMRs (increased DNA methylation level in large trees), while the remaining 35 DML have decreased DNA methylation levels (hypomethylated DMRs) in large trees. In both categories, 46 intergenic DML (82.1% of DML) are located within 200 kbp from the nearest genes (Figure 3d). However, due to the high fragmentation of the current genome assembly, we can only identify surrounding genes in both directions of 15 intergenic DML (Figure 3e). Orientations of surrounding genes of these intergenic DML are likely random, reflected by the observed ratio between Head‐to‐Head (HH): Tail‐to‐Head (TH): Tail‐to‐Tail (TT) types as 1 : 2 : 1 or the ratio between TH:(HH + TT) as 1 : 1. An exception was observed in mCHH‐DML for which the TT type is more common than the HH type.
RNAseq analysis of needle transcriptomes revealed 195 differently expressed genes (DEGs) between trees with contrasting growth performance (Table S7). However, no GO term was found being overrepresented in the annotation of DEGs. Only four DEGs (GLIP6 [PSME_25285], HSP70B [PSME_36272], AP2 [PSME_49273] and PSME_01044) have DML in the surrounding regions with a distance from 56 301 bp (PSME_25285) to 354 614 bp (PSME_36272). Notably, two gene sets of the 195 differentially expressed genes and 83 DML‐surrounding genes shared 311 common GO terms in biological processes (Table S8). While this suggests a potential association between functional activities of DEGs and DNA methylation patterns of the DML‐surrounding genes, it is important to note that several GO terms are relatively broad.
Despite the distal distances between DML and the neighbouring genes, there are several intergenic DML that are located between two highly similar genes (e.g. two GDSL‐motif Lipase/Hydrolase 6, GLIP6 genes involved in defence response to fungal diseases; or two PSME_04839 and PSME_04343 involved in defence response to insects). In the former case, only GLIP6 [PSME_25285] was highly expressed and significantly up‐regulated in the large trees (Figure S7), while transcripts of the other GLIP6 [PSME_16046] were not detectable in the needle transcriptomes. Given that the CG hypermethylated locus that was located at 56301 bp from the downstream GLIP6 [PSME_25285] and at 38382 bp from the upstream GLIP6 [PSME_16046], DNA methylation in mCG context of intergenic regions may selectively facilitate the gene expression. In the latter case, both PSME_04839 and PSME_04343 genes were expressed at a low level and not significantly up−/down‐regulated.
In connection to hypomethylated regions, we found a number of genes (Table S6) involved in signalling pathways of abscisic acid, ethylene [APETALA2/Ethylene responsive factor 17, ERF017 (Xie et al., 2019)], auxin (auxin‐response‐factor 2, ARF2), circadian rhythms (cleavage and polyadenylation factor 04, CPSF04) or regulation of flowering time (CID3 [PSME_50336] and AP2 [PSME_49273]. Among these genes, the gene AP2 [PSME_49273] was significantly down‐regulated in trees with better growth performance, suggesting the influence of mCHH methylation regions on gene expression at 270487 bp distance.
Furthermore, two DEGs HSP70B [PSME_36272] and PSME_01044 are in connection with two DML in the mCHG context into antagonistic directions. A CHG hypomethylated locus is at 162891 bp from the coding region of PSME_01044 which was up‐regulated in trees with large DBH. In contrast, lower gene expressions of HSP70B [PSME_36272] were found in large trees, possibly in a connection with the gain of mCHG at the 354 614‐bp‐distal locus.
In our study, most (69.6%) of DML contain SNPs with a density less than 10 SNPs per 100 bp, while there is no detected SNP in 16 DML (13.9%). Interestingly, 12 out of the 16 unique epigenetic polymorphisms (75%) decrease their methylation levels (Hypomethylated DML in mainly mCHG and mCHH contexts) in large trees in comparison with smaller trees from the same provenance.
Repetitive DNA sequences have a central role in the stabilization of the genome with involvement in virtually any cell process, including DNA methylation profiling. A transposon insertion can facilitate DNA methylation in local genomic regions. In the Douglas‐fir genome, DNA repeats comprise a large proportion with the estimation that 50% or less is covered with unique k = 32 kmers (Neale et al., 2017). In total, 57 growth‐associated DML (49.6% of total DML) were found in repetitive DNA contexts (Figure 4). Most of the DML are linked to Long‐Terminal Repeats (LTR, 36.5%), followed by DNA transposons (6.9%) and Long Interspersed Nuclear Elements (LINE, 3.5%). While hypomethylated DML were slightly enriched in LTR‐DML (26 out of 42 total LTR‐DML, 61.9%), an approximately equal ratio between hypermethylated‐ versus hypomethylated DML was found in the context of DNA transposons (4 vs. 4 DML, respectively). In summary, these findings suggest that the acquisition and loss of DNA methylation within various types of repeats may play a role in regulating growth. Interestingly, among 16 DML without detected SNP, there are eight DML containing no repetitive sequences.
Figure 4.
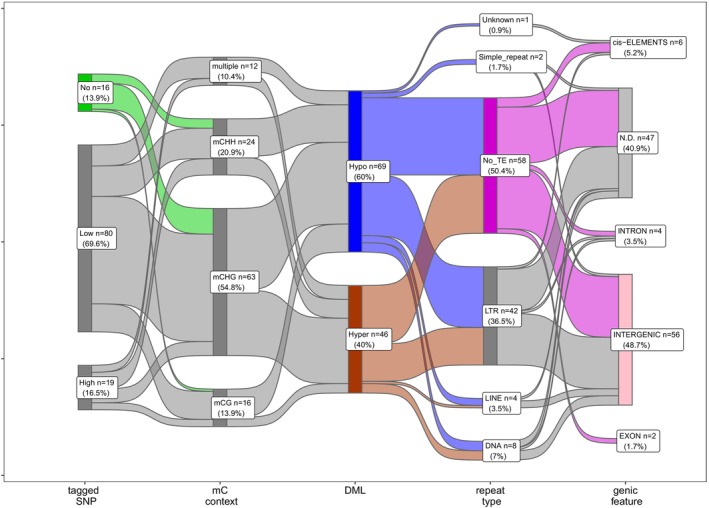
Association of differentially methylated loci (DML) with detected SNPs, repeat sequences and gene annotation. The number of DML (n) and corresponding percentage (%) to the total of 115 DML are shown in every group. TE, Transposable elements; LTR, Long‐Terminal Repeats; LINE, Long Interspersed Nuclear Elements; DNA, DNA transposons; and cis‐ELEMENTs, 5 kb up/downstream of the coding regions.
Discussion
This study aims to determine epigenetic patterns associated with the growth performance of Douglas‐fir. Exploiting a provenance trial of trees from different native populations which have grown in a common garden for more than 40 years, we demonstrated that DNA methylation profiles of about hundred genome regions were associated with the contrasting growth patterns. Apparently, mechanisms of cytosine methylation in all sequence contexts (i.e. mCG, mCHG and mCHH) have contributed to gene and transposon regulation, potentially facilitating plant fitness and stem growth in changing environments.
The height and diameter growth of plant stems are two basic tree size variables that are fundamental to most forests (Diaz et al., 2016). Tree height growth plays an important role in securing carbon gain supported by light capture, while tree diameter growth ensures mechanical support and water‐absorbing capacity (Meinzer et al., 2005). So far, our knowledge about the genetic basis of tree growth is limited by polygenicity, the distribution of effect sizes between causative loci, and how the genetic architecture of adaptation changes under varying selective forces (Lind et al., 2018). Using univariate and multivariate genome‐wide association (GWAS) and genotype‐environment association (GEA) analysis, a set of 130 genes with biological functions in growth, phenology and stress signalling was genetically associated with cold adaptation in Douglas‐fir (de La Torre et al., 2021).
One of the limitations of this study is that we could only perform genome‐wide DNA methylation analysis on a low number of Douglas‐fir trees. Thus, we deployed a logistic regression‐based approach using overdispersion correction and tiling windows (Akalin et al., 2012), that is suitable for such comparison with a quite small number of biological samples and also improves statistical power of data from reduced RRBS. Like those of other gymnosperm species, the Douglas‐fir genome is quite large (15 Gbp). Yet the genome assembly is still highly fragmented and incomplete (Neale et al., 2017; Velasco et al., 2022). On one hand, it calls for new efforts of Douglas‐fir's genome improvement, probably with long‐read sequencing and high‐throughput long‐range data such as BioNano optical maps or Hi‐C chromosomal conformation sequencing (Cao et al., 2022; Wan et al., 2022). Nevertheless, resolving patterns of genome‐wide DNA methylation at the population scale requires intensive sequencing, while our approach offered a cost‐efficient method providing DNA methylation profiles of target regions together with genetic variations. By that, genetic signatures of polygenic phenotypes and associated methylation patterns can be simultaneously investigated. Moreover, as shown in this study, the methylKit‐based framework can be generalized to handle additional covariates such as genotype background or original provenance, age of trees or seed year collections, locations of trees or locations of provenance trials. Therefore, this multiple regression approach shows versatility for epigenetic studies in ecology and evolution. Nevertheless, further investigations with a larger number of trees and ideally from different provenance trials are required to understand the role of SNPs in close proximity to the growth‐associated DML as well as the relationship between candidate genes from genetic and epigenetic approaches.
Maintenance and regulation of DNA methylome in gymnosperms gigantic genomes
Genomes of gymnosperm species including Douglas‐fir have been expanded to gigantic sizes (20–40 Gbp) due to slow TE removal and ultimately to rampant TE expansion [up to 70% of the genome (Leitch and Leitch, 2012; Niu et al., 2022)]. Thus, it is tempting to speculate that it might require more energy and resource costs to maintain high DNA methylation levels, especially at non‐GC cytosine sites for the suppression of TE activity as well as the precise splicing of highly active mega‐size genes, in which TEs were inserted and expanded in the intronic regions. Indeed, using the RRBS approach, we observed a high abundance of highly methylated cytosines in both mCG and mCHG contexts (44.36% and 47.69%, respectively). Other studies using whole genome bisulphite sequencing (WGBS) suggested even higher values of global mCG and mCHG DNA methylation [74.7% and 69.1%, respectively, in Norway spruce needles (Ausin et al., 2016) and 88.4% and 81.6%, respectively, in Chinese pine needles (Niu et al., 2022)] as the highest DNA methylation levels in the largest sequenced genome so far.
Numerous long introns, which can be several tens or hundreds of kilobases in length, are a notable characteristic of the Douglas‐fir genome, similar to those in other conifer genomes (Wan et al., 2022). Insertion of an exogenous T‐DNA with this size range into introns of Arabidopsis genes may disrupt the gene function by affecting proper transcription and splicing activities (Osabe et al., 2017). Despite the presence of these atypically long introns, mega‐large genes can function effectively in conifers, many even exhibited high expression levels (Niu et al., 2022). Our data also indicates a high expression level of the mega‐large genes with intronic DML. Although growth‐associated regulation of DNA methylation may influence neither the expression levels nor splicing patterns of these large genes (Table S6; Figures S7 and S8), further analysis using long‐read sequencing such as Iso‐Seq for full‐length mRNA sequencing (An et al., 2018) could directly detect if splicing variation can be a subject for modulation of growth optimization. In the case of the Arabidopsis H3K9 demethylase IBM1 gene with an atypic long intron, expression of the gene is regulated epigenetically by both H3K9me2 and DNA methylation of the intron (Rigal et al., 2012). Further investigations are necessary to understand whether such long introns in gymnosperms harbour regulatory sequences. An example is that the second intron of AGAMOUS (AG) gene in A. thaliana was targeted by several positive and negative regulators (Wu et al., 2018).
One potential strategy for offsetting the expense associated with replicating and maintaining billions of DNA methylation sites may involve a reduction in the cell division rate, consequently affecting the growth rate. However, the relationship between plant height, cell division and generation time is rather complicated in plants (Bromham et al., 2015). The functions of DML‐associated genes indicate the interactions between genes involved in growth and stress tolerance. A negative correlation between Douglas‐fir growth and cold hardiness was observed in field‐ and controlled‐environment experiments (Darychuk et al., 2012). Recently, the growth plasticity and modularity of trees were suggested as an evolutionary advantage for longer lifespans (Piovesan and Biondi, 2021). Nevertheless, in this study we did not observe any significant correlation between variations in global DNA methylation levels in needles and the contrasting growth performance (Figure S5).
Genes potentially influenced by DNA methylation are related to growth and stress tolerance
On one hand, DNA methylation is highly dynamic, and there is substantial variation among individuals or (sub)populations. On the other hand, DNA methylation is a key component of the epigenome that controls, stabilizes and/ or marks the transcriptional potential of a genomic region. We identified 83 genes within or surrounding 43 DML (37.4% of the total 115 DML). Among them, four genes were found to be differentially expressed by using the RNAseq approach. We expect that the complete genome of Douglas‐fir and improved gene annotation in the future can help to find more genes of which gene expression levels are influenced by DML.
Overall, the growth‐associated DML identified in Douglas‐fir needles possibly play a pivotal role in shaping the fitness and growth dynamics of these trees. We hypothesize that these DMLs are not randomly distributed but are strategically located near genes associated with a range of fitness‐related processes. Specifically, they were found in close proximity to genes involved in size growth, stress management, plant development and energy resources (Figure S9). This spatial relationship between DNA methylation and functionally relevant genes suggests a finely tuned epigenetic regulatory system at play in Douglas‐fir trees. Interestingly, many of these genes shared similar GO terms with those that exhibited differential expression patterns among trees with contrasting growth performance. This convergence of DNA methylation and gene expression patterns hints at a coordinated mechanism through which epigenetic modifications, such as DNA methylation, may influence the transcriptional potential of genes, ultimately affecting the growth and overall fitness of the tree. Understanding these epigenetic regulatory networks in forest trees like Douglas‐fir not only sheds light on the molecular basis of growth and adaptation but also has practical implications for tree breeding and forest management strategies, aiming to enhance growth and resilience in the face of changing environmental conditions.
Materials and methods
Study system and plant material
This study was conducted in the international Douglas‐fir (Pseudotsuga menziesii) provenance trial in the Iloo forest, Neumünster, Germany (45 m a.s.l.) with 750 mm mean annual precipitation and a mean annual temperature of 8.1 °C. The mean annual wind speed is 4 m/s and late frost can occur at the end of June. The soil cover of the studied area is mainly represented by humus soils (Podzols).
The trial was established in 1982 by planting 4‐year‐old seedlings with 2 m × 2 m spacing in plots of 8 m × 8 m (16 plants per plot). Trial design is an incomplete randomized block design with three replicates. Most of the 169 entries go back to a seed collection in 1976 in the native range in North America. For four coastal provenances (Pseudotsuga menziensii var. menziensii or ‘green Douglas‐fir’), seed harvested in 1971 was additionally available and was integrated in the trial as separate entries. For three of these provenances 1971 seed was from the same identified seed stands (Ashford, Vancouver and Randle). The 1971 seed of the fourth provenance (Skykomish) was harvested in a presumably different but nearby seed stand. Sixteen trees from these four provenances (Table 1) having contrasting growth performances in the same or close‐by plots were selected for the study (Table S1; Figure S1).
Measurement campaigns and needle sampling
Fieldwork was conducted between 22–25th November 2021 from 7 to 16 o'clock. The measurement campaign included plant height (m), DBH (cm), crown shape, frost damage and bud break score. The measurements were carried out by one person and followed the protocol proposed for Douglas‐fir as part of the Tree4Future FP7 project (Bastien et al., 2011). At the end of the campaign, the needle material of selected trees was sampled nearly simultaneously between 10 am and 2 pm using shotguns. Needles sampled from the twigs were stored at −60 °C before DNA isolation.
Genomic DNA extraction, library preparation and Illumina sequencing
Genomic DNA of freeze‐dried needle samples was extracted with the Qiagen DNeasy Plant Mini Kit. The quality of extracted DNA was assessed on 1.5% agarose gels, and DNA quantity was determined fluorometrically using the Qubit dsDNA HS assay kit (Thermo‐Fisher Scientific) read on the Invitrogen Qubit 4 fluorometer reader (Thermo‐Fisher Scientific). About 5 μg genomic DNA was double‐digested by PstI and ApeKI enzymes. Resulting DNA fragments of size 200–400 bp were two‐sided selected using MAgSi‐NGSprep Plus beads (Magtivio B.V.) with ratio 0.6 Volume: 1.0 Volume (following product instructions). This yields about 150 ng size‐selected DNA material which is enriched for gene islands for both genomic DNA libraries (ddRADseq) and bisulphite DNA libraries. The ddRADseq libraries were prepared at LGC Genomics GmbH (Berlin, Germany) according to established protocols (Baird et al., 2008; Peterson et al., 2012).
Bisulphite conversion of size‐selected DNA material was performed using the MethylEdge Bisulfite Conversion System (Promega GmbH). Library construction was performed using the SPLAT system (Raine et al., 2017) with minor modifications of overhangs of splint adaptors designed to fit only converted ApeKI/PstI ends. The ddRAD and methyl‐ddRAD libraries were amplified using MyTaq DNA polymerase (Meridian Bioscience) with indexed Adaptor primers in an 18‐cycle and 21‐cycle PCR, respectively. Paired‐end 150‐bp sequencing was then performed using the Illumina NextSeq 500/550 v2 sequencers at LGC Genomics GmbH (Berlin, Germany), generating a total of 58.9 million unconverted reads and 55.8 million bisulphite‐converted reads (Table S2).
Processing of the Douglas‐fir reference genome
The most recent version of the Douglas‐fir reference genome with high‐quality gene annotation (Velasco et al., 2022) was used. Since the assembly was highly fragmented (9 163 472 contigs with a length range of 78 bp to 3.89 Mbp and N50 = 350 312 bp) for downstream analysis of atypical large genes with long introns in gymnosperm genomes, we retain only the genomic contigs with high continuity (≥10 000 bp in length) as the source of the reference genome sequence. This reduced reference includes 13.86 Gbp (88.3% total length of the complete assembly 15.7 Gbp) distributed across 72 815 contigs (0.8% number of the initial contigs) and contains 50 738 Douglas‐fir genes (98.67% of the total 51 419 Douglas‐fir predicted genes). Using ddRADseqTools (v0.40, Mora‐Marquez et al., 2017), the sequences were in silico digested by PstI and ApeKI enzymes, resulting in 1 098 424 fragments with a length range of 200–700 bp. The collection of these fragments was considered as the target ddRAD loci and subsequently used as the mapping reference sequences. About half of these target loci (554 564 loci; 50.5%) are located on the gene‐containing contigs. Of these, 52 162 genic loci (4.7%), 67 678 regulatory loci (6.2%) and 434 724 intergenic loci (39.6%) are associated with 46 952 Douglas‐fir genes (91.3% of the total 51 419 Douglas‐fir predicted genes, Table S9).
Quality control of genomic reads and read mapping
Paired‐end quality was assessed using FastQC (v0.11.9). Trim‐Galore (v0.6.7), a wrapper script around cutadapt (v1.18, Martin, 2011), was used for quality trimming. Parameters for read quality filtering were set as follows: Minimum length of 65 bp; clipping 18, 22, 15 and 18 bp from 5′‐end read 1, 5′‐end read 2, 3′‐end read 1 and 3′‐end read 2 with required Phred quality score of 30. Poly‐G (≥20 bp) artefacts appearing on two‐channel Illumina NextSeq sequencers were removed. High‐quality reads from bisulphite‐converted (2.7 million reads ±2.0 per library) and unconverted (3.65 million reads ±0.2 per library) DNA libraries were simultaneously mapped to the mapping reference sequences using gemBS (v3.5.5, Merkel et al., 2019). The ENCODE guidelines for processing reduced RRBS data using gemBS for alignment and methylation extraction were followed (v4, Chatterjee et al., 2012).
Identification of growth‐promoting differentially methylated regions
DNA methylation is highly dynamic, and there is substantial variation among individuals or (sub)populations. To reveal differences in DNA methylation between two groups of trees with contrasting growth performance, from gemBS output data, differentially methylated regions were identified using R package methylKit (v1.22.0, Akalin et al., 2012). To avoid the bias in the statistical test that might occur due to systematic oversampling of reads in certain samples, bases with a read depth above the 99.9th percentile of coverage were filtered out, and subsequently, read coverage distributions between samples were normalized. From the filtered data, only common cytosines in at least three large trees and three small trees were retained.
For each 100‐bp sliding window with at least three methylated cytosines and 10‐bp steps, the proportions of methylated reads between large and small tree groups were compared using a Chisq test with basic overdispersion correction (McCullagh and Nelder, 1989). The P‐values were corrected to genome‐wide FDR based q‐values, using the sliding linear model (Wang et al., 2011). Original provenance, seed harvesting year, and tree location in the provenance trial were included in the logistic regression as covariates. The regions with a 20% methylation difference and q‐values <0.05 were considered significant and summarized if they belong to a target locus, resulting in growth‐promoting differentially methylated loci.
DML annotation and enrichment analysis
To annotate repetitive sequences in scaffolds in which one or more DML were found, sequences of all characterized TEs in the latest Douglas‐fir genome assembly (https://treegenesdb.org/FTP/Genomes/Psme/v1.0/annotation/) were used as reference database with the RMBlast search function of RepeatMasker (version 4.1.2‐p1). Repeat records having less than 100‐bp in length were filtered. Genomic locations of DML were compared with those of annotated TEs by using the findOverlaps function of the R package GenomicRanges (v1.47.6, Lawrence et al., 2013).
GO enrichment analyses were performed in two approaches. First, the R package topGO (Alexa and Rahnenführer, 2009) was used with the published GO annotation (Velasco et al., 2022). Second, Douglas‐fir transcript sequences were functionally annotated by using TRAPID (v2.0, Bucchini et al., 2021) with EggNOG reference database (v4.5.1, Huerta‐Cepas et al., 2016). Eighty‐eight percent of Douglas‐fir transcript models (45 248 sequences) were sorted into 12 313 gene families with 25 643 sequences (49.9%) that can be assigned to 11 056 relevant Gene ontology terms (GOs). DML were classified and annotated with gene features using snpEff (v5.1, Cingolani et al., 2012) based on their genomic locations, such as intronic, exonic, 5‐kb up/downstream of coding sequences or intergenic regions. DML locating on the non‐gene‐carrying scaffolds were conservatively assigned to the unclassified DML group.
To test which biological processes were overrepresented in the set of DML‐associated gene sequences (as compared to the rest of all Douglas‐fir genes), we performed the subset functional enrichment analyses as implemented in TRAPID application, using the hypergeometric distribution with the Benjamini–Hochberg correction for multiple hypothesis testing (q‐value <0.05).
SNP calling and annotation
Methylation and sequence variant calling are performed simultaneously in the gemBS pipeline using default settings. The default filter cut‐offs were taken from GATK best practices with genotype quality below 20 (q20), quality by depth below 2 (qd2), Fisher strand above 60 (fs60) and RMS mapping quality below 40 (mq40). We annotated the resulting SNPs using snpEff (v5.1, Cingolani et al., 2012) with the above‐described gene annotation databases (section 4.6).
Total RNA extraction, mRNAseq library preparation and sequencing
For the isolation of total RNA from Douglas‐fir needles, on 19th June 2023 freshly collected first‐year needles from the 16 studied trees were rapidly frozen in liquid nitrogen and subsequently stored at −80 °C until required for processing. The extraction of total RNA was conducted utilizing the Qiagen RNeasy Plant Mini Kit with slight modifications made to the standard protocol provided by the manufacturer. Initially, approximately 100 mg of needle samples were finely ground into a powder using liquid nitrogen. The resulting powdered sample was then reconstituted in 900 μL of buffer RLC and divided evenly between two QIAshredder columns. Following a full‐speed centrifugation for 2 min, the collected flow‐through from both columns was carefully transferred into a new microfuge tube. Subsequent precipitation, washing and elution steps were executed in accordance with manufacturer's guidelines. The evaluation of both the quantity and quality of the extracted RNA samples was carried out through gel electrophoresis on a 1% agarose gel and via Bioanalyzer 2100 (Agilent Technologies). RNAseq libraries were prepared by Novogene Co., Ltd using a messenger RNA enrichment approach with poly‐T‐oligo‐coated magnetic beads. The mRNA molecules were first randomly fragmented and then the synthesis of first‐strand cDNA was performed using random hexamer primers. Subsequently, the second‐strand cDNA synthesis occurred with the incorporation of an Illumina buffer. The resulting second‐strand cDNA fragments underwent Nick translation to obtain appropriate products, which were further purified, end‐repaired, A‐tailed and ligated with adapters. Following this, PCR enrichment was conducted on fragments of the desired size, introducing indexed P5 and P7 primers. The quality assessment of the prepared libraries was conducted using Agilent Bioanalyzer 2100. Using the Illumina Novaseq6000 S4 sequencing platform, pair‐end sequencing (2 × 150 bp) was performed on a total 16 libraries, yielding a cumulative data output with 160 raw gigabases (Table S2).
RNAseq quality control and gene expression analysis
To remove adaptor contamination and low‐quality reads, clean reads were generated from all 16 samples using Trim Galore by filtering raw reads that contained adaptor contamination, with the following parameters: minimum length of 65 bp, clipping 10 bp from 3′‐ends of both reads with required Phred quality score of 30. These high‐quality cleaned reads obtained from all constructed libraries were then mapped to the Douglas‐fir Psme1 genome (Neale et al., 2017) using HISAT2 (v2.2.1, Kim et al., 2019) with maximum length intron as 900 kbp (i.e. ‐‐dta, ‐‐max‐intronlen 900 000). Alignment rate ranged from 83.56% to 95.56% (Table S2). Read counts were generated using StringTie (v2.1.7, Shumate et al., 2022) with options ‐e ‐B and annotated gene models (Velasco et al., 2022). Differentially expressed (DE) gene transcripts were identified using a two‐factor negative binomial Wald test (design = ~Provenance + Growth) in DEseq2 (v1.36, Love et al., 2014). Provenance was included as a co‐factor only to control for inter‐provenance variation. We then performed the pairwise comparisons between trees with contrasting growth performances where log fold changes were shrunk with the lfcShrink function using ‘ashr’ shrinkage method (Stephens, 2017) for a precise log2 fold change variance calculation (Figure S10). Benjamini–Hochberg adjusted P‐values <0.05 were used to evaluate significance. Functional enrichment of Gene Ontology (GO) terms for differentially expressed genes was performed in a similar way as DML genes (see above). Common GO terms of DEGs and those of DML genes were reported using the functional comparison tools of TRAPID platform (Bucchini et al., 2021).
Statistical analysis
All statistical tests and plots were performed using R 4.2.2 in RStudio (v 2022.12.0).
Conflict of interest
The authors declare no competing interests.
Author contributions
O.G. conceived the original idea; O.G., W.S., M.H. and G.T.H.V. were involved in experimental design; G.V.T.H. performed experiments; G.V.T.H. and X.H.C. analysed the data; G.V.T.H., X.H.C. and O.G. wrote the manuscript and discussed it with all authors.
Accession numbers
The clean and high‐quality Illumina reads which were obtained by removing adaptors and low‐quality reads from raw data of ddRADseq and ddMethylRADseq (Accession Nr. SRR23926251–SRR23926282) and generated from Douglas‐fir trees (Accession Nr. SAMN33836062–SAMN33836077) are available under NCBI BioProject ID PRJNA946939. RNAseq raw reads were deposited under accession numbers SRR26532385–SRR26532400. Douglas‐fir genome and annotation were previously published (Neale et al., 2017; Velasco et al., 2022) and are available at TreeGenes (treegenesdb.org/FTP/Genomes/Psme/v1.0).
Supporting information
Figure S1 Stem diameter at breast height (DBH) values (cm) of selected representative trees, among other Douglas‐fir trees from the four studied provenances in the provenance trial in Iloo, Neumünster, Germany.
Figure S2 Significant correlation between tree height (m) and stem diameter at breast height (DBH) values (cm).
Figure S3 Global methylation levels of cytosines in mCG (7157 sites), mCHG (13 412 sites) and mCHH contexts (76 554 sites) from needles of 16 Douglas‐fir trees.
Figure S4 Histogram distribution of methylation status of cytosines in different sequence contexts.
Figure S5 Relationship between global DNA methylation levels and DBH values (with that from large and small trees in green and cyan, respectively, A–C) or total RRBS reads (D–F).
Figure S6 A Principal Component Analysis (PCA) plot on all variant mC sites.
Figure S7 Expression level of two duplicated genes, GLIP6 and OSI (A–D) and four mega‐intron genes (E–H).
Figure S8 Graphical representation (sashimi plot by rmats2sashimiplot) of mRNA transcripts of the four mega‐sized genes containing intronic DML.
Figure S9 Functional characterization of genes associated with DML reveals growth‐optimized pathways.
Figure S10 MA plot of Differentially Expressed Genes between two groups of contrasting growth Douglas‐fir trees without (A, B) or with Provenance as covariate (C, D).
Table S1 Details on phenotypic traits and predictive covariates in a logistic regression model for growth‐associated comparative analysis.
Table S2 Overview of NGS input.
Table S3 DNA Methylation and Variant Calling output from the gemBS pipeline.
Table S4 Summary of Growth‐associated Differentially Methylated Regions (DMRs) per RAD locus.
Table S5 Annotation of Growth‐associated Differentially Methylated Loci (DML) with Gene features based on their genomic locations.
Table S6 Gene annotation of the DML‐associated genes.
Table S7 List of differentially expressed genes among trees with contrasting growth performance and Provenance as the second factor.
Table S8 GO terms in Biological Process (BP) present in Differentially Expressed Genes (DEG) and DML‐associated genes (DML genes).
Table S9 Summary of targeted RAD loci as reference sequences.
Acknowledgements
The authors thank P. Meyer for her technical support in the lab, D. Schmidt for support in phenotyping in the provenance trial; H. Kupfer (NW‐FVA) and ISOGEN GmbH (Göttingen, Germany) for support with sampling. This work was supported by funds from the German Federal Ministry of Food and Agriculture (BMEL) represented by the Agency for Renewable Resources (FNR; Reference number: 2220NR037A). These funders did not play any role in the design of the study or collection, analysis or interpretation of data or in writing the manuscript. Open Access funding enabled and organized by Projekt DEAL.
References
- Akalin, A. , Kormaksson, M. , Li, S. , Garrett‐Bakelman, F.E. , Figueroa, M.E. , Melnick, A. and Mason, C.E. (2012) methylKit: a comprehensive R package for the analysis of genome‐wide DNA methylation profiles. Genome Biol. 13, R87. [DOI] [PMC free article] [PubMed] [Google Scholar]
- Alexa, A. and Rahnenführer, J. (2009) Gene set enrichment analysis with topGO. Bioconductor Improv. 27, 1–26. [Google Scholar]
- An, D. , Cao, H. , Li, C. , Humbeck, K. and Wang, W. (2018) Isoform sequencing and state‐of‐art applications for unravelling complexity of plant transcriptomes. Genes, 9, 43. [DOI] [PMC free article] [PubMed] [Google Scholar]
- Anekonda, T. , Jones, C. , Smith, B.N. and Hansen, L.D. (2004) Differences in physiology and growth between coastal and inland varieties of Douglas‐fir seedlings in a common garden. Thermochim Acta, 422, 75–79. [Google Scholar]
- Ausin, I. , Feng, S. , Yu, C. , Liu, W. , Kuo, H.Y. , Jacobsen, E.L. , Zhai, J. et al. (2016) DNA methylome of the 20‐gigabase Norway spruce genome. PNAS, 113, E8106–E8113. [DOI] [PMC free article] [PubMed] [Google Scholar]
- Avanzi, C. , Piermattei, A. , Piotti, A. , Buntgen, U. , Heer, K. , Opgenoorth, L. , Spanu, I. et al. (2019) Disentangling the effects of spatial proximity and genetic similarity on individual growth performances in Norway spruce natural populations. Sci. Total Environ. 650, 493–504. [DOI] [PubMed] [Google Scholar]
- Baird, N.A. , Etter, P.D. , Atwood, T.S. , Currey, M.C. , Shiver, A.L. , Lewis, Z.A. , Selker, E.U. et al. (2008) Rapid SNP discovery and genetic mapping using sequenced RAD markers. PloS One, 3, e3376. [DOI] [PMC free article] [PubMed] [Google Scholar]
- Bansal, S. , Harrington, C.A. and St Clair, J.B. (2016) Tolerance to multiple climate stressors: a case study of Douglas‐fir drought and cold hardiness. Ecol. Evol. 6, 2074–2083. [DOI] [PMC free article] [PubMed] [Google Scholar]
- Bastien, J.‐C. , Michaud, D. , Kowalczyk, J. and Liesebach, M. (2011) Common protocols and reference standards for selected traits and species. Trees4Future Designing Trees for the Future project. https://www.trees4future.eu/uploads/t4fdeliverables/T4F_D21_submitted.pdf
- Brautigam, K. , Vining, K.J. , Lafon‐Placette, C. , Fossdal, C.G. , Mirouze, M. , Marcos, J.G. , Fluch, S. et al. (2013) Epigenetic regulation of adaptive responses of forest tree species to the environment. Ecol. Evol. 3, 399–415. [DOI] [PMC free article] [PubMed] [Google Scholar]
- Bromham, L. , Hua, X. , Lanfear, R. and Cowman, P.F. (2015) Exploring the relationships between mutation rates, life history, genome size, environment, and species richness in flowering plants. Am. Nat. 185, 507–524. [DOI] [PubMed] [Google Scholar]
- Bucchini, F. , Del Cortona, A. , Kreft, L. , Botzki, A. , Van Bel, M. and Vandepoele, K. (2021) TRAPID 2.0: a web application for taxonomic and functional analysis of de novo transcriptomes. Nucleic Acids Res. 49, e101. [DOI] [PMC free article] [PubMed] [Google Scholar]
- Cao, H.X. , Vu, G.T.H. and Gailing, O. (2022) From genome sequencing to CRISPR‐based genome editing for climate‐resilient forest trees. Int. J. Mol. Sci. 23, 966. [DOI] [PMC free article] [PubMed] [Google Scholar]
- Chatterjee, A. , Rodger, E.J. , Stockwell, P.A. , Weeks, R.J. and Morison, I.M. (2012) Technical considerations for reduced representation bisulfite sequencing with multiplexed libraries. J. Biomed. Biotechnol. 2012, 741542. [DOI] [PMC free article] [PubMed] [Google Scholar]
- Cingolani, P. , Platts, A. , Wang, L.L. , Coon, M. , Nguyen, T. , Wang, L. , Land, S.J. et al. (2012) A program for annotating and predicting the effects of single nucleotide polymorphisms, SnpEff: SNPs in the genome of Drosophila melanogaster strain w1118; iso‐2; iso‐3. Fly, 6, 80–92. [DOI] [PMC free article] [PubMed] [Google Scholar]
- Darychuk, N. , Hawkins, B.J. and Stoehr, M. (2012) Trade‐offs between growth and cold and drought hardiness in submaritime Douglas‐fir. Can. J. For. Res. 42, 1530–1541. [Google Scholar]
- Deng, J. , Shoemaker, R. , Xie, B. , Gore, A. , LeProust, E.M. , Antosiewicz‐Bourget, J. , Egli, D. et al. (2009) Targeted bisulfite sequencing reveals changes in DNA methylation associated with nuclear reprogramming. Nat. Biotechnol. 27, 353–360. [DOI] [PMC free article] [PubMed] [Google Scholar]
- Diaz, S. , Kattge, J. , Cornelissen, J.H. , Wright, I.J. , Lavorel, S. , Dray, S. , Reu, B. et al. (2016) The global spectrum of plant form and function. Nature, 529, 167–171. [DOI] [PubMed] [Google Scholar]
- Dubin, M.J. , Zhang, P. , Meng, D.Z. , Remigereau, M.S. , Osborne, E.J. , Casale, F.P. , Drewe, P. et al. (2015) DNA methylation in Arabidopsis has a genetic basis and shows evidence of local adaptation. Elife, 4, e05255. [DOI] [PMC free article] [PubMed] [Google Scholar]
- Eichten, S.R. , Swanson‐Wagner, R.A. , Schnable, J.C. , Waters, A.J. , Hermanson, P.J. , Liu, S.Z. , Yeh, C.T. et al. (2011) Heritable Epigenetic Variation among Maize Inbreds. PLoS Genet. 7, e1002372. [DOI] [PMC free article] [PubMed] [Google Scholar]
- Finnegan, E.J. , Peacock, W.J. and Dennis, E.S. (1996) Reduced DNA methylation in Arabidopsis thaliana results in abnormal plant development. PNAS, 93, 8449–8454. [DOI] [PMC free article] [PubMed] [Google Scholar]
- Gehring, M. , Huh, J.H. , Hsieh, T.F. , Penterman, J. , Choi, Y. , Harada, J.J. , Goldberg, R.B. et al. (2006) DEMETER DNA glycosylase establishes MEDEA polycomb gene self‐imprinting by allele‐specific demethylation. Cell, 124, 495–506. [DOI] [PMC free article] [PubMed] [Google Scholar]
- George, J.P. , Schueler, S. , Grabner, M. , Karanitsch‐Ackerl, S. , Mayer, K. , Stierschneider, M. , Weissenbacher, L. et al. (2021) Looking for the needle in a downsized haystack: whole‐exome sequencing unravels genomic signals of climatic adaptation in Douglas‐fir (Pseudotsuga menziesii). Ecol. Evol. 11, 8238–8253. [DOI] [PMC free article] [PubMed] [Google Scholar]
- Grattapaglia, D. , Plomion, C. , Kirst, M. and Sederoff, R.R. (2009) Genomics of growth traits in forest trees. Curr. Opin. Plant Biol. 12, 148–156. [DOI] [PubMed] [Google Scholar]
- Gu, H.C. , Smith, Z.D. , Bock, C. , Boyle, P. , Gnirke, A. and Meissner, A. (2011) Preparation of reduced representation bisulfite sequencing libraries for genome‐scale DNA methylation profiling. Nat. Protoc. 6, 468–481. [DOI] [PubMed] [Google Scholar]
- Gugger, P.F. , Fitz‐Gibbon, S. , Pellegrini, M. and Sork, V.L. (2016) Species‐wide patterns of DNA methylation variation in Quercus lobata and their association with climate gradients. Mol. Ecol. 25, 1665–1680. [DOI] [PubMed] [Google Scholar]
- Hawkins, B.J. and Stoehr, M. (2009) Growth, phenology, and cold hardiness of 32 Douglas‐fir full‐sib families. Can. J. For. Res. 39, 1821–1834. [Google Scholar]
- He, L. , Huang, H. , Bradai, M. , Zhao, C. , You, Y. , Ma, J. , Zhao, L. et al. (2022) DNA methylation‐free Arabidopsis reveals crucial roles of DNA methylation in regulating gene expression and development. Nat. Commun. 13, 1335. [DOI] [PMC free article] [PubMed] [Google Scholar]
- Huerta‐Cepas, J. , Szklarczyk, D. , Forslund, K. , Cook, H. , Heller, D. , Walter, M.C. , Rattei, T. et al. (2016) eggNOG 4.5: a hierarchical orthology framework with improved functional annotations for eukaryotic, prokaryotic and viral sequences. Nucleic Acids Res. 44, D286–D293. [DOI] [PMC free article] [PubMed] [Google Scholar]
- Huff, J.T. and Zilberman, D. (2014) Dnmt1‐independent CG methylation contributes to nucleosome positioning in diverse eukaryotes. Cell, 156, 1286–1297. [DOI] [PMC free article] [PubMed] [Google Scholar]
- Jaenisch, R. and Bird, A. (2003) Epigenetic regulation of gene expression: how the genome integrates intrinsic and environmental signals. Nat. Genet. 33, 245–254. [DOI] [PubMed] [Google Scholar]
- Jansen, K. , Du, B. , Kayler, Z. , Siegwolf, R. , Ensminger, I. , Rennenberg, H. , Kammerer, B. et al. (2014) Douglas‐fir seedlings exhibit metabolic responses to increased temperature and atmospheric drought. PloS One, 9, e114165. [DOI] [PMC free article] [PubMed] [Google Scholar]
- Jullien, P.E. , Mosquna, A. , Ingouff, M. , Sakata, T. , Ohad, N. and Berger, F. (2008) Retinoblastoma and its binding partner MSI1 control imprinting in Arabidopsis. PLoS Biol. 6, e194. [DOI] [PMC free article] [PubMed] [Google Scholar]
- Junker, L.V. , Kleiber, A. , Jansen, K. , Wildhagen, H. , Hess, M. , Kayler, Z. , Kammerer, B. et al. (2017) Variation in short‐term and long‐term responses of photosynthesis and isoprenoid‐mediated photoprotection to soil water availability in four Douglas‐fir provenances. Sci. Rep. 7, 40145. [DOI] [PMC free article] [PubMed] [Google Scholar]
- Kim, D. , Paggi, J.M. , Park, C. , Bennett, C. and Salzberg, S.L. (2019) Graph‐based genome alignment and genotyping with HISAT2 and HISAT‐genotype. Nat. Biotechnol. 37, 907–915. [DOI] [PMC free article] [PubMed] [Google Scholar]
- Kleiber, A. , Duan, Q.X. , Jansen, K. , Junker, L.V. , Kammerer, B. , Rennenberg, H. , Ensminger, I. et al. (2017) Drought effects on root and needle terpenoid content of a coastal and an interior Douglas fir provenance. Tree Physiol. 37, 1648–1658. [DOI] [PubMed] [Google Scholar]
- Kleinschmit, J. and Bastien, J.C. (1992) IUFRO's role in Douglas‐fir (Pseudotsuga menziesii (Mirb.) Franco) tree improvement. Silvae Genetica, 41, 161–173. [Google Scholar]
- Kleinschmit, J. , Svolba, J. , Weisgerber, H. , Rau, H. , Dimpflmeier, H. , Ruetz, W. and Franke, A. (1991) Results of the IUFRO‐Douglas fir provenance experiment in West‐Germany at age 20. Forst und Holz, 46, 238–242. [Google Scholar]
- Konar, A. , Choudhury, O. , Bullis, R. , Fiedler, L. , Kruser, J.M. , Stephens, M.T. , Gailing, O. et al. (2017) High‐quality genetic mapping with ddRADseq in the non‐model tree Quercus rubra . BMC Genomics, 18, 12. [DOI] [PMC free article] [PubMed] [Google Scholar]
- de Kort, H. , Toivainen, T. , Van Nieuwerburgh, F. , Andres, J. , Hytonen, T.P. and Honnay, O. (2022) Signatures of polygenic adaptation align with genome‐wide methylation patterns in wild strawberry plants. New Phytol. 235, 1501–1514. [DOI] [PubMed] [Google Scholar]
- de La Torre, A.R. , Wilhite, B. , Puiu, D. , Clair, J.B.S. , Crepeau, M.W. , Salzberg, S.L. , Langley, C.H. et al. (2021) Dissecting the polygenic basis of cold adaptation using genome‐wide association of traits and environmental data in Douglas‐fir. Genes, 12, 110. [DOI] [PMC free article] [PubMed] [Google Scholar]
- Lavender, D.P. and Hermann, R.K. (2014) Douglas‐Fir: The Genus Pseudotsuga. Corvallis: Forest Research Publications Office, Oregon State University. [Google Scholar]
- Lawrence, M. , Huber, W. , Pages, H. , Aboyoun, P. , Carlson, M. , Gentleman, R. , Morgan, M.T. et al. (2013) Software for computing and annotating genomic ranges. PLoS Comput. Biol. 9, e1003118. [DOI] [PMC free article] [PubMed] [Google Scholar]
- Leitch, A.R. and Leitch, I.J. (2012) Ecological and genetic factors linked to contrasting genome dynamics in seed plants. New Phytol. 194, 629–646. [DOI] [PubMed] [Google Scholar]
- Liang, W. , Li, J. , Sun, L. , Liu, Y. , Lan, Z. and Qian, W. (2022) Deciphering the synergistic and redundant roles of CG and non‐CG DNA methylation in plant development and transposable element silencing. New Phytol. 233, 722–737. [DOI] [PMC free article] [PubMed] [Google Scholar]
- Liegard, B. , Baillet, V. , Etcheverry, M. , Joseph, E. , Lariagon, C. , Lemoine, J. , Evrard, A. et al. (2019) Quantitative resistance to clubroot infection mediated by transgenerational epigenetic variation in Arabidopsis. New Phytol. 222, 468–479. [DOI] [PMC free article] [PubMed] [Google Scholar]
- Lind, B.M. , Menon, M. , Bolte, C.E. , Faske, T.M. and Eckert, A.J. (2018) The genomics of local adaptation in trees: are we out of the woods yet? Tree Genet. Genomes, 14, 29. [Google Scholar]
- Lippman, Z. , Gendrel, A.V. , Black, M. , Vaughn, M.W. , Dedhia, N. , McCombie, W.R. , Lavine, K. et al. (2004) Role of transposable elements in heterochromatin and epigenetic control. Nature, 430, 471–476. [DOI] [PubMed] [Google Scholar]
- Love, M.I. , Huber, W. and Anders, S. (2014) Moderated estimation of fold change and dispersion for RNA‐seq data with DESeq2. Genome Biol. 15, 550. [DOI] [PMC free article] [PubMed] [Google Scholar]
- Malmqvist, C. , Wallin, E. , Lindstrom, A. and Sall, H. (2017) Differences in bud burst timing and bud freezing tolerance among interior and coastal seed sources of Douglas fir. Trees‐Struct. Funct. 31, 1987–1998. [Google Scholar]
- Martin, M. (2011) Cutadapt removes adapter sequences from high‐throughput sequencing reads. EMBnet. J. 17, 10–12. [Google Scholar]
- Mattei, A.L. , Bailly, N. and Meissner, A. (2022) DNA methylation: a historical perspective. Trends Genet. 38, 676–707. [DOI] [PubMed] [Google Scholar]
- McCullagh, P. and Nelder, J.A. (1989) Generalized Linear Models. London: Chapman and Hall. [Google Scholar]
- Meinzer, F.C. , Bond, B.J. , Warren, J.M. and Woodruff, D.R. (2005) Does water transport scale universally with tree size? Functional Ecol. 19, 558–565. [Google Scholar]
- Merkel, A. , Fernandez‐Callejo, M. , Casals, E. , Marco‐Sola, S. , Schuyler, R. , Gut, I.G. and Heath, S.C. (2019) gemBS: high throughput processing for DNA methylation data from bisulfite sequencing. Bioinformatics, 35, 737–742. [DOI] [PubMed] [Google Scholar]
- Miryeganeh, M. , Marletaz, F. , Gavriouchkina, D. and Saze, H. (2022) De novo genome assembly and in natura epigenomics reveal salinity‐induced DNA methylation in the mangrove tree Bruguiera gymnorhiza . New Phytol. 233, 2094–2110. [DOI] [PMC free article] [PubMed] [Google Scholar]
- Miura, A. , Yonebayashi, S. , Watanabe, K. , Toyama, T. , Shimada, H. and Kakutani, T. (2001) Mobilization of transposons by a mutation abolishing full DNA methylation in Arabidopsis. Nature, 411, 212–214. [DOI] [PubMed] [Google Scholar]
- Miura, K. , Agetsuma, M. , Kitano, H. , Yoshimura, A. , Matsuoka, M. , Jacobsen, S.E. and Ashikari, M. (2009) A metastable DWARF1 epigenetic mutant affecting plant stature in rice. PNAS, 106, 11218–11223. [DOI] [PMC free article] [PubMed] [Google Scholar]
- Mora‐Marquez, F. , Garcia‐Olivares, V. , Emerson, B.C. and de Heredia, U.L. (2017) DDRADSEQTOOLS: a software package for in silico simulation and testing of double‐digest RADseq experiments. Mol. Ecol. Resour. 17, 230–246. [DOI] [PubMed] [Google Scholar]
- Neale, D.B. , McGuire, P.E. , Wheeler, N.C. , Stevens, K.A. , Crepeau, M.W. , Cardeno, C. , Zimin, A.V. et al. (2017) The douglas‐fir genome sequence reveals specialization of the photosynthetic apparatus in Pinaceae. G3, 7, 3157–3167. [DOI] [PMC free article] [PubMed] [Google Scholar]
- Neophytou, C. , Weisser, A.M. , Landwehr, D. , Seho, M. , Kohnle, U. , Ensminger, I. and Wildhagen, H. (2016) Assessing the relationship between height growth and molecular genetic variation in Douglas‐fir (Pseudotsuga menziesii) provenances. Eur. J. For. Res. 135, 465–481. [Google Scholar]
- Niu, S. , Li, J. , Bo, W. , Yang, W. , Zuccolo, A. , Giacomello, S. , Chen, X. et al. (2022) The Chinese pine genome and methylome unveil key features of conifer evolution. Cell, 185, 204–217 e214. [DOI] [PubMed] [Google Scholar]
- Osabe, K. , Harukawa, Y. , Miura, S. and Saze, H. (2017) Epigenetic regulation of intronic transgenes in Arabidopsis. Sci. Rep. 7, 45166. [DOI] [PMC free article] [PubMed] [Google Scholar]
- Papareddy, R.K. , Paldi, K. , Smolka, A.D. , Huther, P. , Becker, C. and Nodine, M.D. (2021) Repression of CHROMOMETHYLASE 3 prevents epigenetic collateral damage in Arabidopsis. Elife, 10, e69396. [DOI] [PMC free article] [PubMed] [Google Scholar]
- Pecinka, A. , Abdelsamad, A. and Vu, G.T. (2013) Hidden genetic nature of epigenetic natural variation in plants. Trends Plant Sci. 18, 625–632. [DOI] [PubMed] [Google Scholar]
- Peterson, B.K. , Weber, J.N. , Kay, E.H. , Fisher, H.S. and Hoekstra, H.E. (2012) Double digest RADseq: an inexpensive method for de novo SNP discovery and genotyping in model and non‐model species. PloS One, 7, e37135. [DOI] [PMC free article] [PubMed] [Google Scholar]
- Pignatta, D. , Novitzky, K. , Satyaki, P.R.V. and Gehring, M. (2018) A variably imprinted epiallele impacts seed development. PLoS Genet. 14, e1007469. [DOI] [PMC free article] [PubMed] [Google Scholar]
- Piovesan, G. and Biondi, F. (2021) On tree longevity. New Phytol. 231, 1318–1337. [DOI] [PubMed] [Google Scholar]
- Platt, A. , Gugger, P.F. , Pellegrini, M. and Sork, V.L. (2015) Genome‐wide signature of local adaptation linked to variable CpG methylation in oak populations. Mol. Ecol. 24, 3823–3830. [DOI] [PubMed] [Google Scholar]
- Raine, A. , Manlig, E. , Wahlberg, P. , Syvanen, A.C. and Nordlund, J. (2017) SPlinted Ligation Adapter Tagging (SPLAT), a novel library preparation method for whole genome bisulphite sequencing. Nucleic Acids Res. 45, e36. [DOI] [PMC free article] [PubMed] [Google Scholar]
- Richards, C.L. , Alonso, C. , Becker, C. , Bossdorf, O. , Bucher, E. , Colome‐Tatche, M. , Durka, W. et al. (2017) Ecological plant epigenetics: Evidence from model and non‐model species, and the way forward. Ecol. Lett. 20, 1576–1590. [DOI] [PubMed] [Google Scholar]
- Rigal, M. , Kevei, Z. , Pelissier, T. and Mathieu, O. (2012) DNA methylation in an intron of the IBM1 histone demethylase gene stabilizes chromatin modification patterns. EMBO J. 31, 2981–2993. [DOI] [PMC free article] [PubMed] [Google Scholar]
- Ronemus, M.J. , Galbiati, M. , Ticknor, C. , Chen, J. and Dellaporta, S.L. (1996) Demethylation‐induced developmental pleiotropy in Arabidopsis. Science, 273, 654–657. [DOI] [PubMed] [Google Scholar]
- Schmid, M.W. , Heichinger, C. , Coman Schmid, D. , Guthorl, D. , Gagliardini, V. , Bruggmann, R. , Aluri, S. et al. (2018) Contribution of epigenetic variation to adaptation in Arabidopsis. Nat. Commun. 9, 4446. [DOI] [PMC free article] [PubMed] [Google Scholar]
- Schmitz, R.J. , Schultz, M.D. , Urich, M.A. , Nery, J.R. , Pelizzola, M. , Libiger, O. , Alix, A. et al. (2013) Patterns of population epigenomic diversity. Nature, 495, 193–198. [DOI] [PMC free article] [PubMed] [Google Scholar]
- Shumate, A. , Wong, B. , Pertea, G. and Pertea, M. (2022) Improved transcriptome assembly using a hybrid of long and short reads with StringTie. PLoS Comput. Biol. 18, e1009730. [DOI] [PMC free article] [PubMed] [Google Scholar]
- Stephens, M. (2017) False discovery rates: a new deal. Biostatistics, 18, 275–294. [DOI] [PMC free article] [PubMed] [Google Scholar]
- Thistlethwaite, F.R. , Ratcliffe, B. , Klapste, J. , Porth, I. , Chen, C. , Stoehr, M.U. and El‐Kassaby, Y.A. (2017) Genomic prediction accuracies in space and time for height and wood density of Douglas‐fir using exome capture as the genotyping platform. BMC Genomics, 18, 930. [DOI] [PMC free article] [PubMed] [Google Scholar]
- Thumma, B.R. , Matheson, B.A. , Zhang, D. , Meeske, C. , Meder, R. , Downes, G.M. and Southerton, S.G. (2009) Identification of a Cis‐acting regulatory polymorphism in a Eucalypt COBRA‐like gene affecting cellulose content. Genetics, 183, 1153–1164. [DOI] [PMC free article] [PubMed] [Google Scholar]
- Velasco, V.M.E. , Ferreira, A. , Zaman, S. , Noordermeer, D. , Ensminger, I. and Wegrzyn, J.L. (2022) A long‐read and short‐read transcriptomics approach provides the first high‐quality reference transcriptome and genome annotation for Pseudotsuga menziesii (Douglas‐fir). G3, 13, jkac304. [DOI] [PMC free article] [PubMed] [Google Scholar]
- Wan, T. , Gong, Y. , Liu, Z. , Zhou, Y. , Dai, C. and Wang, Q. (2022) Evolution of complex genome architecture in gymnosperms. Gigascience, 11, giac078. [DOI] [PMC free article] [PubMed] [Google Scholar]
- Wang, H.Q. , Tuominen, L.K. and Tsai, C.J. (2011) SLIM: a sliding linear model for estimating the proportion of true null hypotheses in datasets with dependence structures. Bioinformatics, 27, 225–231. [DOI] [PubMed] [Google Scholar]
- Weller, A. (2012) Douglasien‐Provenienzversuch von 1961 in Nordwestdeutschland: Ergebnisse nach 38 Jahren. Schweizerische Zeitschrift fur Forstwesen, 163, 105–114. [Google Scholar]
- Wu, H.W. , Deng, S. , Xu, H. , Mao, H.Z. , Liu, J. , Niu, Q.W. , Wang, H. et al. (2018) A noncoding RNA transcribed from the AGAMOUS (AG) second intron binds to CURLY LEAF and represses AG expression in leaves. New Phytol. 219, 1480–1491. [DOI] [PubMed] [Google Scholar]
- Xie, Z.L. , Nolan, T.M. , Jiang, H. and Yin, Y.H. (2019) AP2/ERF transcription factor regulatory networks in hormone and abiotic stress responses in Arabidopsis. Front. Plant Sci. 10, 228. [DOI] [PMC free article] [PubMed] [Google Scholar]
- Zemach, A. , Kim, M.Y. , Hsieh, P.H. , Coleman‐Derr, D. , Eshed‐Williams, L. , Thao, K. , Harmer, S.L. et al. (2013) The Arabidopsis nucleosome remodeler DDM1 allows DNA methyltransferases to access H1‐containing heterochromatin. Cell, 153, 193–205. [DOI] [PMC free article] [PubMed] [Google Scholar]
Associated Data
This section collects any data citations, data availability statements, or supplementary materials included in this article.
Supplementary Materials
Figure S1 Stem diameter at breast height (DBH) values (cm) of selected representative trees, among other Douglas‐fir trees from the four studied provenances in the provenance trial in Iloo, Neumünster, Germany.
Figure S2 Significant correlation between tree height (m) and stem diameter at breast height (DBH) values (cm).
Figure S3 Global methylation levels of cytosines in mCG (7157 sites), mCHG (13 412 sites) and mCHH contexts (76 554 sites) from needles of 16 Douglas‐fir trees.
Figure S4 Histogram distribution of methylation status of cytosines in different sequence contexts.
Figure S5 Relationship between global DNA methylation levels and DBH values (with that from large and small trees in green and cyan, respectively, A–C) or total RRBS reads (D–F).
Figure S6 A Principal Component Analysis (PCA) plot on all variant mC sites.
Figure S7 Expression level of two duplicated genes, GLIP6 and OSI (A–D) and four mega‐intron genes (E–H).
Figure S8 Graphical representation (sashimi plot by rmats2sashimiplot) of mRNA transcripts of the four mega‐sized genes containing intronic DML.
Figure S9 Functional characterization of genes associated with DML reveals growth‐optimized pathways.
Figure S10 MA plot of Differentially Expressed Genes between two groups of contrasting growth Douglas‐fir trees without (A, B) or with Provenance as covariate (C, D).
Table S1 Details on phenotypic traits and predictive covariates in a logistic regression model for growth‐associated comparative analysis.
Table S2 Overview of NGS input.
Table S3 DNA Methylation and Variant Calling output from the gemBS pipeline.
Table S4 Summary of Growth‐associated Differentially Methylated Regions (DMRs) per RAD locus.
Table S5 Annotation of Growth‐associated Differentially Methylated Loci (DML) with Gene features based on their genomic locations.
Table S6 Gene annotation of the DML‐associated genes.
Table S7 List of differentially expressed genes among trees with contrasting growth performance and Provenance as the second factor.
Table S8 GO terms in Biological Process (BP) present in Differentially Expressed Genes (DEG) and DML‐associated genes (DML genes).
Table S9 Summary of targeted RAD loci as reference sequences.