

Abstract
Protein nuclear magnetic resonance (NMR) spectroscopy relies on the ability to isotopically label polypeptides, which is achieved through heterologous expression in various host organisms. Most commonly, Escherichia coli is employed by leveraging isotopically substituted ammonium and glucose to uniformly label proteins with 15N and 13C, respectively. Moreover, E. coli can grow and express proteins in uniformly deuterium‐substituted water (D2O), a strategy useful for experiments targeting high molecular weight proteins. Unfortunately, many proteins, particularly those requiring specific posttranslational modifications like disulfide bonding or glycosylation for proper folding and/or function, cannot be readily expressed in their functional forms using E. coli‐based expression systems. One such class of proteins includes T‐cell receptors and their related preT‐cell receptors. In this study, we present an expression system for isotopic labeling of proteins using a nonadherent human embryonic kidney cell line, Expi293F, and a specially designed media. We demonstrate the application of this platform to the β subunit common to both receptors. In addition, we show that this expression system and media can be used to specifically label amino acids Phe, Ile, Val, and Leu in this system, utilizing an amino acid‐specific labeling protocol that allows targeted incorporation at high efficiency without significant isotopic scrambling. We demonstrate that this system can also be used to express proteins with fluorinated amino acids. We were routinely able to obtain an NMR sample with a concentration of 200 μM from 30 mL of culture media, utilizing less than 20 mg of the labeled amino acids.
Keywords: 19F‐labeling, Expi293F, glycosylation, local deuteration, mammalian expression, methyl TROSY, nuclear magnetic resonance spectroscopy (NMR), preT‐cell receptor (preTCR), T‐cell receptor (TCR)
1. INTRODUCTION
Solution nuclear magnetic resonance (NMR) spectroscopy provides the distinct advantage of studying protein structure and dynamics under near‐physiological conditions. By adjusting the NMR lens, protein dynamics can be observed across a wide range of timescales, from nanoseconds to hours. These studies yield critical data about conformational changes, allostery, cryptic sites, and minor states, offering vital insights that inform function and present new therapeutic opportunities. Much of protein NMR has harnessed the ability to recombinantly express proteins in Escherichia coli, with meticulous control over isotopic labeling, including deuteration and site‐specific methyl‐labeling in a deuterated background (Gardner & Kay, 1998; Gross et al., 2003). However, not all proteins can be faithfully and functionally expressed in E. coli. This poses a significant challenge, particularly when expressing membrane proteins like GPCRs, proteins requiring glycosylation or other posttranslational modifications for functionality, and proteins that necessitate intricate disulfide bridges. Among this class of proteins are cell surface receptors such as the αβT‐cell receptor (Liu et al., 1996).
αβT cells recognize immunological targets via the T‐cell receptor (TCR), a cell surface multisubunit complex composed of eight transmembrane protein chains arrayed as four dimers: the variable, ligand binding TCRαβ, and the invariant CD3 chains εγ, εδ, and ζζ (Rudolph et al., 2006; Wang & Reinherz, 2012). Each T cell encodes a single clonotypic TCR that is highly specific for its antigenic ligand, a peptide bound to a major histocompatibility molecule (pMHC). This specificity is encoded via a precise selection process within the thymus of developing αβ‐expressing thymocytes. T cell diversity is generated by somatic rearrangement of the β subunit gene first as part of the preT‐cell receptor (preTCR), pairing an invariant pTα with β in the CD4−CD8− double negative stages before rearrangement of the α subunit gene when developmental progression to CD4+/CD8+ double positive thymocytes occurs (Duke‐Cohan et al., 2022; Kreslavsky et al., 2012; von Boehmer, 2014). The TCR is recognized as an essential component in anti‐disease responses to a host of viral pathogens as well as cancer. As such, it is essential to understand the functioning of this critical receptor and its developmental precursor, the preTCR, as precisely as possible. It has become clear that the TCR and preTCR function as mechanoreceptors in relaying information intracellularly upon binding ligands (Das et al., 2015; Kim et al., 2009; Mallis et al., 2015). To understand the mechanism of this triggering event, it will be advantageous to understand the dynamic landscape of the (pre)TCR and any changes when bound to pMHC, an approach wherein NMR dynamic characterization will be valuable.
To study the dynamic behavior of TCR and preTCR we are utilizing the N30αβTCR and its preTCR antecedent. The murine N30αβTCR recognizes an octapeptide from the vesicular stomatitus virus nucleoprotein residues 52–59 (VSV8) bound to H‐2Kb class I MHC molecule (Imarai et al., 1995). The N30preTCR, which utilizes an invariant pTα subunit paired with the rearranged N30β, recognizes VSV8/Kb as assayed by single‐molecule (SM) biomembrane force probe (Mallis et al., 2015), SM optical tweezer (OT) assay (Das et al., 2016), and NMR (Mallis et al., 2015). It was found that the N30preTCR interacted robustly with the ovalbumin octapeptide SIINFEKL and its Q4H7 derivative SIIQFEHL bound to H‐2Kb (Das et al., 2016; Mallis et al., 2019), suggesting that certain ligands of preTCRs could engender greater affinities than observed for the cognate ligands of the αβTCRs. To date, a single preTCR‐pMHC interaction, that of N15preTCR‐VSV8/Kb, has been extensively characterized first by NMR‐directed modeling (Mallis et al., 2018) and subsequently by cross‐linking assisted x‐ray crystallography (Li et al., 2021; Mizsei et al., 2021). A road map has been established for the characterization of a larger set of preTCR‐pMHC, which suggests that NMR screening of interactions followed by crosslinking and modeling or crystallography (Mizsei et al., 2021) can establish binding modes of a variety of interactions. However, since each β subunit may be derived from one of many TRBV genes, the protein biochemistry, including the folding of the subunit, is sometimes problematic, leading to low refold yields. This has been true as well for TCRαβ production, necessitating swapping constant domains and engineering unnatural disulfide bonds for structural work (Adams et al., 2011; Boulter et al., 2003). We thus reasoned that applying the well‐established Expi293F expression system, previously utilized for the expression of preTCR and TCRαβ‐leucine zipper (LZ) paired ectodomains for OT experiments (Das et al., 2015, 2016), would provide increased flexibility and throughput when applied to TCRβ ectodomain constructs.
Significant effort has been expended to produce isotopically labeled proteins from eukaryotic cells, including mammalian cells (Eilers et al., 1999; Stehle et al., 2014), yeast (Clark et al., 2018), and insect cell lines (Dubey et al., 2021; Franke et al., 2018; Gossert & Jahnke, 2012). A robust mammalian protein production system would provide several advantages when coupled with stable isotope labeling. This is due to the more complex folding machinery of the mammalian endoplasmic reticulum, including chaperones, which encourage the native formation of disulfide bonds within these extracellularly targeted protein domains. It would also be advantageous to use proteins produced identically for both OT and NMR studies, eliminating any artifact related to construct and streamlining production pipelines. While mammalian cells, in general, are not tolerant to the high percentage of D2O in media, they do have an advantage in that certain amino acid synthetic pathways are absent (Eagle, 1959), facilitating the supplementing with specifically labeled amino acids for incorporation into highly expressed heterologous proteins. This is advantageous in implementing site‐specific labeling strategies for NMR of high molecular mass proteins (Henot et al., 2021; Höfurthner et al., 2023). Particularly, this is relevant to the strategy of local deuteration, previously shown to enhance linewidths comparably to those achieved using perdeuteration (Dubey et al., 2021).
Herein is presented an expression system for the production of N30β in EXPI293F cells with isotopic labeling conducive to NMR studies. We provide a workflow for the incorporation of stable isotopes of choice into a selected protein. Furthermore, we demonstrate amino acid‐specific labeling of Ile, Leu, Val, and Phe residues appropriate for diverse NMR detection experiments utilizing 13C and 19F, including a locally deuterated amino acid.
2. RESULTS
2.1. Expression and purification of N30βc1 using a mammalian expression system
To study the production of the preTCRβ chain, we cloned the N30βc1 coding cDNA (Mallis et al., 2018, 2015) into a variant of the pGamma vector previously used for the production of preTCR‐LZ and TCRαβ‐LZ (Das et al., 2015, 2016; Tiller et al., 2009). The vector was mutated in the ampicillin resistance gene to remove a BsaI restriction endonuclease site, the IGHG1 heavy chain encoding region was removed, and a novel cloning site was added to allow the insertion of a gene of interest in frame with the IgK signal sequence, necessary for the export of the target proteins to supernatant, and between two BsaI restriction sites, a vector termed pGDom (Figure 1a). This allows the facile insertion of any sequence using golden gate assembly cloning technology (Engler et al., 2008). The N30βc1 (Figure 1a, inset) was inserted in the frame with and downstream of the signal sequence and upstream of a six‐His tag, which would enable an immobilized metal affinity chromatography (IMAC) purification strategy.
FIGURE 1.

Production of N30β subunit in Expi293F cells. (a) Construction of expression vector for N30βc1. Detail of the multiple cloning site (MCS) modified for use with Golden Gate Cloning (Engler et al., 2008). The C‐terminally 6xHis tagged N30βc1 construct is inserted in the frame with the vector‐supplied signal sequence and includes a stop codon to produce the construct depicted in the inset box. (b) Sodium dodecyl sulfate–polyacrylamide gel electrophoresis (SDS‐PAGE) separation of supernatant time series and immobilized metal affinity chromatography (IMAC) purification. Expression culture supernatant samples (10 μL) (left lanes; day after transfection are indicated) or IMAC chromatography samples (right lanes; FT, column flow through; W1, W2, column washes; E1, E2, column elutions) were clarified by centrifugation and separated via nonreducing SDS‐PAGE. (Left lanes) Molecular weight markers (MW) are indicated. Horizontal lines at the right edge indicate positions of putative N30β glycoforms. (c) Size exclusion chromatography (SEC) separation of concentrated IMAC‐purified protein. The peak of interest is indicated by an arrow. (d) Endo H digestion of SEC‐purified N30β. Each glycoform is indicated with a horizontal line and numbered by presumptive occupancy.
For expression, cells were grown to 2 × 10⁶ cells/mL, transiently transfected with N30βc1/pGDom, and incubated for 7 days before harvesting. Figure 1b shows the separation of 10 μL aliquots of clarified supernatants, indicating increasing amounts of soluble protein migrating as an approximately 35 kDa protein, consistent with the expression of glycosylated TCRβ subunit. The multiple bands are consistent with the occupancy of four potential glycosylation sites. The cell line used is deficient in N‐acetylglucosamine transferase (GnTi−) so that the individual bands are well resolved, with the attached moieties being uniformly high‐mannose glycans (Reeves et al., 2002). Subsequently, on Day 7, the full 30 mL supernatant was clarified by centrifugation and filtration and passed over a Co2+ decorated IMAC column. The bands of interest are retained on the column and not eluted until washed with imidazole containing buffer, consistent with a His tagged construct. The IMAC‐purified protein was then separated via size exclusion chromatography (SEC) and eluted as a single symmetric species consistent with a monomeric β chain (Figure 1c). After this purified material was incubated with the enzyme Endoglycosidase H (EndoH), the protein migrated as a single band following sodium dodecyl sulfate–polyacrylamide gel electrophoresis (SDS‐PAGE) separation (Figure 1d). This is consistent with the expressed protein exhibiting up to four modifications, with the most common form, three modifications, representing half of the total protein and one quarter for each of two and four moieties. In total, 2.1 mg of protein was produced from 30 mL of culture or 70 μg/mL culture. This is sufficient for a 300 μM sample for NMR.
2.2. Production of amino acid‐specific dropout media: The ILVFY − system
To monitor the TCRβ directly by NMR, it is necessary to label the protein with stable isotopes. To this end, a formulation of Expi 293 medium was produced lacking Ile, Leu, Val, Phe, Tyr (ILVFY−) so that any of the branched‐chain amino acids or phenyl‐containing amino acids could be added in a labeled form. These amino acids were chosen as they are all among the essential amino acids and so uptake would potentially be robust. Furthermore, they are all singularly useful NMR probes (Gross et al., 2003; Kay, 2011). The branched‐chain amino acids contain methyl groups that can be exploited for high‐quality spectra even in large proteins (Gross et al., 2003; Kay, 2011). Similarly, the aromatic rings can be functionalized with 19F to obtain high‐resolution NMR signals (Kitevski‐LeBlanc et al., 2009; Pham et al., 2023). Figure 2a shows that when the newly developed ILVFY− medium was supplemented with unlabeled ILVFY amino acids, Expi293F cells grew in a manner indistinguishable from the standard, commercially available medium, while growth was completely abrogated if the amino acids were not added back to the ILVFY− medium.
FIGURE 2.

Isotopic labeling with 13C6‐Ile. A. Viable cell density when cultured in ILVFY− medium (blue) as compared to ILVFY− supplemented with ILVFY amino acids (red) or commercial preparation of Expi medium (violet). Cells were seeded at 0.4 million cells/mL in 30 mL of medium in a 125 mL shaking culture flask. (b) Size exclusion chromatography (SEC) separation of concentrated immobilized metal affinity chromatography‐purified protein. (inset) Sodium dodecyl sulfate–polyacrylamide gel electrophoresis separation of SEC‐purified protein (N30β). Molecular weight markers (MW) are indicated. Each glycoform is indicated with a horizontal line and numbered by presumptive occupancy, as determined in Figure 1d. (c) 1H–13C 2D‐TROSY‐HMQC spectrum of 400 μM protein sample. Spectrum acquired at 600 MHz with a sweepwidth of 16 × 44 ppm with 1024 × 256 increments and 256 scans. The region of the spectrum delineated by the dotted line indicates the region containing Ile methyl sidechain resonances. (d) Detail of spectral region delineated by dotted box in c. Resolved peaks are numbered for reference. The average chemical shifts for δ‐ and γ‐methyl resonances are indicated by D and G, respectively. (inset) Overlay of 13C6‐Ile‐labeled protein spectral region (black) with that of 13C‐Ile‐δ‐methyl‐labeled protein (270 μM) produced in Escherichia coli (red, Acquired at 700 MHz with a sweepwidth of 16 × 22 ppm with 1024 × 128 increments and 32 scans). (e) Quantitation of U‐13C6‐Ile incorporation. Bar graph depicting median Incorporation of U‐13C6‐Ile into N30β determined by LC‐MS analysis. Points indicate incorporation at specific isoleucine sites also showcased in the accompanying table. (f) Representative extracted MS1 precursor ion chromatogram (left panel) and annotated MS/MS spectra for N30β peptides with representative heavy (DEAViDNSQLPSDR, middle panel) and light (DEAVIDNSQLPSDR, right panel) peptides.
2.3. Isotopic labeling using U‐13C‐Ile
Labeling of methyl groups of branched‐chain amino acids provides a useful probe on the structure and dynamics of larger proteins in NMR due to the slower relaxation attributed to the independent rotation of the methyl groups compared to the overall tumbling of the protein and the presence of three magnetically equivalent hydrogens, increasing the signal intensity relative to other sidechain or backbone hydrogens. Furthermore, we can leverage the methyl‐TROSY effect to obtain highly resolved resonances (Kay, 2011). Here, a uniformly 13C‐labeled amino acid Ile (U‐13C6‐Ile) was used to supplement ILVFY− media along with unlabeled LVFY before transfection with N30β vector. Following IMAC purification and SEC separation (Figure 2b), 3.4 mg pure protein was obtained, resulting in a 400 μM NMR sample. This is equivalent to 110 μg/mL culture. Thus, there was no negative effect on the growth or folding of using the label or the supplemented ILVFY− medium. Moreover, the glycosylation pattern and SEC retention time were similar to that seen in Figure 1. A 1H13C SOFAST‐HMQC spectrum revealed the methyl resonances consistent with labeling all five Ile residues within N30β, 9 of 10 expected peaks in the γ2 and δ‐methyl spectral regions were present (Figure 2c,d). Weaker peaks were present downfield, consistent with the remaining methylene protons attached to the β and γ carbons. There was no evidence of off‐target labeling in the 1H–13C spectrum. Mass spectral analysis of this sample following tryptic digestion indicated 94.8% median labeling efficiency in Ile residues with all five residues detected (Figure 2e,f). Tryptic peptides co‐eluted and were identified by offset isotopic mass and nearly identical fragmentation spectra (Figure 2f). The spectral resonances corresponding to the δ‐methyl groups of Ile of the eukaryotically produced sample, Peaks 1–5, overlay precisely with those of N30βc1 produced using standard 13C α‐ketobutyric acid precursors (Gross et al., 2003), which results in 1H and 13C labels on only the δ‐methyl (inset Figure 2d).
2.4. Isotopic labeling using 4‐19F‐Phe
The chemical shift of fluorine is highly sensitive to its surrounding chemical environment, making it an exceptional probe for elucidating structure, dynamics, and for mapping interactions. The absence of 19F in biological systems renders fluorine an excellent probe for studying intermolecular interactions (Kitevski‐LeBlanc et al., 2010; Pham et al., 2023). Nonetheless, the pronounced chemical shift anisotropy has constrained the use of fluorine in examining large molecular weight systems. Recent advances that harness the TROSY effect in 13C19F‐harboring aromatic amino acids to create narrow 13C resonances have opened avenues for employing 19F NMR in the study of macromolecular systems (Boeszoermenyi et al., 2019).
Expi293F cells were initially uniformly supplemented with 4‐19F‐Phe in addition to unlabeled ILVY and transfected with N30βc1 coding vector, resulting in extensive cell death and no detectable protein production after 7 days. Subsequently, ILVFY− media was supplemented with a 1:1 mixture of 4‐19F‐Phe:unlabeled Phe and transfected as previously. The resulting supernatant contained significant protein, which was purified as above. Figure 3a shows the final SEC separation, again indicating a pure protein product. SDS‐PAGE (Figure 3b) also revealed a similar band pattern to that seen in Figure 1. A total of 1 mg of protein was obtained from 30 mL of culture, yielding a 120 μM NMR sample. A one‐dimensional spectrum of the 19F spectral region (Figure 3c) shows at least seven resolved peaks which, given likely resonance overlap, is consistent with the presence of 10 Phe residues in the protein. Mass spectral analysis of proteolytically digested fragments indicates a 12.1% median incorporation of 19F at phenylalanine sites throughout the protein (Figure 3d,e). In contrast to the 13C labeling, the 4‐19F‐Phe substitution of the 4‐1H resulted in an offset in chromatographic elution (Figure 3e). Fragments were positively identified by mass differential and nearly identical fragmentation patterns (Figure 3e). Though the level of incorporation is low, it is incorporated at similar levels at all sites we were able to measure (8 of 10 residues). Introducing fluorinated amino acids has been known to induce structural perturbations, frequently compromising protein stability, which is a primary factor for toxicity. Therefore, fractional occupancy of fluorinated amino acids is favored (Kitevski‐LeBlanc et al., 2010; Wheatley & Henderson, 1974).
FIGURE 3.

Labeling with 4‐19F‐Phe. (a) Size exclusion chromatography (SEC) separation of concentrated immobilized metal affinity chromatography‐purified protein. (b) Sodium dodecyl sulfate–polyacrylamide gel electrophoresis separation of SEC‐purified protein (N30β). Molecular weight markers (MW) are indicated. Each glycoform is indicated with a horizontal line and numbered by presumptive occupancy. (c) 1D 19F‐NMR spectrum of 120 μM protein sample. Spectrum acquired at 600 MHz with a sweepwidth of 201 ppm and 8192 scans. Resolved peaks are numbered. (d) Quantitation of 4‐F‐Phe incorporation. Bar graph depicting median Incorporation of 4‐F‐Phe into N30β determined by LC‐MS analysis. Points indicate incorporation at specific phenylalanine sites also showcased in the accompanying table. (e) Representative extracted MS1 precursor ion chromatogram (left panel) and annotated MS/MS spectra of 19F‐Phe‐containing (DQGPQLLVYfR, middle panel) and native 4‐1H‐Phe‐containing (DQGPQLLVYFR, right panel) peptides.
2.5. Titration of amino acid additions in small‐scale culture
To standardize the procedure of adding amino acids to ILVFY− media, the small‐scale culture of the Expi293F cells was initiated. The simplest procedure was to add back the deficient amino acids at levels equivalent to the standard formulation of Dulbecco's modified Eagle medium (DMEM) (Dulbecco & Freeman, 1959; Eagle, 1959) and referred to herein as 1X (see Methods for exact formulation). For this experiment, cells were plated at 2 × 10⁶ cells/mL at 3 mL/well in six‐well flat bottom plates, transfected with N30βc1, and cultured for 4 days in standard conditions. The deficient medium was reconstituted with 1, 2, and 4 times 1X levels as indicated, with three wells per condition. There were no significant differences in cell density, and in no case did cell numbers decrease over the time of culture (Figure 4a). Protein expression levels were assessed by the separation of supernatants by nonreducing SDS‐PAGE and band quantitation (Figure 4b,c). There was also no difference in expression at any reconstitution level and, so one should consider the 1X level the default value for labeled protein expression.
FIGURE 4.

Small‐scale expression for tuning media conditions. (a–c) Cells were incubated in commercial Expi 293 medium (Expi) or ILVFY− medium supplemented with ILVFY at 1× standard DMEM levels (1X), 2× DMEM levels (2X) or 4× DMEM levels (4X). Cells were transfected on Day 0 and counted and harvested on Day 4. n = 3 wells per medium formulation (a). Cell density averages ± SD are shown on Day 4 for each medium formulation. (b, c) Ten microliters clarified supernatant was separated by sodium dodecyl sulfate–polyacrylamide gel electrophoresis (SDS‐PAGE) (b) and the three bands corresponding to N30βc1 were quantitated using ImageJ (c) with averages ± SD shown. (d–f) Cells were incubated in commercial Expi 293 medium (Expi) or ILVFY− medium supplemented with unlabeled ILVFY at 1X levels with treatment groups substituting 13CH3‐Val (Val), S‐methLD‐Leu (Leu) or U‐13C‐Ile (Ile). S‐methLD‐Leu levels were twice DMEM levels to account for the presence of D‐Leu in the formulation. Cells were transfected on Day 0 and counted and harvested on Day 4. n = 3 wells per medium formulation (d). Cell density averages ± SD are shown on Day 4 for each medium formulation. (e, f) Ten microliters clarified supernatant was separated by SDS‐PAGE (e) and the three bands corresponding to N30βc1 were quantitated using ImageJ (f) with averages ± SD shown. For all plots, the significance of difference from Expi controls is indicated by paired, one‐tailed t‐test: no symbol, p > 0.1; *p < 0.1; **p < 0.05; ***p < 0.01.
2.6. Addition of isotopically labeled ILV in small‐scale culture
When initiating an expression using amino acids that might be expensive or challenging to synthesize, it is crucial to test for any potential defects in expression or toxicity linked to the compound (Figure 3). Thus, in addition to testing the 13C6‐Ile utilized above, we chose a locally deuterated Leu and a Val compound 13C‐labeled only on its methyl substituents to provide a survey of either commercially available or custom‐synthesized compounds. We have previously synthesized a “locally” deuterated, methyl 13C‐labeled leucine, D/L‐4,4‐d2‐pro‐R‐methyl‐d3‐pro‐S‐methyl‐13C‐leucine, termed S‐methLD‐Leu (Dubey et al., 2021) that harbors a stereo selectively labeled 13CH3 group with deuterium installed at neighboring positions to the methyl group to minimize relaxation due to dipole interactions. Leu‐methLD is able to mitigate a large part of the relaxation losses in cases where deuteration is not possible, as would be the case in mammalian cells. S‐MethLD‐Leu was purified as previously indicated (Dubey et al., 2021) and modified as detailed in Methods. Similarly to Figure 4a–c, six‐well plates were seeded with cells in ILVFY− medium reconstituted with 1X concentrations of unlabeled amino acids and substituted with the indicated labeled amino acid, 13C6‐Ile, 13CH3‐Leu, and 13CH3‐Val. The media substituted with Leu or Ile fostered a lower cell density when compared to the control, but in no case was there a decrease in cell density during the expression (Figure 4d). Protein expression levels were also reduced relative to the controls (Figure 4e,f). The most significant drop was observed in the Leu‐substituted media, where expression was about 60% of that in Expi 293 medium‐supplemented cells.
2.7. NMR scale production of locally deuterated 13CH3‐Leu N30βc1 and locally 13CH3‐Val N30βc1
Expi293F cells were then transfected with N30βc1 using condition 2 of S‐methLD‐Leu (see Methods) in a 60 mL culture. Enough protein for a 220 μM sample (1.9 mg total protein yield) was obtained for a 1H–13C HMQC spectrum (Figure 5b,c) with spectral peaks characteristic of Leu Cδ/Hδ crosspeaks. No significant peaks were present within any other protein methyl regions (Figure 5b), indicating no metabolic scrambling of the added label. The Leu Cδ/Hδ region of the spectrum (Figure 5c) shows 15 distinct crosspeaks, which is consistent with the 15 Leu residues present in N30βc1. We additionally tested the commercially available methyl‐labeled (13CH3) Val (Figure 5d) in Expi293F ILVFY− expression cultures. A 250 μM sample comprising 2.4 mg protein was produced from a 45 mL culture. Again, the 1H–13C HMQC spectrum revealed only peaks characteristic of Val Cγ/Hγ crosspeaks (Figure 5e,f) with 37 distinct peaks, consistent with 19 Val residues in N30βc1.
FIGURE 5.

Expression with locally labeled amino acids. (a) Schematic indicating labeling scheme of custom‐synthesized S‐methLD‐Leu. B. 1H‐13C 2D‐TROSY‐HMQC spectrum of 220 μM protein sample acquired at 700 MHz with a sweepwidth of 16 × 22 ppm with 512 × 128 increments and 64 scans. The region of spectrum delineated by a dotted line indicates the region containing Leu methyl sidechain resonances. (c) Detail of spectral region delineated by dotted box in (b). Resolved peaks are numbered for reference. (d) Schematic indicating labeling 13CH3‐Val. (e) 1H‐13C 2D‐TROSY‐HMQC spectrum of 250 μM protein sample acquired as in (b). The region of the spectrum delineated by a dotted line indicates the region containing Val methyl sidechain resonances. (f) Detail of spectral region delineated by dotted box in (b). Resolved peaks are numbered for reference.
3. DISCUSSION
We have developed a system that facilitates amino acid‐specific isotopic labeling of proteins using a mammalian cell culture system. The primary advantage of this system is its ability to implement customized labeling strategies, at least for the subset of branched‐chain amino acids showcased herein. A minimal amount of labeled amino acid is needed to generate a sample. For instance, with custom‐synthesized S‐methLD‐Leu, only 60 mL of labeled culture medium was utilized to prepare a 220 μM sample. This yielded a robust spectrum, adequate for assessing most protein–protein interactions. The total quantity of Leu used was approximately 0.2 mg/mL, 12 mg in total. When leveraging standard DMEM formulations to enrich the medium, the required amount for most amino acids would be in a comparable range, thereby facilitating targeted assessments without significant expenditure on costly isotopes. For the spectrum displayed in Figure 5e,f, the isotope costs were approximately $15. Simultaneous incorporation of two or more amino acids is feasible. Such a choice could be amalgamated to enhance surface coverage, aid in resonance assignment, or align with pulse sequences for measuring NOE contacts between selected spins (Gross et al., 2003). It would be essential, however, to ensure that any compound‐specific effects in the mixed media do not impede the expression of the target protein (Figure 4).
This system facilitates the production of proteins ideally suited for eukaryotic cell culture systems by leveraging a commercially engineered production system equipped with tools for routine application. HEK293 cells have been employed in the past for labeling proteins in situ (Banci et al., 2013; Luchinat et al., 2020) and for expressing and purifying labeled proteins (Ahuja et al., 2009; Stehle et al., 2014; Werner et al., 2008; Yeliseev et al., 2020) from stable cell lines. The yields of purified protein reported herein are at least 20‐fold greater than in prior reports and the transient expression system offers enhanced speed and convenience. The target proteins, secreted ectodomains, versus transmembrane receptors (Ahuja et al., 2009; Werner et al., 2008; Yeliseev et al., 2020) and different labeling schemes or media may be responsible for a portion of this differential. The preTCRβ could be representative of numerous cell surface receptors; it manifests as a multidomain ectodomain construct, preserving its innate internal disulfide bonds and featuring multiple glycosylation sites. For streamlined characterization, we employed a variant strain of Expi293F cells devoid of N‐acetylglucosaminyltransferase I (GnTI) activity (Reeves et al., 2002). This leads to more consistent glycosylation patterns, which can be readily removed using EndoH (Figure 1d). Such a system presents opportunities for comparative structural and dynamic analysis of cell surface proteins with varied glycan occupancies, including complex, simple, or none at all. Furthermore, this system would be valuable for examining glycosylated cell surface proteins and their protein–protein interactions (Aricescu & Owens, 2013; Johnson et al., 2013; Powell et al., 1987; Ryan & Cobb, 2012).
A significant challenge during this study was discerning the influence of compounds (individual isotopically labeled amino acids) on cellular growth in mammalian expression. Given the heightened sensitivity of mammalian cells to pH and osmolality fluctuations, meticulous attention is essential to ensure that additions do not substantially alter these parameters. For commercially sourced compounds, it is imperative to select those of utmost purity, preferably of cell culture grade quality. When synthesizing custom compounds, similar considerations apply, especially ensuring that co‐purified salts or reaction by‐products do not compromise cell culture integrity and growth conditions. Beyond integrating specialized equipment to oversee medium quality or further purify acquired compounds, monitoring cell growth and protein expression in a six‐well plate format has proven instrumental. This setup is adept at screening new compounds to ascertain if growth rates or expression levels diverge from those seen in the base media (Figure 4). This format also efficiently screens construct variations, like mutants or different TCRβ clones, given the simplicity in pinpointing a well‐expressed protein in the cell supernatant (Figures 1a and 4). This strategy can be complemented with parallel microscale spin columns, ensuring accurate quantification of the desired species when required.
Certain compounds intended for incorporation might intrinsically be toxic. The toxicity of some, like 4‐19F‐Phe, is well‐documented from prior research. Specifically, 4‐19F‐Phe is known to inhibit the growth of mammalian cells (Wheatley & Henderson, 1974). Consequently, there was a necessity to mix the labeled compound with its unlabeled counterpart in a 1:1 ratio. This led to a median incorporation of 12.1% of the desired nucleus (Figure 3), hinting at a cellular proclivity for the unlabeled variant, which aligns with the observed toxic effects of incorporation. Predicting which labeling schemes will manifest such inherent toxicity remains challenging. However, the pronounced toxicity of D2O in mammalian cultures (Siegel et al., 1960) indicates that the highly electronegative 19F replacement of 1H might not be the only problematic substitution. It has been shown that incorporation rates of 4‐19F‐Phe in E. coli expression is modest, though specific mutations in tRNA can increase the rate of incorporation, suggesting potential remedies for such obstacles (Kast, 2011). The recent study of 19F‐labeled proteins inside mammalian cells (Pham et al., 2023) also provides a window into the potential for more effective labeling in our system going forward, including a variety of compounds that may be better tolerated and demonstrates the value of 19F probes for the functional study of proteins. Even with the noticeable decrease in expression levels observed with S‐MethLD‐Leu (Figure 4), we were able to procure a 220 μM sample from a modest 60 mL culture volume. Furthermore, it is wise to monitor isotopic incorporation as it can offer insights into cellular tolerance toward a specific substitute nucleus for a particular amino acid (Figures 2 and 3).
Proteins related to T‐cell immunology, such as preTCR (Das et al., 2016), TCRαβ (Das et al., 2015), and class II MHC (Willis et al., 2021) that are preferentially expressed in mammalian cells, all have molecular weights exceeding 30 kDa. The methyl‐TROSY benefits from deuteration, which minimizes relaxation losses induced by dipole–dipole interactions. Since perdeuteration is a challenge in eukaryotic expression systems, deuterating the local hydrogens within the same amino acid will greatly benefit the methyl‐TROSY effect. Large proteins (>30 kDa) stand to benefit immensely from our expression system and, for example, from the use of SAIL amino acids (Kainosho et al., 2006; Kainosho & Güntert, 2009), novel methyl‐labeling (Henot et al., 2021) and methylene‐labeling (Höfurthner et al., 2023) or localized deuteration schemes (Dubey et al., 2021) as showcased in Figure 5. Previous studies have demonstrated the feasibility of leveraging the advantages of specific methyl‐labeling schemes, such as ILV, against a deuterated background in which E. coli were used to economically produce ILV methyl‐labeled proteins. Free amino acids were then isolated through hydrolysis and used as substrates in a cell‐free expression system (Linser et al., 2014). We posit that amino acids harvested in this way would be compatible with the mammalian expression system discussed here, while continuing innovations in cell‐free production for protein NMR (Imbert et al., 2021) could synergize well through the innovative design of cell culture feedstock. In this modality one will use an “all amino acid” knockout media and supplement the amino acids isolated from a purified hydrolysate of proteins expressed as inclusion bodies in E.coli (Linser et al., 2014). This will result in partly deuterated proteins where the Hα will be exchanged for 1H. While the uptake of amino acids other than ILVFY is anticipated to be modest in our current media, other target amino acids could be eliminated from future‐defined media formulations (Werner et al., 2008; Yeliseev et al., 2020). In addition, this approach permits the introduction of alternative labeling patterns for aromatic amino acids by utilizing pyruvate as a carbon source in E. coli. Such alternative labeling enhances the utility of aromatic TROSY, enabling the achievement of high‐resolution spectra unobstructed by the substantial C–C coupling (~60 Hz) typically associated with aromatic carbons (Milbradt et al., 2015). A notable benefit of this system is the reduction in the required amount of labeled amino acids, thereby making SAIL amino acids more economically feasible for broader applications. The advent of recent computational methods allows for the assignment of methyl resonances even without backbone assignments (Behera et al., 2020; Nerli et al., 2021). Obtaining unambiguous resonance assignment of isotopically labeled proteins is the necessary first step in the study of structure, dynamics, and interaction by NMR. The methyl assignments on large systems like the chaperonin (Mas et al., 2018) and Abl kinase (Xie et al., 2020) were completed primarily through site‐specific mutations. However there have been recent developments that use prior structural information and computational methods to obtain methyl assignments based on a simple NOESY experiment. These methods include methyl‐FLYA (Pritišanac et al., 2019), MAUS (Nerli et al., 2021), MAGIC (Monneau et al., 2017), MAGMA (Pritišanac et al., 2017), FLAMEnGO (Chao et al., 2012), and MAP‐XSII (Xu & Matthews, 2013). 13C–13C–1H and 13C–1H–1H 3D NOESYs can be recorded on the samples produced here and be used with the above‐mentioned computational methods to obtain the assignment methyl resonances. For small proteins (<20 kDa), backbone assignments and sidechain resonance assignments can be derived from traditional triple resonance and sidechain experiments if one were to adopt an “all amino acid” approach posited above. 15N‐detected methods, which leverage the fact that the TROSY effect on 15N does not depend on deuteration, offer promise for the backbone assignment of large proteins as well (Dubey et al., 2022).
This breakthrough presents a unique opportunity to delve deeper into the structure, dynamics, and interactions of proteins exclusively expressed in their functional form in mammalian cells. Given the rising significance of biologics as therapeutic agents, these labeling strategies can play a pivotal role in quality control procedures. With a swift turnaround, typically a week from vector to final product, and the added advantage of cost‐effectiveness, resonance assignments via mutagenesis of key residues become more practical. With wider adoption, more tools should become available, including custom‐labeled amino acids or media for uniform labeling of proteins leveraging emerging direct detection of 13C and 15N (Dubey et al., 2022; Felli & Pierattelli, 2022). In summary, this innovative method enhances the utility of mammalian expression as a worthy option in the existing armamentarium of E. coli (Gardner & Kay, 1998), yeast (Clark et al., 2018), and insect cells (Franke et al., 2018) for NMR protein production.
4. MATERIALS AND METHODS
4.1. N30β expression in Expi293F
Expression of N30β in Expi293F (Thermo Fisher Scientific) cells follows the manufacturer's directions with minor modifications. Cells are grown in vented Erlenmeyer flasks under an 8% CO2 atmosphere at 37°C with constant rotary shaking at 125 rpm. Cells are routinely passaged to 2–3 × 10⁵ cells/mL of standard Expi 293 medium every 3–4 days, keeping densities <6 × 10⁶ cells/mL. For expression, sufficient cells to achieve a final density of 2 × 10⁶ cells/mL are spun at 1200 rpm (270 × g) for 5 min, and the pellets resuspended in standard or ILVFY− Expi 293 medium, supplemented as detailed below. For each 30 mL of expression culture, 30 μg in 30 μL of pGDom vector coding for N30β is incubated with 1.5 mL OPTIMEM (Thermo Fisher Scientific) for 5 min and then 80 μL Expifectamine (Thermo Fisher Scientific) and 1.5 mL OPTIMEM for 20 min. The mixture is then added dropwise to a culture flask seeded at 2.0 × 10⁶ cells/mL in 30 mL medium as described. After 24 h, 150 μL Expifectamine 293 Enhancer 1 and 1.5 mL Enhancer 2 or ILVFY− Enhancer 2 are added to each 30 mL culture. Higher volumes of expression culture scale all reagents proportionally and culture volume to flask volume constant at 30 mL medium/125 mL flask or 3 mL medium/well in six‐well plates. Expression proceeds without change in expression medium until harvest at 7 days after transfection.
4.2. N30β purification following Expi293F expression
Supernatants are collected on day 7 after transfection by centrifugation of remaining cells at 1200 rpm (270 × g) at 4°C for 10 min in a clinical centrifuge. The supernatant is then centrifuged twice in succession at 3000 rpm (1700 × g) at 4°C for 30 min in a clinical centrifuge. Following this, the clarified supernatant is filtered using a cellulose acetate 0.2 μm cutoff filter and passed twice over 5 mL Talon IMAC resin (Cytiva Life Sciences) preloaded with Co2+. The depleted flow through (FT) should contain no N30β and is discarded. The protein bound to the column is then washed with two washes (W1, W2) of 5 column volumes each of tris‐buffered saline (TBS) pH 8.0. The protein is then eluted with two elutions (E1, E2) of 3 column volumes of elution buffer (TBS + 300 mM imidazole). The protein is then concentrated to <1 mL and separated by analytical SEC using a 20 mL column packed with Superdex S200 resin (Cytiva Life Sciences) utilizing an Akta Pure (Cytiva Life Sciences) fast protein liquid chromatography system. EndoH digestion was completed by adding an enzyme to N30β for 18 h at room temperature at a ratio of 50 U enzyme per 2 μg protein. Similar results were attained using 5 U of the enzyme.
4.3. N30βc1 expression and purification in E. coli
N30βc1 was expressed and purified as detailed previously (Mallis et al., 2015, 2016). M9 medium was as previously (Mallis et al., 2015, 2016), in this case supplementing with 15N Ammonium Chloride (Cambridge Isotope Laboratories). One hour before induction at OD600 = 0.6, 70 mg/L of α‐ketobutyric acid (13C4, 98%, 3,3‐2H2, 98%; CDLM‐4611; Cambridge Isotope Laboratories) was added to the expression flask. The produced protein was monomeric following refolding and the 1H15N TROSY‐HSQC spectrum conformed to prior characterization (Mallis et al., 2015).
4.4. Expi 293 ILVFY − media production
Custom amino acid‐depleted Expi 293 expression media lacking the aforementioned amino acids was manufactured subsequent to the development of the final formulations at Thermo Fisher Scientific according to proprietary procedures. Custom media can be manufactured by contacting Thermo Fisher Scientific.
4.5. Production of S‐methLD‐Leu
The labeled leucine was synthesized as previously described (Dubey et al., 2021; Figure 6) with modifications. The isobutanol 1 was prepared as described previously by stereoselective methylation of an acylated Evans chiral auxiliary, reductive cleavage, and distillation of the isobutanol‐water azeotrope (Dubey et al., 2021). Next, the isobutanol‐water azeotrope was tosylated (instead of brominated) with toluenesulfonyl chloride in aqueous NaOH and THF, yielding 70%–75% of 2 after flash purification. The Schiff base of glycine was heated with 3 in the presence of NaHMDS in toluene to yield 3 (75%–80%). The Schiff base of racemic D/L‐leucine t‐butyl ester 3 was heated under reflux with 6 M HCl‐THF, extracted with ether, and precipitated twice from isopropanol‐diethyl ether. The 1H‐NMR spectrum indicated greater than 98% chemical purity. This leucine was toxic to the cells and was purified further as follows:
Recrystallization of the zwitterionic leucine. 500 mg of the leucine HCl salt was dissolved in 20 mL water. The pH was adjusted to 7 with 10% NH3 and 80 mL of 95%EtOH were added. The fine tan crystals were filtered, washed with cold 95% ethanol, and allowed to dry, yielding 250 mg of zwitterionic S‐methLD‐Leu. A second crop yielded another 100 mg of leucine, but this was not used in the cell culture tests.
Cation exchange chromatography. Polystyrene‐7% DVB, 0.3–1.2 mm, 1.9 meq/mL SO3Na resin (equivalent to Dowex 50x8, aqua-filters.com, catalog #PC002) was converted to the hydrogen form by washing with three‐bed volumes of 1 M HCl and three‐bed volumes of water. Five milliliters of the resin were placed in the plastic cartridge with a diameter of 1 cm. One hundred thirty milligrams of S‐methLD‐Leu, hydrochloride salt, were dissolved in 10 mL 0.1 M HCl and loaded on the resin. The resin was washed with 20 mL water and the amino acid was eluted with 20 mL 10% NH3. The ammonia was removed by rotary evaporation and the remaining aqueous solution was lyophilized to 82 mg of zwitterionic S‐methLD‐Leu. Either of these first two methods was used interchangeably in cultures.
Aminopropyl HILIC flash chromatography. A 38 g aminopropyl flash cartridge (BGB Analytic catalog# BSNHAF‐W025) was activated with 70% acetonitrile (ACN), followed by 400 mL 1:1 ACN:170 mM ammonium acetate pH 6, then equilibrated with 87% ACN—13% 11 mM ammonium acetate pH 6 (Buffer A). One hundred forty milligrams of leucine hydrochloride dissolved in 11 mL 1:1 ACN: water was loaded, and the column was subjected to a gradient from Buffer A to 70% ACN in 10 min at a flow rate of 15 mL/min. The eluent was monitored by evaporative light scattering and TLC with ninhydrin staining. The leucine‐containing fraction was evaporated under reduced pressure and lyophilized twice from water, yielding 80 mg of the zwitterionic S‐methLD‐Leu. This third method resulted in excess toxicity for the cultured cells and is not recommended as a purification when working with mammalian cells.
FIGURE 6.
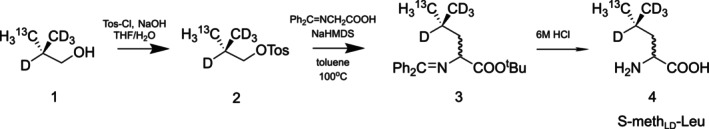
Synthesis of S‐methLD‐Leu. Pro‐S‐13C‐methyl‐labeled and “locally deuterated” D/L‐leucine (S‐methLD‐Leu) was synthesized as described previously via isobutanol 1 (Dubey et al., 2021), with modifications as indicated.
4.6. Stable isotope incorporation and Expi ILVFY − media utilization
ILVFY− medium was reconstituted with added ILVFY (Ile [I7403; Sigma‐Aldrich], Leu [L8912; Sigma‐Aldrich], Val [V0513; Sigma‐Aldrich], Phe [P5482; Sigma‐Aldrich], and Tyr [T1145; Sigma‐Aldrich]) to the standard concentrations in the Expi 293 medium. For stable isotope labeling, U‐13C6‐Ile (CLM2248; Cambridge Isotope Laboratories) was added in appropriate amounts along with the unlabeled LVFY as above. 4‐Fluoro‐l‐phenylalanine (144250; Beantown Chemical) was added in a 1:1 ratio with unlabeled Phe, along with the other standard amino acids. For Figures 4 and 5, levels of all amino acids were equivalent to Thermo Fisher Scientific DMEM (Dulbecco & Freeman, 1959; Eagle, 1959): 0.104 mg/mL Ile, 0.104 mg/mL Leu, 0.094 mg/mL Val, 0.066 mg/mL Phe, and 0.103 mg/mL Tyr as this appeared to enhance cell survival. These levels (1X) and multiples thereof (2X, 4X) were used as the basis for the small‐scale titration experiments (Figure 4). 13CH3‐Val was from Cambridge Isotope Laboratories (CLM‐9217).
4.7. NMR methods
All NMR experiments were performed on Bruker 600 or 700 MHz spectrometers equipped with cryogenically cooled probes. All NMR sample volumes were 300 μL using 5 mm D2O‐matched tubes (Shigemi, Inc) and were acquired at 25°C. HMQC experiments utilized the SOFAST‐HMQC protocol (Schanda et al., 2005). 1D 19F spectrum (Figure 3) was acquired at 600 MHz in a QCIF‐type probe using a standard 90° excitation pulse sequence with a sweepwidth of 201 ppm and 8192 scans. The 13C‐Ile spectrum (Figure 2) was acquired at 600 MHz with a sweepwidth of 16 × 44 ppm with 1024 × 256 increments and 256 scans. The 13C‐δ‐Me‐Ile spectrum (Figure 2) was acquired at 700 MHz with a sweepwidth of 16 × 22 ppm with 1024 × 128 increments and 32 scans. The S‐methLD‐Leu and 13CH3‐Val spectra (Figure 5) were acquired at 700 MHz with a sweepwidth of 16 × 22 ppm with 512 × 128 increments and 64 scans. Spectra were processed using NMRPipe (Delaglio et al., 1995) utilizing hmsIST (Hyberts et al., 2012; Hyberts et al., 2017) and visualized with cara (Keller, 2004) utilizing NMRbox (Maciejewski et al., 2017) with the exception of the 19F spectrum which was processed using a shifted sine bell window function (qsin2) and zero filling from 1k to 32k points and visualized utilizing Topspin 4.04 (Bruker).
4.8. Sample preparation for mass spectrometry
Three micrograms of purified protein were denatured in 8 M urea and 50 mM Tris buffer at pH 8.2. Protein was reduced with 5 mM dithiothreitol (DTT) at 50°C for 45 min, alkylated with 15 mM iodoacetic acid at room temperature for 45 min and alkylation quenched with an additional 5 mM DTT. The solution was diluted fivefold with Tris 50 mM buffer and trypsin added at 10 ng/μL final concentration. Digestion was carried out at 37°C for 4 h, at which point digestion was stopped with trifluoroacetic acid (TFA) at 1% vol/vol final concentration. Peptides were desalted using stage tips packed with four stages of Empore C18 material (3M). Stage tips were sequentially conditioned with 100% ACN, 70% ACN with 0.25% acetic acid (AA), 40% ACN with 0.5% AA, and 0.1% TFA. Digested peptides were loaded, washed with 0.1% TFA and 0.5% AA and finally eluted with 70% ACN with 0.25% AA. All peptide samples were lyophilized prior to mass spectrometry analysis.
4.9. Mass spectrometry and data analysis
Lyophilized peptide samples were resuspended in 3% ACN, 4% formic acid and subjected to liquid chromatography coupled to tandem mass spectrometry (LC‐MS/MS). Peptide samples were loaded into a 100 μm ID × 3 cm precolumn packed with Reprosil C18 1.9 μm, 120 Å particles (Dr. Maisch). Peptides were eluted over a 100 μm ID × 30 cm analytical column packed with the same material housed in a column heater set to 50°C and separated by gradient elution of 4 to 30% ACN in 0.15% FA over 45 min at 400 nL/min delivered by an Easy1000 nLC system (Thermo Fisher Scientific). Peptides were analyzed online on an Orbitrap Exploris 480 mass spectrometer (Thermo Fisher Scientific). Mass spectra were collected using a data‐dependent acquisition method. For each cycle, a full MS scan (300–1200 m/z, resolution 120,000, with a 300% Normalized AGC target) was followed by 15 MS/MS scans (isolation width 2.0 Da, 30% normalized collision energy, resolution 15,000, 100% Normalized AGC target) on the top 15 most intense precursor peaks.
Raw files were converted to mzML formats using MSconvert, and MS/MS spectra were searched against a target/decoy protein sequence database using Comet (version 2019.01.05) (Eng et al., 2015). Protein sequence databases used included Uniprot human proteome (UP000005640 downloaded 2021‐06), and N30β construct fasta sequences. Mass tolerance and search parameters followed Comet source website recommendations: 20 ppm precursor mass tolerance, 0.02 Da fragment tolerance, and 0 Da offset for MS/MS scans. Trypsin was selected as the digestive enzyme with a maximum of two missed cleavages, constant carbamidomethylation modification of cysteines (+57.0215 Da) and variable modifications of methionine oxidation (+15.9949 Da) and N‐terminal acetylation (+42.0106 Da). Variable modifications were also used to search for the incorporation of U‐13C‐Ile (+6.0201) and 4‐F‐Phe (+17.9906). Search results were filtered with Percolator (Percolator version 3.01) (Käll et al., 2007) to a 1% false discovery rate at the PSM level. Peptide abundance was determined using in‐house quantification software to extract MS1 intensity. The incorporation of U‐13C‐Ile at isoleucine sites was calculated by summing all MS1 intensities for isotopically labeled peptides divided by the total intensity of MS1 features mapped labeled or unlabeled peptides. Similarly, the incorporation of 4‐F‐Phe at phenylalanine sites was calculated as previously reported (Rodriguez‐Mias et al., 2022) by summing the intensity of all MS1 features for peptides containing 4‐F‐Phe for a given site divided by the total intensity peptides covering the said site. For sites occurring in peptides with multiple phenylalanines where localization cannot be ascertained an average incorporation rate was calculated.
AUTHOR CONTRIBUTIONS
Robert J. Mallis: Conceptualization; investigation; funding acquisition; writing – original draft; methodology; validation; visualization; writing – review and editing; project administration; data curation; supervision; resources. Jonathan J. Lee: Investigation; methodology; validation. Arjen Van den Berg: Conceptualization; investigation; methodology; resources; supervision. Kristine N. Brazin: Investigation; writing – review and editing; methodology. Thibault Viennet: Investigation; writing – review and editing; methodology. Jonathan Zmuda: Investigation. Melissa Cross: Investigation. Denitsa Radeva: Investigation. Ricard Rodriguez‐Mias: Investigation; methodology; writing – review and editing. Judit Villén: Investigation; supervision; methodology. Vladimir Gelev: Investigation; writing – review and editing; supervision; resources. Ellis L. Reinherz: Conceptualization; funding acquisition; supervision; project administration; writing – review and editing; resources. Haribabu Arthanari: Conceptualization; investigation; funding acquisition; methodology; writing – review and editing; supervision; resources; project administration; writing – original draft.
CONFLICT OF INTEREST STATEMENT
Arjen van den Berg, Jonathan Zmuda, and Melissa Cross are employed by Thermo Fisher. Vladimir Gelev is the founder of FB Reagents Ltd., a company specializing in stable isotope‐labeled biochemicals. Other authors declare no conflict of interest.
ACKNOWLEDGMENTS
This work was supported by funding from NIH P01AI143565 (Robert J. Mallis, Ellis L. Reinherz, Haribabu Arthanari), and by the Medical Research Program grant from the W.M. Keck Foundation (Ricard Rodriguez‐Mias, Judit Villén). This study made use of NMRbox: National Center for Biomolecular NMR Data Processing and Analysis, a Biomedical Technology Research Resource (BTRR), which is supported by NIH grant P41GM111135 (NIGMS).
Mallis RJ, Lee JJ, Berg AVd, Brazin KN, Viennet T, Zmuda J, et al. Efficient and economic protein labeling for NMR in mammalian expression systems: Application to a preT‐cell and T‐cell receptor protein. Protein Science. 2024;33(4):e4950. 10.1002/pro.4950
Review Editor: Hideo Akutsu
Contributor Information
Robert J. Mallis, Email: robert_mallis@hms.harvard.edu.
Haribabu Arthanari, Email: hari_arthanari@hms.harvard.edu.
REFERENCES
- Adams JJ, Narayanan S, Liu B, Birnbaum ME, Kruse AC, Bowerman NA, et al. T cell receptor signaling is limited by docking geometry to peptide‐major histocompatibility complex. Immunity. 2011;35:681–693. [DOI] [PMC free article] [PubMed] [Google Scholar]
- Ahuja S, Hornak V, Yan ECY, Syrett N, Goncalves JA, Hirshfeld A, et al. Helix movement is coupled to displacement of the second extracellular loop in rhodopsin activation. Nat Struct Mol Biol. 2009;16:168–175. [DOI] [PMC free article] [PubMed] [Google Scholar]
- Aricescu AR, Owens RJ. Expression of recombinant glycoproteins in mammalian cells: towards an integrative approach to structural biology. Curr Opin Struct Biol. 2013;23:345–356. [DOI] [PMC free article] [PubMed] [Google Scholar]
- Banci L, Barbieri L, Bertini I, Luchinat E, Secci E, Zhao Y, et al. Atomic‐resolution monitoring of protein maturation in live human cells by NMR. Nat Chem Biol. 2013;9:297–299. [DOI] [PMC free article] [PubMed] [Google Scholar]
- Behera SP, Dubey A, Chen W‐N, De Paula VS, Zhang M, Sgourakis NG, et al. Nearest‐neighbor NMR spectroscopy: categorizing spectral peaks by their adjacent nuclei. Nat Commun. 2020;11:5547. [DOI] [PMC free article] [PubMed] [Google Scholar]
- Boeszoermenyi A, Chhabra S, Dubey A, Radeva DL, Burdzhiev NT, Chanev CD, et al. Aromatic 19F‐13C TROSY: a background‐free approach to probe biomolecular structure, function, and dynamics. Nat Methods. 2019;16:333–340. [DOI] [PMC free article] [PubMed] [Google Scholar]
- Boulter JM, Glick M, Todorov PT, Baston E, Sami M, Rizkallah P, et al. Stable, soluble T‐cell receptor molecules for crystallization and therapeutics. Protein Eng. 2003;16:707–711. [DOI] [PubMed] [Google Scholar]
- Chao F‐A, Shi L, Masterson LR, Veglia G. FLAMEnGO: a fuzzy logic approach for methyl group assignment using NOESY and paramagnetic relaxation enhancement data. J Magn Reson. 2012;214:103–110. [DOI] [PMC free article] [PubMed] [Google Scholar]
- Clark L, Dikiy I, Rosenbaum DM, Gardner KH. On the use of Pichia pastoris for isotopic labeling of human GPCRs for NMR studies. J Biomol NMR. 2018;71:203–211. [DOI] [PMC free article] [PubMed] [Google Scholar]
- Das DK, Feng Y, Mallis RJ, Li X, Keskin DB, Hussey RE, et al. Force‐dependent transition in the T‐cell receptor β‐subunit allosterically regulates peptide discrimination and pMHC bond lifetime. Proc Natl Acad Sci U S A. 2015;112:1517–1522. [DOI] [PMC free article] [PubMed] [Google Scholar]
- Das DK, Mallis RJ, Duke‐Cohan JS, Hussey RE, Tetteh PW, Hilton M, et al. Pre‐T cell receptors (pre‐TCRs) leverage Vβ complementarity determining regions (CDRs) and hydrophobic patch in mechanosensing thymic self‐ligands. J Biol Chem. 2016;291:25292–25305. [DOI] [PMC free article] [PubMed] [Google Scholar]
- Delaglio F, Grzesiek S, Vuister GW, Zhu G, Pfeifer J, Bax A. NMRPipe: a multidimensional spectral processing system based on UNIX pipes. J Biomol NMR. 1995;6:277–293. [DOI] [PubMed] [Google Scholar]
- Dubey A, Stoyanov N, Viennet T, Chhabra S, Elter S, Borggräfe J, et al. Local deuteration enables NMR observation of methyl groups in proteins from eukaryotic and cell‐free expression systems. Angew Chem Int Ed Engl. 2021;60:13783–13787. [DOI] [PMC free article] [PubMed] [Google Scholar]
- Dubey A, Viennet T, Chhabra S, Takeuchi K, Seo H‐C, Bermel W, et al. 15N‐detected TROSY NMR experiments to study large disordered proteins in high‐field magnets. Chem Commun. 2022;58:9512–9515. [DOI] [PMC free article] [PubMed] [Google Scholar]
- Duke‐Cohan JS, Akitsu A, Mallis RJ, Messier CM, Lizotte PH, Aster JC, et al. Pre‐T cell receptor self‐MHC sampling restricts thymocyte dedifferentiation. Nature. 2022;613:565–574. [DOI] [PMC free article] [PubMed] [Google Scholar]
- Dulbecco R, Freeman G. Plaque production by the polyoma virus. Virology. 1959;8:396–397. [DOI] [PubMed] [Google Scholar]
- Eagle H. Amino acid metabolism in mammalian cell cultures. Science. 1959;130:432–437. [DOI] [PubMed] [Google Scholar]
- Eilers M, Reeves PJ, Ying W, Khorana HG, Smith SO. Magic angle spinning NMR of the protonated retinylidene Schiff base nitrogen in rhodopsin: expression of 15N‐lysine‐ and 13C‐glycine‐labeled opsin in a stable cell line. Proc Natl Acad Sci U S A. 1999;96:487–492. [DOI] [PMC free article] [PubMed] [Google Scholar]
- Eng JK, Hoopmann MR, Jahan TA, Egertson JD, Noble WS, MacCoss MJ. A deeper look into comet—implementation and features. J Am Soc Mass Spectrom. 2015;26:1865–1874. [DOI] [PMC free article] [PubMed] [Google Scholar]
- Engler C, Kandzia R, Marillonnet S. A one pot, one step, precision cloning method with high throughput capability. PloS One. 2008;3:e3647. [DOI] [PMC free article] [PubMed] [Google Scholar]
- Felli IC, Pierattelli R. 13C direct detected NMR for challenging systems. Chem Rev. 2022;122:9468–9496. [DOI] [PMC free article] [PubMed] [Google Scholar]
- Franke B, Opitz C, Isogai S, Grahl A, Delgado L, Gossert AD, et al. Production of isotope‐labeled proteins in insect cells for NMR. J Biomol NMR. 2018;71:173–184. [DOI] [PubMed] [Google Scholar]
- Gardner KH, Kay LE. The use of 2H, 13C, 15N multidimensional NMR to study the structure and dynamics of proteins. Annu Rev Biophys Biomol Struct. 1998;27:357–406. [DOI] [PubMed] [Google Scholar]
- Gossert AD, Jahnke W. Isotope labeling in insect cells. In: Atreya H, editor. Isotope labeling in biomolecular NMR. Volume 992. Dordrecht: Springer; 2012. p. 179–196. [DOI] [PubMed] [Google Scholar]
- Gross JD, Gelev VM, Wagner G. A sensitive and robust method for obtaining intermolecular NOEs between side chains in large protein complexes. J Biomol NMR. 2003;25:235–242. [DOI] [PubMed] [Google Scholar]
- Henot F, Kerfah R, Törner R, Macek P, Crublet E, Gans P, et al. Optimized precursor to simplify assignment transfer between backbone resonances and stereospecifically labelled valine and leucine methyl groups: application to human Hsp90 N‐terminal domain. J Biomol NMR. 2021;75:221–232. [DOI] [PubMed] [Google Scholar]
- Höfurthner T, Toscano G, Kontaxis G, Beier A, Mayer M, Geist L, et al. Synthesis of a 13C‐methylene‐labeled isoleucine precursor as a useful tool for studying protein side‐chain interactions and dynamics. J Biomol NMR. 2023. 10.1007/s10858-023-00427-2 [DOI] [PMC free article] [PubMed] [Google Scholar]
- Hyberts SG, Milbradt AG, Wagner AB, Arthanari H, Wagner G. Application of iterative soft thresholding for fast reconstruction of NMR data non‐uniformly sampled with multidimensional Poisson gap scheduling. J Biomol NMR. 2012;52:315–327. [DOI] [PMC free article] [PubMed] [Google Scholar]
- Hyberts SG, Robson SA, Wagner G. Interpolating and extrapolating with hmsIST: seeking a tmax for optimal sensitivity, resolution and frequency accuracy. J Biomol NMR. 2017;68:139–154. [DOI] [PMC free article] [PubMed] [Google Scholar]
- Imarai M, Goyarts EC, van Bleek GM, Nathenson SG. Diversity of T cell receptors specific for the VSV antigenic peptide (N52‐59) bound by the H‐2Kb class I molecule. Cell Immunol. 1995;160:33–42. [DOI] [PubMed] [Google Scholar]
- Imbert L, Lenoir‐Capello R, Crublet E, Vallet A, Awad R, Ayala I, et al. In vitro production of perdeuterated proteins in H2O for biomolecular NMR studies. In: Chen YW, Yiu CPB, editors. Structural genomics. Volume 2199. New York: Humana Press; 2021. p. 127–149. [DOI] [PubMed] [Google Scholar]
- Johnson JL, Jones MB, Ryan SO, Cobb BA. The regulatory power of glycans and their binding partners in immunity. Trends Immunol. 2013;34:290–298. [DOI] [PMC free article] [PubMed] [Google Scholar]
- Kainosho M, Güntert P. SAIL—stereo‐array isotope labeling. Q Rev Biophys. 2009;42:247–300. [DOI] [PubMed] [Google Scholar]
- Kainosho M, Torizawa T, Iwashita Y, Terauchi T, Mei Ono A, Güntert P. Optimal isotope labelling for NMR protein structure determinations. Nature. 2006;440:52–57. [DOI] [PubMed] [Google Scholar]
- Käll L, Canterbury JD, Weston J, Noble WS, MacCoss MJ. Semi‐supervised learning for peptide identification from shotgun proteomics datasets. Nat Methods. 2007;4:923–925. [DOI] [PubMed] [Google Scholar]
- Kast P. Making proteins with unnatural amino acids: the first engineered aminoacyl‐tRNA synthetase revisited. Chembiochem. 2011;12:2395–2398. [DOI] [PubMed] [Google Scholar]
- Kay LE. Solution NMR spectroscopy of supra‐molecular systems, why bother? A methyl‐TROSY view. J Magn Reson. 2011;210:159–170. [DOI] [PubMed] [Google Scholar]
- Keller R. Computer aided resonance assignment tutorial. Switzerland Cantina: Goldau; 2004. [Google Scholar]
- Kim ST, Takeuchi K, Sun Z‐YJ, Touma M, Castro CE, Fahmy A, et al. The αβ T cell receptor is an anisotropic mechanosensor. J Biol Chem. 2009;284:31028–31037. [DOI] [PMC free article] [PubMed] [Google Scholar]
- Kitevski‐LeBlanc JL, Evanics F, Prosser RS. Approaches for the measurement of solvent exposure in proteins by 19F NMR. J Biomol NMR. 2009;45:255–264. [DOI] [PubMed] [Google Scholar]
- Kitevski‐LeBlanc JL, Evanics F, Scott Prosser R. Optimizing 19F NMR protein spectroscopy by fractional biosynthetic labeling. J Biomol NMR. 2010;48:113–121. [DOI] [PubMed] [Google Scholar]
- Kreslavsky T, Gleimer M, Miyazaki M, Choi Y, Gagnon E, Murre C, et al. β‐Selection‐induced proliferation is required for αβ T cell differentiation. Immunity. 2012;37:840–853. [DOI] [PMC free article] [PubMed] [Google Scholar]
- Li X, Mizsei R, Tan K, Mallis RJ, Duke‐Cohan JS, Akitsu A, et al. Pre‐T cell receptors topologically sample self‐ligands during thymocyte β‐selection. Science. 2021;371:181–185. [DOI] [PMC free article] [PubMed] [Google Scholar]
- Linser R, Gelev V, Hagn F, Arthanari H, Hyberts SG, Wagner G. Selective methyl labeling of eukaryotic membrane proteins using cell‐free expression. J Am Chem Soc. 2014;136:11308–11310. [DOI] [PMC free article] [PubMed] [Google Scholar]
- Liu J, Tse AG, Chang HC, Liu J, Wang J, Hussey RE, et al. Crystallization of a deglycosylated T cell receptor (TCR) complexed with an anti‐TCR Fab fragment. J Biol Chem. 1996;271:33639–33646. [DOI] [PubMed] [Google Scholar]
- Luchinat E, Barbieri L, Cremonini M, Nocentini A, Supuran CT, Banci L. Drug screening in human cells by NMR spectroscopy allows the early assessment of drug potency. Angew Chem Int Ed Engl. 2020;59:6535–6539. [DOI] [PMC free article] [PubMed] [Google Scholar]
- Maciejewski MW, Schuyler AD, Gryk MR, Moraru II, Romero PR, Ulrich EL, et al. NMRbox: a resource for biomolecular NMR computation. Biophys J. 2017;112:1529–1534. [DOI] [PMC free article] [PubMed] [Google Scholar]
- Mallis RJ, Arthanari H, Lang MJ, Reinherz EL, Wagner G. NMR‐directed design of pre‐TCRβ and pMHC molecules implies a distinct geometry for pre‐TCR relative to αβTCR recognition of pMHC. J Biol Chem. 2018;293:754–766. [DOI] [PMC free article] [PubMed] [Google Scholar]
- Mallis RJ, Bai K, Arthanari H, Hussey RE, Handley M, Li Z, et al. Pre‐TCR ligand binding impacts thymocyte development before αβTCR expression. Proc Natl Acad Sci U S A. 2015;112:8373–8378. [DOI] [PMC free article] [PubMed] [Google Scholar]
- Mallis RJ, Brazin KN, Duke‐Cohan JS, Hwang W, Wang J‐H, Wagner G, et al. NMR: an essential structural tool for integrative studies of T cell development, pMHC ligand recognition and TCR mechanobiology. J Biomol NMR. 2019;73:319–332. [DOI] [PMC free article] [PubMed] [Google Scholar]
- Mallis RJ, Reinherz EL, Wagner G, Arthanari H. Backbone resonance assignment of N15, N30 and D10 T cell receptor β subunits. Biomol NMR Assign. 2016;10:35–39. [DOI] [PMC free article] [PubMed] [Google Scholar]
- Mas G, Guan J‐Y, Crublet E, Debled EC, Moriscot C, Gans P, et al. Structural investigation of a chaperonin in action reveals how nucleotide binding regulates the functional cycle. Sci Adv. 2018;4:eaau4196. [DOI] [PMC free article] [PubMed] [Google Scholar]
- Milbradt AG, Arthanari H, Takeuchi K, Boeszoermenyi A, Hagn F, Wagner G. Increased resolution of aromatic cross peaks using alternate 13C labeling and TROSY. J Biomol NMR. 2015;62:291–301. [DOI] [PMC free article] [PubMed] [Google Scholar]
- Mizsei R, Li X, Chen W‐N, Szabo M, Wang J‐H, Wagner G, et al. A general chemical crosslinking strategy for structural analyses of weakly interacting proteins applied to preTCR‐pMHC complexes. J Biol Chem. 2021;296:100255. [DOI] [PMC free article] [PubMed] [Google Scholar]
- Monneau YR, Rossi P, Bhaumik A, Huang C, Jiang Y, Saleh T, et al. Automatic methyl assignment in large proteins by the MAGIC algorithm. J Biomol NMR. 2017;69:215–227. [DOI] [PMC free article] [PubMed] [Google Scholar]
- Nerli S, De Paula VS, McShan AC, Sgourakis NG. Backbone‐independent NMR resonance assignments of methyl probes in large proteins. Nat Commun. 2021;12:691. [DOI] [PMC free article] [PubMed] [Google Scholar]
- Pham LBT, Costantino A, Barbieri L, Calderone V, Luchinat E, Banci L. Direct expression of fluorinated proteins in human cells for 19F in‐cell NMR spectroscopy. J Am Chem Soc. 2023;145:1389–1399. [DOI] [PMC free article] [PubMed] [Google Scholar]
- Powell LD, Smith K, Hart GW. Site specific glycosylation patterns of H‐2K: effects of allelic polymorphism and mitogenic stimulation. J Immunol. 1987;139:1206–1213. [PubMed] [Google Scholar]
- Pritišanac I, Degiacomi MT, Alderson TR, Carneiro MG, Ab E, Siegal G, et al. Automatic assignment of methyl‐NMR spectra of supramolecular machines using graph theory. J Am Chem Soc. 2017;139:9523–9533. [DOI] [PubMed] [Google Scholar]
- Pritišanac I, Würz JM, Alderson TR, Güntert P. Automatic structure‐based NMR methyl resonance assignment in large proteins. Nat Commun. 2019;10:4922. [DOI] [PMC free article] [PubMed] [Google Scholar]
- Reeves PJ, Callewaert N, Contreras R, Khorana HG. Structure and function in rhodopsin: high‐level expression of rhodopsin with restricted and homogeneous N‐glycosylation by a tetracycline‐inducible N‐acetylglucosaminyltransferase I‐negative HEK293S stable mammalian cell line. Proc Natl Acad Sci U S A. 2002;99:13419–13424. [DOI] [PMC free article] [PubMed] [Google Scholar]
- Rodriguez‐Mias RA, Hess KN, Ruiz BY, Smith IR, Barente AS, Zimmerman SM, et al. Proteome‐wide identification of amino acid substitutions deleterious for protein function. bioRxiv. 2022. 10.1101/2022.04.06.487405 [DOI] [Google Scholar]
- Rudolph MG, Stanfield RL, Wilson IA. How TCRs bind MHCs, peptides, and coreceptors. Annu Rev Immunol. 2006;24:419–466. [DOI] [PubMed] [Google Scholar]
- Ryan SO, Cobb BA. Roles for major histocompatibility complex glycosylation in immune function. Semin Immunopathol. 2012;34:425–441. [DOI] [PMC free article] [PubMed] [Google Scholar]
- Schanda P, Kupce E, Brutscher B. SOFAST‐HMQC experiments for recording two‐dimensional heteronuclear correlation spectra of proteins within a few seconds. J Biomol NMR. 2005;33:199–211. [DOI] [PubMed] [Google Scholar]
- Siegel BV, Lund RO, Wellings SR, Bostic WL. Growth of HeLa cells in heavy water. Exp Cell Res. 1960;19:187–189. [DOI] [PubMed] [Google Scholar]
- Stehle J, Silvers R, Werner K, Chatterjee D, Gande S, Scholz F, et al. Characterization of the simultaneous decay kinetics of metarhodopsin states II and III in rhodopsin by solution‐state NMR spectroscopy. Angew Chem Int Ed Engl. 2014;53:2078–2084. [DOI] [PubMed] [Google Scholar]
- Tiller T, Busse CE, Wardemann H. Cloning and expression of murine Ig genes from single B cells. J Immunol Methods. 2009;350:183–193. [DOI] [PubMed] [Google Scholar]
- von Boehmer H. The thymus in immunity and in malignancy. Cancer Immunol Res. 2014;2:592–597. [DOI] [PubMed] [Google Scholar]
- Wang J‐H, Reinherz EL. The structural basis of αβ T‐lineage immune recognition: TCR docking topologies, mechanotransduction, and co‐receptor function. Immunol Rev. 2012;250:102–119. [DOI] [PMC free article] [PubMed] [Google Scholar]
- Werner K, Richter C, Klein‐Seetharaman J, Schwalbe H. Isotope labeling of mammalian GPCRs in HEK293 cells and characterization of the C‐terminus of bovine rhodopsin by high resolution liquid NMR spectroscopy. J Biomol NMR. 2008;40:49–53. [DOI] [PubMed] [Google Scholar]
- Wheatley DN, Henderson JY. p‐Fluorophenylalanine and ‘division‐related proteins’. Nature. 1974;247:281–283. [DOI] [PubMed] [Google Scholar]
- Willis RA, Ramachandiran V, Shires JC, Bai G, Jeter K, Bell DL, et al. Production of class II MHC proteins in lentiviral vector‐transduced HEK‐293T cells for tetramer staining reagents. Curr Protoc. 2021;1:e36. [DOI] [PMC free article] [PubMed] [Google Scholar]
- Xie T, Saleh T, Rossi P, Kalodimos CG. Conformational states dynamically populated by a kinase determine its function. Science. 2020;370:eabc2754. [DOI] [PMC free article] [PubMed] [Google Scholar]
- Xu Y, Matthews S. MAP‐XSII: an improved program for the automatic assignment of methyl resonances in large proteins. J Biomol NMR. 2013;55:179–187. [DOI] [PubMed] [Google Scholar]
- Yeliseev A, van den Berg A, Zoubak L, Hines K, Stepnowski S, Williston K, et al. Thermostability of a recombinant G protein‐coupled receptor expressed at high level in mammalian cell culture. Sci Rep. 2020;10:16805. [DOI] [PMC free article] [PubMed] [Google Scholar]