

SUMMARY
Senescent cells are a major contributor to age-dependent cardiovascular tissue dysfunction, but knowledge of their in vivo cell markers and tissue context is lacking. To reveal tissue-relevant senescence biology, we integrate the transcriptomes of 10 experimental senescence cell models with a 224 multi-tissue gene co-expression network based on RNA-seq data of seven tissues biopsies from ~600 coronary artery disease (CAD) patients. We identify 56 senescence-associated modules, many enriched in CAD GWAS genes and correlated with cardiometabolic traits—which supports universality of senescence gene programs across tissues and in CAD. Cross-tissue network analyses reveal 86 candidate senescence-associated secretory phenotype (SASP) factors, including COL6A3. Experimental knockdown of COL6A3 induces transcriptional changes that overlap the majority of the experimental senescence models, with cell-cycle arrest linked to modulation of DREAM complex-targeted genes. We provide a transcriptomic resource for cellular senescence and identify candidate biomarkers, SASP factors, and potential drivers of senescence in human tissues.
In brief
Savic et al. provide a resource of senescent cell-associated molecular processes relevant to human cardiometabolic pathology through integrating senescence transcriptomic signatures from 10 experimental settings with human co-expression networks generated within seven tissue types biopsied from a cohort of ~600 coronary artery disease patients undergoing coronary artery bypass graft surgery.
Graphical Abstract
INTRODUCTION
Cellular senescence manifests as stable growth arrest, chromatin remodeling, increased autophagy, and acquisition of a senescence-associated secretory phenotype (SASP).1,2 DNA damage and cellular stress, as well as chronological aging, are some of the driving forces of cellular senescence. The SASP is in part responsible for deleterious local and systemic effects, mediated by inflammatory cytokines, chemokines, and extracellular matrix-degrading proteins.2 Acute and embryonic-associated senescence is an integral component of tissue homeostasis or tissue patterning and considered favorable. In contrast, chronic senescence, including damaging SASP factors, leads to cumulative damage and impaired cellular function.3 This dichotomy places senescence at important crossroads of human health, aging, and disease.
Senescent cells are a major contributor to age-dependent cardiovascular tissue dysfunction.4,5 Cells of the arterial wall undergo senescence upon aging via several mechanisms such as mitochondrial dysfunction, increased reactive oxygen species, DNA damage, and telomere dysfunction. The burden of senescent endothelial cells, vascular smooth muscle cells, T cells, monocytes, and lipid-laden foam cells and their associated SASP creates a proatherogenic environment leading to plaque development and instability and increased inflammation. Studies using senolytics or transgenic models in which p16Ink4a-expressing senescent cells are selectively eliminated support that a reduced cardiovascular senescence cell burden can delay and even reverse characteristics of cardiovascular disease.6–10 Given the potential for senotherapy to improve age-associated cardiovascular pathologies, there is a critical need to understand and identify markers of senescent cells in human disease settings.
The assumed rarity of senescent cells in vivo has led to the majority of the understanding of senescent cells being supported by experimental culture systems.3,11 Given the varying senescence-inciting signals and resulting heterogeneous cellular phenotypes, multimarker approaches are likely necessary for assessing cellular senescence in vivo. Most commonly, senescence-associated markers include genes involved in cell-cycle arrest (p53-p21-RB and p16INK4a(p16)-RB tumor suppressors), increased senescence-associated beta galactosidase activity (SA-β-gal), increased DNA damage (e.g., γH2AX), formation of senescence-associated heterochromatin foci, and acquisition of the SASP phenotype (e.g., TGFβ, IL-6).12 Despite these current markers, well-defined universal senescent cell markers from in vivo settings are still lacking.
In this study, we aimed to identify and molecularly characterize senescent cells within seven disease-relevant tissue types biopsied from a cohort of ~600 coronary artery disease (CAD) patients undergoing coronary artery bypass graft surgery (CABG) in the Stockholm-Tartu Atherosclerosis Reverse Network Engineering Task (STARNET) study.13 Weighted gene co-expression network analysis (WGCNA) was applied to transcriptome data across tissues including blood, metabolic organs such as liver, skeletal muscle, and adipose tissues, as well as atherosclerotic arterial wall, resulting in a total of 131 tissue-specific (TS) and 93 cross-tissue (CT) gene co-expression modules.14 Our approach involves the mapping of molecular signatures from 10 different in vitro-derived senescent cell models onto modules of co-expressed genes from the STARNET cohort transcriptome data. We show that in vitro senescent cell molecular profiles may reveal modules of co-expressed genes associated with senescence cells in vivo. Using the topology of the STARNET network, we furthermore hypothesize that marker genes are identifiable as key driver genes (KDGs) of molecular programs mimicking those of senescent cells in vitro. Here, we identified and subsequently validated collagen type VI alpha 3 chain (COL6A3) as a driver of a liver-associated senescent-enriched module (SAM), with COL6A3 downregulation causing senescence. Our study highlights that analyses of senescence transcriptomic signatures from controlled experimental settings in combination with human co-expression networks can uncover cellular senescence processes relevant to human cardiometabolic pathology. This, in turn, can contribute to identification of disease-type and tissue-relevant senescence biomarkers.
RESULTS
Transcriptional changes induced by senescence stressors are largely cell type specific
We generated a variety of in vitro models of senescence, and following transcriptome analysis, we created 10 different differential gene expression signatures associated with senescence induction (Figure 1A). Cellular senescence was induced in IMR90 cells, a normal human fetal lung fibroblast cell line, using various stressors including X-ray irradiation, oncogenic RasV12 transformation, or treatment with bleomycin, rotenone, antimycin, or oligomycin. Irradiation was used to induce senescence in four other cell lines including RPTECs (human renal proximal tubule epithelial cells), HUVECs (human umbilical vein endothelial cells), HMVECs (human lung microvascular endothelial cells), and ADSCs (human adipose tissue-derived stem cells) (Figures 1A and S1). Senescent cells were molecularly profiled using RNA-seq followed by analysis of differentially expressed genes (DEGs) (Data S1). We defined DEGs as the topmost significantly up- and downregulated protein coding genes ranked by adjusted p value (FDR < 0.05) with a maximum of 1,250 up- and 1,250 downregulated genes, compared to quiescent or DMSO-treated control cells (Figure 1A and Data S2).
Figure 1. Generation of in vitro molecular signatures of senescence.

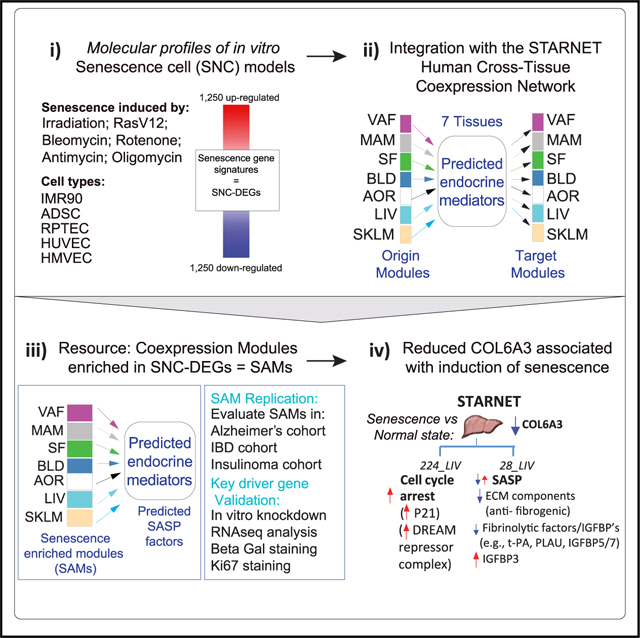
(A) Schema outlining the experimental setup including generation of 10 differential expression gene signatures (DEGs) representing senescent cells (SNCs). Senescence was induced in five different cell types by X-ray irradiation, pharmacological agents, or transduction of cells with an oncogene RasV12. Signatures of senescent cells were defined by the top and bottom 1,250 significantly differentially expressed protein coding genes (senescence DEGs, all genes at least adj p < 0.05). A network consisting of tissue-specific (TS) and cross-tissue (CT) modules of co-expressed genes within seven tissues—VAT (visceral adipose tissue); MAM (mammary artery); SF (subcutaneous fat); BLOOD (blood); AOR (aorta); LIV (liver); and SKLM (skeletal muscle)—sampled from the STARNET CAD cohort was integrated with the senescence DEGs. Potential endocrine mediators and their target tissues were predicted from the cross-tissue network. Output is senescence-associated modules (SAMs), key driver genes (KDGs) of SAMs (SAM-KDGs), and predicted senescence-associated secreted proteins (SAM-SASPs) and their target tissue modules.
(B) UpSet plot of genes found in at least 9/10 or in 10/10 senescence DEGs (independent of the direction of change). Enrichment p values are indicated by the color of the bars. Eight genes were common across all SNC-DEGs with CCND2 consistently upregulated (log2FC between 1.68 and 4.49, see Data S2).
(C) Venn diagrams summarizing the number of SNC-DEG genes common to X-ray irradiated cells (“CELLS”), mitochondrial stress-associated senescence (“MITO”), and senescent IMR90 cells across multiple modes of senescence induction (“MODES”) (Data S3, tab S4).
(D) Heatmap summarizing the significance (–log10 Bonferroni adj p value) of the overlap of the genes found differentially expressed following different modes of senescence induction with the text in each cell representing the fold enrichment (Fisher’s exact test, full data in Data S2).
(E) Heatmap summarizing the log2 fold changes across the 10 senescence DEGs of genes curated from the literature as associated with senescence (see STAR Methods).
A cross-signature comparison of the 10 senescent cell DEGs revealed eight genes in common (Figure 1B), a significant overlap (SuperExact test p value 9.18E-40, Data S3, tab S3). The greatest number of shared DEGs (472) was among IMR90 cells induced to senescence using either oligomycin, antimycin, or rotenone treatment (Figure 1C, MITO, Data S3, tab S4). Comparing all modes of senescence induction within a single cell type (IMR90) revealed 147 genes in common (Figure 1C, MODES). The fewest number of common genes (38) was found across the five cell types with the same mode of senescence induction (X-ray irradiation, CELLS, Figure 1C). The Jaccard similarity measures (Figure S2) and the significance of the DEG overlap assessments (Figure 1D) revealed senescence molecular profiles, induced by different stressors within the same cell type (IMR90), are more similar than those profiles induced by the same stressor (X-ray irradiation) but in a different cell type. We confirmed our senescence transcriptomes by comparing to previous reports15 (Figure 1E). We noted consistency of several genes with congruous directional changes in expression across all conditions (increased ICAM1, PLAT, IL-1B, IGFBP4, and TNFRSF10C and decreased HMGB3).16,17
We further compared our senescence DEGs to transcriptome analyses by Hernandez-Segura et al.18 who reported fibroblast genes whose expression changed with senescence regardless of the three types of stimuli tested (irradiation, replicative, or Ras oncogene induced; labeled FibroblastS1E in Figure 2A and Data S3, tab S5). Genes upregulated in this set were significantly enriched in all of our upregulated IMR90 fibroblast senescent model DEGs with similar observations with the downregulated DEGs. Interestingly, our MODES gene set, which includes genes commonly changed in IMR90 fibroblasts across six different modes of senescence induction, was also enriched in the previously reported FibroblastS1E signature.18 This further supports that senescence programs within a cell type share many commonalities regardless of the mode of senescence induction (e.g., oncogenic vs. mitochondria stressor). The transcriptomes of our senescent HMVECs, HUVECs, ADSCs, and RPTECs had the fewest number of enrichments, including to the Hernandez-Segura et al.18 gene set referred to as “universal signature” (labeled Universal S2F in Figure 2A) (three stressors across three cell lines). This suggests that fibroblast-specific senescence genes may be over-represented in their “universal signature.” One exception was the “replicative senescence signature” (labeled ReplSen S1C in Figure 2A),18 which was significantly enriched in senescence DEGs from ADSCs, RPTECs, and IMR90 cells, suggesting a commonality between molecular phenotypes induced by replicative senescence and irradiation. In contrast, the recently published gene set “SenMayo” (labeled SenMayo in Figure 2A),19 found to increase with aging across tissues and species with responsiveness to senescent cell clearance, was enriched in all but one of our up-regulated SNC-DEG signature series, supporting a more universal signature than that reported by Hernandez-Segura et al.18
Figure 2. Comparative analysis of senescence molecular signatures and pathway enrichment analysis.

(A) Heatmap of the significant enrichments of the 10 senescence DEGs in publicly available senescence-associated differential expressed genes sets. The definitions of the signature series tested from Hernandez-Segura et al.2 are as follows: Universal S2F: genes common to senescent fibroblasts/keratinocytes/melanocytes induced by three stimuli (RS, IR, OIS); Fibroblast S1E: DEGs in senescent fibroblasts (across six types) regardless of inducer; Fibroblast S2E/Melanocytes S2C/Astrocytes S2D: fibroblast-/melanocyte- or astrocyte-specific senescence genes; FibroMelaKera: temporal gene changes with senescence (4, 10, and 20 days); OncSenesS1B: Ras-oncogene-induced senescence in fibroblasts; and ReplSenS1C: replicative stress-induced senescence in fibroblasts. SenMayo is from Saul et al.19 and represents another universal senescence gene set (–log10 Bonferroni adj p value).
(B) Heatmap of a selection of significant enrichments of the 10 DEGs in Reactome pathways (–log10 Benjamini Hochberg adj p value, see Data S3, tab S6).
We next evaluated the Reactome pathways enriched across the 10 senescence DEGs separated as up- and downregulated gene sets. (Figure 2B, complete results in Data S3, tab S6). Extracellular matrix organization and collagen formation pathways were commonly enriched across senescence DEGs signatures, regardless of direction of change. In contrast, pathways commonly enriched in only upregulated genes related to inflammation such as interferon signaling. Pathways commonly enriched in downregulated senescence DEGs included mainly cell-cycle control. Some pathways were specific to the flavor of senescence induction, such as cholesterol biosynthesis in the IMR90 senescence DEGs (X-ray irradiation) and “rRNA processing” in the senescent HMVECs and HUVECs. Overall, these data represent, to our knowledge, the most comprehensive molecular survey of in vitro senescence, providing evidence that there are both cell-type shared and specific molecular consequences of senescence.
Aging-related disease genes are over-represented in senescence DEGs
To assess relevance of experimental SNC models to human aging genes, we intersected the senescence DEGs with curated lists of genes whose perturbation in experimental model systems (see STAR Methods) was found to drive cellular senescence. Interestingly the most consistently enriched senescence model DEG set in aging-related gene sets was observed in irradiated cells, suggesting that this mode of senescence induction is most reflective of these aging-related genes (CellAge and GeneAge databases, and Ingenuity Pathways; Figure S3A, Data S3, tab S7).
In contrast, genes associated with aging-related disease gene sets were significantly enriched in all senescence DEGs except the MITO and MODES subsets (Figure S3). The “Inflammatome” gene set was generated from combining 11 different rodent chronic inflammatory disease models encompassing pulmonary fibrosis, asthma, atherosclerosis, obesity, and diabetes, and the macrophage-enriched molecular network (MEMN) set consists of genes predicted to be causal in many aging-related complex disease traits.20,21 As aging-associated diseases are generally complications arising from senescence, the near signature-wide enrichment of the senescence DEGs in these two chronic inflammatory disease signatures suggests the senescence DEGs may reveal key molecular processes underpinning these complications.
Mapping senescence-associated programs to human CAD multi-tissue gene co-expression networks
Building upon the fact that senescence DEGs capture aging-related disease genes, we next aimed to identify in vivo-relevant senescence programs by testing for enrichment of each senescence DEG in modules of genes identified from the STARNET human multi-tissue co-expression networks. These networks were inferred from the genetics-of-gene expression STARNET study of living patients undergoing CABG. Seven tissue specimens representing the blood, metabolic, and arterial wall were collected during surgery for genomic analysis (Figure 1A).13 To identify multi-tissue gene co-expression, the WGCNA algorithm was applied to transcriptome data across all seven tissues jointly, resulting in a total of 131 TS and 93 CT gene co-expression network modules14 (see STAR Methods and Data S3, tab S8).
Each senescence model DEG set was projected as a combined gene set of up- and downregulated genes given that the networks were unsigned (see STAR Methods for details). In total, 56 STARNET co-expression modules were significantly enriched (at adjusted p value <0.01 and fold enrichment >3) in the senescence model DEGs, and they are hereafter co-annotated as senescence-associated modules (SAMs) (Figure 3A, Data S3, tab S9). Twenty-four SAMs were CT, and 32 were TS. Some SAMs were enriched in 10 or 9 out of 10 senescence model DEG signatures (e.g., CT modules 28_LIV and 15_VAF, Figure 3A), while other SAMs were enriched in only a few signatures (e.g., TS liver module 98 in IMR90 and HUVEC senescence DEGs). Thus, components of the molecular program underlying the experimental senescence cell systems are both commonly co-expressed in various human tissue types and reflect mode-and cell-specific senescence.
Figure 3. Enrichment of senescence model DEGs in co-expression networks from the STARNET CAD cohort identify in vivo senescence-associated genes.

(A) Heatmap summarizing the cross-tissue (CT) and tissue-specific (TS) modules significantly enriched in the senescence DEG. Fifty-six senescence-associated modules (SAMs, at Bonferroni adjusted p value <0.05 and fold enrichment >3) were identified. 28.CT_LIV SAM was enriched across all DEG-SNCs including MITO and MODES gene sets.
(B) Effect of senescence induction on expression of a predicted key driver gene for 28.CT_LIV SAM and COL6A3.
(C) Chord diagram displaying predicted endocrine mediators of the SAM, 28.CT_LIV, and their target modules. Genes with an asterisk were also predicted key driver genes of the liver module.
(D) Heatmap summarizing the significance of enrichment (–log10 Benjamini Hochberg adj p value) for the 10 senescence DEGs in the three STARNET modules (37_SF, 219_Blood, and 61_Blood) that were predicted cross-tissue targets of liver COL6A3.
Senescence-associated modules enriched in CAD phenotypes support their disease association
We next examined if CAD clinical traits measured in STARNET associate with modules enriched in senescence DEGs. Several SAMs significantly correlated or nominally correlated with at least one CAD phenotype, supporting co-association of senescence with aging-related disease phenotypes (Data S3, tab S10). We highlight that several cardiometabolic traits were significantly correlated (at adj p < 0.05) with expression of SAM_CT.28. At a nominal p value significance, SAM_CT.28 was also correlated with the SYNTAX score,22 which measures CAD severity and reflects clinical outcomes of CAD patients within the diseased artery tissue.14 The whole CT_28 module was also associated with the greatest number of senescence model DEGs and enriched in epithelial mesenchymal transition as well as hypoxia biological terms. Furthermore, CT.28 was significantly enriched in CAD GWAS genes23 (adj p < 0.1, fold enrichment = 5.89, Data S3, tab S11), and CT_28 explained 4.77% of CAD heritability.14 Together, these results causally associate expression of the SAM_CT.28_LIV genes to CAD phenotypes.
Identifying SAM key driver genes and candidate SAM-SASP factors
We next identified key regulatory genes within modules associated with senescence and disease phenotypes. By inferring Bayesian networks for each SAM co-expression module, KDGs were identified as hub nodes, thus inferred to regulate many downstream genes (see STAR Methods) (Data S3, tab S12). Given that senescence DEGs contribute to age-related pathology in part from their SASP, we next turned to identification of secreted factors in the context of SAMs. Here, we used STARNET CT co-expression to decipher endocrine factors underlying inter-tissue communication.14,24 As previously described, candidate mediators of communication across organs were identified as secretory proteins in CT co-expression modules whose expression levels were significantly associated with a trans TS “target” module (see STAR Methods). Such CT SAM endocrine mediator candidates included 86 genes (Data S3, tab S13, column B), hereafter referred to as SAM-SASP factors. For instance, we identified interleukin-6 (IL-6), which recapitulates the well-known importance of this gene in senescence.25 We also identified chondroitin sulfate synthase 1 (CHSY126), a gene reported in mediating paracrine senescence in models of oncogene-induced senescence and recently identified as the mutated gene underlying inflammation, neuro-degeneration, and reduced lifespan in the skt mice.27 These observations serve in part as confirmation of our data-driven approach. Importantly, we present SAM-SASP factors and SAM-KDGs not previously reported associated with senescence and thus are a valuable resource.
Liver COL6A3 is a key driver gene and candidate SAM-SASP factor
To reveal novel senescence-associated biology, we focused on prioritizing a gene that was both a predicted key driver and an endocrine factor (i.e., SAM-SASP factor) in the SAM_CT.28_LIV module. This was the most prominent SAM, enriched in all senescence model DEGs, suggesting it captures core aspects of senescence programs independent of stressor or cell type and causally associated with CAD through GWAS enrichment. Starting from the list of endocrine mediators associated with SAM_CT.28 (i.e., 16 SAM-SASP genes), we prioritized those that were key drivers (Data S3, tab S12, n = 9). Among these, we prioritized collagen 6A3 (COL6A3) as it was repeatedly statistically downregulated in 7 of 10 senescence DEGs (Figure 3B) and had the greatest number of predicted target modules (n = 3, Figure 3C) as an endocrine mediator. The modules/tissues predicted to be targeted by COL6A3 included 219.Blood, 37.SF, and 61.Blood, modules also found enriched in senescence model DEGs when the minimum fold enrichment threshold of 3 was removed and only an adjusted p value < 0.05 was considered (Figure 3D). COL6A3 is a plausible SAM-SASP factor given our results and the knowledge that COL6A3 is one of three major collagen VI polypeptides of the extracellular matrix (ECM) and has a reported soluble cleavage product called endotrophin.28
The biological processes associated with SAM_CT.28_LIV genes included extracellular matrix organization, regulation of IGF binding proteins, and glycosaminoglycan metabolism (Figure 4A, Data S3, tab S14). Interestingly, a significant number of pathways were found associated with cardiac health and function such as dilated cardiomyopathy, elastic fiber formation, and muscle contraction. We surmised these terms could reflect fibrotic processes in the liver given COL6A3’s differential gene expression in CAD patients vs. healthy controls (downregulated 18%, adj p = 3.33E–6, Koplev et al.14). Indeed, SAM_CT.28_LIV was significantly enriched (Figure S3B and Data S3, tabs S15 and S16) in markers of cell types associated with liver cirrhosis, namely fibroblasts and scar-associated mesenchymal and endothelial cells.29
Figure 4. COL6A3 is a predicted key driver gene of 28.CT_LIV SAM and a senescence-associated gene.

(A) Pathway enrichment analysis by ClueGO of 28.CT_LIV module genes and genes from three liver COL6A3 target modules 37.TS_SF, 219.TS_BLOOD, and 61.TS_Blood. Nodes (pathways) are colored according to functional groups revealed by the network edges connecting terms with shared genes between the terms (default setting, Kappa score Cytoscape, Bonferroni adj p < 0.01, KEGG, Reactome, WikiPathways, Data S3, tab S14.2). Node size reflects pathway term adj p value (largest p < 0.0005, middle p = 0.0005–.005, smallest p = 0.005–.05).
(B) Expression by qRT-PCR of COL6A3 expression as normalized to RPLP0 showing ~5-fold reduction in COL6A3 expression following short hairpin RNA (shRNA)-targeted COL6A3 knockdown in IMR90 cells. Experimental protocol is shown as inset.
(C and D) Heatmaps summarizing the significance of enrichment (–log adj p value) of DEGs after COL6A3 knockdown in IMR90 cells with respect to (C) senescence DEGs or (D) select SAMs from (A). Genes either up-, down-, or up- + downregulated were tested. A curated signature from Williams et al.30 included COL6A3 knockdown in myofibroblasts following either 4 or 6 days of perturbation was also tested in (D). Text in the heatmap in (C) are the fold enrichment values.
We next examined the CT molecular consequences of COL6A3 as a potential SASP factor and noted the expression of liver COL6A3 was negatively correlated with expression of the subcutaneous fat module, 37.TS_SF, while positively correlated with the two blood modules, 61.TS_BLOOD and 219.TS_BLOOD. Despite the direction of correlation, a consistent theme was interleukin-4 (IL4) and IL13 signaling, found significantly enriched in all three target modules (Figure 4A). Since these Th2 cytokines have been implicated as key mediators in the pathogenesis of fibroproliferative disorders,31 this suggested liver COL6A3 may also be involved in CT modulation of wound healing and fibrotic processes in adipose and blood. Indeed, cell type analysis of 37.TS_SF genes supported enrichment in scar-associated macrophages (Figure S3B, Data S3, tab S15, columns P–AB), and given the negative correlation between liver COL6A3 and 37.TS_SF, we therefore would expect elevated activity of these cells types/pathways with reduced COL6A3-paracrine signaling activity in the setting of senescence. The blood 219 module in contrast was enriched in neutrophils and given the positive correlation between liver COL6A3 and 219.TS_Blood genes, we therefore would predict decreased activity of these cells types/pathways with reduced COL6A3-mediated paracrine signaling in the setting of senescence (Figure S3B and Data S3, tabs S13, S15, and S16).
Validation that COL6A3 knockdown in fibroblasts induces senescence-like phenotypes
To validate a role for COL6A3 in senescence, we created stably transduced IMR90 fibroblast cells with reduced expression of COL6A3 (COL6A3down) (Figure 4B) and tested if transcriptional profiles of COL6A3down cells mimicked those of the various experimental senescence models. Indeed, the COL6A3down DEGs (1,102 up, 930 down, FDR < 0.05, Figure 4C, Data S2 and Data S3, tab S17) were significantly enriched in the majority (8 of 10) of senescence DEGs. Generally, the genes up- or down-regulated with loss of COL6A3 expression mimicked the genes up- and downregulated in senescence DEGs, supporting the notion that reduced COL6A3 is associated with a pro-senescence cell phenotype. Gene set variation scores of the senescence DEGs generated using the transcriptomes of the COL6A3down versus control shRNA demonstrated a similar trend, with the score of upregulated genes from the senescence models generally higher in the COL6A3down versus control shRNA (Figure S4). Furthermore, COL6A3down cells also showed an increase in senescence-associated beta galactosidase staining and reduction in Ki-67 staining, suggesting reduced COL6A3 expression induced a general senescence-like molecular and biochemical phenotype (Figure S5). As an additional validation, we curated from Williams et al.30 a set of genes found differentially expressed following siRNA-mediated COL6A1/2/3 depletion in cultured myofibroblasts at day 4 and day 6 time points. Genes differentially expressed at either time point following Col6A1/2/3 knockdown were found to significantly overlap with our COL6A3 knockdown DEGs in IMR90 (Data S3, tab S17a), as well as in the various senescence model DEGs (Figure S6A), further confirming that COL6A3 perturbation induces molecular programs similar to those induced with senescence. As Williams et al.30 also demonstrated through siRNA-mediated COL6A1/2/3 depletion, decreased myofibroblast contraction, migration, and wound healing, we surmise these phenotypes may also manifest with senescence-associated reduced COL6A3 expression.
COL6A3 knockdown in fibroblasts induces senescence through modulation of DREAM complex genes
We next tested for enrichment of our IMR90 or the myofibroblast COL6A3down DEGs in all STARNET modules and focused on the subset of STARNET modules in which COL6A3 was either a predicted KDG (CT.28_LIV) or predicted to target as an endocrine mediator (61_Blood, 219_Blood and 37_SF). We hypothesized altered expression of COL6A3 would affect expression of genes similar to those within CT.28_LIV, and indeed, we observed significant overlap of mostly the downregulated DEGs from either IMR90 or myofibroblast COL6A3 knockdown models. We also observed overlap of the upregulated DEGs associated with COL6A3 knockdown in the 219_Blood module genes as well as the downregulated DEGs in the 61_Blood and 37_SF modules, supporting the potential for COL6A3 perturbation to impact the expression of these genes (Figure 4D, Data S3, tab S17). In general, genes down- as well as upregulated by irradiation in IMR90 cells were also enriched in SAM_28.CT_LIV, supporting COL6A3 knockdown as “mimicking” senescence induced by irradiation (Figure S6B, Data S3, tab S17).
Following on these observations, pathway enrichment terms were found overlapping between SAM_CT.28_LIV (Figure 4A) and COL6A3down DEGs (Figure S7, Data S3, tab 17b). Collagen biosynthesis and modifying enzymes pathways were enriched in genes downregulated with COL6A3 knockdown. A “Senescence and autophagy in cancer” term was enriched in both up- and downregulated COL6A3down DEGs, which led us to observe that the SASP factors IGFBP5 and IGFBP7 were downregulated in COL6A3down, but IGFBP3 was upregulated (Figure 5A, Data S2). Given this, we evaluated how COL6A3 suppression in our IMR90 experiment generally affected expression of known SASP factor genes. Using a curated SASP gene list, we found that SASP factor genes were significantly enriched for down- and upregulated COL6A3down DEGs, which contrasts the general upregulation of SASP factors observed in the senescence DEGs (Data S3, tab S18). Thus, the downregulation of COL6A3 partially contributes to the typical SASP factor induction in senescence, with additional molecular triggers important for SASP factor induction (Figure 1A).
Figure 5. Gene expression alterations following COL6A3 knockdown in IMR90 fibroblasts reveal role of DREAM complex in regulating senescence cell-cycle.
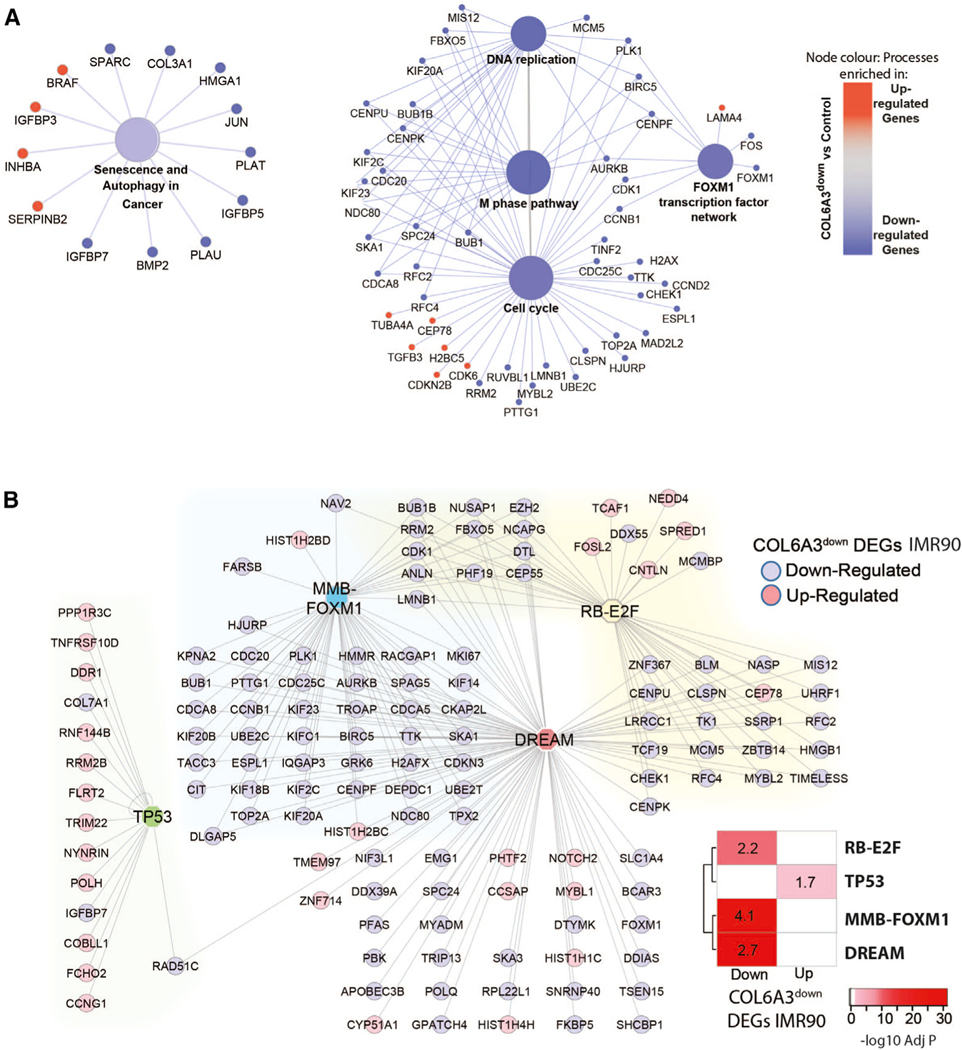
(A) The pathways “Senescence and Authophagy and Cancer” and “Cell-Cycle” selected from Figure S7, which shows the full output of the pathway enrichment analysis of COL6A3down DEGs (logFC > |0.5|, adj p < 0.05) according to KEGG, BioPlanet, and WikiPathway databases by ClueGO. The gene members of pathways are colored by direction of change in the COL6A3 DEG gene set, where blue = downregulated and red = upregulated. Node size reflects pathway term adj p value (largest p < 0.0005, middle p = 0.0005–.005, smallest p = 0.005–.05). Network edges connect pathway terms sharing common gene members.
(B) DREAM complex targets G1/S and G2/M cell-cycle genes that comprise distinct subgroups regulated by RB-E2F and MMB-FOXM1 as well as TP53.32 Lists of high-confidence-ranked target gene maps for TP53, DREAM, MMB-FOXM1, and RB-E2F underlying cell-cycle regulation were tested for enrichment against COL6A3down DEGs (adj p < 0.05) with the level of significance (Bonferroni adj p value) indicated in the heatmap. Fold enrichment values of the Fisher’s exact test analysis are reported in the cells of the heatmap. A network showing the subset of the COL6A3down DEGs that are also targets of either DREAM, MMB-FOXM1, RB-E2F, or TP53. Edges connect the genes to their transcription factor, and the gene nodes are colored according to whether they were found up- or down-regulated with COL6A3 knockdown in IMR90 fibroblasts compared to control.
One surprising pathway term not associated with SAM_CT. 28_LIV genes was cell-cycle processes, despite the significant enrichment in COL6A3down DEGs (Figure 5A). Cell-cycle control is a prominent phenotype of senescence cells leading us to hypothesize that COL6A3 may associate with additional senescence phenotypes beyond the SASP. We surmised that COL6A3 could potentially mediate cell-cycle control via autocrine effects within the liver, which our cross-tissue molecular analysis would miss. We therefore surveyed other liver modules for enrichment in COL6A3down DEGs and identified SAM_224. TS_LIV as enriched in genes downregulated by COL6A3 knockdown (Figure S7B). The 224.TS_LIV is also an SAM (SAM_224. TS_LIV), with significant enrichment in genes downregulated in the majority of senescence model DEGs (Figure S7C, Data S3, tabs S19 and S20). Hallmark enrichment analysis of SAM_224. TS_LIV genes and senescence DEGs confirmed cell-cycle regulatory processes such as E2F and myc targets and G2M check-point control (Data S3, tab S20). Interestingly, two regulators of cell-cycle progression, namely MYBL2 and FOXM1 (G2/M), were downregulated with COL6A3 knockdown in IMR90 cells (Figure 5A). These factors work in complex with MuvB, a core complex, which can also exist in a third transcriptional complex consisting of the Rb-like protein p130, E2F4, and DP1 (DP, RB, E2F, and MuvB), called the DREAM complex, which functions to restrict cell-cycle re-entry.32,33 Consistent with our hypothesis, we observed DREAM target genes enriched in SAM_224. TS_LIV (Data S3, tab S21) as well as genes downregulated with COL6A3 knockdown in IMR90 cells as well as in the myofibroblasts (Figure 5B, Data S3, tabs S17a and S21). We also observed a significant enrichment of “cycling cell type” signatures, in particular in immune cells such as scar-associated macrophages and dendritic cells, in SAM_224.TS_LIV genes and COL6A3down DEGs in IMR90 cells (Figure S3B). Together, these data demonstrate that targeted COL6A3 knockdown results in reduced cell-cycle progression, a pro-senescence phenotype, potentially through modulation of DREAM complex.
Replication of STARNET SAMs in other human disease networks
Other aging or chronic inflammatory-related diseases include Alzheimer’s disease (AD),34 inflammatory bowel disease (IBD),35 and the slow-growing pancreatic neuroendocrine insulinoma tumors (PNETs).36 Using co-expression networks generated in either the brain, intestine, or tumor (respectively) tissues from these three human cohort datasets, we evaluated if SAMs identified in the STARNET cohort were enriched in these human datasets. In Figure S8 (and Data S3, tab S22), we demonstrate that many of the SAMs from STARNET were enriched in the three other non-CAD cohort datasets. Specifically, we observed 42 PNET, 46 AD, and 47 IBD modules enriched in various SAMs, of which 36 SAMs were in common, including 224.TS_LIV, 15.CT VAF, and CT.28_LIV. We further demonstrate that the SAM_CT.28_LIV module (identified in livers of STARNET patients) was not only conserved in the brain, intestine, or insulinoma tissues but was also co-enriched in COL6A3down DEGs (Figure S8, Data S3, tab S23), suggesting COL6A3 may be important in modulating co-expression of these genes in tissues beyond the liver.
DISCUSSION
In this study, we show that integration of gene co-expression network modules from CAD patients with gene expression signatures of molecular senescence from experimental cell models can reveal key drivers of senescence processes and further our understanding of the pathobiology of complex aging-related diseases. By using a CT network framework, we could identify potential KDGs of senescence-enriched modules as well as predict which KDGs were potential candidate secreted factors (i.e., SASP molecules) and their suspected targeted tissue and modules of genes. We experimentally validated our approach by showing that reduced COL6A3 expression, one of the KDGs identified for a liver SAM and predicted to be a CT endocrine mediator, induces a senescence molecular phenotype in IMR90 cells. We provide a resource of SAMs and predicted senescence endocrine mediators in multiple human tissue types (liver, skeletal muscle, atherosclerotic and non-atherosclerotic arterial wall, subcutaneous and visceral abdominal fat tissues, blood) for similar exploration by the research community. Many of these SAMs we also replicate as co-expressed in other human aging-related diseased tissue samples, such as brain, intestine, and pancreas from AD, IBD, and PNET patients (respectively), supporting the importance of our identified SAMs beyond their suggested roles in cardio-atherosclerotic and metabolic disease.
We provide 10 experimental senescence cell model transcriptomes and 56 modules of genes co-expressed across several human tissues (SAMs), which we predict are associated with senescence processes in vivo. We provide systematic molecular characterization of the SAM genes according to the (1) annotation of biological processes, (2) association with metabolic disease endpoints, (3) key driver gene status (KDGs-SAMs), and (4) candidacy as secreted factors mediating CT communication (SAM-SASPs). Because we mapped senescence-associated molecular programs using senescence DEGs from five distinct cell types and six modes of senescence induction, our data can be used to explore in vivo senescence signals according to either mode of induction, cell type specificity, or shared elements (Figure 1). For example, we noted that SAM_98.LIV was enriched in senescence DEGs specific to irradiation-induced senescence in IMR90 cells and HUVECs (cholesterol homeostasis processes).37 Interestingly, this module is negatively correlated with lipid levels but positively correlated with HbA1c levels in STARNET patients, and it was recently found important in defining the inverse relationship between lipid and glucose metabolism. This may explain why cholesterol-lowering statins put some individuals at an increased risk of developing type 2 diabetes.37 As deregulation of lipid metabolism can be sufficient to shift cultured cells to senescence,38 finding a link between lipid processes, senescence DEGs, and CAD endpoints in the context of human CAD tissue is a disease-relevant insight. Overall, we propose the use of our data as an additional resource for investigating markers of senescence to detect or modify the formation and persistence of senescent cells in human disease.
Identifying common transcriptional senescence changes, which are independent of the mode of senescence induction, is of considerable value to research efforts aimed at identifying or modifying pan-senescence processes. Our study enables this approach by exploring the modules of co-expressed genes that consistently associate with transcriptomes of senescence DEGs. For example, the CT module 28.CT_LIV was found enriched in all 10 of 10 senescence DEGs, suggesting a “conserved” molecular program underlying senescence. We therefore propose that the biology and KDGs associated with SAMs, like 28.CT, are a source of candidates for mechanisms underlying senescence programs. In support of this hypothesis, we experimentally evaluated in vitro the role of COL6A3 in senescence. Our rationale was supported by the predicted KDG role of COL6A3 in CT.28_LIV and its potential as a SASP factor given its association with several target modules in our cross-tissue co-expression network analysis. In addition, COL6A3 expression was statistically downregulated in 7 of 10 senescence DEGs compared to the generally reported upregulation of SASP factor expression in senescence cells. Importantly, as 28.CT_LIV was also found enriched in genetic loci underlying CAD and correlated with expression of cardiometabolic traits, our data support cellular senescence, and potentially COL6A3, as mechanisms through which CAD genetic susceptibilities may translate into disease phenotypes.
COL6A3 encodes one of the three major polypeptide chains that make up collagen VI, which is found in many tissues as a bridging, anchoring, and signaling molecule. Collagen VI can bind cell surface receptors, such as integrins, and the soluble fragment released from the C-terminal part of the COL6A3 chain, endotrophin, is also bioactive.39 Collagen VI, including its specific COL6A3 isoform, is considered a major marker of tissue fibrosis in part due to its reproducible co-localization with α-SMA (myofibroblast marker encoded by ACTA2) in various human fibrotic tissues, including adipose, liver, and lung.30,39 Expanding on the fibrosis concept, myofibroblasts are the major cell type underlying pathology of all fibrotic conditions. This is in part due to their excessive production of extracellular matrix proteins such as collagens, glycoproteins, and proteoglycans. Importantly, COL6A3 depletion in myofibroblasts has recently been shown to reduce the pro-fibrotic functions of myofibroblasts, including reduced chemoattraction, migration, and contractility.19 Our data-driven association of COL6A3 with SAM_CT.28_LIV is thus aligned with existing knowledge of COL6A3’s pro-fibrotic role.
Association of COL6A3 with fibrotic genes in the CT.28_LIV module combined with the enrichment in senescence DEGs highlights a link between fibrotic processes and senescence. Whether senescent cells display pro- or anti-fibrotic phenotype is another question however. Investigating the contractility, chemoattraction, and migration of SNC cells was beyond the scope of this study; however, we examined the expression of pro-fibrotic genes as a proxy of the fibrotic state of our in vitro senescence models. A general observation was that the expression of ACTA2, COL1A1, or COL1A2 was reduced in senescent cells compared to non-senescent counterparts. While this is consistent with observed decreased expression of COL6A3 (profibrotic SASP factor) in our cell models, we noted that, conversely, the levels of other pro-fibrotic SASP factors (e.g., MMP10, MMP12, and SERPINE1 [encodes PAI-1]) and pro-inflammatory SASP factors (e.g., CCL2 [encodes MCP1]) were generally upregulated. While others have shown that reduction of COL6A3 in myofibroblasts is sufficient to reduce myofibroblasts’ pro-fibrotic functions, whether the secretome of our experimental model senescent cells is anti- or pro-fibrotic likely depends on more than any one factor, especially given the complexity of fibrosis homeostasis, which relies on a balance of proteins mediating collagen synthesis and degradation. Over-all, our analysis connects fibrotic processes regulated by COL6A3 to cellular senescence, since COL6A3 knockdown in IMR90 cells (as well as in myofibroblasts from Williams et al.30) was sufficient to produce transcriptional changes that phenocopied (by DEG and direction of change) nearly all 10 experimental senescence models tested. These observations are consistent with aberrant ECM being linked to senescence phenotype and cellular senescence mediating chronic fibrotic diseases40 such as pulmonary fibrosis.41 While COL6A3 has been previously found as differentially expressed (high-throughput omics assays) in senescent cells,42 to the best of our knowledge, this paper presents extensive characterization of COL6A3 as a driver of senescence-associated molecular programs. Furthermore, since SAM_CT.28_LIV expression negatively correlated with markers of glycemic control (HbA1c), obesity (BMI), dyslipidemia (TG, HDL), and CAD (Syntax score), we posit that the suppression of SAM_CT.28_LIV gene expression, including COL6A3, is pro-disease. Potentially, the beneficial wound healing and tissue repair processes that are pre-fibrotic are prematurely dampened by induction of senescence (Figure 6).
Figure 6. Model of COL6A3 para/autocrine signaling in human liver fibroblast senescence.

We identify COL6A3 as a gene with reduced expression in many of our experimental models of senescence. COL6A3 was predicted to be a key driver gene of 28.CT_LIV, a module enriched in 10/10 senescence DEGs as well as CAD GWAS genes and correlated with metabolic traits. Network analyses predicted liver COL6A3 as an endocrine mediator (SASP factor) targeting co-expression modules in subcutaneous fat and blood. We validated that knockdown of COL6A3 induced transcriptional changes that mimicked a majority of our experimental senescence models. One working hypothesis is that reduced levels of COL6A3 could result in autocrine effects in the liver leading to (1) reduced expression of cell-cycle genes that are targeted by the DREAM complex and (2) altered expression of SASP factors influencing fibrogenesis/fibrinolysis. Paracrine activity of COL6A3 was predicted to differentially modulate immune cell activity, such as IL4 and oncostatin M signaling in the fat and blood depots, which suggests liver COL6A3 (e.g., endotrophin) propagates an immune modulating signal to other tissues. Cell-cycle control, SASP genes, fibrosis, and inflammation are key molecular components that link COL6A3 to a potential role in senescence processes.
While several transcriptional changes observed upon COL6A3 knockdown were concordant with those observed in X-ray irradiation-induced senescence, we noted several SASP factors discordantly affected by COL6A3 knockdown compared to senescent cells. In some instances, such as with the literature-supported SASP genes (and members of SAM_CT.28_LIV), PLAT, PLAU, IGFBP7, and IGFBP5,25,43 the expression was generally upregulated in the senescence DEGs and downregulated with COL6A3 knockdown. Senescent cell secretomes typically include matrix-remodeling proteases, growth factors, and a broad repertoire of cytokines and chemokines, which can contribute to paracrine stimulation of immune surveillance. We, however, did not observe changes in chemokines or cytokines such as IL-6 and IL-1 with COL6A3 knockdown, although they are generally elevated in senescence. Overall, our COL6A3 experimental model showed enrichment of both up- and down-regulated genes in a subset of SASP genes, which contrasts with the general increase in SASP factor genes observed in senescence DEGs. The consequences of this difference remain unexplored; however, it makes COL6A3 an interesting candidate target since its reduced expression phenocopies senescence cell-cycle arrest (see below) and ECM downregulation independently from its effects on pro-inflammatory and pro-fibrotic SASP factor gene expression.
While COL6A3 knockdown in IMR90 fibroblasts may not have induced changes in gene expression of inflammatory SASP factors per se, STARNET liver COL6A3 gene expression correlated with CT modules associated with inflammatory processes. Pathway enrichment analysis of the three modules predicted as paracrine tissue targets of liver COL6A3 implicates COL6A3 as modulating (anti- or pro-) inflammatory processes; a common pathway of all three target modules was IL-4/13 signaling. Other inflammatory pathways, including neutrophil degranulation and IL-10 signaling, were also shared by at least two of three target modules (Figure 6E). Moreover, cell type enrichments of the target modules included scar-associated macrophages and neutrophils, consistent with prior observations44 that these immune cell types are found in proximity to senescent cells in fibrotic livers. Interestingly, IL-4 and IL-13 are known to polarize macrophages of a M2a-like phenotype, which is associated with wound healing and tissue repair.45 Together our data suggest that in the context of senescence, reduced COL6A3 signals from the liver may differentially influence immune cell phenotypes of the adipose and blood depots, which in turn could impact homeostatic functions in those target tissues. The impact on induction/reduction of inflammation in the target tissues remains to be explored.
In our study, knockdown of COL6A3 revealed it to be a potential driver of the cell-cycle arrest-related senescent phenotype, as a significant decrease in expression of cell-cycle genes was observed. Many of the downregulated senescence DEGs that mapped to SAM_224.TS_LIV were consistent with a hallmark senescence process of cell-cycle arrest. A likely connection, in line with conclusions by Krizhanovsky et al.,44 is that cell-cycle arrest of activated HSCs provides a brake on the fibrogenic response to damage, by limiting the expansion of the cell type responsible for producing the fibrotic scar. Although the livers from the STARNET cohort were not studied for fibrosis per se, they likely have a degree of damage and repair processes as part of aging and ongoing metabolic insults, which are captured molecularly in SAMs 224.TS_LIV and 28.CT_LIV. Furthermore, we show that COL6A3 may mediate regulation of cell-cycle progression through downregulation of G2/M checkpoint and G1/S phase transition genes, which are targeted by the DREAM repressor complex.32 Further exploration of how COL6A3 perturbation may intersect with DREAM repressor complex biology will afford insights into pathologies associated with altered DREAM complex function.46–48
Limitations of the study
Limitations of the study include our focus on transcriptional changes over protein levels. As such, we are unable to account for the many steps from gene to protein, especially important for function of SASP factors, including reliance in some cases on exosomes for cellular release. However, with this in mind, we have confirmed that unbiased proteomic surveys of senescence cell models that have been previously reported are consistent with our observations: COL6A3 protein abundance was found downregulated in exosomes secreted by irradiated and RAS-induced senescence fibroblasts (eSASP) compared to controls.49 Furthermore, whether, COL6A3 or other KDGs we identified are the direct cause of the activation of senescence or an indirect downstream effect is uncertain as we did not perform a time series. Finally, we acknowledge the known limitation of WGCNA in that within a tissue the same gene is assigned to a single module, which might obscure additional co-expression patterns. In our study, however, the same gene can be represented up to seven times (once in each of the seven tissues in which a given gene is found to be expressed).
Lastly, in terms of relevance to human disease outside of our discovery STARNET cohort, we explored and observed that SAM_CT.28_LIV gene co-expression was conserved in co-expression networks from three independent datasets and that those were similarly enriched in COL6A3down DEGs, suggesting COL6A3 may also drive the co-expression of these genes in other tissues. Of interest for AD, we observed an enrichment of COL6A3 downregulated genes in human AD modules including Brodmann area 36 parahippocampal gyrus (BM36-PHG) and BM8 superior frontal gyrus (BM8-SFG). Both BM36-PHG and BM8-SFG were top-ranked by relevance to AD pathology using DEGs and trait-associated genes in a previous publication (Figure 5 in Wang et al.50). In addition, BM8-SFG was also a brain region significantly associated with altered expression of AD-associated risk genes (PSEN1, MEF2C, PICALM, and PLD3).50 Together, these findings suggest that biology of COL6A3 KD in 28.CT_LIV SAM-enriched AD modules captures relevant AD pathology and suggests further investigation of collagen VI’s role in AD.
STAR★METHODS
RESOURCE AVAILABILITY
Lead contact
Further information and requests for resources and reagents should be directed to and will be fulfilled by the lead contact, Carmen Argmann (carmen.argmann@mssm.edu).
Materials availability
This study used commercially available materials listed in the paper.
Data and code availability
The RNA-sequencing data generated for this study have been deposited at the Gene expression omnibus (GEO) with the accession number GEO: GSE230181 and GSE230357.
This paper does not report original code.
Any additional information required to reanalyze the data reported in this work paper is available from the lead contact upon request.
EXPERIMENTAL MODEL AND STUDY PARTICIPANT DETAILS
In vitro cell culture
Human lung fibroblasts IMR-90 cells (ATCC, CCL-186) were cultured in DMEM medium (VWR VWRL0101–0500) supplemented with 10% fetal bovine serum (VWR or Gibco (COL6A3 validation experiments)). Human Umbilical Vein Endothelial Cells (HUVEC, Lonza C2519A) were cultured in EGM-2 Bulletkit (Lonza, CC-3162). Human Microvascular Endothelial Cells (HMVEC, Lonza CC-2527) were cultured in EGM-2 MV Bulletkit (Lonza, CC-3202). Renal Proximal Tubule Epithelial Cells (RPTEC, Lonza CC-2553) were cultured in REGM Bulletkit (Lonza, CC-3190). Adipose-derived Stem Cells (ADSC, Lonza PT-5006) were cultured in ADSC Bulletkit (Lonza, PT-4505). All cell culture media included 100 I.U./mL of penicillin streptomycin, and cells were maintained at 37°C in an atmosphere of 5% CO2 and 3% O2 (except were indicated as 20% O2).
METHOD DETAILS
Senescence induction
Senescence was induced by irradiation, chemicals, or transduction with an oncogene. Irradiation was used at 10 Gy (Precision X-ray, X-RAD 320) and chemicals were added at the following concentrations: bleomycin (15 μg/mL, 24 h), oligomycin (16 nM, 7 days), anti-mycin (80 nM, 7 days) and rotenone (100 nM, 14 days). All chemicals were obtained from SelleckChem, or Sigma, dissolved in DMSO, and added to the culture medium. DMSO vehicle control was used at 0.01% v/v. Oncogene induced senescence was done in hTERT immortalized IMR-90 (IMR90) cells with lentiviral particles generated from the pLVX-TetOnePuro (Takara, 634847) with either GFP or RasV12 cloned into the EcoRI/BamHI sites. Cells were grown as described above with addition of 1 μg/mL doxycycline hyclate (Sigma, D9891) and daily media changes over 7 days. Cells were then incubated in media for three days, followed by media change to DMEM supplemented with 0.1% FBS and 10 μg/mL insulin (Thermo, 12585014). Control IMR90 hTERT cells were cultured in absence of puromycin. In all cases, replicates were cultured independently at senescence induction. One or more replicates were used for senescence induction assays. Three replicates were processed for RNA-seq, five replicates were processed for RNA-seq in the case of treatment with bleomycin, oligomycin and antimycin as well as two of the four irradiated IMR90 experiments.
Assays of cellular responses to senescence induction
Proliferating cells were labeled with 10 μM EdU and EdU positive cells were detected using the ClickiT EdU Alexa Fluor 488 imaging kit (Thermo, C10337) according to manufacturer’s instructions. Senescence-associated beta galactosidase was detected using BioVision K320 kit according to manufacturer’s instructions. EdU staining was inspected using Keyence microscope GFP filter, and senescence-associated beta galactosidase using brightfield microscopy. p16 staining was done as follows. Cultured cells were fixed with 4% p-formaldehyde, permeabilized with phosphate buffered saline (PBS) containing 0.2% Triton X-100 (PBST), and blocked with 4% bovine serum albumin in PBS supplemented with 0.1% Tween 20. Cells were incubated with primary p16 anti-body (Roche, clone E6H4) for 2 h at room temperature, washed thrice with PBST, and incubated with secondary Alexa Fluor 647 (Thermo, A32728) antibody for 1 h at room temperature. DAPI containing mounting medium (Vector Laboratories H-1500) was added to cells, and images acquired using Keyence microscope Cy5 filter.
RNA-seq differential gene expression
Cells were washed and directly lysed in Trizol (Thermo, 15596018). Total RNA was processed for library construction by Cofactor Genomics (St. Louis, MO) according to the following procedure. Briefly, total RNA was incubated with mRNA capture beads in order to remove contaminating ribosomal RNA from the sample. The resulting poly(A)-captured mRNA was then fragmented. First-strand cDNA synthesis was performed using reverse transcriptase and random primers in the presence of Actinomycin D, followed by second-strand cDNA synthesis with DNA polymerase I and RNaseH. Double-stranded cDNA was end-repaired and A-tailed for subsequent adaptor ligation. Indexed adaptors were ligated to the A-tailed cDNA. Enrichment by PCR was performed to generate the final cDNA sequencing library. Libraries were sequenced as single-end 75 base pair reads on an Illumina NextSeq500 following the manufacturer’s protocols. Raw reads were aligned to the human reference genome hg38 using TopHat251 and calculated rpkm gene expressions for each replicate using Cufflinks.52 HTSeq54 was used to count the gene features and DESeq253 to call differential genes between non-senescent and senescent samples. A gene was called differentially expressed if its adj p value was <0.05.
Identification of senescence model DEGs
DESeq2 output from comparison of control and treated cells was i) filtered by adj p value to keep <0.05, ii) annotated by gene type and only protein coding genes carried forward, iii) rank ordered by ascending adj p and ENSG with the same gene name, and direction of change, but with lesser adj p kept to remove duplicates, iv) top 1250 upregulated genes (starting with the lowest adj p) and top 1250 downregulated genes (starting with lowest adj p) were merged to create 2500 gene lists (Data S2; Note: HUVEC data resulted in 2499 genes (1249 downregulated)). For each of the IMR90 results (Data S1) following the step iii described in this section, the following steps were done: a) files were bound into a single file, b) matrix with log2FC and gene names created and only those genes with same log2FC direction in at least 3 out of 4 or in all 4 out of 4 IMR90 experiments were kept, and median log2FC value calculated, c) similarly median padj value for resulting genes was calculated using the matrix file of genes that have the same log2FC direction in at least 3 out of 4 or in all 4 out of 4 IMR90 experiments, and median padj value calculated, d) single file with gene names and median log2FC and padj values was created, and steps described in (iv) completed to create a 2500 gene list. For COL6A3down DEGs, the linear modeling output of control shRNA and COL6A3 shRNA comparisons (Data S2, tab COL6A3_KD.2032) was processed as in i-iv to create a list of top 2032 genes (930 downregulated, 1102 upregulated).
SuperExact test60 was used to find the genes in common to 9/10 and 10/10 senescence DEGs. As well, three Venn intersects of the senescence DEGs with same direction of log2 fold change were created to define: 1) CELLS (genes common to irradiated HUVEC, HMVEC, IMR90, RPTEC, ADSC), 2) MODES (genes common to IMR90 cells exposed to X-ray irradiation, anti-mycin, oligomycin, bleomycin, rotenone, and oncogenic RasV12), 3) MITO (genes common to IMR90 cells induced to senescence by oligomycin, anti-mycin, and rotenone). Median log2FC of senescence DEGs was calculated for genes in CELLS, MODES and MITO gene sets (Figure 1C, Data S2).
Jaccard similarity indices were calculated between the individual senescence DEGs defined as top 2500 differentially expressed genes (independent of direction of change); 1 – distance was used to calculate the similarity (note: distance method = “binary”). All heatmaps in the manuscript were plotted using heatmap.2 function of gplots package available in R environment (cran.r-project.org).
Gene set enrichment of senescence DEGs
Enrichment analyses were done using the Fisher’s exact test (FET, unless otherwise stated) with p values adjusted using a Benjamini Hochberg multiple test correction (significant if < 0.05). The SASP geneset used in Figure 1E were sourced from.15 Figure 2A used curated senescence model DEGs from Supplemental data from Hernandez-Segura et al.18 and Saul et al. (19 (also listed in Data S3, tab S5). Through an extensive review of the literature, SenMayo was presented as a ‘senescence gene set’ and is a panel of 125 genes identify representing commonly regulated genes in various age-related datasets in a transcriptome-wide approach that included whole-transcriptome as well as single cell RNA-sequencing. Pathway enrichments in Figure 2B were performed using REACTOME. Gene sets used in Figure S3A are listed in Data S3, tab S7 (rows 99–105). They included: i) Ingenuity Pathway Analysis (IPA) senescence upregulated (SenescUp) or senescence downregulated (SenescDown) gene sets were generated through the use of IPA (QIAGEN Inc., https://www.qiagenbioinformatics.com/products/ingenuity-pathway-analysis57); ii) gene sets from HAGR64 (HumanAgeing DB, CellAge DB), iii) macrophage enriched molecular network genes (MEMN),20,21 and iv) Inflammatome genes.20,21 Where indicated, pathway enrichment analysis was also performed using the ClueGO (v2.5.6) app55 within Cytoscape (v3.7.2)56 environment (KEGG, BioPlanet, Reactome, Wiki and GO biological pathways were sourced from ClueGO; Bonferroni adj p values; default parameters for functional grouping of pathway terms according to shared members).
Integration of senescence model DEGs and human co-expression networks
Cross-tissue networks were generated as described in Koplev et al.14 Briefly, normalized STARNET gene expression data across 7 tissues per patient,13 for a total of 672 patients was used to infer co-expression modules with scale-free properties across tissues. To estimate co-expression network modules, block-wise weighted unsigned gene co-expression network analysis (WGCNA) was used and absolute Pearson’s correlation coefficients calculated within each transcript block. The resulting co-expression modules were considered to be ‘cross-tissue’ (CT) if >5% of the module transcripts were from another tissue than the primary (most prevalent) tissue. If not, the co-expression module was classified as ‘tissue-specific’ (TS). Note each gene per tissue type is only able to belong to a single module. A total of 224 modules including 135 inferred TS and 89 CT co-expression network modules were identified across the seven tissues (Data S3, tab S8).
Using Fisher’s exact test and the 10 senescence DEGs sets we then tested enrichment in the modules, using a Bonferroni adjusted p value <0.01 and fold enrichment > 3-fold, senescence associated modules (SAMs) were defined (Data S3, tab S9, column P). Of note, to test for enrichment of CT modules, we split genes by tissue; for example, CT module 28 was tested as and denoted by 28.CT_LIV (646 genes), 28.CT_VAF (23 genes), 28.CT_SF (7 genes), 28.CT_MAM (3 genes), 28.CT_SKLM (2 genes), and 28.CT_MAM (1 gene). We annotate the identified SAMs using the term “SAM” and the STARNET cooexpression module number and the associated tissue, especially when annotating enriched cross-tissue modules (e.g., SAM_28.CT_LIV instead of 28.CT). When the annotation for tissues is not considered, there are 52 SAMs. These 52 modules were used for key driver gene (KDG) analyses. Briefly, we used Fast Greedy Equivalence Search algorithm (‘sem-bic’ scoring, maxDegree = 100) implemented in the rcausal (Tetrad) R pack-age (developed by the Center for Causal Discovery), and mergeomics R package to perform the key driver analyses of the inferred Bayesian networks65 on each SAM if involving <3,000 transcripts. Mergeomics parameters were kept at default setting (Search depth: 1, Search direction: 0, Maximum overlap: 0.33, Minimum module size: 20, Minimum degree: automatic, Maximum degree: automatic, Edge factor: 0.5, Random seed: 1) with number of permutations set at 10,000. SAM-KDGs were defined with a cut-off of 0.0001 FDR.
The cross-tissue network framework enables deciphering potential secreted factors mediating communication between tissues, as described previously.24 The definition of potential secreted mediators of tissue-tissue communication was based on (i) the gene in CT modules being annotated as ‘secreted’ in UniProt and (ii) the expression of the secreted gene in the ‘origin’ CT module significantly (FDR<0.2, Benjamini-Hochberg) correlating with the ‘target’ TS module eigengene (~790 endocrine CT interactions identified representing ~375 unique genes)). Predicted cross-tissue endocrine mediators that were identified as SAMs were considered potential senescence associated secreted proteins termed SAM-SASP factors.
Clinical trait association of SAMs
Pearson correlations were calculated using the eigengene of the SAMs (as eigengenes) to various STARNET patient clinical phenotypes.13 The clinical traits tested were: BMI (body mass index), HDL (high-density lipoprotein), waist hip ratio, HbA1C (hemoglobin A1C), TG (triglycerides), LDL (low-density lipoprotein), LDL to HDL ratio, plasma cholesterol, SBP (systolic blood pressure), ALAT (alanine aminotransferase), ASAT (aspartate aminotransferase), CRP (C-reactive protein), ndv (number of diseased vessels), Creat (creatinine), lesions (number of), GGT (gamma-glutamyl transferase), PLT (platelet count), Duke,66 SYNTAX score.22 Enrichment of SAMs in HALLMARK (Figure 4B) was done using h.all.v6.2.symbols.gmt. As in annotations of senescence DEGs pathway enrichment analysis, where indicated, was also performed using the ClueGO (v2.5.6) app55 within Cytoscape (v3.7.2)56 environment. Enrichment of SAMs in specific cell types (Figure 6C) was done using PanglaoDB63 (Data S3, tab S15, column AV) and the liver fibrosis cell type selective genes29 (Data S3, tab S16).
Replication of SAMs in independent gene co-expression networks
The gene co-expression modules generated by WGCNA were curated from three publicly available datasets. An Alzheimer’s disease (AD) cohort with expression data from 1053 postmortem brain samples from 19 cortical regions of 125 individuals (Sourced from50 (additional file 1-Table 3). A cohort of 322 treatment-naïve pediatric individuals with inflammatory bowel disease (IBD) where gene expression data was generated from intestinal tissues and used for network generation.35 A cohort of 25 individuals with pancreatic neuroendocrine tumors (PNET) of insulinoma type that had tumor RNA-sequencing performed and a co-expression network generated.36 SAMs identified in the STARNET discovery cohort were tested for enrichment against modules from each of the 3 co-expression networks. SAMs were considered ‘conserved’ in the independent network if it was significantly enriched by FET with a Bonferroni adjusted p value of <0.05, enrichment fold change >3 and if the module in which SAM was enriched had <2000 genes.
Experimental validation of COL6A3
COL6A3 gene expression was depleted by transducing IMR90 cells (incubated at 37°C, 5% CO2, and 20% O2) with COL6A3 shRNA lentiviral particles (Santa Cruz sc-94560-V), and control IMR90 cells with control shRNA lentiviral particles (Santa Cruz sc-108080) according to manufacturer’s instructions with following adaptations: only lentiviral particles (without polybrene) were used, multiplicity of infection was 1, and concentration of puromycin (ThermoFisher A1113803) was 2 mg/mL. Validation of knockdown was confirmed by qPCR. RNA was extracted using the RNeasy Mini Kit (74104, Qiagen) and manufacturer’s instructions and included a genomic DNA digestion step (RNase-free DNase Set 79254, Qiagen). Four hundred ng of RNA was reverse transcribed using the Super script IV Kit (Invitrogen, 180901050). cDNA was diluted up to 1:4 prior to running the qPCR. Primers used for SYBR green I detection (Power SYBR Green PCR Master Mix Applied Biosystems, 4368706) were COL6A3 (Forward: GAAGCAGAACCTCA CGGTCA, Reverse: GTAGCAGACCACAGCCACAT), RPLP0 (Forward: GTGATGCCCAGGGAAGACAA Reverse: CCACATTGTCTGCTCCCACA). qPCR was run using the 7900HT Applied Biosystems Real-Time PCR System (Stage 1: 95°C 2:00 (1 cycle); Stage 2: 95°C 0:20, 55°C 0:15, 72°C 0:10 (40 cycles); Stage 3: dissociation stage). Data were analyzed using SDS 2.2.1 software.
Senescence-associated beta galactosidase was detected using BioVision K320 kit according to manufacturer’s instructions. Cells were visualized under the EVOS XL Core (Objective AMEP4634) microscope and images were captured. Effect of COL6A3 knockdown on cell cycle was assessed by Ki67 staining. Cells were seeded on D-Lysine/Lamimine coated coverslips in DMEM media supplemented with 5% FBS (Gibco 10438–026) and 1X Pen/Strep (Corning 30–002-Cl), each coverslip placed in a single well of a standard cell culture 24 well plate, and cells incubated at 37°C, 5% CO2, and 20% O2. Cells were fixed in 10% formalin, washed thrice with 500 μL PBS, and blocked with NGS blocking buffer (5% Normal Goat Serum, 1% BSA, 0.5% Triton X-100 in PBS) for 1 h. Ki67 primary antibody (Thermo RM 9106–50) was diluted 1:300 with NGS blocking buffer and cells incubated with 200 μL of primary Anti-body for 2 h at room temperature, washed thrice with 200 mL PBS and then incubated for 1 h with secondary antibody (Life Technology A11037 Goat anti rabbit Alexa Fluofor 594) diluted 1:300 by NGS blocking buffer. After washing thrice with 200 μL PBS cells were stained with Hoechst 33342 (Fisher H3570) and washed thrice with 300 λL PBS. Cells were washed with dH2O and each coverslip mounted on a top of a standard microscopy glass slide using 5 μL of Vestashield Mounting Medium for fluorescence (Vector Laboratory Inc H-1000) and images captured. The number of cells expressing Ki67 was quantified using ImageJ software (Analzye Particles function), with ~600 cells counted per condition.
RNA-seq differential gene expression analysis of COL6A3 knock down in IMR90 cells
Total RNA was extracted as above. Illumina TruSeq Stranded mRNA library prep kit was selected to specifically investigate mRNAs. Polyadenylated RNA molecules are enriched by using oligo-dT beads. Strand information is preserved. Standard QC metrics were gathered before and after library prep using ThermoFisher Scientific Qubit Fluorometric Quantification and Agilent 4200 TapeStation system. Sequencing was performed using an Illumina NextSeq instrument to achieve 30 million reads per sample (triplicates) with 100nt paired end reads.
The quality-filtered raw data was then converted into FASTQ files. RNA-seq reads were aligned to the GRCh38 primary assembly with Gencode release annotation by STAR (v2.7.3a). RNA-seq QC metrics were calculated by fastqc (v0.11.8). Quantification was done with featureCounts. Raw count data was pre-filtered to keep genes with CPM>1.0 for at least 30% of the samples. After filtering, count data was normalized via the weighted trimmed mean of M-values,61 where the weights originate from the delta method on the binomial data. Normalized counts were further transformed into normally distributed expression values via the voom-transformation and was the final input for statistical modeling. Statistical analysis was carried out using Limma framework62 in R language version 3.0.3 and its available packages. For pathway enrichment analysis COL6A3down DEGs were defined as logFC > |0.5| and Adj p < 0.05 resulting in 352 up- and 327 down-regulated genes.
Gene set enrichment analyses
Gene set enrichment analyses (GSEA) was performed using GSEA v4.1.0 [build:27]58,59 and the pre-ranked function using as the ranking metric the signed fold change * -log10 p value. The gene sets used included a) Hallmark Pathways (h.all.v7.1.symbols.gmt, available within GSEA); b) the COL6A3down DEGs (queried either as up-regulated only gene sets (1102 genes); down-regulated only gene sets (930 genes) or combined), c) the irradiated IMR90 senescence DEGs (queried as either up-regulated only gene sets (1250 genes), down-regulated only gene sets (1250 genes) or combined) or d) DREAM target genes curated from32 and provided in Data S3, tab S19. The number of permutations used was 1000, and NES values with FWER.p.val <0.05 were considered significant (unless otherwise stated).
QUANTIFICATION AND STATISTICAL ANALYSIS
Statistical details of the experiments can be found in each of the applicable Methods details, figure legends or results, including the number of samples, statistical tests used, correction for multiple comparisons, and p values used to indicate statistical significance. Results outputs are provided in Supplementary tables.
Supplementary Material
KEY RESOURCES TABLE
| REAGENT or RESOURCE | SOURCE | IDENTIFIER |
|---|---|---|
| Antibodies | ||
|
| ||
| Goat anti rabbit Alexa Fluor 594 | Life Technology | Thermo Fisher Scientific Cat# A-11037; RRID:AB_2534095 |
| p16 antibody clone E6H4 | Roche | Roche Cat# 705–4793; RRID:AB_2833232 |
| Ki67 antibody | Thermo | RM 9106–50 |
| Goat anti mouse Alexa Fluor 647 | Thermo | Thermo Fisher Scientific Cat# A32728; RRID:AB_2633277 |
| ClickiT EdU Alexa Fluor 488 imaging kit | Thermo | C10337 |
|
| ||
| Chemicals, peptides, and recombinant proteins | ||
|
| ||
| Penicillin-Streptomycin | Corning | 30–002-Cl |
| Hoechst 33342 | Fisher | H3570 |
| FBS (validation experiments) | Gibco | 10438–026 |
| EGM-2 Bulletkit | Lonza | CC-3162 |
| REGM Bulletkit | Lonza | CC-3190 |
| EGM-2 MV Bulletkit | Lonza | CC-3202 |
| ADSC Bulletkit | Lonza | PT-4505 |
| Power SYBR™ Green PCR Master Mix | Applied Biosystems | 4368706 |
| Control shRNA lentiviral particles | Santa Cruz | sc-108080 |
| COL6A3 shRNA lentiviral particles | Santa Cruz | sc-94560-V |
| Doxycycline hyclate | Sigma | D9891 |
| Insulin | Thermo | 12585014 |
| Trizol | Thermo | 15596018 |
| Puromycin | ThermoFisher | A1113803 |
| DAPI containing mounting medium | Vector Laboratories | H-1500 |
| Vestashield Mounting Medium for fluorescence | Vector Laboratory Inc | H-1000 |
| DMEM medium | VWR | VWRL0101–0500 |
| Bleomycin | SelleckChem | Catalog No.S1214 |
| Oligomycin | SelleckChem | Catalog No.S1214 |
| Rotenone | Sigma | Catalog No.A8674 |
| Antimycin | SelleckChem | Catalog No.S2348 |
|
| ||
| Critical commercial assays | ||
|
| ||
| RNeasy® Mini Kit | Qiagen | 74104 |
| Super script IV Kit | Invitrogen | 180901050 |
| Senescence Detection Kit K320 | BioVision | https://www.biovision.com/products/aging/aging-assay-kits/senescence-detection-kit.html |
| TruSeq Stranded mRNA library prep kit | Illumina | https://www.illumina.com/products/by-type/sequencing-kits/library-prep-kits/truseq-stranded-mrna.html |
| RNase-free DNase Set | Qiagen | 79254 |
|
| ||
| Deposited data | ||
|
| ||
| RNAseq data | GEO | GSE230181 and GSE230357 |
|
| ||
| Experimental models: Cell lines | ||
|
| ||
| Human Adipose-derived Stem Cells (ADSC) | Lonza | PT-5006 |
| Human lung fibroblasts IMR-90 cells (IMR90) | ATCC | Cat# CCL-186; RRID:CVCL_0347 |
| Human Microvascular Endothelial Cells (HMVEC) | Lonza | CC-2527 |
| Human Umbilical Vein Endothelial Cells (HUVEC) | Lonza | C2519A |
| Renal Proximal Tubule Epithelial Cells (RPTEC) | Lonza | CC-2553 |
|
| ||
| Oligonucleotides | ||
|
| ||
| COL6A3 Forward primers GAAGCAGAACCTCACG GTCA |
This paper | N/A |
| COL6A3 Reverse primers GTAGCAGACCACAGCCACAT |
This paper | N/A |
| RPLP0 Forward primers: GTGATGCCCAGGGAAGACAA |
This paper | N/A |
| RPLP0 Reverse primers: CCACATTGTCTGCTCCCACA |
This paper | N/A |
|
| ||
| Software and algorithms | ||
|
| ||
| TopHat2 | Kim et al.51 | TopHat (RRID:SCR_013035); http://ccb.jhu.edu/software/tophat |
| Cufflinks | Trapnell et al.52 | Cufflinks (RRID:SCR_014597); https://github.com/cole-trapnell-lab/cufflinks |
| DESeq2 | Love et al.53 | DESeq2 (RRID:SCR_015687); http://www.bioconductor.org/packages/release/bioc/html/DESeq2.html |
| HTSeq | Anders et al.54 | https://pypi.python.org/pypi/HTSeq |
| SDS 2.2.1 software | Applied Biosystems | N/A |
| STAR RNA-seq aligner v2.7.3a | GitHub | https://github.com/alexdobin/STAR/releases?page=3 |
| UpSet plot | https://upset.app/ | UpSet (RRID:SCR_022731); https://www.rdocumentation.org/packages/UpSetR/versions/1.4.0 |
| Reactome | Reactome | Reactome (RRID:SCR_003485); https://reactome.org/ |
| ClueGO (v2.5.6) | Cytoscape App Store,55 | https://apps.cytoscape.org/apps/cluego |
| Cytoscape (v3.7.2) | Cytoscape, Shannon et al.56 | Cytoscape (RRID:SCR_003032); https://cytoscape.org/ |
| Ingenuity Pathways Analysis | Qiagen, Kramer et al.57 | Ingenuity Pathway Analysis (RRID:SCR_008653); https://digitalinsights.qiagen.com/product-login/ |
| ImageJ | NIH | ImageJ (RRID:SCR_003070); https://imagej.nih.gov/ij/ |
| GSEA v4.1.0 [build:27] | GSEA-MSigDB; Subramanian et al., and Mootha et al.58,59 | Gene Set Enrichment Analysis (RRID:SCR_003199); https://www.gsea-msigdb.org/gsea/index.jsp |
| SuperExactTest | Wang et al.60 | https://cran.r-project.org/web/packages/SuperExactTest/index.html |
| All heatmaps in the manuscript were plotted using heatmap.2 function of gplots package available in R environment | R package documentation | https://rdrr.io/cran/gplots/src/R/heatmap.2.R |
| Fast Greedy Equivalence Search algorithm | Center for Causal Discovery | rcausal (Tetrad https://www.ccd.pitt.edu/tools/) R package https://rdrr.io/github/bd2kccd/r-causal/ |
| Mergeomics R package | http://mergeomics.research.idre.ucla.edu/ | https://rdrr.io/github/zeynebkurtUCLA/Mergeomics/ |
| RNA-seq QC metrics were calculated by FastQC v0.11.8 | Babraham Bioinformatics, GitHub | FastQC (RRID:SCR_014583); https://www.bioinformatics.babraham.ac.uk/projects/fastqc/, https://github.com/s-andrews/FastQC/releases |
| Weighted trimmed mean of M-values | Robinson et al.61 | N/A |
| Limma framework | Ritchie et al.62 | LIMMA (RRID:SCR_010943) |
|
| ||
| Other | ||
|
| ||
| Precision X-ray | X-RAD 320 instrument | https://precisionxray.com/system/x-rad320/ |
| Enrichment of SAMs in HALLMARK genes (for enrichment of SAMs) | https://www.gsea-msigdb.org/gsea/msigdb/collections.jsp | h.all.v6.2.symbols.gmt |
| PanglaoDB Cell type gene expression markers | Franzen et al.63 and Data S3, tab S15, column AV | PanglaoDB (RRID:SCR_022580); https://panglaodb.se/markers.html?cell_type=%27choose%27 |
| The liver fibrosis cell type selective genes | Ramachandran et al.29 and Data S3, tab S16 | N/A |
| Alzheimer’s disease (AD) cohort | Wang et al.50 | Data S3, tab S12 |
| Inflammatory bowel disease (IBD) cohort | Peters et al.35 | N/A |
| Pancreatic neuroendocrine tumors (PNET) cohort | Wang et al.36 | NA |
| Wiki Pathways | WikiPathways | WikiPathways (RRID:SCR_002134); https://www.wikipathways.org// |
| CellAge | CellAge: The Database of Cell Senescence Genes, HAGR; Tacutu et al.64 | Human Aging Genomic Resources (RRID:SCR_007700); https://genomics.senescence.info/cells/ |
| Human Aging | Digital Aging Atlas, HAGR; Tacutu et al.64 | Human Aging Genomic Resources (RRID:SCR_007700); https://ageing-map.org/ |
| KEGG, BioPlanet, and GO biological Pathway databases by ClueGO (v2.5.6) | Cytoscape App Store | https://apps.cytoscape.org/apps/cluego |
| DREAM target genes | Curated from Fischer et al.32 | Data S3, tab S19 |
Highlights.
Senescent cell transcriptomic signatures from 10 controlled experimental settings
A resource of 56 human senescence-associated gene modules and 86 candidate SASP factors
Identification and validation of COL6A3 as associated with senescence phenotype
ACKNOWLEDGMENTS
Study funding is from the Icahn Institute for Data Science and Genomic Technology and UNITY Biotechnology. The following research grants are acknowledged by the individual researchers: (1) NIH R-01DK116873 (C.A., R.S., and A.F.S.); (2) The Leona M. and Harry B. Helmsley Charitable Trust and RC2 DK122532/DK/NIDDK NIH (C.A. and E.E.S.); (3) NIH R01HL125863, American Heart Association (A14SFRN20840000), the Swedish Research Council (2018-02529), the Heart Lung Foundation (20170265) (J.L.M.B.); (4) Foundation Leducq (PlaqueOmics: Novel Roles of Smooth Muscle and Other Matrix Producing Cells in Atherosclerotic Plaque Stability and Rupture, 18CVD02) (J.L.M.B. and C.A.); and (5) NIH R01HL130423, R01HL135093, and R01HL148167-01A1 and New South Wales health grant RG194194 (J.C.K.). We thank Nathan Gushwa, Rathi Ryan, and Stephanie Lussier at UNITY Biotechnology and staff of Genomics Technology Facility at the Icahn Institute for their technical and scientific support.
INCLUSION AND DIVERSITY
We support inclusive, diverse, and equitable conduct of research.
Footnotes
SUPPLEMENTAL INFORMATION
Supplemental information can be found online at https://doi.org/10.1016/j.celrep.2023.113371.
DECLARATION OF INTERESTS
At the time of this work, C.B.Y., R.-M.L., M.C.A., P.L.P., R.N.O., and B.N.D. were employees of UNITY Biotechnology. J.L.M.B. and A.R. are shareholders and board members of Clinical Gene Networks AB (CGN). CGN has an invested interest in STARNET but no claims to results presented in this study. R.S. and E.E.S. at the time of this work were also employees of Sema4.
REFERENCES
- 1.Sapieha P, and Mallette FA (2018). Cellular Senescence in Postmitotic Cells: Beyond Growth Arrest. Trends Cell Biol. 28, 595–607. 10.1016/j.tcb.2018.03.003. [DOI] [PubMed] [Google Scholar]
- 2.Hernandez-Segura A, Nehme J, and Demaria M. (2018). Hallmarks of Cellular Senescence. Trends Cell Biol. 28, 436–453. 10.1016/j.tcb.2018.02.001. [DOI] [PubMed] [Google Scholar]
- 3.Childs BG, Durik M, Baker DJ, and van Deursen JM (2015). Cellular senescence in aging and age-related disease: from mechanisms to therapy. Nat. Med. 21, 1424–1435. 10.1038/nm.4000. [DOI] [PMC free article] [PubMed] [Google Scholar]
- 4.Chaib S, Tchkonia T, and Kirkland JL (2022). Cellular senescence and senolytics: the path to the clinic. Nat. Med. 28, 1556–1568. 10.1038/s41591-022-01923-y. [DOI] [PMC free article] [PubMed] [Google Scholar]
- 5.Evangelou K, Vasileiou PVS, Papaspyropoulos A, Hazapis O, Petty R, Demaria M, and Gorgoulis VG (2023). Cellular senescence and cardiovascular diseases: moving to the “heart” of the problem. Physiol. Rev. 103, 609–647. 10.1152/physrev.00007.2022. [DOI] [PubMed] [Google Scholar]
- 6.Anderson R, Lagnado A, Maggiorani D, Walaszczyk A, Dookun E, Chapman J, Birch J, Salmonowicz H, Ogrodnik M, Jurk D, et al. (2019). Length-independent telomere damage drives post-mitotic cardiomyocyte senescence. EMBO J. 38, e100492. 10.15252/embj.2018100492. [DOI] [PMC free article] [PubMed] [Google Scholar]
- 7.Baker DJ, Wijshake T, Tchkonia T, LeBrasseur NK, Childs BG, van de Sluis B, Kirkland JL, and van Deursen JM (2011). Clearance of p16Ink4a-positive senescent cells delays ageing-associated disorders. Nature 479, 232–236. 10.1038/nature10600. [DOI] [PMC free article] [PubMed] [Google Scholar]
- 8.Childs BG, Baker DJ, Wijshake T, Conover CA, Campisi J, and van Deursen JM (2016). Senescent intimal foam cells are deleterious at all stages of atherosclerosis. Science (New York, N.Y.) 354, 472–477. 10.1126/science.aaf6659. [DOI] [PMC free article] [PubMed] [Google Scholar]
- 9.Lewis-McDougall FC, Ruchaya PJ, Domenjo-Vila E, Shin Teoh T, Prata L, Cottle BJ, Clark JE, Punjabi PP, Awad W, Torella D, et al. (2019). Aged-senescent cells contribute to impaired heart regeneration. Aging Cell 18, e12931. 10.1111/acel.12931. [DOI] [PMC free article] [PubMed] [Google Scholar]
- 10.Wiley CD, and Campisi J. (2021). The metabolic roots of senescence: mechanisms and opportunities for intervention. Nat. Metab. 3, 1290–1301. 10.1038/s42255-021-00483-8. [DOI] [PMC free article] [PubMed] [Google Scholar]
- 11.He S, and Sharpless NE (2017). Senescence in Health and Disease. Cell 169, 1000–1011. 10.1016/j.cell.2017.05.015. [DOI] [PMC free article] [PubMed] [Google Scholar]
- 12.Noren Hooten N, and Evans MK (2017). Techniques to Induce and Quantify Cellular Senescence. J. Vis. Exp, 55533. 10.3791/55533. [DOI] [PMC free article] [PubMed] [Google Scholar]
- 13.Franzén O, Ermel R, Cohain A, Akers NK, Di Narzo A, Talukdar HA, Foroughi-Asl H, Giambartolomei C, Fullard JF, Sukhavasi K, et al. (2016). Cardiometabolic risk loci share downstream cis- and transgene regulation across tissues and diseases. Science (New York, N.Y.) 353, 827–830. 10.1126/science.aad6970. [DOI] [PMC free article] [PubMed] [Google Scholar]
- 14.Koplev S, Seldin M, Sukhavasi K, Ermel R, Pang S, Zeng L, Bankier S, Di Narzo A, Cheng H, Meda V, et al. (2022). A mechanistic framework for cardiometabolic and coronary artery diseases. Nat. Cardiovasc. Res. 1, 85–100. 10.1038/s44161-021-00009-1. [DOI] [PMC free article] [PubMed] [Google Scholar]
- 15.Freund A, Orjalo AV, Desprez PY, and Campisi J. (2010). Inflammatory networks during cellular senescence: causes and consequences. Trends Mol. Med. 16, 238–246. 10.1016/j.molmed.2010.03.003. [DOI] [PMC free article] [PubMed] [Google Scholar]
- 16.Kletsas D, Pratsinis H, Mariatos G, Zacharatos P, and Gorgoulis VG (2004). The proinflammatory phenotype of senescent cells: the p53-mediated ICAM-1 expression. Ann. N. Y. Acad. Sci. 1019, 330–332. 10.1196/annals.1297.056. [DOI] [PubMed] [Google Scholar]
- 17.Wiley CD, Flynn JM, Morrissey C, Lebofsky R, Shuga J, Dong X, Unger MA, Vijg J, Melov S, and Campisi J. (2017). Analysis of individual cells identifies cell-to-cell variability following induction of cellular senescence. Aging Cell 16, 1043–1050. 10.1111/acel.12632. [DOI] [PMC free article] [PubMed] [Google Scholar]
- 18.Hernandez-Segura A, de Jong TV, Melov S, Guryev V, Campisi J, and Demaria M. (2017). Unmasking Transcriptional Heterogeneity in Senescent Cells. Curr. Biol. 27, 2652–2660.e4. 10.1016/j.cub.2017.07.033. [DOI] [PMC free article] [PubMed] [Google Scholar]
- 19.Saul D, Kosinsky RL, Atkinson EJ, Doolittle ML, Zhang X, LeBrasseur NK, Pignolo RJ, Robbins PD, Niedernhofer LJ, Ikeno Y, et al. (2022). A new gene set identifies senescent cells and predicts senescence-associated pathways across tissues. Nat. Commun. 13, 4827. 10.1038/s41467-022-32552-1. [DOI] [PMC free article] [PubMed] [Google Scholar]
- 20.Chen Y, Zhu J, Lum PY, Yang X, Pinto S, MacNeil DJ, Zhang C, Lamb J, Edwards S, Sieberts SK, et al. (2008). Variations in DNA elucidate molecular networks that cause disease. Nature 452, 429–435. 10.1038/nature06757. [DOI] [PMC free article] [PubMed] [Google Scholar]
- 21.Wang I-M, Zhang B, Yang X, Zhu J, Stepaniants S, Zhang C, Meng Q, Peters M, He Y, Ni C, et al. (2012). Systems analysis of eleven rodent disease models reveals an inflammatome signature and key drivers. Mol. Syst. Biol. 8, 594. 10.1038/msb.2012.24. [DOI] [PMC free article] [PubMed] [Google Scholar]
- 22.Takahashi K, Serruys PW, Fuster V, Farkouh ME, Spertus JA, Cohen DJ, Park SJ, Park DW, Ahn JM, Kappetein AP, et al. (2020). Redevelopment and validation of the SYNTAX score II to individualise decision making between percutaneous and surgical revascularisation in patients with complex coronary artery disease: secondary analysis of the multicentre randomised controlled SYNTAXES trial with external cohort validation. Lancet 396, 1399–1412. 10.1016/S0140-6736(20)32114-0. [DOI] [PubMed] [Google Scholar]
- 23.Shadrina AS, Shashkova TI, Torgasheva AA, Sharapov SZ, Klarić L, Pakhomov ED, Alexeev DG, Wilson JF, Tsepilov YA, Joshi PK, and Aulchenko YS (2020). Prioritization of causal genes for coronary artery disease based on cumulative evidence from experimental and in silico studies. Sci. Rep. 10, 10486. 10.1038/s41598-020-67001-w. [DOI] [PMC free article] [PubMed] [Google Scholar]
- 24.Seldin MM, Koplev S, Rajbhandari P, Vergnes L, Rosenberg GM, Meng Y, Pan C, Phuong TMN, Gharakhanian R, Che N, et al. (2018). A Strategy for Discovery of Endocrine Interactions with Application to Whole-Body Metabolism. Cell Metab. 27, 1138–1155.e6. 10.1016/j.cmet.2018.03.015. [DOI] [PMC free article] [PubMed] [Google Scholar]
- 25.Coppé JP, Desprez PY, Krtolica A, and Campisi J. (2010). The senescence-associated secretory phenotype: the dark side of tumor suppression. Annu. Rev. Pathol. 5, 99–118. 10.1146/annurev-pathol-121808-102144. [DOI] [PMC free article] [PubMed] [Google Scholar]
- 26.Acosta JC, Banito A, Wuestefeld T, Georgilis A, Janich P, Morton JP, Athineos D, Kang TW, Lasitschka F, Andrulis M, et al. (2013). A complex secretory program orchestrated by the inflammasome controls paracrine senescence. Nat. Cell Biol. 15, 978–990. 10.1038/ncb2784. [DOI] [PMC free article] [PubMed] [Google Scholar]
- 27.Macke EL, Henningsen E, Jessen E, Zumwalde NA, Landowski M, Western DE, Lee WH, Liu C, Gruenke NP, Doebley AL, et al. (2020). Loss of Chondroitin Sulfate Modification Causes Inflammation and Neurodegeneration in skt Mice. Genetics 214, 121–134. 10.1534/genetics.119.302834. [DOI] [PMC free article] [PubMed] [Google Scholar]
- 28.Sun K, Park J, Gupta OT, Holland WL, Auerbach P, Zhang N, Goncalves Marangoni R, Nicoloro SM, Czech MP, Varga J, et al. (2014). Endotrophin triggers adipose tissue fibrosis and metabolic dysfunction. Nat. Commun. 5, 3485. 10.1038/ncomms4485. [DOI] [PMC free article] [PubMed] [Google Scholar]
- 29.Ramachandran P, Dobie R, Wilson-Kanamori JR, Dora EF, Henderson BEP, Luu NT, Portman JR, Matchett KP, Brice M, Marwick JA, et al. (2019). Resolving the fibrotic niche of human liver cirrhosis at single-cell level. Nature 575, 512–518. 10.1038/s41586-019-1631-3. [DOI] [PMC free article] [PubMed] [Google Scholar]
- 30.Williams LM, McCann FE, Cabrita MA, Layton T, Cribbs A, Knezevic B, Fang H, Knight J, Zhang M, Fischer R, et al. (2020). Identifying collagen VI as a target of fibrotic diseases regulated by CREBBP/EP300. Proc. Natl. Acad. Sci. USA 117, 20753–20763. 10.1073/pnas.2004281117. [DOI] [PMC free article] [PubMed] [Google Scholar]
- 31.Nguyen JK, Austin E, Huang A, Mamalis A, and Jagdeo J. (2020). The IL-4/IL-13 axis in skin fibrosis and scarring: mechanistic concepts and therapeutic targets. Arch. Dermatol. Res. 312, 81–92. 10.1007/s00403-019-01972-3. [DOI] [PMC free article] [PubMed] [Google Scholar]
- 32.Fischer M, Grossmann P, Padi M, and DeCaprio JA (2016). Integration of TP53, DREAM, MMB-FOXM1 and RB-E2F target gene analyses identifies cell cycle gene regulatory networks. Nucleic Acids Res. 44, 6070–6086. 10.1093/nar/gkw523. [DOI] [PMC free article] [PubMed] [Google Scholar]
- 33.Sadasivam S, Duan S, and DeCaprio JA (2012). The MuvB complex sequentially recruits B-Myb and FoxM1 to promote mitotic gene expression. Genes Dev. 26, 474–489. 10.1101/gad.181933.111. [DOI] [PMC free article] [PubMed] [Google Scholar]
- 34.Zhang B, Gaiteri C, Bodea LG, Wang Z, McElwee J, Podtelezhnikov AA, Zhang C, Xie T, Tran L, Dobrin R, et al. (2013). Integrated systems approach identifies genetic nodes and networks in late-onset Alzheimer’s disease. Cell 153, 707–720. 10.1016/j.cell.2013.03.030. [DOI] [PMC free article] [PubMed] [Google Scholar]
- 35.Peters LA, Perrigoue J, Mortha A, Iuga A, Song WM, Neiman EM, Llewellyn SR, Di Narzo A, Kidd BA, Telesco SE, et al. (2017). A functional genomics predictive network model identifies regulators of inflammatory bowel disease. Nat. Genet. 49, 1437–1449. 10.1038/ng.3947. [DOI] [PMC free article] [PubMed] [Google Scholar]
- 36.Wang H, Bender A, Wang P, Karakose E, Inabnet WB, Libutti SK, Arnold A, Lambertini L, Stang M, Chen H, et al. (2017). Insights into beta cell regeneration for diabetes via integration of molecular landscapes in human insulinomas. Nat. Commun. 8, 767. 10.1038/s41467-017-00992-9. [DOI] [PMC free article] [PubMed] [Google Scholar]
- 37.Cohain AT, Barrington WT, Jordan DM, Beckmann ND, Argmann CA, Houten SM, Charney AW, Ermel R, Sukhavasi K, Franzen O, et al. (2021). An integrative multiomic network model links lipid metabolism to glucose regulation in coronary artery disease. Nat. Commun. 12, 547. 10.1038/s41467-020-20750-8. [DOI] [PMC free article] [PubMed] [Google Scholar]
- 38.Flor AC, Wolfgeher D, Wu D, and Kron SJ (2017). A signature of enhanced lipid metabolism, lipid peroxidation and aldehyde stress in therapy-induced senescence. Cell Death Discov. 3, 17075. 10.1038/cddiscovery.2017.75. [DOI] [PMC free article] [PubMed] [Google Scholar]
- 39.Lee C, Kim M, Lee JH, Oh J, Shin HH, Lee SM, Scherer PE, Kwon HM, Choi JH, and Park J. (2019). COL6A3-derived endotrophin links reciprocal interactions among hepatic cells in the pathology of chronic liver disease. J. Pathol. 247, 99–109. 10.1002/path.5172. [DOI] [PubMed] [Google Scholar]
- 40.Blokland KEC, Pouwels SD, Schuliga M, Knight DA, and Burgess JK (2020). Regulation of cellular senescence by extracellular matrix during chronic fibrotic diseases. Clin. Sci. 134, 2681–2706. 10.1042/CS20190893. [DOI] [PMC free article] [PubMed] [Google Scholar]
- 41.Schafer MJ, White TA, Iijima K, Haak AJ, Ligresti G, Atkinson EJ, Oberg AL, Birch J, Salmonowicz H, Zhu Y, et al. (2017). Cellular senescence mediates fibrotic pulmonary disease. Nat. Commun. 8, 14532. 10.1038/ncomms14532. [DOI] [PMC free article] [PubMed] [Google Scholar]
- 42.Severino V, Alessio N, Farina A, Sandomenico A, Cipollaro M, Peluso G, Galderisi U, and Chambery A. (2013). Insulin-like growth factor binding proteins 4 and 7 released by senescent cells promote premature senescence in mesenchymal stem cells. Cell Death Dis. 4, e911. 10.1038/cddis.2013.445. [DOI] [PMC free article] [PubMed] [Google Scholar]
- 43.Kang L-I, Isse K, Koral K, Bowen WC, Muratoglu S, Strickland DK, Michalopoulos GK, and Mars WM (2015). Tissue-type plasminogen activator suppresses activated stellate cells through low-density lipoprotein receptor-related protein 1. Lab. Invest. 95, 1117–1129. 10.1038/labinvest.2015.94. [DOI] [PMC free article] [PubMed] [Google Scholar]
- 44.Krizhanovsky V, Yon M, Dickins RA, Hearn S, Simon J, Miething C, Yee H, Zender L, and Lowe SW (2008). Senescence of activated stellate cells limits liver fibrosis. Cell 134, 657–667. 10.1016/j.cell.2008.06.049. [DOI] [PMC free article] [PubMed] [Google Scholar]
- 45.Novak ML, and Koh TJ (2013). Macrophage phenotypes during tissue repair. J. Leukoc. Biol. 93, 875–881. 10.1189/jlb.1012512. [DOI] [PMC free article] [PubMed] [Google Scholar]
- 46.Perampalam P, Hassan HM, Lilly GE, Passos DT, Torchia J, Kiser PK, Bozovic A, Kulasingam V, and Dick FA (2021). Disrupting the DREAM transcriptional repressor complex induces apolipoprotein overexpression and systemic amyloidosis in mice. J. Clin. Invest. 131, e140903. 10.1172/JCI140903. [DOI] [PMC free article] [PubMed] [Google Scholar]
- 47.Forristal C, Henley SA, MacDonald JI, Bush JR, Ort C, Passos DT, Talluri S, Ishak CA, Thwaites MJ, Norley CJ, et al. (2014). Loss of the mammalian DREAM complex deregulates chondrocyte proliferation. Mol. Cell Biol. 34, 2221–2234. 10.1128/MCB.01523-13. [DOI] [PMC free article] [PubMed] [Google Scholar]
- 48.Sadasivam S, and DeCaprio JA (2013). The DREAM complex: master coordinator of cell cycle-dependent gene expression. Nat. Rev. Cancer 13, 585–595. 10.1038/nrc3556. [DOI] [PMC free article] [PubMed] [Google Scholar]
- 49.Basisty N, Kale A, Jeon OH, Kuehnemann C, Payne T, Rao C, Holtz A, Shah S, Sharma V, Ferrucci L, et al. (2020). A proteomic atlas of senescence-associated secretomes for aging biomarker development. PLoS Biol. 18, e3000599. 10.1371/journal.pbio.3000599. [DOI] [PMC free article] [PubMed] [Google Scholar]
- 50.Wang M, Roussos P, McKenzie A, Zhou X, Kajiwara Y, Brennand KJ, De Luca GC, Crary JF, Casaccia P, Buxbaum JD, et al. (2016). Integrative network analysis of nineteen brain regions identifies molecular signatures and networks underlying selective regional vulnerability to Alzheimer’s disease. Genome Med. 8, 104. 10.1186/s13073-016-0355-3. [DOI] [PMC free article] [PubMed] [Google Scholar]
- 51.Kim D, Pertea G, Trapnell C, Pimentel H, Kelley R, and Salzberg SL (2013). TopHat2: accurate alignment of transcriptomes in the presence of insertions, deletions and gene fusions. Genome Biol. 14, R36. 10.1186/gb-2013-14-4-r36. [DOI] [PMC free article] [PubMed] [Google Scholar]
- 52.Trapnell C, Roberts A, Goff L, Pertea G, Kim D, Kelley DR, Pimentel H, Salzberg SL, Rinn JL, and Pachter L. (2012). Differential gene and transcript expression analysis of RNA-seq experiments with TopHat and Cufflinks. Nat. Protoc. 7, 562–578. 10.1038/nprot.2012.016. [DOI] [PMC free article] [PubMed] [Google Scholar]
- 53.Love MI, Huber W, and Anders S. (2014). Moderated estimation of fold change and dispersion for RNA-seq data with DESeq2. Genome Biol. 15, 550. 10.1186/s13059-014-0550-8. [DOI] [PMC free article] [PubMed] [Google Scholar]
- 54.Anders S, Pyl PT, and Huber W. (2015). HTSeq–a Python framework to work with high-throughput sequencing data. Bioinformatics 31, 166–169. 10.1093/bioinformatics/btu638. [DOI] [PMC free article] [PubMed] [Google Scholar]
- 55.Bindea G, Mlecnik B, Hackl H, Charoentong P, Tosolini M, Kirilovsky A, Fridman WH, Pagès F, Trajanoski Z, and Galon J. (2009). ClueGO: a Cytoscape plug-in to decipher functionally grouped gene ontology and pathway annotation networks. Bioinformatics 25, 1091–1093. 10.1093/bioinformatics/btp101. [DOI] [PMC free article] [PubMed] [Google Scholar]
- 56.Shannon P, Markiel A, Ozier O, Baliga NS, Wang JT, Ramage D, Amin N, Schwikowski B, and Ideker T. (2003). Cytoscape: a software environment for integrated models of biomolecular interaction networks. Genome Res. 13, 2498–2504. 10.1101/gr.1239303. [DOI] [PMC free article] [PubMed] [Google Scholar]
- 57.Krämer A, Green J, Pollard J Jr., and Tugendreich S. (2014). Causal analysis approaches in Ingenuity Pathway Analysis. Bioinformatics 30, 523–530. 10.1093/bioinformatics/btt703. [DOI] [PMC free article] [PubMed] [Google Scholar]
- 58.Subramanian A, Tamayo P, Mootha VK, Mukherjee S, Ebert BL, Gillette MA, Paulovich A, Pomeroy SL, Golub TR, Lander ES, and Mesirov JP (2005). Gene set enrichment analysis: A knowledge-based approach for interpreting genome-wide expression profiles. Proc. Natl. Acad. Sci. USA 102, 15545–15550. 10.1073/pnas.0506580102. [DOI] [PMC free article] [PubMed] [Google Scholar]
- 59.Mootha VK, Lindgren CM, Eriksson K-F, Subramanian A, Sihag S, Lehar J, Puigserver P, Carlsson E, Ridderstråle M, Laurila E, et al. (2003). PGC-1α-responsive genes involved in oxidative phosphorylation are coordinately downregulated in human diabetes. Nat. Genet. 34, 267–273. 10.1038/ng1180. [DOI] [PubMed] [Google Scholar]
- 60.Wang M, Zhao Y, and Zhang B. (2015). Efficient Test and Visualization of Multi-Set Intersections. Sci. Rep. 5, 16923. 10.1038/srep16923. [DOI] [PMC free article] [PubMed] [Google Scholar]
- 61.Robinson MD, and Oshlack A. (2010). A scaling normalization method for differential expression analysis of RNA-seq data. Genome Biol. 11, R25. 10.1186/gb-2010-11-3-r25. [DOI] [PMC free article] [PubMed] [Google Scholar]
- 62.Ritchie ME, Phipson B, Wu D, Hu Y, Law CW, Shi W, and Smyth GK (2015). limma powers differential expression analyses for RNA-sequencing and microarray studies. Nucleic Acids Res. 43, e47. 10.1093/nar/gkv007. [DOI] [PMC free article] [PubMed] [Google Scholar]
- 63.Franzen O, Gan LM, and Bjorkegren JLM (2019). PanglaoDB: a web server for exploration of mouse and human single-cell RNA sequencing data. Database 2019, baz046. 10.1093/database/baz046. [DOI] [PMC free article] [PubMed] [Google Scholar]
- 64.Tacutu R, Thornton D, Johnson E, Budovsky A, Barardo D, Craig T, Diana E, Lehmann G, Toren D, Wang J, et al. (2018). Human Ageing Genomic Resources: new and updated databases. Nucleic Acids Res. 46, D1083–D1090. 10.1093/nar/gkx1042. [DOI] [PMC free article] [PubMed] [Google Scholar]
- 65.Jones PD, Kaiser MA, Ghaderi Najafabadi M, Koplev S, Zhao Y, Douglas G, Kyriakou T, Andrews S, Rajmohan R, Watkins H, et al. (2018). JCAD, a Gene at the 10p11 Coronary Artery Disease Locus, Regulates Hippo Signaling in Endothelial Cells. Arterioscler. Thromb. Vasc. Biol. 38, 1711–1722. 10.1161/ATVBAHA.118.310976. [DOI] [PMC free article] [PubMed] [Google Scholar]
- 66.Mark DB, Nelson CL, Califf RM, Harrell FE Jr., Lee KL, Jones RH, Fortin DF, Stack RS, Glower DD, Smith LR, et al. (1994). Continuing evolution of therapy for coronary artery disease. Initial results from the era of coronary angioplasty. Circulation 89, 2015–2025. 10.1161/01.cir.89.5.2015. [DOI] [PubMed] [Google Scholar]
Associated Data
This section collects any data citations, data availability statements, or supplementary materials included in this article.
Supplementary Materials
Data Availability Statement
The RNA-sequencing data generated for this study have been deposited at the Gene expression omnibus (GEO) with the accession number GEO: GSE230181 and GSE230357.
This paper does not report original code.
Any additional information required to reanalyze the data reported in this work paper is available from the lead contact upon request.