Abstract
In pancreatic ductal adenocarcinoma (PDAC), glutamine is a critical nutrient that drives a wide array of metabolic and biosynthetic processes that support tumor growth. Here, we elucidate how 6-diazo-5-oxo-L-norleucine (DON), a glutamine antagonist that broadly inhibits glutamine metabolism, blocks PDAC tumor growth and metastasis. We find that DON significantly reduces asparagine production by inhibiting asparagine synthetase (ASNS), and that the effects of DON are rescued by asparagine. As a metabolic adaptation, PDAC cells upregulate ASNS expression in response to DON, and we determine that ASNS levels inversely correlate with DON efficacy. We identify that L-asparaginase (ASNase) synergizes with DON to impact the viability of PDAC cells, and that DON and ASNase combination therapy has a significant impact on metastasis. These results shed light on the mechanisms that drive the effects of glutamine mimicry and point to the utility of co-targeting adaptive responses to control PDAC progression.
Glutamine is a vital nutrient in pancreatic ductal adenocarcinoma (PDAC) as it supports the metabolic and biosynthetic reactions necessary to sustain tumor cell growth. In a process known as glutaminolysis, tumor cells rely on the conversion of glutamine to glutamate, catalyzed by glutaminase (GLS), to replenish TCA cycle intermediates. PDAC cells also require glutaminolysis to drive increases in the NADPH/NADP+ ratio that maintain the cellular redox state1,2. Glutamine is critical to the biosynthesis of lipids, nucleotides, and proteins, and can serve as a nitrogen and/or carbon source for the biosynthesis of other amino acids, including asparagine, glutamate, proline, aspartate, alanine, glycine, serine, and cysteine3,4. There are several lines of evidence demonstrating that glutamine is depleted in PDAC. In human patient samples, metabolomic comparisons revealed that glutamine is the most depleted amino acid in resected tumor tissue relative to adjacent non-neoplastic tissue5. Similar analyses using polar metabolite quantifications in orthotopic tumors generated from cells derived from LSL-KrasG12D/+; LSL-Trp53R172H/+; Pdx1-Cre mice support the notion that glutamine is reduced in tumor tissue relative to the normal pancreas6. In addition, intratumoral glutamine levels have been shown to vary regionally within PDAC xenografts7. Considering the important role that glutamine has in supporting tumor cell fitness, glutamine metabolism has been recognized as a potential therapeutic target in cancer8–11. This could be particularly worthwhile in PDAC since PDAC cells are exquisitely dependent on glutamine for their survival and glutamine contributes the most to TCA cycle metabolites relative to other nutrient sources1,12,13. The extreme reliance of PDAC cells on glutamine may be a unique metabolic feature of these tumors as other tumor types utilize glutamine to a much lesser degree and derive biomass mostly from the catabolism of other amino acids12,14.
Despite these established dependencies, the specific targeting of glutaminolysis through GLS inhibition has yet to yield any clinical benefit15. In preclinical mouse models of PDAC, the pharmacological inhibition of GLS did not display anti-tumor activity, which was attributed to intratumoral compensatory responses16. It is conceivable that the ineffectiveness of GLS inhibitors may reflect that the targeting of GLS alone does not account for the broad metabolic functions that have been ascribed to glutamine in cancer. 6-diazo-5-oxo-L-norleucine (DON) is a glutamine substrate analog that acts as a glutamine antagonist. DON inactivates a variety of glutamine-metabolizing enzymes by competitively and covalently binding to glutamine active sites17. As such, DON irreversibly inhibits many metabolic enzymes. DON was originally isolated in the 1950s from Streptomyces and some early studies showed anti-tumor activity with moderate toxicities. Recently, low toxicity prodrugs have been developed that are hydrolyzed to DON, the active metabolite, selectively in human tumors18–22. The DON prodrugs are themselves inert and while such prodrugs are well-tolerated in humans, they are rapidly metabolized to DON in murine plasma due to carboxylesterase 1 activity19; therefore, there is very little benefit to the usage of these prodrugs in the preclinical murine setting. Recent studies have examined how DON might regulate immunometabolism and the immune response in cancer23,24; however, little is known about how DON affects the metabolic fitness of the tumor cells themselves and what metabolic adaptations might occur in response to DON as a therapy.
Here, we provide evidence that broadly targeting glutamine metabolism via DON has therapeutic potential in PDAC. Utilizing multiple mouse models, we have found that DON halts PDAC tumor growth and attenuates metastasis. Although DON is best described and utilized as a glutaminolysis inhibitor25, we find that DON efficacy in PDAC is specifically linked to asparagine (Asn) availability. Asn is a critical amino acid that supports tumor cell proliferative capacity through its roles in amino acid homeostasis and anabolic metabolism26. Moreover, Asn becomes an essential amino acid under conditions where glutamine is limiting27. Interestingly, one of the enzymes targeted by DON is asparagine synthetase (ASNS), which uses glutamine as a substrate to synthesize Asn. Although DON was determined to be an ASNS inhibitor in the 1970s28,29, its examination as a potential cancer therapy has not considered its effects on ASNS. We find that DON substantially suppresses intracellular Asn production and that Asn supplementation uniquely rescues the anti-proliferative effects of DON. As a metabolic adaptation to DON, both in vitro and in vivo, we identify that PDAC cells upregulate expression of ASNS. Importantly, suppressing or enhancing the expression levels of ASNS can bolster either sensitization or resistance to DON, respectively. Furthermore, we find that treatment with L-asparaginase (ASNase), an enzyme that catabolizes free Asn into aspartate and ammonium, sensitizes PDAC cells and human PDAC patient-derived organoids (PDOs) to DON. Intriguingly, while combining ASNase with DON treatment in vivo does not further accentuate the already profound anti-tumor growth properties of DON alone, the polytherapy has a significant impact on metastatic progression. These results shed light on the metabolic mechanisms driving the antineoplastic effects of glutamine antagonists and point to the utility of co-targeting adaptive responses to such therapies to control PDAC progression.
RESULTS
Targeting glutamine metabolism suppresses PDAC progression
To investigate whether broadly targeting glutamine metabolism has the capacity to modulate tumor growth, we initially employed a heterotopic syngeneic mouse model of PDAC30. Murine KPC cells were implanted subcutaneously into the flanks of C57BL/6 mice and either DON or vehicle control was administered to tumor-bearing animals starting when tumors reached a volume of ~130mm3. In this setting, DON treatment led to a significant blockade in tumor growth (Fig. 1a). We next evaluated the effects of DON treatment in an orthotopic syngeneic mouse model of PDAC where KPC cells are surgically implanted directly into the pancreas. Like our observations in the heterotopic setting, we found that DON administration led to a substantial and significant decrease in tumor growth relative to the vehicle control (Fig. 1b). To interrogate whether the suppressive effects of DON on PDAC tumor growth require an intact immune system, we utilized an orthotopic xenograft mouse model where human PDAC cells were implanted into the pancreata of athymic mice. We found that DON significantly suppressed the growth of orthotopic xenograft tumors derived from either PaTu 8988T cells or primary PDAC 779E cells (Fig. 1c,d). The concentrations of DON utilized in these various in vivo settings had minimal effects on overall animal body weight (Extended Data Fig. 1a). Immunohistochemistry of the DON-treated tumors revealed no changes in the extent of apoptosis within the tumors, as measured by cleaved caspase-3 (CC3) staining; however, we detected a decrease in the proliferation markers phospho-Histone H3 (pHis-H3) and Ki-67 (Fig. 1e,f and Extended Data Fig. 1b,c).
Fig. 1. Broadly inhibiting glutamine metabolism with DON suppresses PDAC tumor growth.
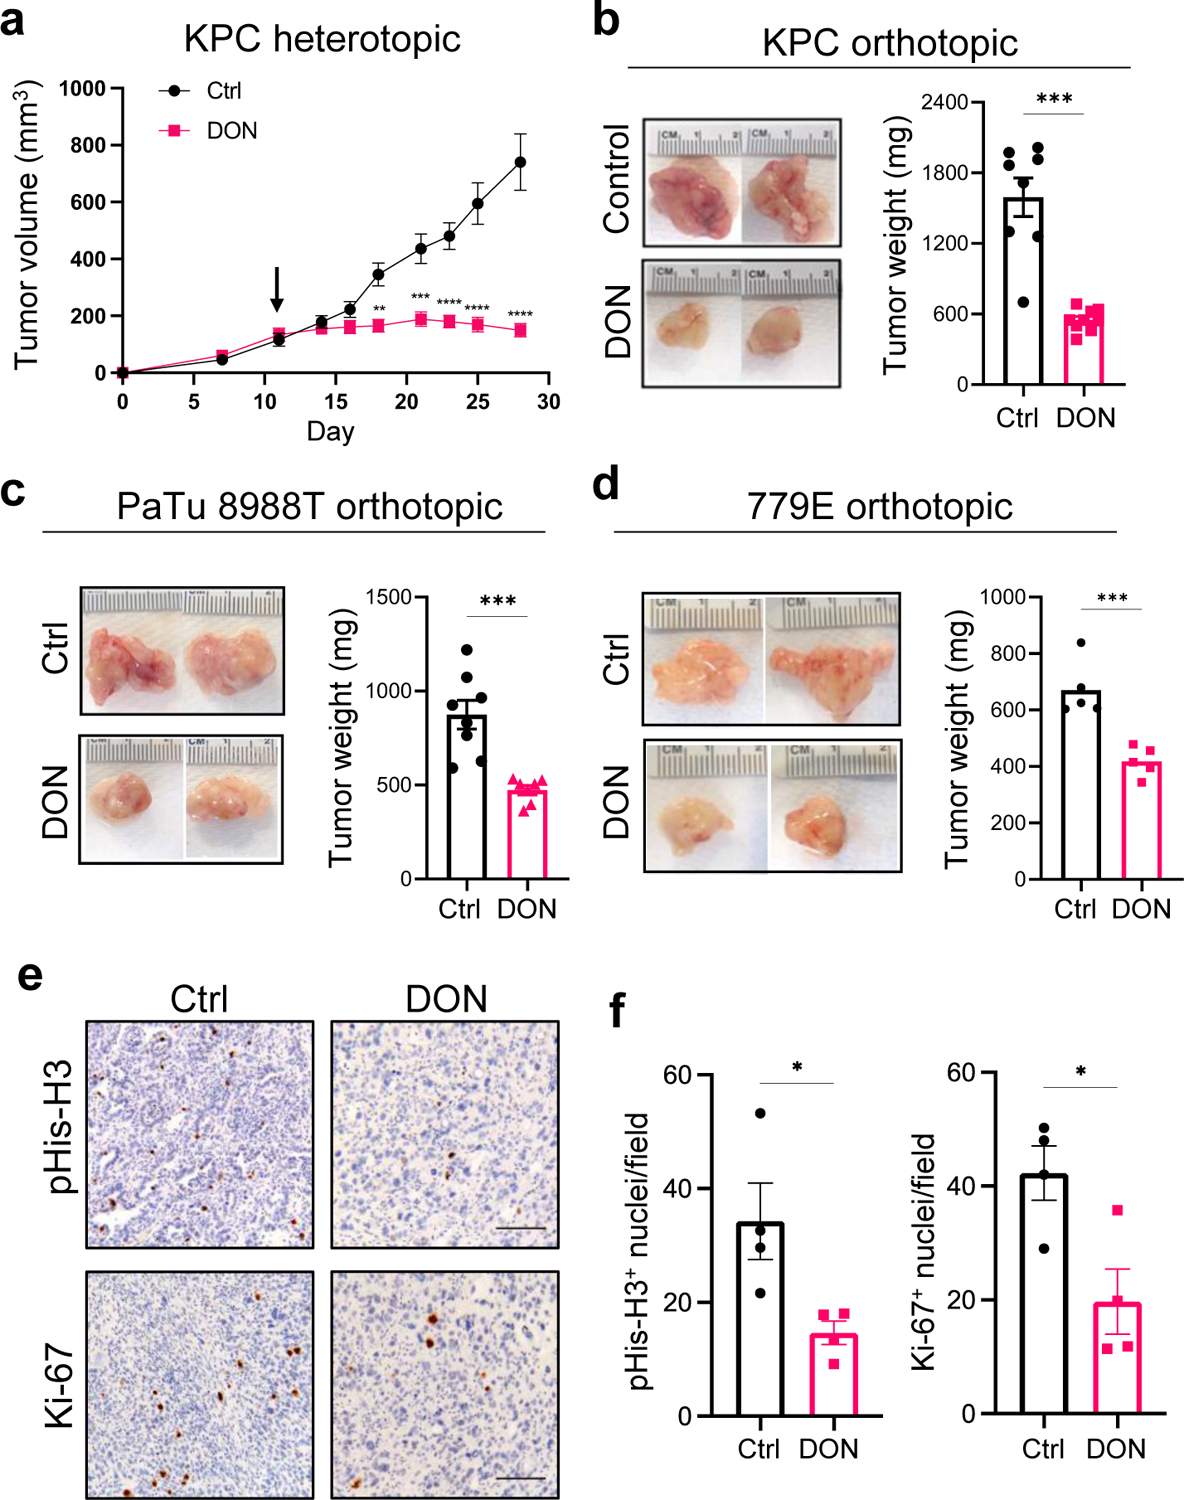
a) Growth of syngeneic KPC tumors implanted subcutaneously and treated with vehicle control (Control) or DON (10mg/kg) for 2 weeks. Tumor volumes were measured with a digital caliper at the indicated timepoints. Data are presented as mean ± SEM of n=4 mice/8 tumors per group. Day 18, P=0.0016. Day 21, P=0.0007. Days 23, 25 and 28, P<0.0001.
b) Tumor weights of KPC orthotopic tumors from animals treated with vehicle control (Ctrl) or DON (10mg/kg) for 10 days. Representative tumor images are shown. Data are presented as mean ± SEM of n=8 or n=9 mice per group (Ctrl, DON). P=0.0003.
c) Tumor weights of PaTu 8988T orthotopic tumors from animals treated with vehicle control (Ctrl) or DON (10mg/kg) for 3 weeks. Representative tumor images are shown. Data are presented as mean ± SEM of n=7 mice per group. P=0.0009.
d) Tumor weights of 779E orthotopic tumors from animals treated with vehicle control (Ctrl) or DON (10mg/kg) for 2 weeks. Representative tumor images are shown. Data are presented as mean ± SEM of n=8 or n=7 mice per group (Ctrl, DON). P=0.001.
e) Immunohistochemical staining of the proliferation markers phospho-Histone H3 (pHis-H3) and Ki-67 in KPC orthotopic tumors treated with vehicle (Ctrl) or DON (10mg/kg). Representative images are shown. Scale bar 100 μm.
f) Quantification of pHis-H3- or Ki-67-positive nuclei/image field is shown as mean ± SEM of n=4 tumors per group. pHis-H3, P=0.0319. Ki-67, P=0.0227.
Statistical significance was calculated using unpaired two-tailed Student’s t test (a-d, f). *P<0.05, **P<0.01, ***P<0.001, ****P<0.0001.
In addition to the effects on the primary tumors, we also observed a substantial decrease in the occurrence of macrometastases to the intestines, liver and diaphragm using the KPC orthotopic tumor model (Fig. 2a,b). Quantification of metastatic burden in the liver revealed that DON significantly reduced the size of the macrometastatic tumors relative to the vehicle control (Fig. 2c). To further assess the effects of DON on metastasis, we used an experimental model of lung metastasis in which tumor cells are i.v. injected into systemic circulation31. KPC cells were i.v. injected into the tail veins of C57BL/6 mice and DON administration commenced the following day for two weeks. Lungs were then harvested and histologically examined by H&E staining and immunohistochemical staining of p53, which marks the tumor cells that infiltrate the lung. As we have previously reported, the KPC cells efficiently colonize the lungs in the control animals (Fig. 2d)6. In DON-treated animals, lung micrometastases were significantly reduced, as visualized by H&E staining and quantified by p53 staining (Fig. 2d,e). We also employed the i.v. metastasis model using human HPAF-II cells i.v. injected into athymic animals. Although these PDAC cells colonized the lungs of the control animals less efficiently than the KPC cells, micrometastases in the lung were still significantly diminished in the DON-treated animals (Extended Data Fig. 2a,b). Altogether, these data indicate that DON has antineoplastic properties in PDAC and that it would be beneficial to examine how DON exerts these anti-tumor effects.
Fig. 2. DON treatment attenuates metastasis in PDAC.
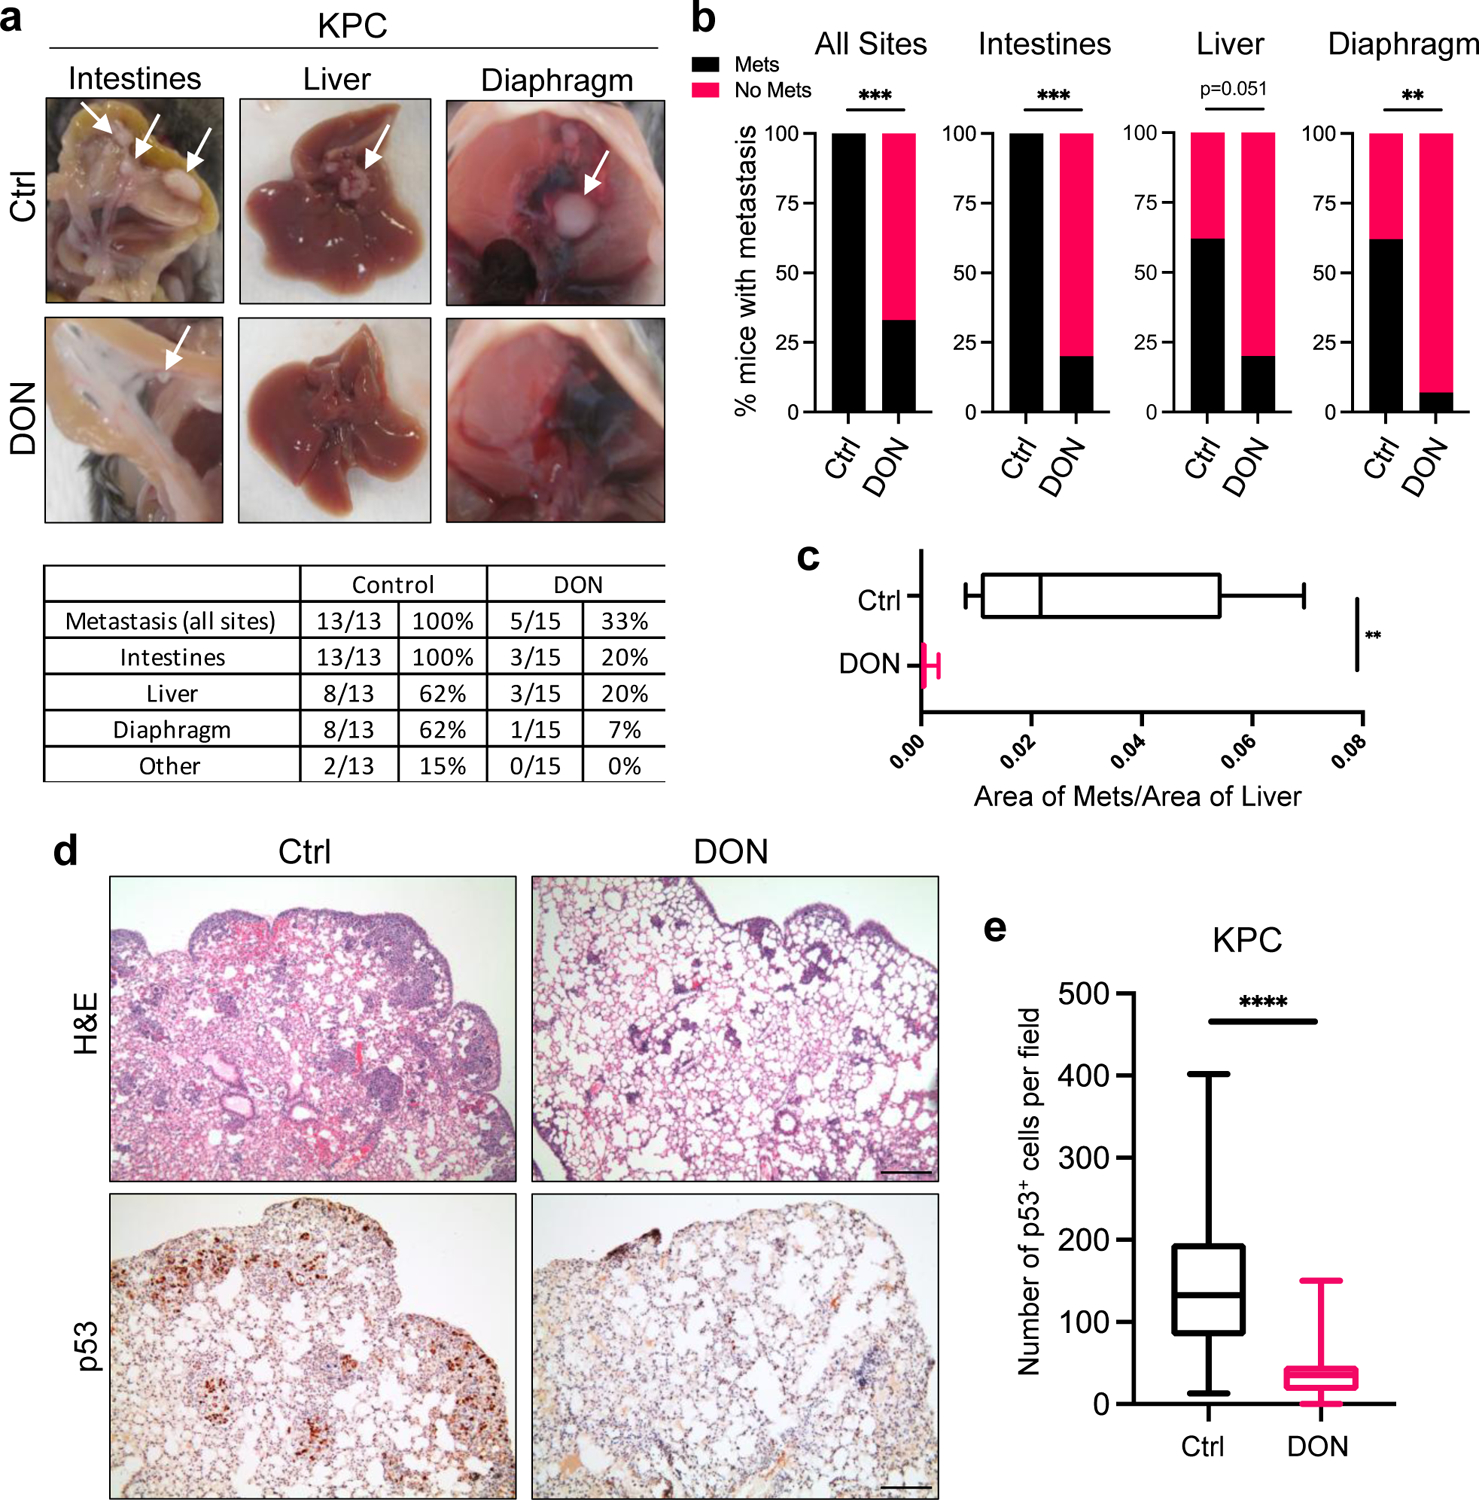
a) Characterization of macrometastases in animals with KPC orthotopic tumors treated with vehicle or DON (10mg/kg). Representative images of macrometastases in different tissues are shown. The number of mice with metastases in each organ site was quantified as indicated in the table. n=13 or n=15 mice per group as indicated.
b) Quantification of the percentage of mice with KPC-derived primary orthotopic tumors that presented with macrometastases at any organ (all sites, P=0.0003), the intestines (P<0.0001), the liver, or the diaphragm (P=0.0036). n=13 or n=15 mice per group (Ctrl, DON).
c) Quantification of the relative metastatic tumor sizes in the liver using image-based computation. The total area of tumor tissue per area of liver tissue was determined. Data are presented as Min to Max box-and-whisker plot with median indicated at center line for n=10 images per condition from a total of 5 mice per group. P=0.0027.
d) H&E staining and immunohistochemical staining of p53 in lung tissue sections derived from animals i.v. injected with KPC cells. Representative images are shown. Scale bar 500 μm.
e) Quantification of p53 staining in lung tissue sections. Data are presented as Min to Max box-and-whisker plot with median indicated at center line for n=60 or n=75 images per condition (Ctrl, DON) from a total of 4 or 5 mice per group (Ctrl, DON). P<0.0001.
Statistical significance was calculated using two-tailed chi-square test (b) or unpaired two-tailed Student’s t test (c, e). **P<0.01, ***P<0.001, ****P<0.0001.
DON compromises PDAC cell fitness through Asn metabolism
To better scrutinize the detrimental effects of DON on PDAC cell fitness, we employed an in vitro cell-based system. We performed dose-response assays and found that DON treatment severely compromised the proliferative capacity of murine KPC cells, as well as a panel of 11 human PDAC cell lines (Fig. 3a,b and Extended Data Fig. 3a). All cell lines tested had comparable IC50 values, except for HPAF-II cells, which were less sensitive to DON (Extended Data Fig. 3b,c). DON inhibits a variety of enzymes that utilize glutamine as a substrate, including those involved in metabolic processes such as amino acid biosynthesis, glutaminolysis, hexosamine biosynthesis, and de novo pyrimidine and purine biosynthesis17. To examine which of these cellular processes might be contributing to the deleterious effects of DON, we took an orthogonal approach and performed metabolite rescue experiments. Although DON has been extensively studied as an inhibitor of glutaminase (GLS or GLS2), cell-permeable α-KG failed to appreciably rescue DON toxicity in the PDAC cell lines (Fig. 3c and Extended Data Fig. 4a,b). This observation contrasts to the previous findings where α-KG partially rescued the cell growth defects caused by glutamine withdrawal in KPC cells32, indicating that glutamine antagonism with DON is not necessarily equivalent to glutamine starvation. Such differences could be explained by the fact that glutamine deprivation can be compensated for by induced glutamine synthesis (i.e. via GLUL/GS expression) as demonstrated in prior reports32,33; whereas glutamine mimicry prevents overall glutamine usage, such that any occurring compensatory synthesis may not be sufficient to overcome this suppression. We also found that DON antiproliferative effects were not reversed by exogenous addition of N-acetylglucosamine (GlcNAc) or a mixture of nucleosides (Nuc), which would restore hexosamine biosynthesis, and pyrimidine and purine biosynthesis, respectively (Fig. 3c and Extended Data Fig. 4a,b). Interestingly, the cell growth defects caused by DON were rescued by supplementation of the growth medium with a cocktail of non-essential amino acids (NEAAs) (Fig. 3c and Extended Data Fig. 4a,b). The NEAA cocktail contains several amino acids that are not present in standard DMEM including alanine (Ala), asparagine (Asn), aspartate (Asp), glutamate (Glu), and proline (Pro). We individually assessed each of these amino acids for their ability to rescue proliferative defects caused by DON. Remarkably, only the addition of Asn to the medium had the capacity to rescue PDAC cell growth, at a range of DON concentrations (Fig. 3d–f and Extended Data Fig. 4c–f). To determine whether the antiproliferative effects of DON are linked to Asn biosynthesis, we quantified intracellular polar metabolites using gas chromatography/mass spectrometry (GC/MS). We found that in PDAC cells, DON treatment significantly reduced intracellular Asn levels, which were rescued by Asn supplementation (Fig. 3g and Extended Data Fig. 5a). These observations are in line with previous studies that showed that DON can bind to and inhibit asparagine synthetase (ASNS)17,28,29. ASNS catalyzes the synthesis of Asn from Asp via the transfer of the amide group from glutamine to aspartate. Consistent with DON inhibiting ASNS, we found a dose-dependent accumulation of intracellular Asp upon DON treatment (Extended Data Fig. 5b). In accordance with its role as a glutaminolysis inhibitor, we also observed significant decreases in Glu and several TCA cycle intermediates, including α-KG, citrate, succinate, fumarate, and malate, but the extent to which these metabolites were reduced was variable across the cell lines (Extended Data Fig. 5c–e). Although Glu and α-KG did not rescue the proliferative defects caused by DON, their levels did increase in DON-treated cells supplemented with Asn (Extended Data Fig. 5f). Also, Asn supplementation in cells treated with DON did not significantly rescue the levels of citrate, succinate, fumarate, or malate (Extended Data Fig. 5f). Altogether, these data demonstrate that DON suppresses Asn biosynthesis and that Asn has the unique ability to rescue the deleterious effects of DON, suggesting that Asn supply and ASNS activity might be distinctively linked to DON effectiveness in PDAC.
Fig. 3. DON treatment suppresses PDAC cell growth through inhibition of asparagine metabolism.
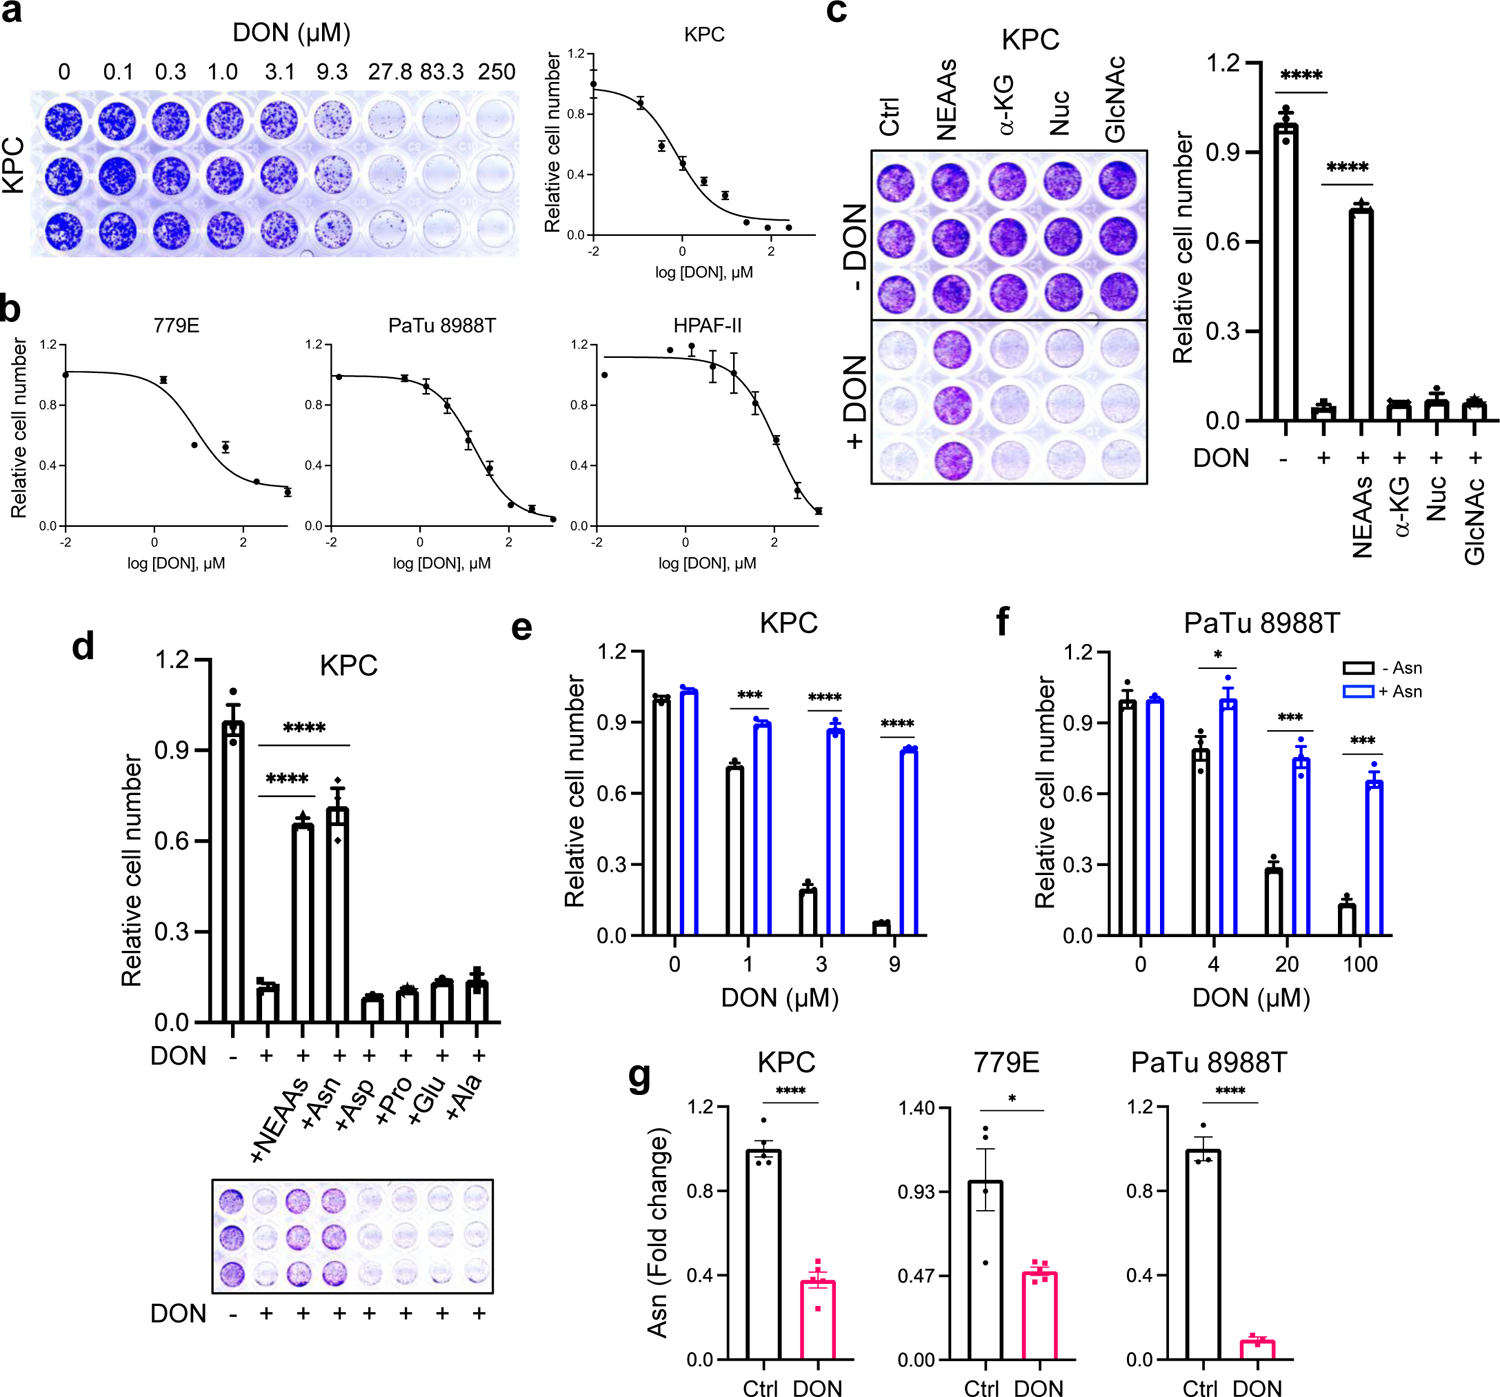
a) Crystal violet staining and dose response curve for KPC cells treated with DON. Relative cell number was quantified by crystal violet staining. A representative image of the crystal violet staining is shown. Data are presented relative to the untreated control condition and are representative of 3 independent experiments. Each independent experiment was performed with 3 replicates per condition. Data are presented as mean ± SEM.
b) DON dose response curves for the indicated human PDAC cell lines. Data are presented relative to the untreated control condition. For 779E and PaTu 8998T, data are representative of 3 independent experiments. For HPAF-II, data are an average of 3 independent experiments. Each independent experiment was performed with 3 replicates per condition. Data are presented as mean ± SEM.
c) Crystal violet assays showing relative cell number of KPC cells treated with or without DON (5μM) and supplemented with the indicated metabolites for 24h. Representative images are shown. Data are presented relative to the untreated control (-DON) for each condition and are representative of 3 independent experiments. Data are presented as mean ± SEM of triplicate wells. Metabolites assessed were non-essential amino acids (NEAAs), α-ketoglutarate (α-KG), nucleosides (Nuc) and N-acetyl glucosamine (GlcNac). Ctrl vs DON, P<0.0001. Ctrl vs NEAAs, P<0.0001.
d) Crystal violet assays showing relative cell number of KPC cells treated with or without DON (5 μM) supplemented with either a cocktail of NEAAs or the indicated individual amino acids (0.1mM) for 24h. Representative images are shown. Data are presented relative to the untreated control (-DON) for each condition and are representative of 3 independent experiments. Data are presented as mean ± SEM of triplicate wells. Ctrl vs NEAAs, P<0.0001. Ctrl vs Asn, P<0.0001.
e), f) Relative number of KPC cells (e) or PaTu 8988T cells (f) treated with DON at the indicated concentrations with or without asparagine (Asn, 0.1mM) supplementation. Data are presented relative to the untreated control condition (-Asn, 0μM DON) and are representative of 3 independent experiments. Data are presented as mean ± SEM of triplicate wells. KPC cells: 1μM DON, P=0.0003; 3μM DON, P<0.0001; 9μM DON, P<0.0001. PaTu 8998T cells: 4μM DON, P=0.0343; 20μM DON, P=0.0007; 100μM DON, P=0.00014.
g) Quantification of intracellular Asn levels in the indicated PDAC cell lines treated with vehicle control (Ctrl) or DON (10μM for KPC and PaTu 8988T, 1mM for 779E) for 24h. Data are presented relative to untreated control. Data are presented as mean ± SEM of n=5 wells (KPC, 779E) or n=3 wells (PaTu 8988T). KPC, P<0.0001. 779E, P=0.0128. PaTu 8988T, P<0.0001.
Statistical significance was calculated using one-way ANOVA followed by Dunnet’s multiple comparisons test (c, d) or unpaired two-tailed Student’s t test (e-g). *P<0.05, ***P<0.001, ****P<0.0001.
DON effectiveness and ASNS expression are interdependent
Tumor cells exhibit a wide array of adaptive processes that serve to sense and respond to amino acid scarcity. It has been well established that ASNS levels are regulated by nutrient stress34; therefore, we surmised that ASNS levels might be affected by DON. Indeed, we found an enhancement of ASNS expression in both KPC cells and across a panel of human PDAC cell lines (Fig. 4a and Extended Data Fig. 6a,b). This boost in ASNS expression by DON occurred at both the protein and transcript levels and was completely rescued by Asn supplementation of the growth medium (Fig. 4b,c and Extended Data Fig. 6b,c). The impact of DON on ASNS expression was also observed in vivo, as orthotopic tumors from DON-treated mice displayed significantly higher levels of ASNS protein as measured via western blot and immunohistochemistry (Fig. 4d–f and Extended Data Fig. 6d). We next assessed whether ASNS expression levels might modulate the effectiveness of DON. To examine whether reducing ASNS expression has the capacity to sensitize PDAC cells to DON, we knocked down Asns via siRNAs and evaluated DON effects on cell proliferation relative to a non-targeting siRNA. Utilizing this approach, Asns expression levels were partially reduced by approximately 70% (Fig. 4g and Extended Data Fig. 6e). Interestingly, Asns knockdown alone compromised the growth of cells and DON effectiveness was significantly enhanced with partial Asns depletion (Fig. 4h,i). To interrogate whether elevated levels of ASNS might confer resistance to DON treatment, we overexpressed Asns and assessed DON responsiveness in the absence of Asn. We found that elevated ASNS expression conferred tolerance to DON over a broad range of concentrations (Fig. 4j,k). A comparison of ASNS protein levels across our panel of human PDAC cell lines indicated that there was not much variation in ASNS expression upon treatment with DON; however, it is notable that HPAF-II cells, which we found to be the least sensitive to DON, had the highest levels of ASNS in both vehicle control and DON-treated conditions (Extended Data Fig. 6f). These data indicated that ASNS levels are linked to DON efficacy, suggesting that Asn supply could play a role in sensitizing PDAC cells to glutamine antagonism.
Fig. 4. ASNS upregulation is a metabolic adaptation to DON treatment.
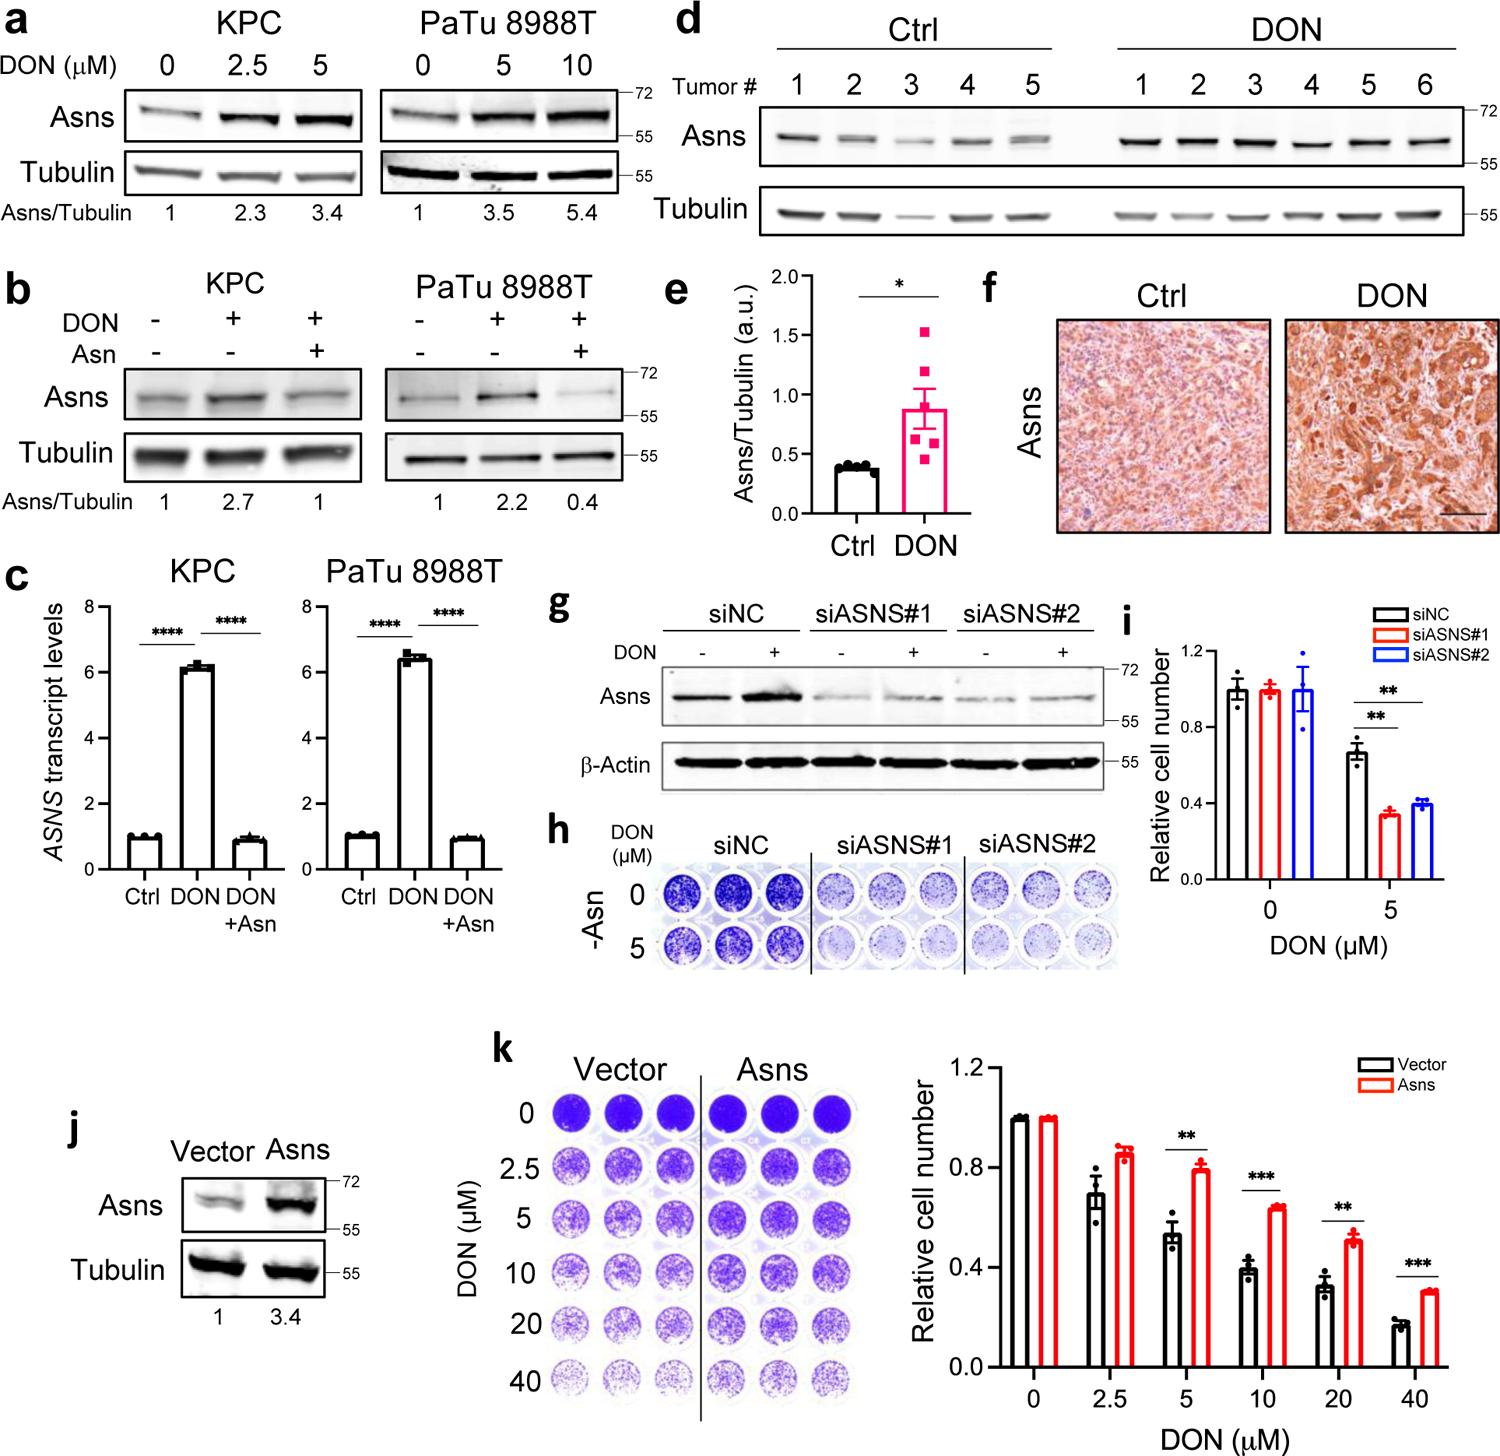
a) Immunoblot assessing Asns protein levels in KPC and PaTu 8988T cells treated with DON at the indicated concentrations for 24h. Tubulin was used as a loading control. Results are representative of 3 independent experiments. Densitometry quantifications are presented relative to the vehicle only condition and values were normalized to the loading control.
b) Immunoblot assessing Asns protein levels in KPC and PaTu 8988T cells treated with 10μM DON with or without Asn supplementation for 24h. Tubulin was used as a loading control. Results are representative of 3 independent experiments. Densitometry quantifications are presented relative to the vehicle only condition and values were normalized to the loading control.
c) Relative ASNS mRNA levels as assessed by qPCR in KPC or PaTu 8988T cells treated with 10μM DON with or without Asn supplementation for 24h. Data are presented relative to untreated control (Ctrl) and are representative of 3 independent experiments. Data are presented as mean ± SEM of n=3 replicates. For all statistical comparisons, P<0.0001.
d) Immunoblot assessing Asns protein levels in KPC orthotopic tumors treated with vehicle (Control) or DON (10mg/kg) for 2 weeks. Tubulin was used as a loading control.
e) Densitometry quantification of Asns protein relative to Tubulin in KPC orthotopic tumors from d). Data are presented as mean ± SEM of n=5 or n=6 tumor samples per group. P=0.0259.
f) Immunohistochemical staining of Asns protein in KPC orthotopic tumors treated with vehicle control (Control) or DON (10mg/kg). Representative images of n=4 mice per group are shown. Scale bar, 100μm.
g) Immunoblot assessing Asns protein levels in KPC cells transfected with non-targeting negative control siRNA (siNC) or two different hairpins targeting ASNS (siASNS#1 and siASNS#2) for 24h followed by 5μM DON treatment for 24h.
h), i) Relative number of KPC cells transfected with siNC control, siASNS#1 or siASNS#2 following 5μM DON treatment for 24h. Representative images are shown (h). Quantification of crystal violet staining (i) where data is presented relative to untreated control and is representative of 3 independent experiments. Data are presented ± SEM of n=3 replicate wells. 5 μM DON: siNC vs siASNS#1, P=0.0021; siNC vs siASNS#2, P=0.0044.
j) Immunoblot assessing Asns protein levels in KPC cells transfected with empty vector or ASNS-expressing vector for 48h. Tubulin was used as loading control. Results are representative of 3 independent experiments. Densitometry quantifications are presented relative to the vector only condition and values were normalized to the loading control.
k) Relative number of vector control or ASNS-overexpressing KPC cells following treatment with DON. Quantification of crystal violet staining is shown relative to untreated control and is representative of 3 independent experiments. Data are presented ± SEM of n=3 replicate wells. 5 μM DON, P=0.0044. 10 μM DON, P=0.000997. 20 μM DON, P=0.0065. 40 μM DON, P=0.0005.
Statistical significance was calculated using one-way ANOVA followed by Tukey’s multiple comparisons test (c) or unpaired two-tailed Student’s t test (e, i and k). *P<0.05, **P<0.01, ***P<0.001, ****P<0.0001.
To test the idea that targeting Asn supply might sensitize PDAC cells to DON, we employed L-asparaginase (ASNase), an enzyme that converts Asn to Asp with NH4+ as a byproduct and is utilized as a therapeutic treatment in acute lymphocytic leukemia (ALL)35,36. To mimic the amino acid composition of tumors, we cultured murine and human PDAC cells in physiological levels of Asn and treated with DON in the presence or absence of ASNase. As expected, supplementation with Asn substantially rescued the toxic effects of DON (Fig 5a–d and Extended Data Fig. 7a,b). Strikingly, DON co-treatment with ASNase led to synergistic effects on cell fitness (Fig 5a–d and Extended Data Fig. 7a,b). ASNase on its own had no effect on cell growth, as it does not prevent intracellular Asn biosynthesis by ASNS. Synergy was computed using the coefficient of drug interaction (CI). Since some ASNase enzymes exhibit glutaminase activity, we measured Gln levels in the media with and without ASNase and found that the Gln concentration was unaffected under the conditions employed in the co-treatment assays (Extended Data Fig. 7c). To further assess the relationship between DON and ASNase, we employed previously characterized human PDAC patient-derived organoids (PDOs)37,38. Single agent and combination treatments of DON and ASNase in a panel of six PDOs revealed a broad range of sensitivities to DON as a single agent (Fig. 5c). The PDOs were cultured in the presence of physiological levels of Asn; hence it was not surprising that ASNase alone had only marginal effects or no impact on PDO viability. Significant synergy for the DON + ASNase combination was observed in 5/6 PDOs, as indicated by a CI computation of <0.7 (Fig. 5c). The PDOs that we used had already been characterized at the transcriptomic level via RNASeq38; therefore, we discerned molecular features that related to drug responsiveness. Heatmap analysis of normalized gene expression for the known DON targets strikingly demonstrated that ASNS is the only DON-targeting enzyme for which heightened gene expression correlates with dampened DON response (Fig. 5d). This relationship between DON and ASNS was confirmed utilizing a Spearman’s rank correlation coefficient analysis for all the known DON targets, and surprisingly, this assessment indicated that the expression of genes encoding well-established DON targets such as GLS, GLS2 and GFAT (encoded by GFPT1) did not correlate with DON sensitivity (Fig. 5e and Extended Data Fig 7d–k). Altogether, these data demonstrate that in PDAC cells ASNS expression levels are inversely correlated with DON efficacy and that ASNase can synergize with DON to reduce cell fitness.
Fig. 5. ASNase synergizes with DON to suppress PDAC cell growth.
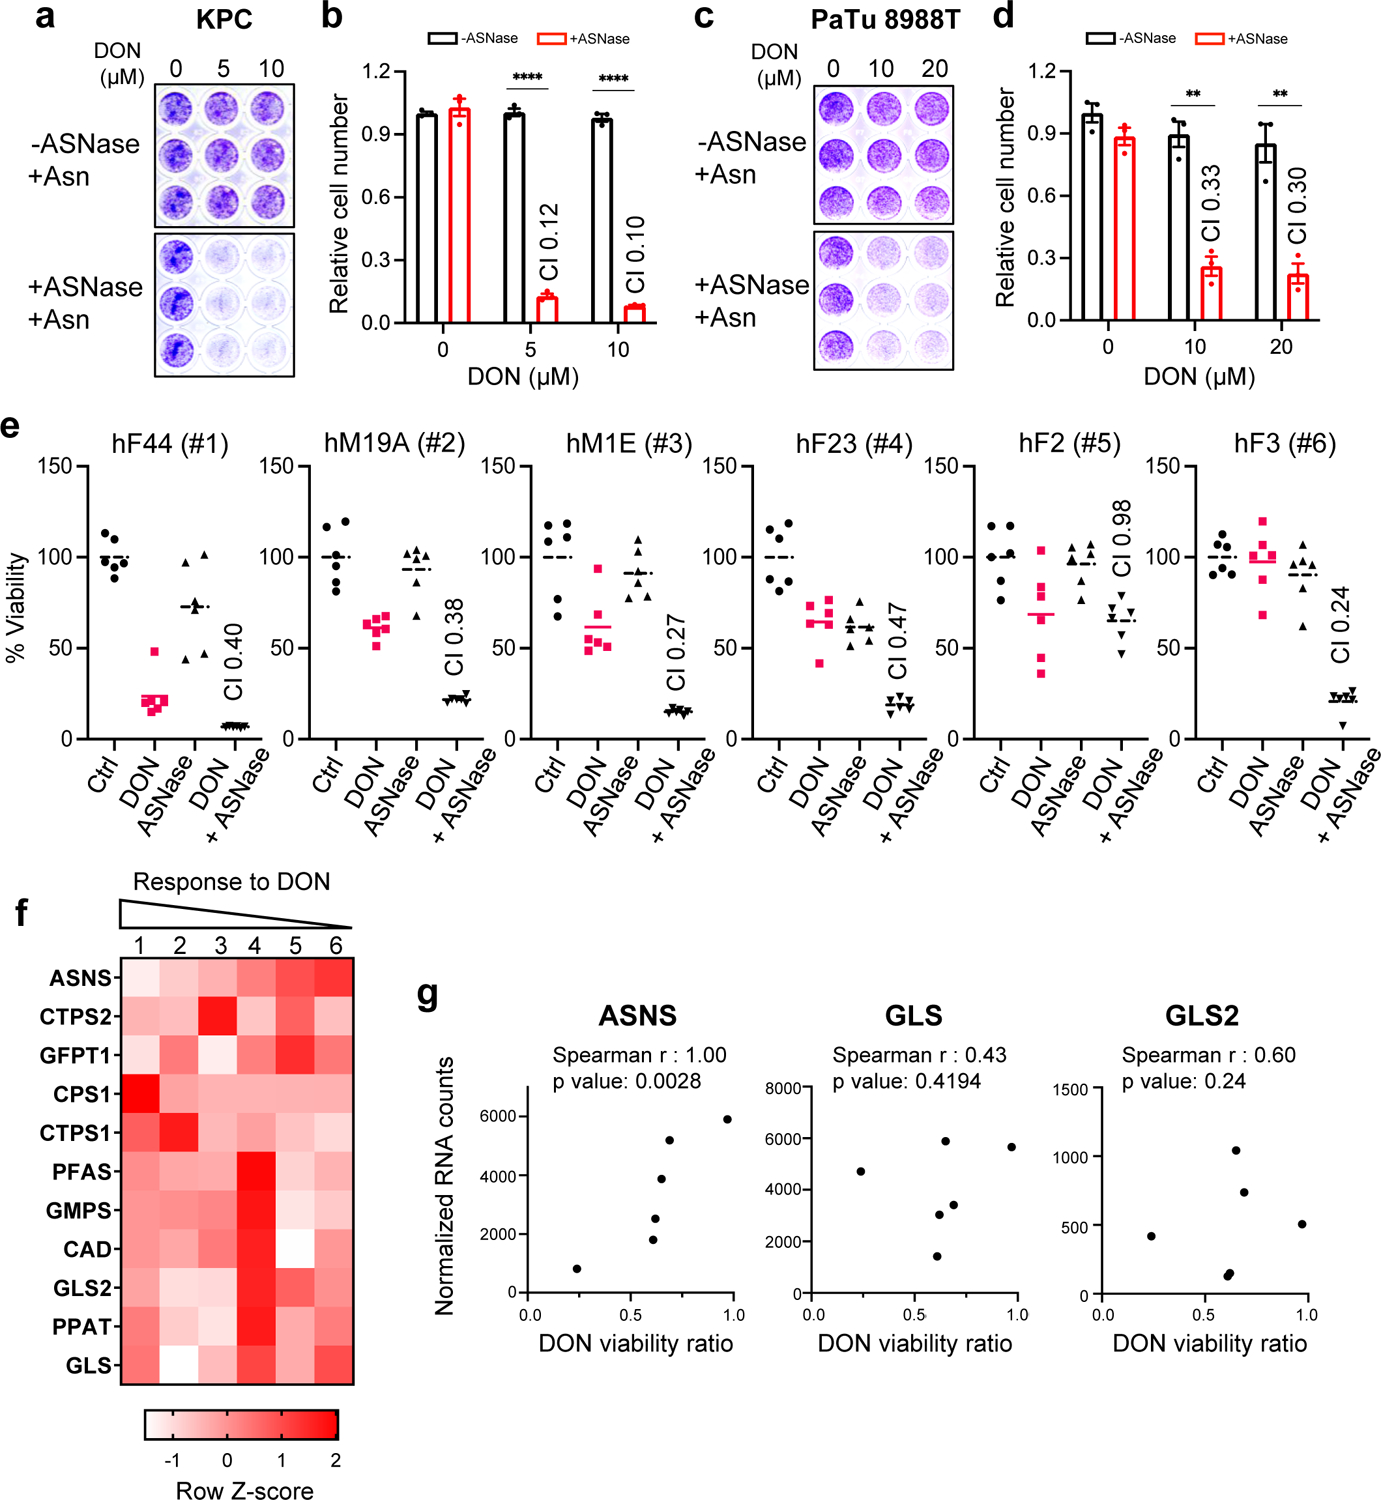
a-d) Relative number of KPC cells (a,b) or PaTu 8988T cells (c,d) treated with the indicated doses of DON in combination with L-asparaginase (ASNase, 0.5U/ml) for 24h. Cells were stained with crystal violet, representative images are shown. Quantification of crystal violet staining is shown relative to the untreated control and is representative of 3 independent experiments. The coefficient of drug interaction (CI) was calculated for each DON concentration (shown in graph). Data are presented ± SEM of n=3 replicate wells. KPC: For all statistical comparisons, P<0.0001. PaTu 8988T: 10 μM DON, P=0.0011; 20 μM DON, P=0.0038.
e) Cell viability was assessed in 6 PDAC patient-derived organoids (PDOs) treated with vehicle (Ctrl), 50μM DON, 0.3 U/ml ASNase, or combination of DON + ASNase. The CI is indicated in the graphs. Graphs are ordered by decreasing organoid sensitivity to DON and accordingly numbered #1–6. Data are presented relative to untreated control and presented as mean ± SEM of n=5 replicate wells.
f) Heatmap analysis of normalized gene expression (RNA-seq) of known DON-targeting enzymes in PDAC PDOs (#1–6) used in e. Legend indicates row Z-score.
g) Correlation analysis between normalized gene expression of the indicated DON-targeting enzymes and DON viability ratio, used as measurement of PDO responsiveness to DON treatment.
Statistical significance was calculated using unpaired two-tailed Student’s t test (b, d) or two-tailed Spearman correlation coefficient (g). **P<0.01, ****P<0.0001.
DON and ASNase combination therapy restrains PDAC progression
To investigate the therapeutic potential of combining DON with ASNase in PDAC, we first employed an orthotopic xenograft mouse model where pancreatic tumors were derived from human PaTu 8988T cells. PDAC cells were implanted directly into the pancreata of athymic mice and approximately 20–23 days post-implantation when tumors were palpable, animals were treated with either vehicle control, ASNase alone, DON alone or DON + ASNase for two weeks, at which point tumors were extracted for analysis. Weights of the primary tumors revealed that ASNase alone did not affect tumor size, while DON alone, as expected, resulted in a significant diminishment in tumor growth (Fig. 6a). The combination of DON + ASNase did not lead to a further reduction in weight of the primary tumors (Fig. 6a). Consistent with this finding, markers for proliferation and cell death in DON-treated tumors were not modulated by the combination treatment (Extended Data Fig. 8a–b). In ALL therapy, ASNase is utilized to deplete circulating Asn; therefore, to confirm ASNase activity in our orthotopic xenograft mouse model, we quantified Asn plasma levels. Indeed, we found that ASNase treatment led to an extensive depletion of circulating Asn (Fig. 6b). In contrast, however, intratumoral depletion of Asn in the orthotopic pancreatic tumors was less impacted (Fig. 6c). As a control, we measured circulating Gln levels in tumor-bearing animals treated with and without ASNase and found that plasma Gln concentration was unaffected (Extended Data Fig. 8d). These data indicate that while ASNase efficiently depletes circulating Asn, tumor Asn levels are less affected. We reasoned that with the diminishment of circulating Asn, the anti-tumor effects of DON might be accentuated at the level of metastatic progression; therefore, we examined the effects of the combination therapy on metastases to various organs, including the intestine, liver, and diaphragm. With the combination of DON and ASNase we observed a substantial decrease in the overall number of animals displaying macrometastases relative to the vehicle control (Fig. 6d,e and Extended Data Fig. 8c). Notably, while DON alone significantly reduced the occurrence of macrometastases to the liver, only the DON + ASNase combination therapy significantly attenuated the instances of macrometastases to the intestines (Fig. 6e, f). To determine whether the combination therapy had the ability to limit the number or size of metastatic tumors within a particular organ, we examined the metastatic burden using image-based quantification. We found that DON alone decreased the number of nodules per length of intestine and that the combination of DON + ASNase significantly amplified these anti-tumor effects (Fig. 6g). Similarly, in the liver, DON alone significantly diminished the size of metastatic tumors, and with the combination therapy these effects were significantly enhanced (Fig. 6h). We next interrogated whether the DON + ASNase combination therapy could limit metastasis in a second orthotopic implantation model using 779E primary PDAC cells, which are epithelial cells established from a moderate-to-poorly differentiated patient-derived tumor39. Consistent with the PaTu 8988T model, the combination therapy did not further reduce the growth of 779E-derived primary tumors (Extended Data Fig. 9a). Of note, we found that relative to the vehicle control tumors, the DON + ASNase combination therapy most significantly decreased metastasis overall, as well as in the liver (Extended Data Fig. 9b,c). We quantified the size of the liver metastases and found that the combination therapy significantly reduced the size of the macrometastatic tumors relative to DON alone (Extended Data Fig. 9d). We were unable to detect any macrometastases to the intestines with DON alone; therefore, we could not compute the effects of the combination therapy in this specific organ setting (Extended Data Fig. 9b, c). Altogether, our observations suggest that while ASNase treatment may not further enhance the robust anti-tumor effects of DON alone in the primary PDAC tumors, a DON + ASNase polytherapy may provide a combinatorial benefit in controlling metastasis.
Fig. 6. Suppression of PDAC metastasis by DON is enhanced by co-treatment with ASNase.
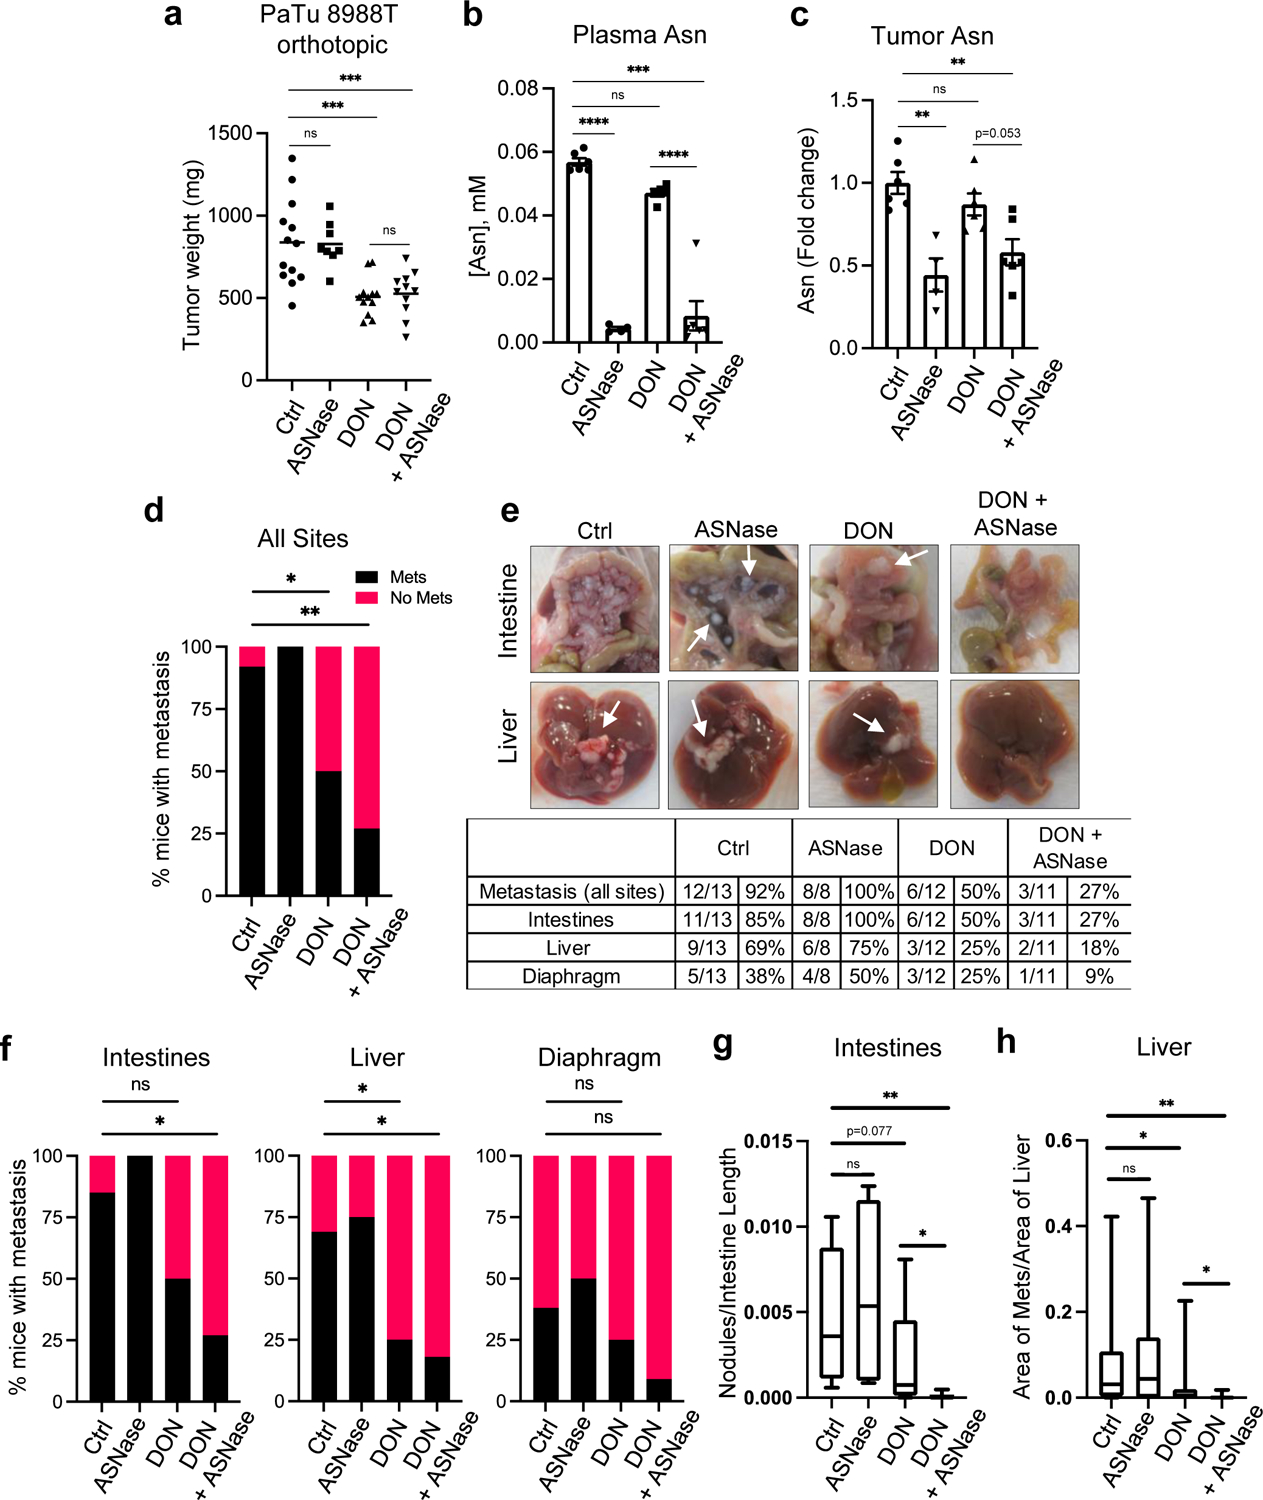
a) Tumor weights of PaTu 8988T orthotopic tumors from animals treated with vehicle (Ctrl), ASNase (3U/g), DON (5–10mg/kg), or combination of DON + ASNase for 3 weeks. Data are presented as mean ± SEM of n=13, n=8, n=12, or n=11 mice combined from 2 different cohorts. Ctrl vs ASNase, P=0.9994. Ctrl vs DON, P=0.0002. Ctrl vs DON+ASNase, P=0.0008. DON vs DON+ASNase, P=0.9935.
b) Asn levels quantified by GC-MS in plasma of mice bearing PaTu 8988T orthotopic tumors. Data are presented as mean ± SEM of n=6, n=4, n=5, or n=6 mice per group. For all statistically significant comparisons, P<0.0001. Ctrl vs DON, P=0.1001.
c) Quantification of intratumoral Asn levels in PaTu 8988T orthotopic tumors. Data are presented relative to no treatment control and quantification was calculated as amount of Asn per mg of tumor tissue. Data are presented as mean ± SEM of n=6, n=4, n=6, or n=6 mice per group. Ctrl vs ASNase, P=0.0007. Ctrl vs DON, P=0.5989. Ctrl vs DON+ASNase, P=0.0037.
d) Quantification of the percentage of mice with PaTu 8988T-derived primary orthotopic tumors that presented with macrometastases in any organ (all sites). n=13, n=8, n=12, or n=11 mice per group. Ctrl vs DON, P=0.03. Ctrl vs DON+ASNase, P=0.0022.
e) Characterization of macrometastases in animals with PaTu 8988T orthotopic tumors treated as indicated. Representative images of macrometastases in the different tissues are shown. The white arrows point to macrometastases. The number of mice with macrometastases in each organ site was quantified as indicated in the table. n=13, n=8, n=12, or n=11 mice per group.
f) Quantification of the percentage of mice with PaTu 8988T-derived primary orthotopic tumors that presented with macrometastases to the intestines, liver, or diaphragm. n=13, n=8, n=12, or n=11 mice per group. Intestines: Ctrl vs DON, P=0.097; Ctrl vs DON+ASNase, P=0.011. Liver: Ctrl vs DON, P=0.047; Ctrl vs DON+ASNase, P=0.018. Diaphragm: Ctrl vs DON, P=0.673; Ctrl vs DON+ASNase, P=0.166.
g) Quantification of the relative number of metastatic nodules in the intestines using image-based computation. The total number of tumor nodules per length of intestine was determined from one image per mouse. Data are presented as Min to Max box-and-whisker plot with median indicated at center line for n=13, n=8, n=12, or n=11 mice per group. Ctrl vs ASNase, P=0.536. Ctrl vs DON+ASNase, P=0.0011. DON vs DON+ASNase, P=0.029.
h) Quantification of metastatic tumors in the liver using image-based computation. The total area of tumor tissue per area of liver tissue was determined. Data are presented as Min to Max box-and-whisker plot with median indicated at center line for n=26, n=16, n=24, or n=22 images per condition from a total of 13, 8, 12 or 11 mice per group. Ctrl vs ASNase, P=0.665. Ctrl vs DON, P=0.034. Ctrl vs DON+ASNase, P=0.0013. DON vs DON+ASNase, P=0.045.
Statistical significance was calculated using one-way ANOVA followed by Tukey’s multiple comparisons (a-c), two-tailed chi-square test (d, f) or unpaired two-tailed Student’s t test (g, h). *P<0.05, **P<0.01, ***P<0.001, ****P<0.0001, ns=not significant.
DISCUSSION
Our studies have elucidated the tumor cell intrinsic effects of broadly inhibiting glutamine metabolism in PDAC. We delineate how glutamine mimicry by DON profoundly suppresses cellular fitness through the regulation of Asn production, and how DON treatment leads to significant abrogation of tumor growth and metastasis in mouse models of PDAC. Previous studies have mainly focused on tumor cell extrinsic effects of DON by investigating how DON and DON-based prodrugs impact the tumor ecosystem through modulating stromal cell function. In an immunoresponsive syngeneic mouse model in which heterotopic tumors were derived from murine MC38 colon cancer cells, JHU083, a DON-based prodrug, enhanced endogenous anti-tumor immune responses by boosting tumor infiltration and activation of CD8+ T cells23. In this MC38 model, JHU083 treatment in Rag2−/− mice, which do not produce mature B or T lymphocytes, failed to affect tumor growth rates and animals succumbed to disease in a similar time frame as untreated wild-type mice. In contrast, our experiments utilizing athymic nude Foxn1nu mice, which are unable to produce T cells, revealed that DON significantly suppresses the growth of orthotopic xenograft tumors derived from human PDAC cells. These data indicate that tumor growth control by DON treatment in our immunocompetent PDAC mouse models is not at all mediated by T cells, or that the contribution of the endogenous immune responses in these settings is minimal. DON has also been implicated in regulating extracellular matrix (ECM) remodeling in an orthotopic cancer-associated fibroblast (CAF) co-implantation model of PDAC24. In this model, intrapancreatic co-implantation of a high ratio of CAF:KPC cells (9:1) allows for the optimal evaluation of CAF-secreted ECM molecules, such as collagen and hyaluronan (HA). It was found that in these tumors, DON decreases HA production likely through its inhibition of GFAT1, a known DON target that regulates UDP-GlcNAc synthesis. Interestingly, in this model, the effects of DON on tumor growth were also attributed to CD8+ T cells, as the efficacy of DON disappeared in CD8 knockout mice. In our orthogonal rescue assays, providing exogenous GlcNAc did not rescue the anti-neoplastic effects of DON, as well, in our human PDO evaluations, GFAT1 expression levels (encoded by the GFPT1 gene) did not correlate with DON responsiveness. Further scrutinization into the multipronged effects of DON will be required to evaluate the specific contributions of each of the DON targets to in vivo tumor growth and the extent to which tumor-stromal interactions control DON responsiveness in preclinical models and patients.
The current findings indicate that a combination approach utilizing DON together with ASNase might represent a therapeutic modality to control metastasis in PDAC. This approach could be particularly relevant to PDAC since glutamine has been shown to be depleted in tumors relative to normal pancreas or adjacent non-neoplastic tissue5,6. It should be noted, however, that in end-stage tumors isolated from the LSL-KrasG12D/+; Trp53flox/flox; Pdx1-Cre mouse model of PDAC, glutamine was found to be at similar concentrations in tumor interstitial fluid (TIF) versus plasma40. This discrepancy possibly indicates that bulk tumor tissue analyses are reflective of the intracellular glutamine depletion occurring within the tumor cells. Another possibility is that the specific mouse model employed (i.e. orthotopic versus genetically engineered) or the specific genetic alterations present in the murine tumors (i.e. Trp53 mutant versus null) might be influencing the extent of nutrient depletion. A further consideration is that tumor cell intrinsic biosynthesis of glutamine via glutamate ammonia ligase (GLUL, also termed glutamine synthetase or GS) is required for tumor initiation and tumor growth in PDAC murine models, and its stabilization represents an adaptation to glutamine limitation32,33. It is important to highlight that the targeting of glutamine metabolism in PDAC and combining DON with ASNase as a potential therapy, has promise as an approach irrespective of the considerations noted above. ASNase treatment is a key chemotherapy that is employed in ALL, the most common pediatric cancer. ASNase effectiveness in ALL has been attributed to the fact that lymphoblasts lack expression of ASNS, thus they depend on the uptake of circulating Asn for their survival41. The potential of ASNase as a therapy in solid tumors has been limited; however, in PDAC preclinical models, combination therapies including ASNase have been demonstrated to have efficacy at controlling tumor growth. In a syngeneic orthotopic mouse model of PDAC, ASNase in combination with phenformin, a metformin-related electron transport chain (ETC) inhibitor, significantly reduced tumor growth42. This important finding is directly linked to ETC inhibition effectively impairing de novo Asn biosynthesis, and the ability of exogenous Asn to restore proliferation upon ETC inhibition42. Interestingly, in human PDAC cells, the in vitro depletion of Asn by ASNase has been shown to enhance Erk1/2 phosphorylation, and the deleterious proliferative effects of ASNS knockdown were further enhanced by MEK inhibition43. Importantly, the in vivo combination of ASNase and MEK inhibition suppressed the growth of orthotopic PDAC tumors to a greater extent than either of the single agents alone43. Interestingly, Asn has been linked to metastasis in a breast cancer model44. Reduction of Asn levels by ASNS knockdown, ASNase treatment or Asn dietary restriction showed significantly reduced metastatic burden without affecting primary tumor growth, similar to our observations with DON + ASNase treatment in PDAC models. Apart from our examination of combining DON and ASNase in vivo, little is known about combination therapies with DON that may improve its anti-tumor effects in PDAC. However, in preclinical mouse models of glioblastoma (GBM), DON in combination with a calorie-restricted ketogenic diet (KD) resulted in reduced tumor growth and enhanced survival45. The mechanistic underpinnings of how the KD improves the effectiveness of DON in GBM remain unclear and whether similar diet modifications synergize with DON in PDAC is an interesting area for future interrogation.
The determination that ASNS expression levels negatively correlate with DON sensitivity in human PDOs suggests that ASNS might be a predictive biomarker of DON effectiveness in PDAC. We demonstrated that indeed modulating ASNS expression levels in PDAC cells has the capacity to control DON sensitivity or tolerance. Interestingly, this observation was unique to ASNS among the known DON target enzymes, as expression of well-studied targets such as GLS and GLS2 did not correlate in this way. Very little is known about what might dictate patient stratification for DON-based prodrugs that are currently in clinical trials46. Interestingly, in atypical teratoid/rhabdoid tumors (ATRT), which is a rare and aggressive cancer of the brain and spinal cord in infants, metabolic profiling revealed a unique dependence on glutamine for survival in ATRT cell lines with high MYC expression47. DON selectively suppressed proliferative capacity and induced cell death in these Mychigh ATRT cells and extended survival in an ATRT Mychigh orthotopic mouse model47. These findings are in accordance with a DON-based prodrug that suppressed proliferation and induced cell death in MYC-driven medulloblastoma cell lines, and increased survival in an orthotopic xenograft mouse model48. These links between Myc and sensitivity to DON are a direct result of the established role that Myc has in regulating metabolic reprogramming. Myc directly reprograms cellular transcriptional outputs that drive mitochondrial glutaminolysis. This transcriptional rewiring by Myc leads to the enhanced cell viability and TCA cycle anaplerosis, while concomitantly creating a dependency on glutamine catabolism49. Depriving Myc-driven cancers, such as neuroblastomas, selectively leads to apoptosis through ATF4-dependent mechanisms50. It is not yet clear whether ASNS plays a role in modulating the sensitivity of Myc-driven neuroblastomas to glutamine deprivation. Moreover, it remains to be explored whether ASNS expression levels represent a predictive biomarker of response to glutamine metabolism-based therapies in malignancies other than PDAC.
METHODS
Further information on research design is available in the Nature Research Reporting Summary linked to this article. All experimental procedures in mice were approved by the Institutional Animal Care and Committee (IACUC) of Sanford Burnham Prebys Medical Discovery Institute (approval number 20–073). All experiments involving recombinant DNA and viral vectors have been reviewed and approved by the Sanford Burnham Prebys Institutional Biosafety Committee (approval number IBC-CC-20–004).
Cells and cell culture conditions
HPAF-II, BxPC-3, Capan-2, CFPAC, MIA PaCa-2, PANC-1, PANC 10.05, PL45, and SW-1990 cells were obtained from the American Type Culture Collection (ATCC); PaTu 8988T cells were purchased from Elabscience. 779E are epithelial cells established from a moderate-to-poorly differentiated patient derived tumor by A.M. Lowy39. KPC cells derived from mice with the genotype Pdx1-Cre; LSL-KRasG12D/+; LSL-Tp53R172H/+ were kindly provided by Dr. Robert H. Vonderheide30 and the parental KPC cell line (KPC4662) was subcloned to generate KPC#65 and KPC#74 clones that were used in this study. For maintenance, all cell lines were cultured in the medium recommended by the supplier. To make assessments in equivalent metabolite concentrations for experiments, cell lines were cultured in DMEM supplemented with 10% FBS and 100 units/mL penicillin/streptomycin under 5% CO2 at 37°C. Cells were routinely tested for mycoplasma contamination by ABM’s PCR Mycoplasma detection kit. The following inhibitors were used in this study: 6-diazo-5-oxo-L-norleucine (DON) (Sigma) and L-Asparaginase (Prospec bio). For rescue experiments cells were treated with MEM-NEAA (Thermo Fisher, 0.1mM); dimethyl-2-oxo-glutarate (α-KG, Sigma, 5.5mM); EmbryoMax Nucleosides 100X (Millipore, 2X) and N-acetyl glucosamine (GlcNAc, Sigma, 10mM). Individual non-essential amino acids, Asn, Asp, Glu, Pro, Ala were obtained from Sigma and used at 0.1mM.
Animal studies
C57BL/6J female mice and NU/J athymic nude female mice aged between 5 and 6 weeks old were purchased from The Jackson Laboratories and Charles River, respectively. All animals were housed in sterile caging and maintained under pathogen-free conditions. The Sanford Burnham Prebys Medical Discovery Institute (SBP) IACUC policy limits tumors in mice to 2cm3 and this was not exceeded. Mice were fed chow of an irradiated diet for rodents (Teklad Global, 2918.15) ad libitum. Mice were housed four per cage in individually ventilated cage systems. Relative humidity in the rodent rooms is monitored and recorded daily by animal technicians but is not controlled. Generally, animal room RH (relative humidity) is within the acceptable range of 30–70% for rodents. A standard diurnal light cycle of 12-hr light: 12-hr dark was used with a rodent room thermostat temperature set point of 72°F.
Subcutaneous tumor model.
500,000 KPC cells suspended in 100 μL of 1:1 PBS: Matrigel were subcutaneously injected in both lower back flanks of syngeneic C57BL/6J mice under isoflurane anesthesia. Tumor growth was monitored by volume measurement with a digital caliper. When tumors reached a volume of 150–200 mm3, mice were randomly assigned into groups and received the following treatments via i.p. administration: control group (vehicle, sterile water); DON-treated group (1, 5, or 10mg/kg as indicated). Mice were injected every other day for 2 weeks. Tumor tissue was collected in 10% formalin for immunostaining and a portion of the tissue was snap-frozen in liquid nitrogen for qPCR analysis.
Orthotopic tumor model.
12,500 murine or human PDAC cells were injected (50 μL 1:1 PBS: Matrigel) into the tail of the pancreas via a small abdominal incision in the left flank of anesthetized mice. Murine KPC cells were injected into C57BL/6J female mice; and human 779E and PaTu 8988T cells were injected into Nu/J athymic nude mice. Tumor growth was monitored by palpation under isoflurane anesthesia. When tumors were palpable (12 to 20 days after injection depending on the cell line) mice were randomized and treated as indicated: control group, (sterile water, i.p.) and DON-treated group (10mg/kg DON, i.p.). Mice were injected every other day for 2 weeks. For DON + L-Asparaginase (ASNase) combination treatment, PaTu 8988T or 779E tumor-bearing mice were randomized into 4 groups: Control (sterile water, i.p.), DON (5–10 mg/kg, i.p.), L-Asparaginase (3Units/g, i.p.) and DON + ASNase (5–10mg/kg DON + 3U/g ASNase, i.p.). Mice were injected 3 times per week for 2 weeks. Tumors were weighed and collected in 10% formalin for histology and IHC or snap-frozen in liquid nitrogen for metabolite quantification. All mice were thoroughly examined for spontaneous metastasis in the peritoneal cavity (small and large intestines, liver, kidney), diaphragm and lungs. The number of mice presenting metastases in each of the sites was compared among treatment groups. To quantify metastatic burden in the intestines, imaged-based analyses were performed using Fiji 2 where nodules that were clearly visible along an isolated portion of the intestine were counted using the Cell Counter plugin and the length of the corresponding segment of the intestine was measured. To quantify metastatic burden in the liver, imaged-based analyses were performed using Fiji 2 where total area of metastatic tumors clearly visible on a lobe of the liver was computed and the area of the corresponding liver lobe was measured. Animals were excluded if the corresponding data points were deemed outliers by an iterative Grubbs’ test.
Experimental i.v. lung metastasis model.
200,000 KPC cells or 750,000 HPAF-II cells were suspended in PBS and injected i.v. into the tail vein of C57BL/6J or athymic mice, respectively. The following day, mice were randomized into 2 groups: Control (sterile water, i.p.), DON (5 mg/kg, i.p.). After 2 weeks of treatment, lungs were collected in 10% formalin for histological analysis.
PDAC patient-derived organoids
PDAC patient-derived organoids (PDO) were generated at Cold Spring Harbor Laboratory and previously characterized38. PDAC tissue was obtained from patients undergoing surgical resection or tissue biopsy. All tissue donations and experiments were reviewed and approved by the Institutional Review Board of Cold Spring Harbor Laboratory and all clinical institutions. Written informed consent was obtained prior to acquisition of tissue from all patients. The studies were conducted in accordance with recognized ethical guidelines (Declaration of Helsinki). Samples were confirmed to be tumor or normal based on pathologist assessment. For PDO growth assays, cells were resuspended in 100% growth factor–Reduced Matrigel (Corning) and plated as domes overlaid with Human Complete Feeding Medium (hCPLT): advanced DMEM/F12, 10 mmol/L HEPES, 1× Glutamax, 500 nmol/L A83–01, 50 ng/mL hEGF, 100 ng/mL mNoggin, 100 ng/mL hFGF10, 0.01 mmol/L hGastrin I, 1.25 mmol/L N-acetylcysteine, 10 mmol/L Nicotinamide, 1X B27 supplement, 10% (vol/vol) R-spondin1–conditioned medium, 50% (vol/vol) Afamin/Wnt3A conditioned media51,52. PDO viability was evaluated with CellTiter Glo luminescent assay (Promega), following manufacturer instructions. For pharmacotyping, organoids were dissociated into small fragments and approximately one thousand viable cells were plated per well of a 384 well plate in 20 μL 10% Matrigel/ human complete organoid media. Therapeutic compounds were added 24 hours after plating, after the reformation of organoids was visually verified. Each condition was tested in six replicates. Compounds were dissolved in DMSO or PBS. After 5 days, cell viability was assessed using CellTiter-Glo as per the manufacturer’s instruction (Promega) on a plate reader (BioTeck Synergy H1).
Immunohistochemistry
PDAC tumors were fixed in 10% formalin. Fixed tissue was embedded in paraffin and sectioned by the SBP Histology Core. Antigen retrieval was performed by microwave-heating in 10mM sodium citrate (pH 6) and endogenous peroxidases were quenched in 3% hydrogen peroxide. Sections were blocked in 2% BSA, 10% goat serum in PBS for 1 hour at room temperature and incubated with primary antibodies diluted in 2% BSA/PBS overnight at 4°C. For p53 staining a mouse-on-mouse protocol step was included to blocking endogenous mouse IgG. After washes, sections were incubated with biotinylated goat anti-rabbit secondary antibody (1:1000, Vector, BA-1000–1.5) for 1.5 hours at room temperature followed by incubation with the VECTASTAIN Elite ABC HRP Kit (Vector Labs) and the DAB HRP Substrate Kit (Vector Labs). Nuclear counterstaining was performed by hematoxylin staining. Images were captured with a brightfield Olympus CX-31 microscope coupled with INFINITY camera and INFINITY capture software (Lumenera). The following primary antibodies and dilutions were used: ASNS (1:500, ProteinTech, 14681–1-AP), Cleaved caspase 3 (1:1000, CST, 9664), Ki-67 (1:400, ThermoFisher, MA5–14520), p53 (1:2000, CST, 2524) and phospho Histone H3 (1:200, CST, 9701). For the pHis-H3 and Ki-67 staining quantification, the number of pHis-H3- or Ki-67-positive nuclei per image field was determined.
Metabolite quantification
For quantification of polar metabolites in cell lysates, KPC74, PaTu 8988T and 779E cells were seeded in 6 well plates and treated with DON for 24h at the indicated concentrations. Experiments were run in 3–5 replicate wells and extra wells were used for cell counting and protein quantification for normalization. After treatment cells were washed 3X with cold PBS and extracted with ice-cold 50% Methanol/ 20uM L-Norvaline followed by addition of chloroform, mixing by vortex and centrifugation at 21,000 × g for 5 min at 4°C. The top layer was dried using a Speedvac, derivatized and analyzed using gas chromatography–mass spectrometry (GC–MS) to quantify small polar metabolites. For quantification of tumor Asn, PaTu 8988T tumors treated with vehicle, DON, ASNase or combination of DON + ASNase were collected and flash-frozen in liquid nitrogen. 20–30 mg of tissue samples was transferred to 2-mL tubes containing 2.8 mm ceramic beads (Omni International) and 0.45 ml ice-cold 50% methanol/ 20 mM L-norvaline. Tubes were shaken (setting 5.5) for 30 s on a Bead Ruptor 12 (Omni International), and quickly placed on ice. Samples were centrifuged at 15,000 × g for 10 min at 4°C. The supernatant was then transferred to a new tube, mixed with chloroform, and processed in the same way as described for the cell lysates. A colorimetric glutamine assay kit (Abcam) was used to quantify glutamine in the media following treatment with ASNase or vehicle.
RNA extraction and quantitative real time PCR (qPCR)
Total RNA was extracted from cells or tumor tissue with the PureLink RNA Mini Kit (Thermo Fisher Scientific). For quantitative real time PCR (qPCR), cDNA was synthesized from 1000 ng of total RNA using the High-Capacity cDNA Reverse Transcription Kit (Thermo Fisher Scientific). cDNA samples were diluted 1:10 in RNAse free water. qPCR was performed in triplicates with the SYBR Premix Taq II master mix (Takara) and specific primers on the LightCycler 96 (Roche). Relative target gene expression was determined by comparing average threshold cycles (CT) with that of housekeeping genes (18s or Rpl13) by the delta-delta CT method. The following primers were used in this study: mASNS-F: CCTCTGCTCCACCTTCTCT; mASNS-R: GATCTTCATCGCACTCAGACA; hASNS-F: GAGTCAGACCTTTGTTTAAAGCA; hASNS-R: GGAGTGCTTCAATGTAACAAGAC; 18s-F: GTAACCCGTTGAACCCCATT; 18s-R: CCATCCAATCGGTAGTAGCG; hRPL13-F: GTTCGGTACCACACGAAGGT; hRPL13-R: TGGGGAAGAGGATGAGTTTG
Immunoblotting
Cells were lysed in RIPA buffer (10mM Tris-HCl [pH 8.0], 150mM NaCl, 1% sodium deoxycholate, 0.1% SDS, 1% Triton X-100) with protease and phosphatase inhibitors (Roche). Protein concentrations were measured using the DC Protein Assay Kit (Bio-Rad). 15–20 μg protein samples were run in SDS–PAGE followed by protein transfer using Mini Gel Tank and Mini Blot Module (Life Technologies). Immunoblotting was detected using near-infrared fluorescence (LI-COR) and the Odyssey CLx imager (LI-COR). The following primary antibodies were used: ASNS (Proteintech, 1:500), Tubulin (Sigma T6074, 1:10000), and β-actin (Sigma, A1978, 1:20000). The band fluorescence intensities were quantified with ImageStudio Lite software (LI-COR).
siRNA and plasmid transfection
Cells were transfected in 6-well plates with Lipofectamine RNAiMax Transfection reagent (ThermoFisher Scientific) and murine Asns-targeting siRNA (s7704 and s7705, ThermoFisher Scientific) or negative control siRNA (siNC) at a final concentration of 25nM following manufacturer’s protocol. After 24h, transfected cells were trypsinized and seeded into 96-well plate format for DON treatment experiments. ASNS overexpression was achieved via transfection of a murine ASNS expression vector under a CMV6 promoter (MC200523, OriGene). Cells were transfected in 6-well plates with Lipofectamine 2000 (ThermoFisher Scientific) and 2.5ug of DNA (ASNS or empty vector). After 3–7 days selection with 2mg/ml G418, cells were seeded in 96 well for DON treatment.
Cell number quantification by crystal violet staining
Cells were seeded in complete culture media at a density of 5000 to 10,000 cells per well in 96-well format. 24 to 48h after seeding, cells were treated with variable concentrations of DON as indicated. For the dose response assays, cells were treated for 48h. For co-treatments of DON and ASNase or rescue metabolites, compounds were added at the same time for 24h. At the indicated timepoints, cells were fixed with 4% paraformaldehyde and stained with 0.5% crystal violet, thoroughly washed, and dried overnight. The crystal violet plates were scanned, and relative cell number was calculated using quantification of the stained area with ImageJ software. Three replicates per condition were used in each experiment. The coefficient of drug interaction (CI) was calculated as: CI = AB/(A×B). Where AB is the ratio of the combination groups to control group; A or B is the ratio of the single agent group to control group.
Statistics and reproducibility
All graphs and statistical analysis were done using GraphPad Prism software version 9 (GraphPad). Results are shown as means ± standard error of the mean (SEM) unless otherwise indicated. Statistical significance was determined by the unpaired two-tailed Student’s t test with Welch’s correction, when appropriate. Comparison of more than 2 groups was done by one-way ANOVA followed by Tukey or Dunnet test for multiple comparisons. P values lower than .05 were considered statistically significant. The number of mice with metastases was compared using a chi square test. Throughout, *P<0.05, **P<0.01, ***P<0.001, ****P<0.0001, and ns=not significant. In some instances we have indicated P<0.0001 as the exact P value since for some statistical tests where the P value is extremely small, GraphPad Prism did not provide an exact P value. Data collection and analysis were not performed blind to the conditions of the experiments. Data met the assumptions of the statistical tests used, and normality and equal variances were formally tested. No statistical methods were used to pre-determine sample sizes but our sample sizes are similar to those reported in previous publications6.
Extended Data
Extended Data Fig. 1. DON treatment minimally affects animal body weight and tumor cell apoptosis, but significantly impacts tumor cell proliferation.
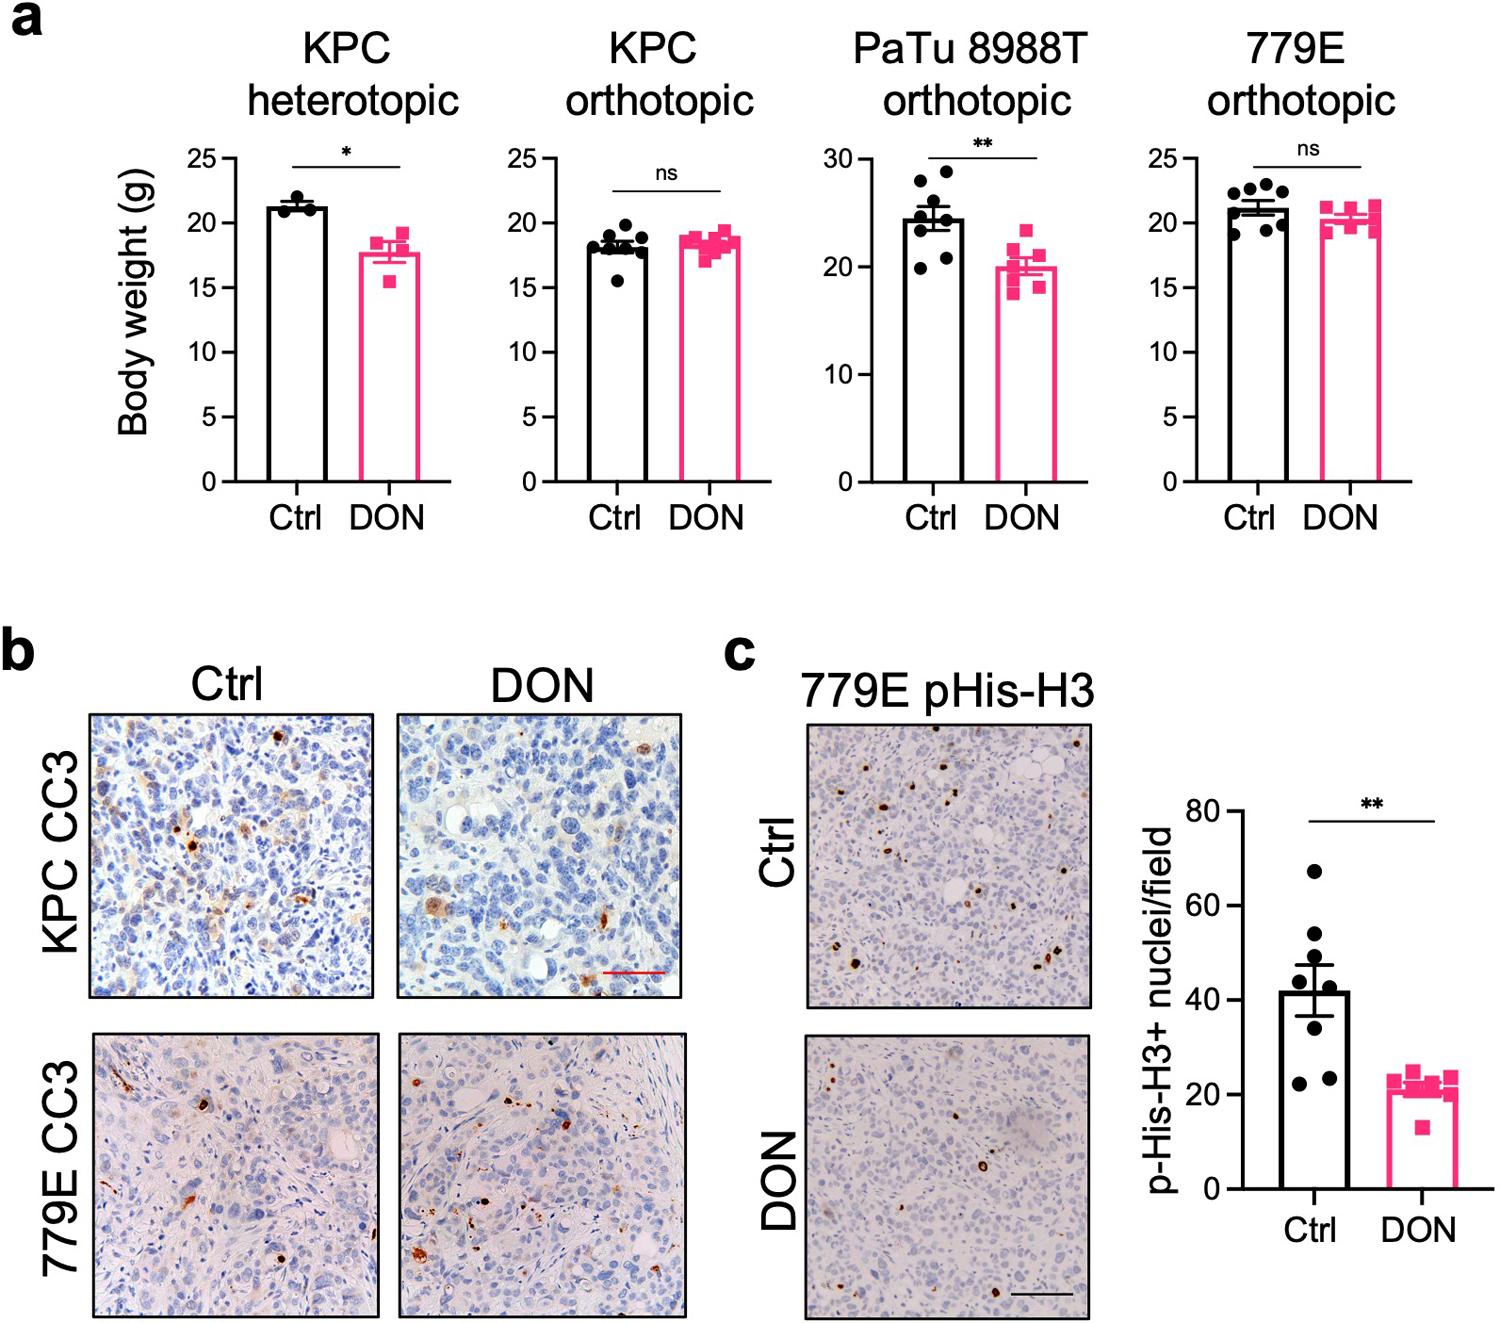
a) Body weights of mice bearing subcutaneous or orthotopic PDAC tumors after treatment with vehicle (Ctrl) or DON. Data are presented as mean ± SEM. KPC heterotopic (n=4, P=0.0167), KPC orthotopic (n=8 and n=9, P=0.6737), PaTu 8988T orthotopic (n=7, P=0.0078), and 779E orthotopic (n=8 and n=7, P=0.2302).
b) Immunohistochemical staining of the apoptosis marker Cleaved Caspase 3 (CC3) in KPC and 779E orthotopic tumors treated with vehicle (Control) or DON (10mg/kg). Representative images are shown of n=3 independent experiments. Red scale bar 50 μm.
c) Immunohistochemical staining of the proliferation marker pHis-H3 in 779E orthotopic tumors treated with vehicle (Control) or DON (10mg/kg). Representative images are shown. Scale bar 100 μm. Quantification of pHis-H3-positive nuclei/ image field is shown as mean ± SEM of n=4 tumors per group. P=0.0057.
Statistical significance was calculated using unpaired two-tailed Student’s t test (a,c). *P<0.05, **P<0.01, ns=not significant.
Extended Data Fig. 2. DON suppresses lung micrometastases in an i.v. injection mouse model.
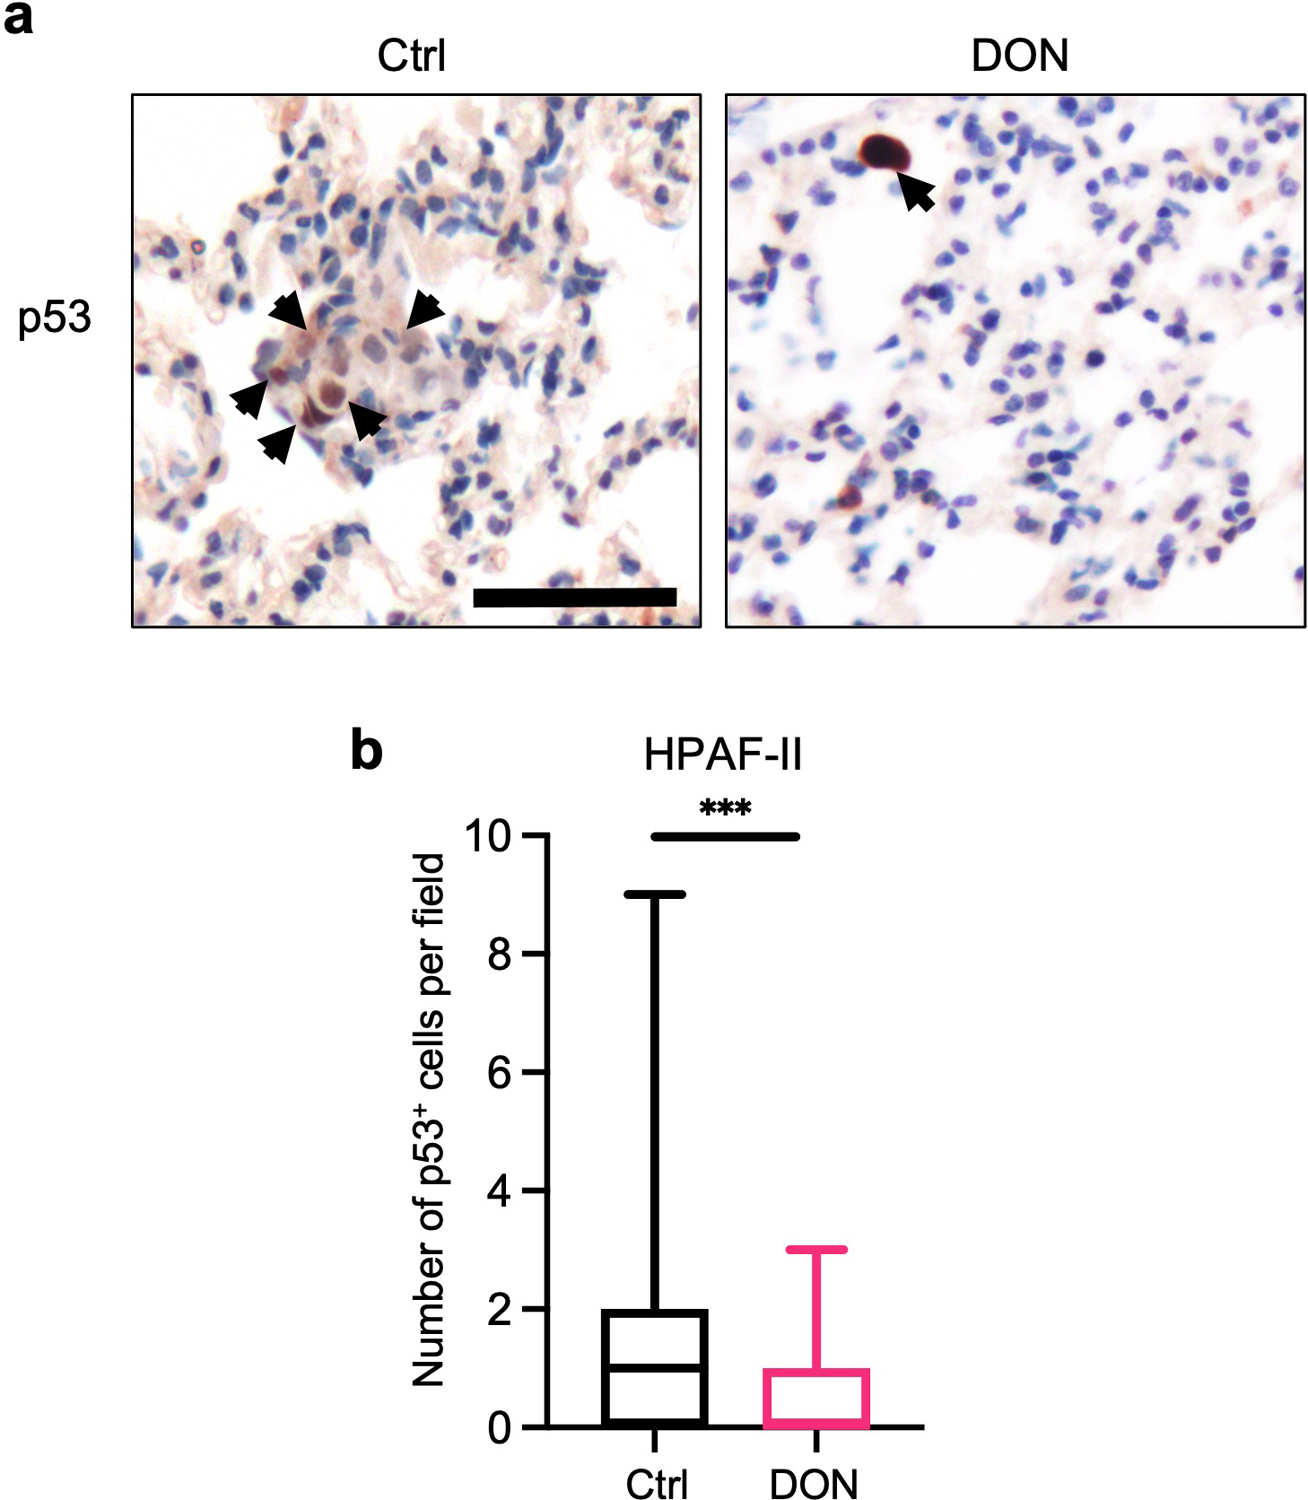
a) Immunohistochemical staining of p53 in lung tissue sections derived from animals i.v. injected with human HPAF-II cells. Representative images are shown. Black arrows indicate p53+ cells. Scale bar 50 μm
b) Quantification of p53 staining in lung tissue sections. Data are presented as Min to Max box-and-whisker plot with median indicated at center line for n=64 or n=77 images per condition (Ctrl, DON) from a total of 4 or 5 mice per group (Ctrl, DON; P=0.0002). Statistical significance was calculated using unpaired two-tailed Student’s t test. ***P<0.001.
Extended Data Fig. 3. DON dose response curves and IC50 determinations for a panel of PDAC cells.
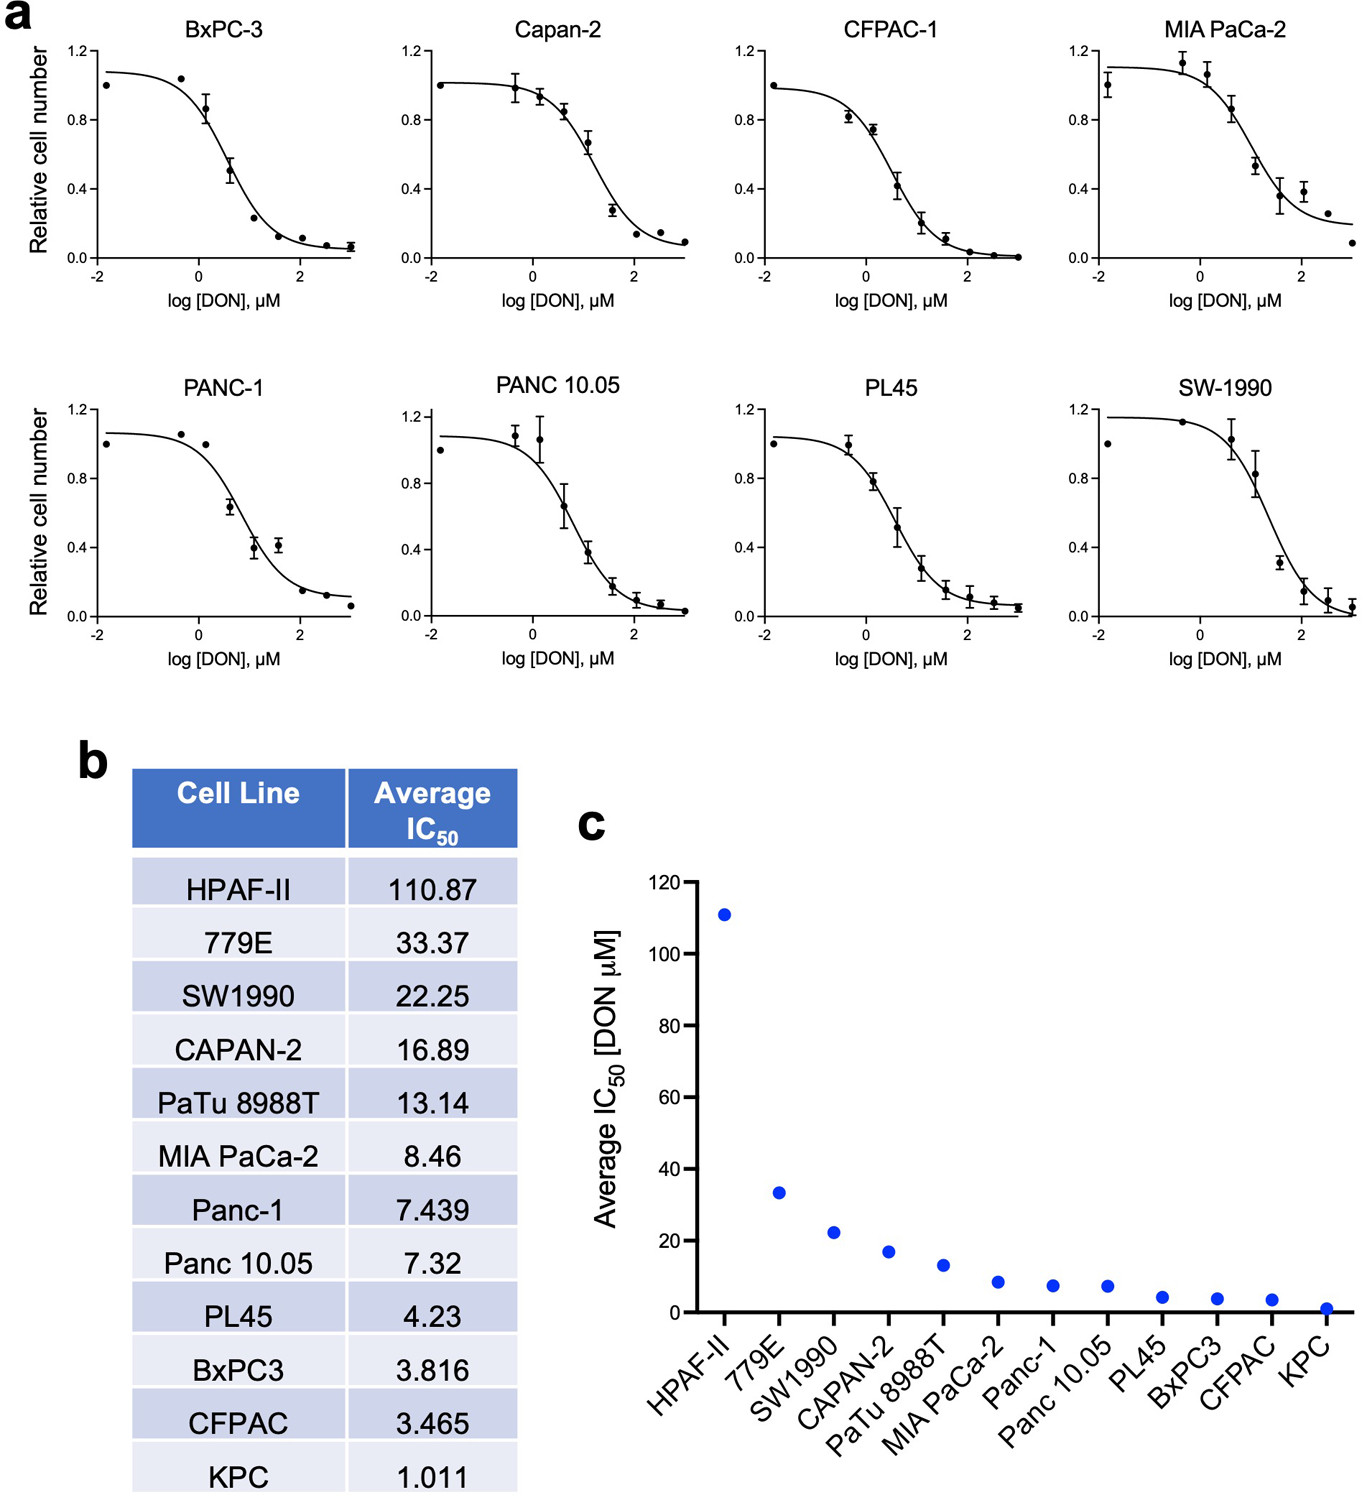
a) DON dose response curves for the indicated human PDAC cell lines. Data are presented relative to the untreated control condition and are representative of 3 independent experiments (MIA PaCa-2) or an average of 3 independent experiments (BxPC-3, Capan-2, CFPAC-1, PANC-1, PANC 10.05, PL45, SW-1990). Each independent experiment was performed with 3 replicates per condition. Data are presented as mean ± SEM.
b) Summary of the average IC50 from at least 3 independent experiments for each of the cell lines indicated.
c) Graphical representation of the average IC50 values presented in b).
Extended Data Fig. 4. Effects of DON on cell fitness are selectively rescued by asparagine supplementation.
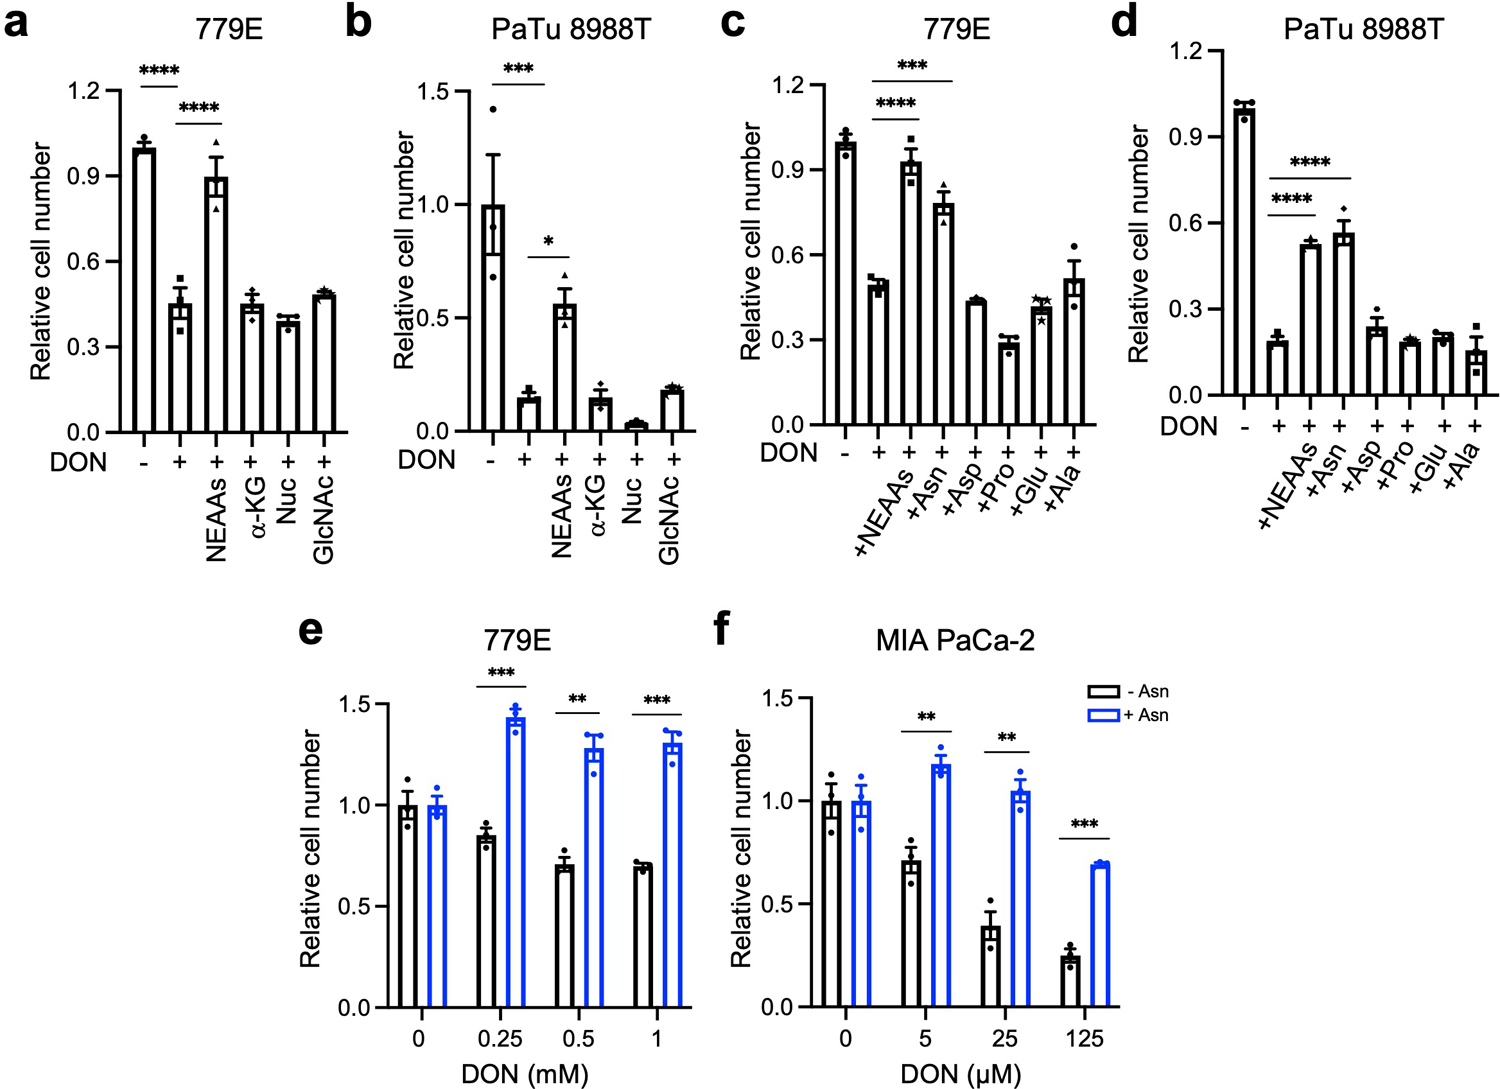
a), b) Relative number of 779E (a) or PaTu 8988T (b) cells treated with or without DON (1mM or 10μM, respectively) with supplementation of the indicated metabolites for 24h. Cells were stained with crystal violet and stained area was quantified. Data are presented relative to untreated control for each condition and are representative of 3 independent experiments. Data are presented as mean ± SEM of triplicate wells. 779E cells: Ctrl(-DON) vs Ctrl(+DON), P<0.0001; Ctrl(+DON) vs NEAAs, P<0.0001. PaTu 8988T cells: Ctrl(-DON) vs Ctrl(+DON), P=0.0002; Ctrl(+DON) vs NEAAs, P=0.0366.
c), d) Relative number of 779E (c) or PaTu 8988T (d) cells treated with or without DON (1mM or 10μM, respectively) supplemented with a cocktail of NEAAs or the indicated individual amino acids (0.1mM) for 24h. Data are presented relative to untreated control for each condition and are representative of 3 independent experiments. Data are presented as mean ± SEM of triplicate wells. 779E cells: Ctrl(+DON) vs NEAAs, P<0.0001; Ctrl(+DON) vs Asn, P=0.0001. PaTu 8988T cells: For all statistical comparisons, P<0.0001.
e), f) Relative number of 779E cells (e) or MIA PaCa-2 cells (f) treated with DON at the indicated concentrations with or without 0.1mM Asn supplementation. Data are presented relative to untreated control for each condition and are representative of 3 independent experiments. Data are presented as mean ± SEM of triplicate wells. 779E cells: 0.25mM, P=0.0004; 0.5mM, P=0.0014; 1mM, P=0.0004. MIA PaCa-2 cells: 5μM, P=0.0033; 25μM, P=0.0016; 125μM, P=0.0002.
Statistical significance was calculated using One-way ANOVA followed by Dunnet’s multiple comparisons test (a-d) or unpaired two-tailed Student’s t test (e,f). *P<0.05, **P<0.01, ***P<0.001, ****P<0.0001.
Extended Data Fig. 5. DON treatment affects polar metabolite pools.
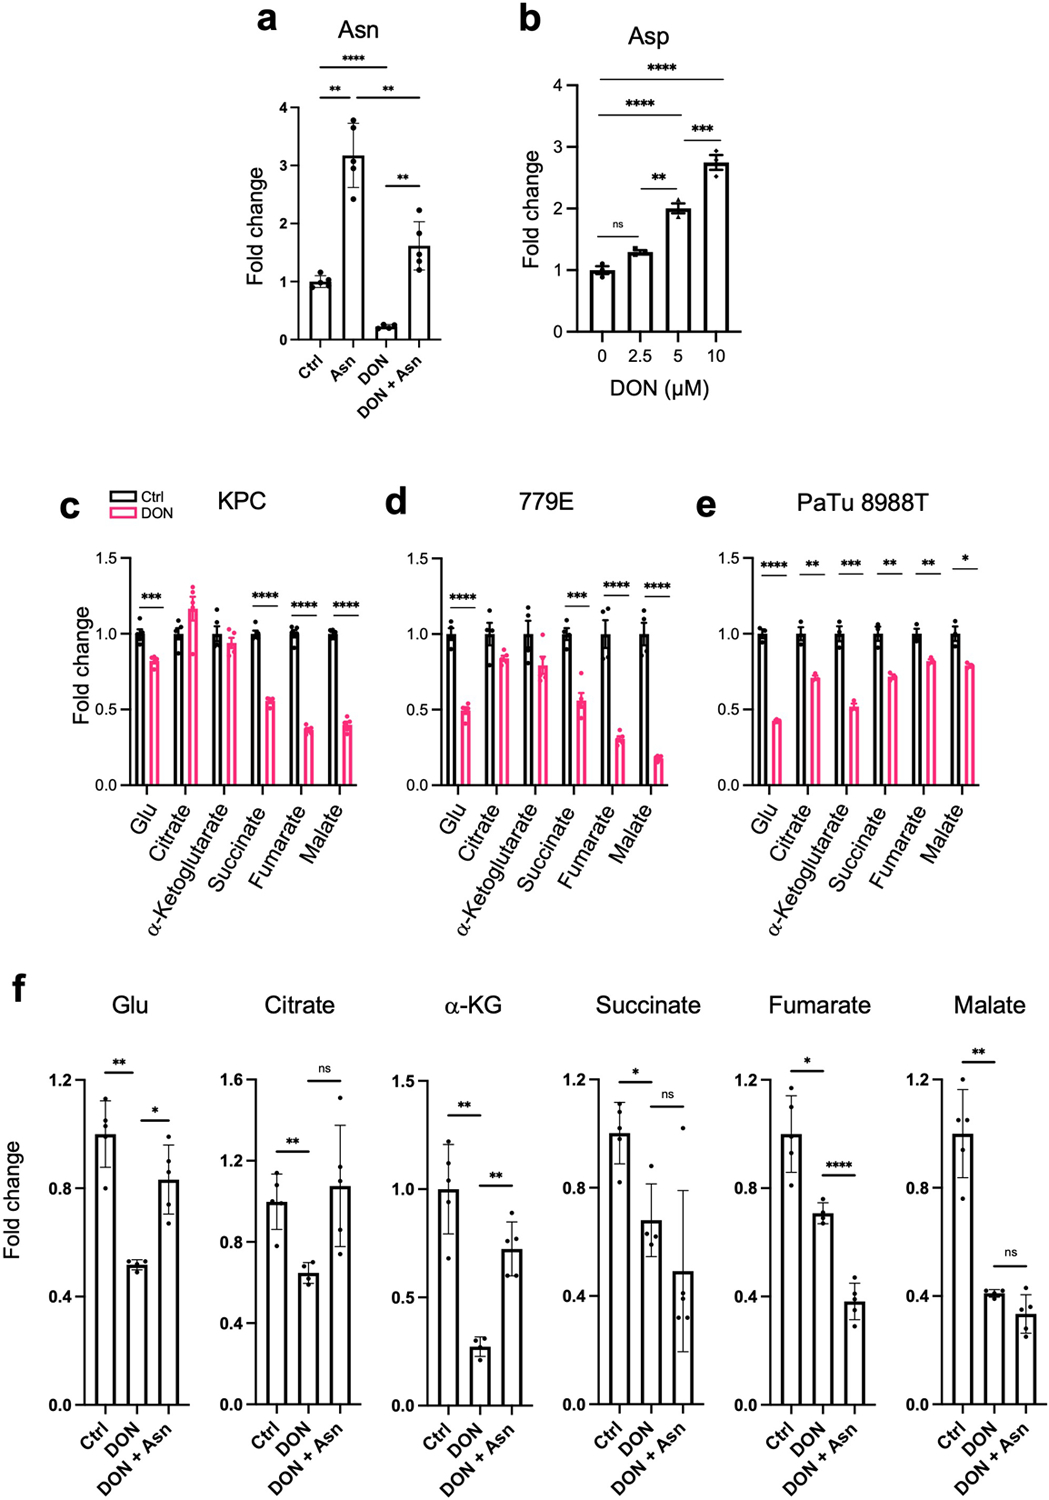
a) Quantification of intracellular asparagine (Asn) levels in KPC cells treated with or without 10μM DON and supplemented with or without 0.1 mM Asn for 24h. Data are presented relative to untreated control that lacks Asn supplementation. Data are presented as mean ± SEM of at least n=4 samples. Ctrl vs Asn, P=0.0043. Ctrl vs DON, P<0.0001. Asn vs DON+Asn, P=0.0078. DON vs DON+Asn, P=0.0074.
b) Quantification of intracellular aspartate (Asp) levels in PaTu 8988T cells treated with or without DON at the indicated concentrations for 24h. Data are presented relative to untreated control. Data are presented as mean ± SEM of n=3 samples. 0 vs 2.5μM, P=0.1163. 2.5μM vs 5μM, P=0.0011. 5μM vs 10μM, P=0.0008. For all other statistical comparisons, P<0.0001.
c-e) Quantification of intracellular levels of the indicated metabolites in KPC (c), 779E (d) or PaTu 8988T (e) cells treated with vehicle control or DON (10μM, 10μM, and 1mM, respectively) for 24h. Data are presented relative to untreated control. Data are presented as mean ± SEM of n=5 samples (c,d) and n=3 samples (e). KPC cells: Glu, P=0.0006. 779E cells: Succinate, P=0.0003. PaTu 8988T cells: Citrate, P=0.0032. α-Ketoglutarate, P=0.0009. Succinate, P=0.0046. Fumarate, P=0.0074. Malate, P=0.013. For all other statistical comparisons, P<0.0001.
f) Quantification of intracellular levels of the indicated metabolites in KPC cells treated with vehicle control, 10μM DON and 10μM DON supplemented with 0.1 mM Asn for 24h. Data are presented relative to untreated control. Data are presented as mean ± SEM of at least n=4 samples. Glu: Ctrl vs DON, P=0.0018. DON vs DON+Asn, P=0.0102. Citrate: Ctrl vs DON, P=0.0060. DON vs DON+Asn, P=0.0621. α-Ketoglutarate: Ctrl vs DON, P=0.0029. DON vs DON+Asn, P=0.0012. Succinate: Ctrl vs DON, P=0.0166. DON vs DON+Asn, P=0.4256. Fumarate: Ctrl vs DON, P=0.0129. DON vs DON+Asn, P<0.0001. Malate: Ctrl vs DON, P=0.0024. DON vs DON+Asn, P=0.1399.
Statistical significance was calculated using unpaired two-tailed Student’s t test (a, c-f) or one-way ANOVA followed by Dunnet’s multiple comparisons test (b). *P<0.05, **P<0.01, ***P<0.001, ****P<0.0001, ns=not significant.
Extended Data Fig. 6. Determinations of ASNS expression levels using qPCR, immunohistochemistry, and immunoblotting.
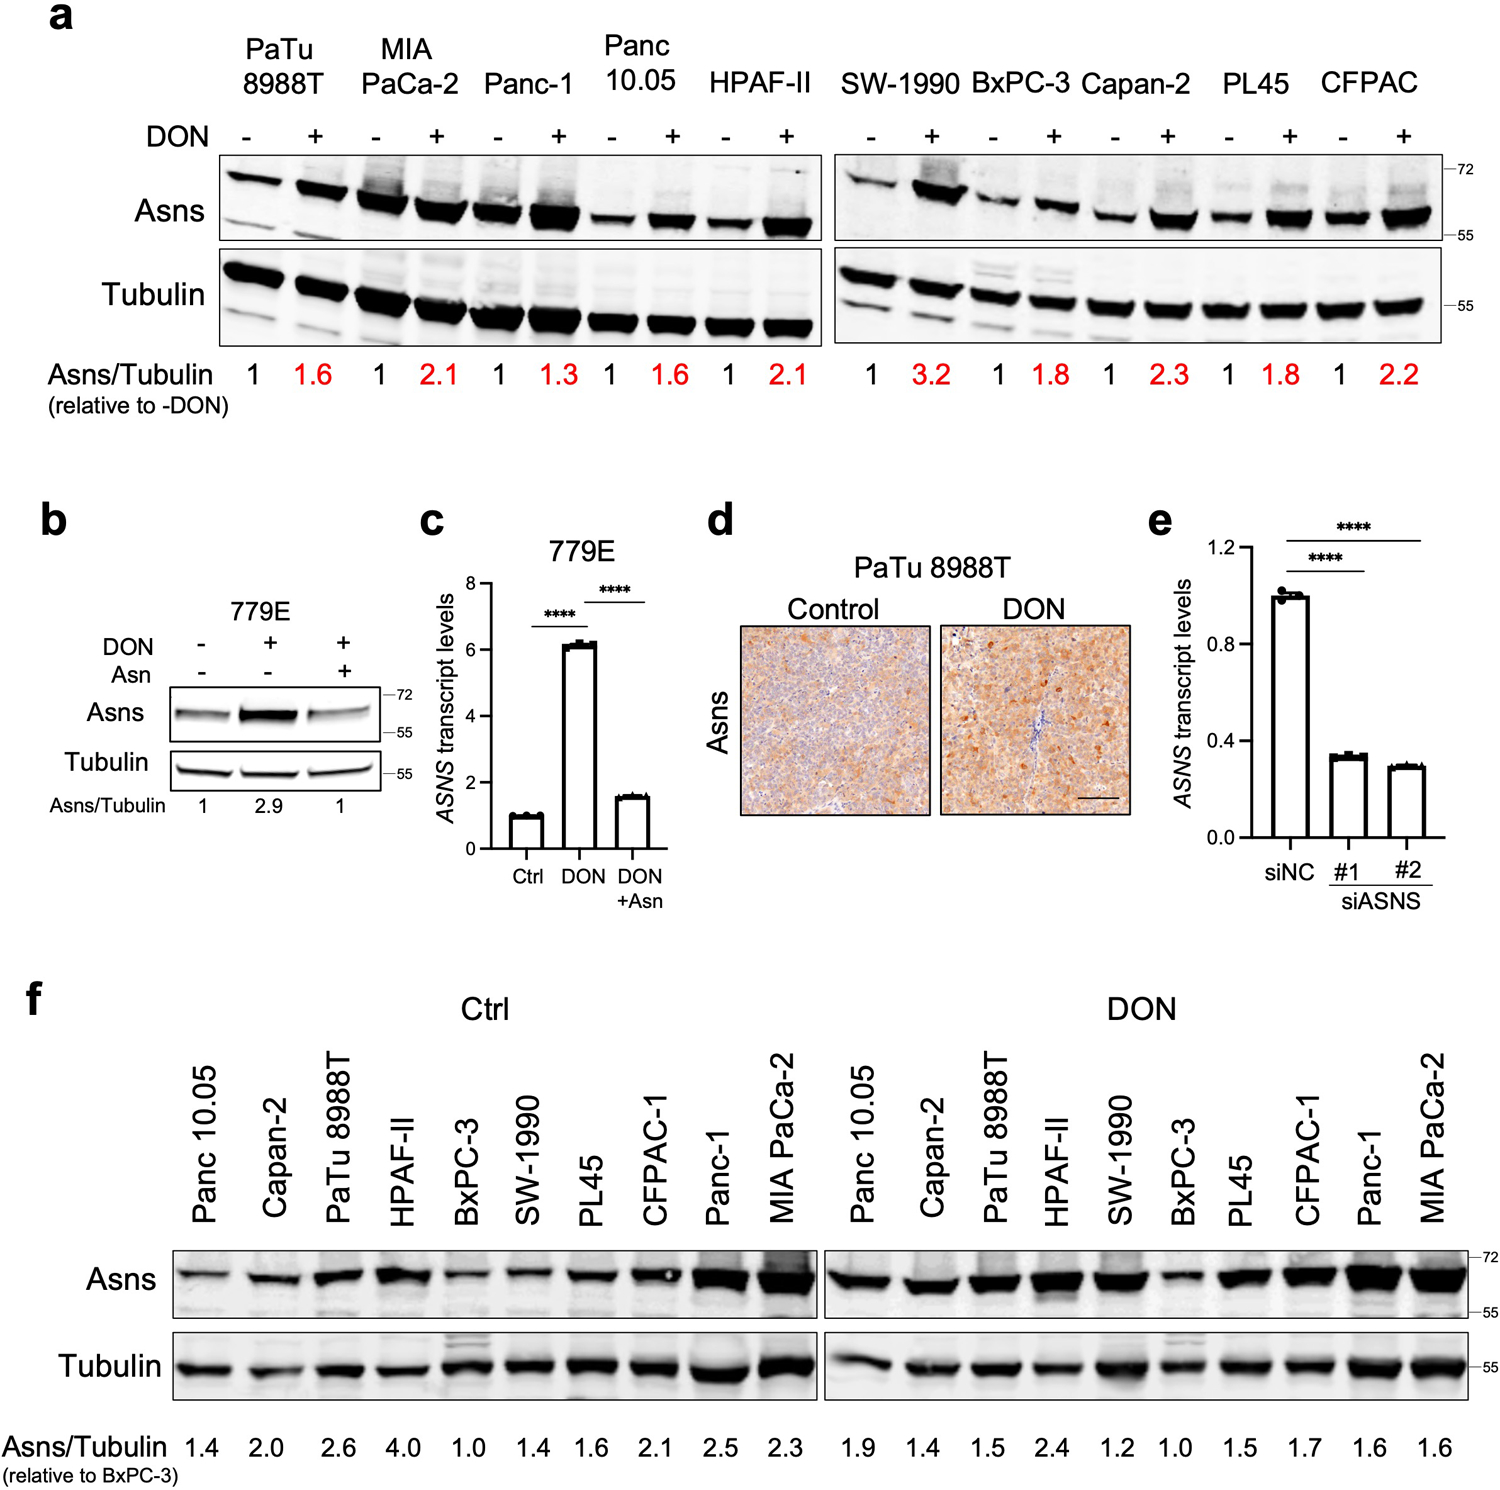
a) Immunoblot assessing Asns protein levels in the indicated human PDAC cell lines treated with or without 10μM DON for 24h. Tubulin was used as a loading control. The results are representative of 2 independent experiments. Densitometry quantifications are presented relative to the vehicle only (-DON) condition and values were normalized to the loading control.
b) Immunoblot assessing Asns protein expression in 779E cells treated with 0.5mM DON with or without 0.1mM Asn supplementation for 24h. Tubulin was used as a loading control.
c) Relative ASNS mRNA expression levels as assessed by qPCR in 779E cells treated with 0.5mM DON with or without 0.1mM Asn supplementation for 24h. Data are presented relative to untreated control and are representative of 3 independent experiments. Data are presented as mean ± SEM of n=3 replicates. For all statistical comparisons P<0.0001.
d) Immunohistochemical staining of Asns protein in PaTu 8988T orthotopic tumors treated with vehicle control (Control) or DON (5mg/kg). Representative images of n=4 mice per group are shown. Scale bar, 100μm.
e) Relative ASNS mRNA expression levels in KPC cells as assessed by qPCR after transfection with non-targeting negative control siRNA (siNC) or two different hairpins targeting ASNS (siASNS#1 and siASNS#2) for 24h. Data are presented relative to siNC control and are representative of 3 independent experiments. Data are presented as mean ± SEM of n=3 replicates. For all statistical comparisons P<0.0001.
f) Immunoblot assessing Asns protein levels in the indicated human PDAC cell lines treated vehicle (Control) or 10μM DON for 24h. Tubulin was used as a loading control. The results are representative of 2 independent experiments. Densitometry quantifications are presented relative to the values obtained for BxPC-3 cells and were normalized to the loading control.
Statistical significance was calculated using One-way ANOVA followed by Tukey’s multiple comparisons test. ****P<0.0001.
Extended Data Fig. 7. DON and ASNase co-treatment in 779E cells, glutamine quantification, and correlation analyses for DON target genes in PDOs.
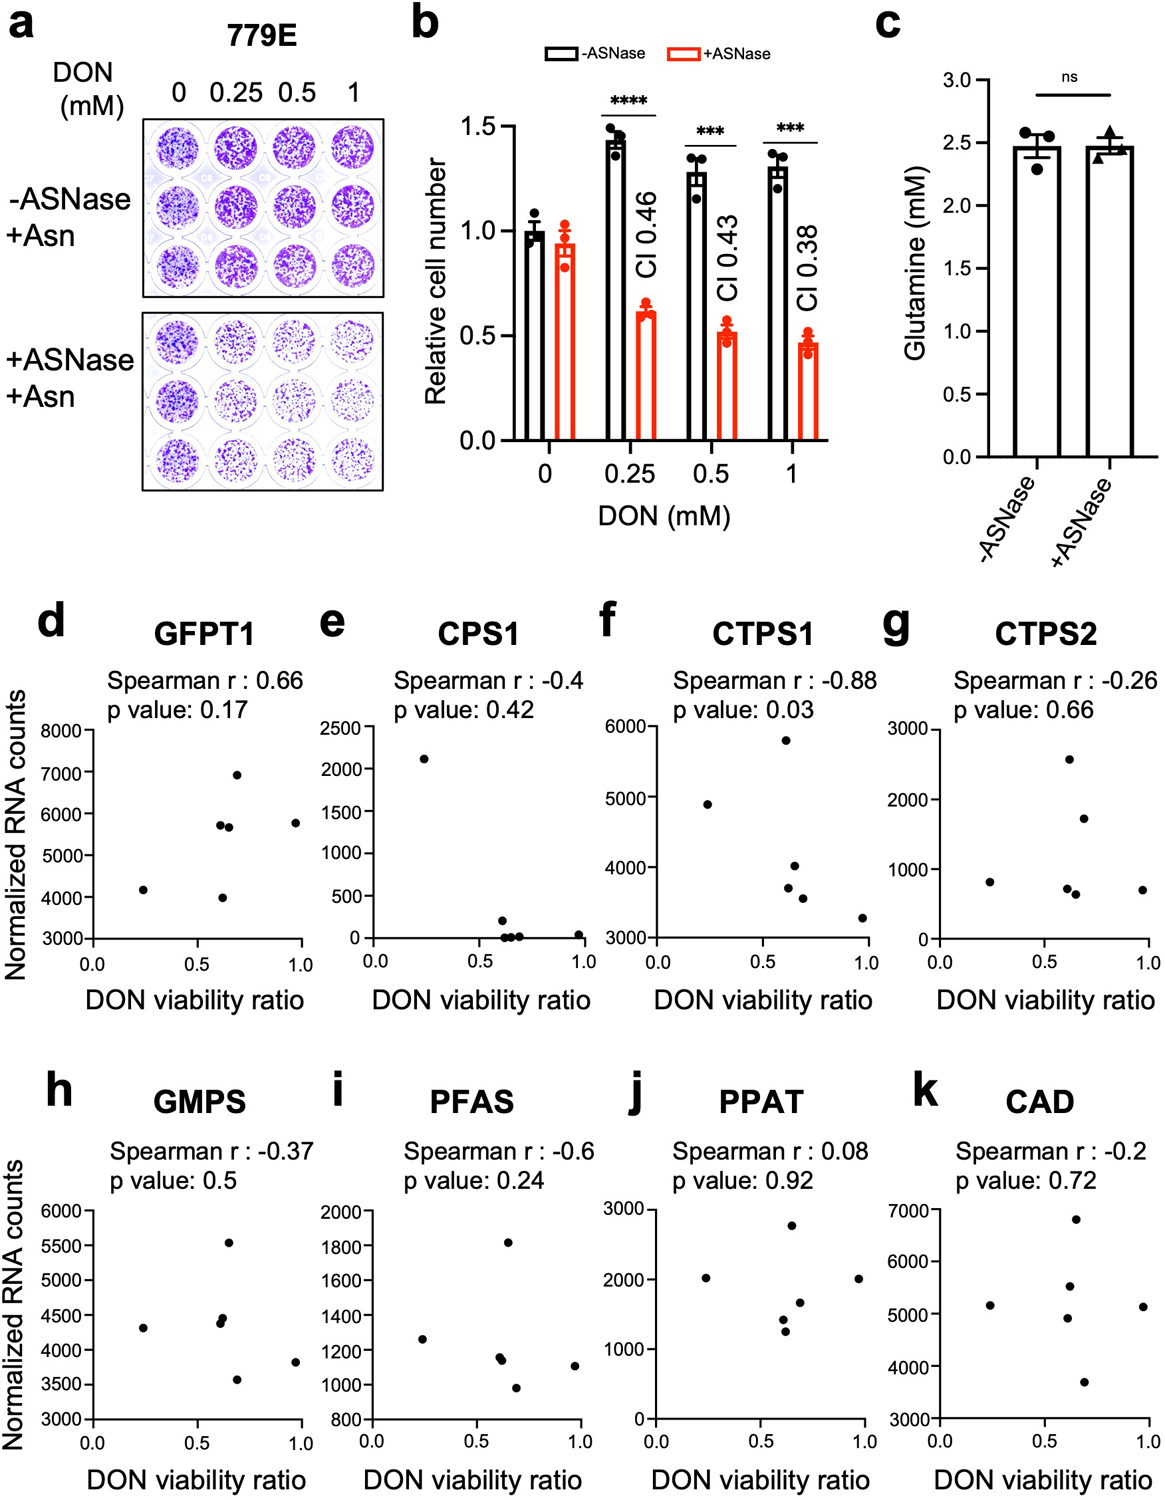
a,b) Relative number of 779E cells treated with the indicated doses of DON in combination with ASNase (0.5U/ml) for 24h. Cells were stained with crystal violet and representative images are shown. Quantification of crystal violet staining is shown relative to untreated control and is representative of two independent experiments. The coefficient of drug interaction (CI) was calculated for each DON concentration (shown in graph). Data are presented as mean ± SEM of n=3 replicate wells. 0.25mM, P<0.0001. 0.5mM, P=0.0004. 1mM, P=0.00017.
c) Determination of the glutamine concentration in cell culture media incubated with or without 0.5U/mL ASNase for 24 hours. Data are presented as mean ± SEM of n=3 replicate samples.
d-k) Correlation analysis between normalized gene expression of the indicated enzymes targeted by DON and DON viability ratio for the six PDOs assessed.
Statistical significance was calculated using unpaired two-tailed Student’s t test (b,c) or two-tailed Spearman correlation coefficient (d-k). ***P<0.001, ****P<0.0001, ns=not significant.
Extended Data Fig. 8. Co-treatment with DON and ASNase does not further impact apoptosis or proliferation in tumors but does suppress liver metastases.
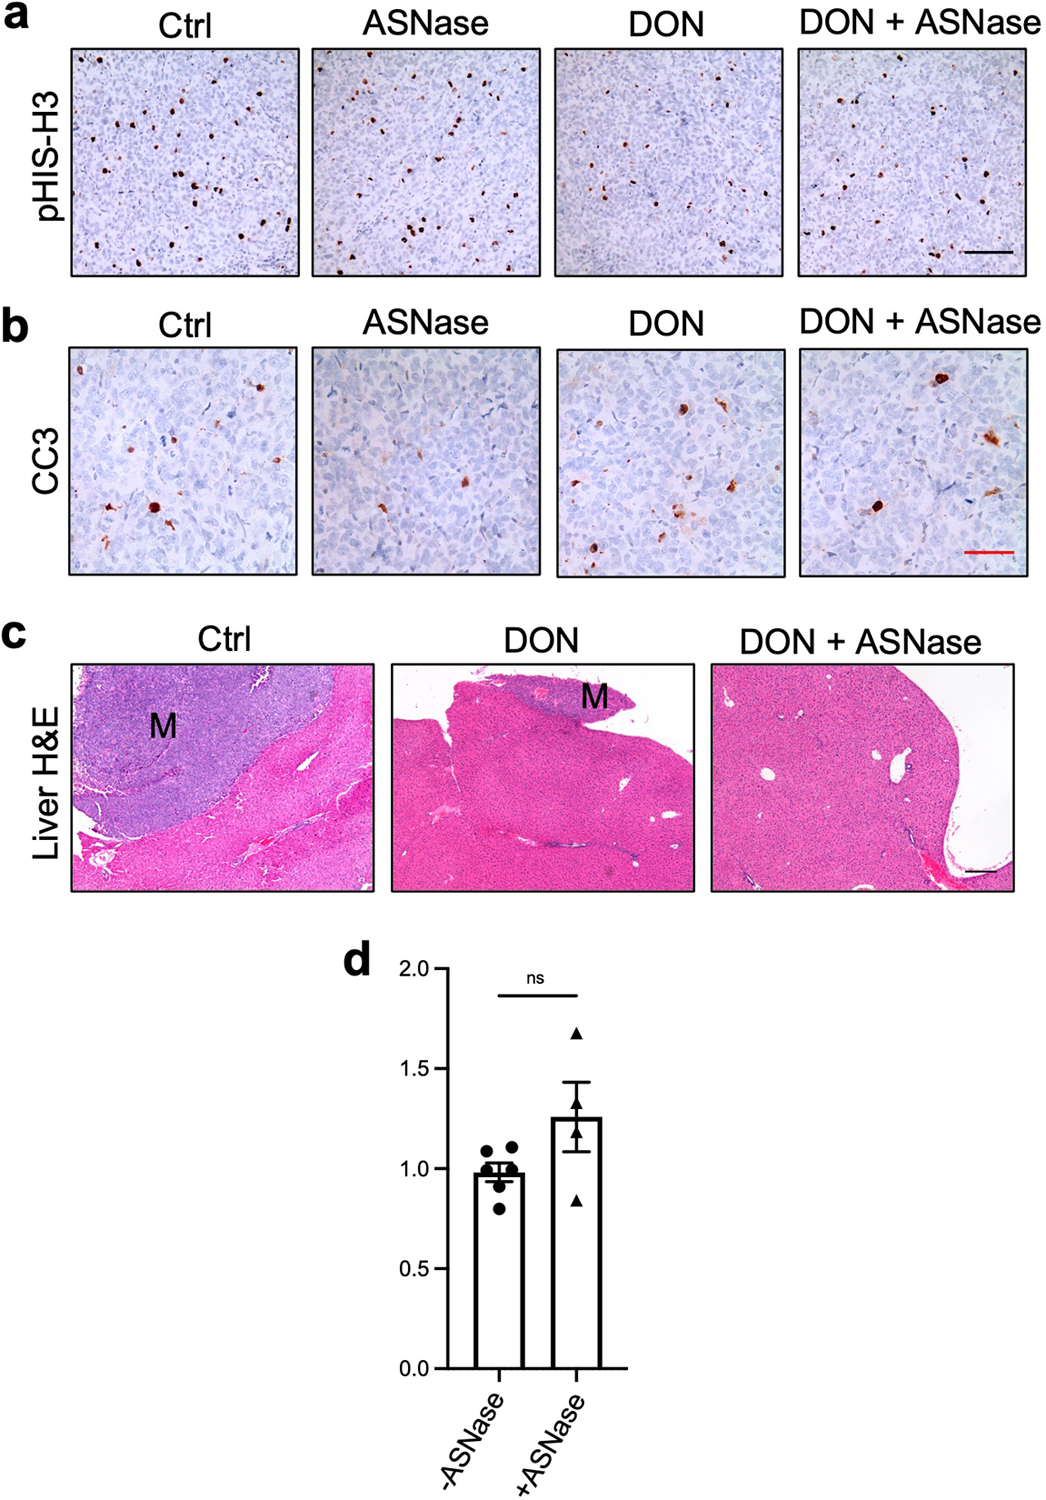
a), b) Immunohistochemical staining of phospho-Histone H3 (pHis-H3; a) or cleaved Caspase 3 (CC3; b) in PaTu 8988T orthotopic tumors treated with vehicle (Control), ASNase (60U/mice), DON (5–10mg/kg), or a combination of DON + ASNase for 3 weeks. Representative images are shown of n=3 independent experiments. Scale bar 100 μm.
c) Hematoxylin and Eosin (H&E) staining of liver sections from PaTu 8988T tumor-bearing mice treated with vehicle (Control), DON (5–10mg/kg), or a combination of DON + ASNase for 3 weeks. Metastases are indicated (M). Representative images are shown of n=3 independent experiments. Scale bar 200 μm.
d) Determination of the glutamine plasma concentration in animals treated with vehicle (Control) or ASNase (60U/mouse) for 3 weeks. Data are presented as mean ± SEM of n=6 or n=4 mice. Statistical significance was calculated using unpaired two-tailed Student’s t test. P=0.2093. ns=not significant.
Extended Data Fig. 9. Suppression of metastasis by DON is enhanced by co-treatment with ASNase in a primary PDAC orthotopic mouse model.
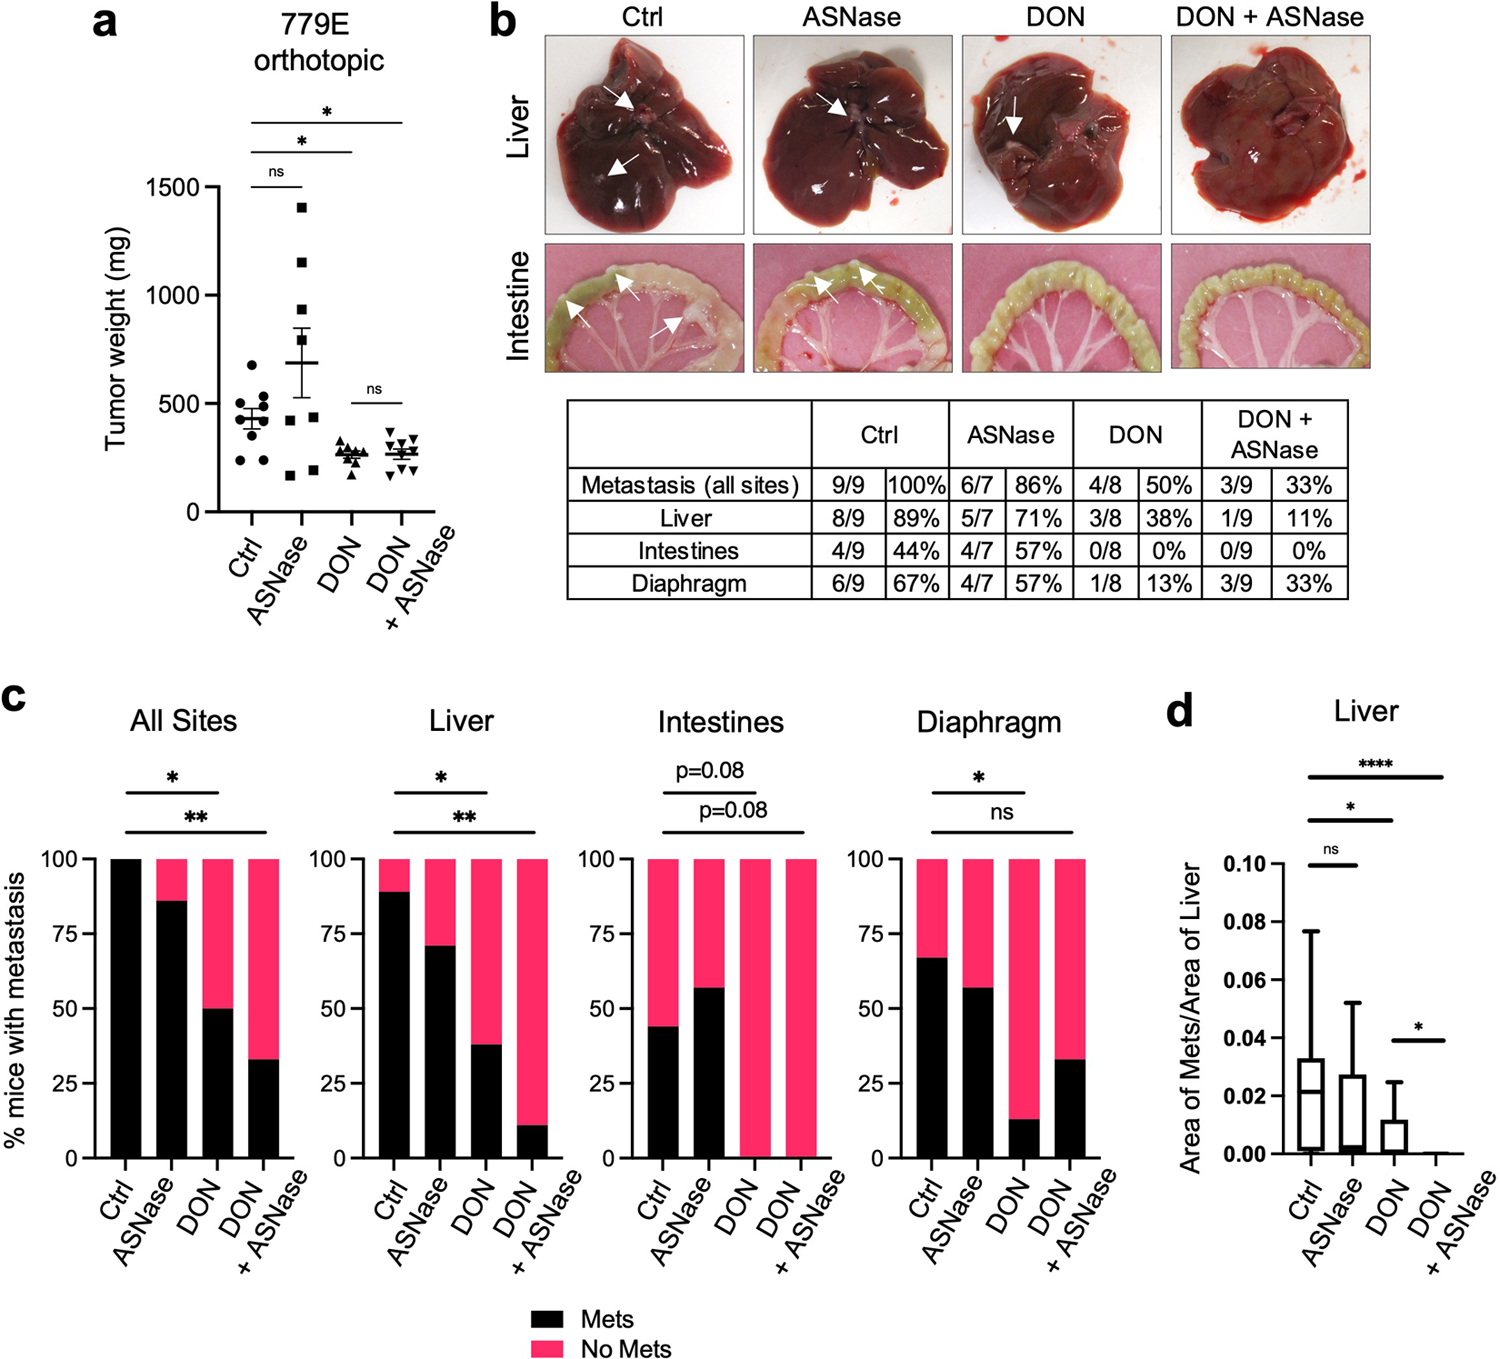
a) Tumor weights of 779E orthotopic tumors from animals treated with vehicle (Ctrl), ASNase (3U/g), DON (5mg/kg), or combination of DON + ASNase for 2 weeks. Data are presented as mean ± SEM of n=9, n=7, n=8, or n=9 mice per group. Ctrl vs ASNase, P=0.5836. Ctrl vs DON, P=0.042. Ctrl vs DON+ASNase, P=0.0491.
b) Characterization of macrometastases in animals with 779E orthotopic tumors treated as indicated. Representative images of macrometastases in the different tissues are shown. The white arrows point to macrometastases. The number of mice with macrometastases in each organ site was quantified as indicated in the table. n=9, n=7, n=8, or n=9 mice per group.
c) Quantification of the percentage of mice with 779E-derived primary orthotopic tumors that presented with macrometastases to any organ (all sites), the liver, intestines, or diaphragm. n=9, n=7, n=8, or n=9 mice per group. All Sites: Ctrl vs DON, P=0.029; Ctrl vs DON+ASNase, P=0.009. Liver: Ctrl vs DON, P=0.0498; Ctrl vs DON+ASNase, P=0.0034. Diaphragm: Ctrl vs DON, P=0.0498; Ctrl vs DON+ASNase, P=0.347.
d) Quantification of the metastatic tumors in the liver using image-based computation. The total area of tumor tissue per area of liver tissue was determined. Data are presented as Min to Max box-and-whisker plot with median indicated at center line for n=16, n=14, n=12, or n=18 images per condition from a total of 9, 7, 6 or 9 mice per group. Ctrl vs ASNase, P=0.347. Ctrl vs DON, P=0.016. Ctrl vs DON+ASNase, P<0.0001. DON vs DON+ASNase, P=0.013.
Statistical significance was calculated using one-way ANOVA followed by Tukey’s multiple comparisons (a), two-tailed chi-square test (c), or unpaired two-tailed Student’s t test (d). *P<0.05, **P<0.01, ***P<0.001, ****P<0.0001, ns=not significant.
ACKNOWLEDGEMENTS
We are grateful to members of the Commisso laboratory for their helpful comments and discussions. This work was supported by an American Cancer Society Discovery Boost Grant (DBG-22-172-01-TBE) and NIH grants R01CA254806 and R01CA207189 to C.C. Sanford Burnham Prebys Medical Discovery Institute core services are supported by NCI Cancer Center Support grant P30CA030199.
Footnotes
COMPETING INTERESTS STATEMENT
The authors declare no competing interests.
DATA AVAILABILITY
All data supporting the findings of this study are available within the paper and its Supplementary Information. Source Data files for Fig. 1–6 and Extended Data Fig. 1–9 have been provided.
REFERENCES
- 1.Son J et al. Glutamine supports pancreatic cancer growth through a KRAS-regulated metabolic pathway. Nature 496, 101–105 (2013). 10.1038/nature12040 [DOI] [PMC free article] [PubMed] [Google Scholar]
- 2.Lyssiotis CA, Son J, Cantley LC & Kimmelman AC Pancreatic cancers rely on a novel glutamine metabolism pathway to maintain redox balance. Cell Cycle 12, 1987–1988 (2013). 10.4161/cc.25307 [DOI] [PMC free article] [PubMed] [Google Scholar]
- 3.Cluntun AA, Lukey MJ, Cerione RA & Locasale JW Glutamine Metabolism in Cancer: Understanding the Heterogeneity. Trends Cancer 3, 169–180 (2017). 10.1016/j.trecan.2017.01.005 [DOI] [PMC free article] [PubMed] [Google Scholar]
- 4.Zhang J, Pavlova NN & Thompson CB Cancer cell metabolism: the essential role of the nonessential amino acid, glutamine. Embo J 36, 1302–1315 (2017). 10.15252/embj.201696151 [DOI] [PMC free article] [PubMed] [Google Scholar]
- 5.Kamphorst JJ et al. Human pancreatic cancer tumors are nutrient poor and tumor cells actively scavenge extracellular protein. Cancer Res 75, 544–553 (2015). 10.1158/0008-5472.CAN-14-2211 [DOI] [PMC free article] [PubMed] [Google Scholar]
- 6.Recouvreux MV et al. Glutamine depletion regulates Slug to promote EMT and metastasis in pancreatic cancer. J Exp Med 217 (2020). 10.1084/jem.20200388 [DOI] [PMC free article] [PubMed] [Google Scholar]
- 7.Lee SW et al. EGFR-Pak Signaling Selectively Regulates Glutamine Deprivation-Induced Macropinocytosis. Dev Cell 50, 381–392 e385 (2019). 10.1016/j.devcel.2019.05.043 [DOI] [PMC free article] [PubMed] [Google Scholar]
- 8.Luengo A, Gui DY & Vander Heiden MG Targeting Metabolism for Cancer Therapy. Cell Chem Biol 24, 1161–1180 (2017). 10.1016/j.chembiol.2017.08.028 [DOI] [PMC free article] [PubMed] [Google Scholar]
- 9.Hensley CT, Wasti AT & DeBerardinis RJ Glutamine and cancer: cell biology, physiology, and clinical opportunities. J Clin Invest 123, 3678–3684 (2013). 10.1172/JCI69600 [DOI] [PMC free article] [PubMed] [Google Scholar]
- 10.Daye D & Wellen KE Metabolic reprogramming in cancer: unraveling the role of glutamine in tumorigenesis. Seminars in cell & developmental biology 23, 362–369 (2012). 10.1016/j.semcdb.2012.02.002 [DOI] [PubMed] [Google Scholar]
- 11.Wise DR & Thompson CB Glutamine addiction: a new therapeutic target in cancer. Trends Biochem Sci 35, 427–433 (2010). 10.1016/j.tibs.2010.05.003 [DOI] [PMC free article] [PubMed] [Google Scholar]
- 12.Hui S et al. Glucose feeds the TCA cycle via circulating lactate. Nature 551, 115–118 (2017). 10.1038/nature24057 [DOI] [PMC free article] [PubMed] [Google Scholar]
- 13.Commisso C et al. Macropinocytosis of protein is an amino acid supply route in Ras-transformed cells. Nature 497, 633–637 (2013). 10.1038/nature12138 [DOI] [PMC free article] [PubMed] [Google Scholar]
- 14.Hosios AM et al. Amino Acids Rather than Glucose Account for the Majority of Cell Mass in Proliferating Mammalian Cells. Dev Cell 36, 540–549 (2016). 10.1016/j.devcel.2016.02.012 [DOI] [PMC free article] [PubMed] [Google Scholar]
- 15.Shen YA et al. Inhibition of glutaminolysis in combination with other therapies to improve cancer treatment. Curr Opin Chem Biol 62, 64–81 (2021). 10.1016/j.cbpa.2021.01.006 [DOI] [PMC free article] [PubMed] [Google Scholar]
- 16.Biancur DE et al. Compensatory metabolic networks in pancreatic cancers upon perturbation of glutamine metabolism. Nat Commun 8, 15965 (2017). 10.1038/ncomms15965 [DOI] [PMC free article] [PubMed] [Google Scholar]
- 17.Lemberg KM, Vornov JJ, Rais R & Slusher BS We’re Not “DON” Yet: Optimal Dosing and Prodrug Delivery of 6-Diazo-5-oxo-L-norleucine. Mol Cancer Ther 17, 1824–1832 (2018). 10.1158/1535-7163.MCT-17-1148 [DOI] [PMC free article] [PubMed] [Google Scholar]
- 18.Tenora L et al. Tumor-Targeted Delivery of 6-Diazo-5-oxo-l-norleucine (DON) Using Substituted Acetylated Lysine Prodrugs. J Med Chem 62, 3524–3538 (2019). 10.1021/acs.jmedchem.8b02009 [DOI] [PMC free article] [PubMed] [Google Scholar]
- 19.Rais R et al. Discovery of 6-Diazo-5-oxo-l-norleucine (DON) Prodrugs with Enhanced CSF Delivery in Monkeys: A Potential Treatment for Glioblastoma. J Med Chem 59, 8621–8633 (2016). 10.1021/acs.jmedchem.6b01069 [DOI] [PubMed] [Google Scholar]
- 20.Nedelcovych MT et al. N-(Pivaloyloxy)alkoxy-carbonyl Prodrugs of the Glutamine Antagonist 6-Diazo-5-oxo-l-norleucine (DON) as a Potential Treatment for HIV Associated Neurocognitive Disorders. J Med Chem 60, 7186–7198 (2017). 10.1021/acs.jmedchem.7b00966 [DOI] [PMC free article] [PubMed] [Google Scholar]
- 21.Hanaford AR et al. Orally bioavailable glutamine antagonist prodrug JHU-083 penetrates mouse brain and suppresses the growth of MYC-driven medulloblastoma. Transl Oncol 12, 1314–1322 (2019). 10.1016/j.tranon.2019.05.013 [DOI] [PMC free article] [PubMed] [Google Scholar]
- 22.Rais R et al. Discovery of DRP-104, a tumor-targeted metabolic inhibitor prodrug. Sci Adv 8, eabq5925 (2022). 10.1126/sciadv.abq5925 [DOI] [PMC free article] [PubMed] [Google Scholar]
- 23.Leone RD et al. Glutamine blockade induces divergent metabolic programs to overcome tumor immune evasion. Science 366, 1013–1021 (2019). 10.1126/science.aav2588 [DOI] [PMC free article] [PubMed] [Google Scholar]
- 24.Sharma NS et al. Targeting tumor-intrinsic hexosamine biosynthesis sensitizes pancreatic cancer to anti-PD1 therapy. J Clin Invest 130, 451–465 (2020). 10.1172/JCI127515 [DOI] [PMC free article] [PubMed] [Google Scholar]
- 25.Wang Z et al. Targeting Glutaminolysis: New Perspectives to Understand Cancer Development and Novel Strategies for Potential Target Therapies. Front Oncol 10, 589508 (2020). 10.3389/fonc.2020.589508 [DOI] [PMC free article] [PubMed] [Google Scholar]
- 26.Krall AS, Xu S, Graeber TG, Braas D & Christofk HR Asparagine promotes cancer cell proliferation through use as an amino acid exchange factor. Nat Commun 7, 11457 (2016). 10.1038/ncomms11457 [DOI] [PMC free article] [PubMed] [Google Scholar]
- 27.Pavlova NN et al. As Extracellular Glutamine Levels Decline, Asparagine Becomes an Essential Amino Acid. Cell Metab 27, 428–438 e425 (2018). 10.1016/j.cmet.2017.12.006 [DOI] [PMC free article] [PubMed] [Google Scholar]
- 28.Pinkus LM Glutamine binding sites. Methods Enzymol 46, 414–427 (1977). 10.1016/s0076-6879(77)46049-x [DOI] [PubMed] [Google Scholar]
- 29.Rosenbluth RJ, Cooney DA, Jayaram HN, Milman HA & Homan ER DON, CONV and DONV-II. Inhibition of L-’asparagine synthetase in vivo. Biochem Pharmacol 25, 1851–1858 (1976). 10.1016/0006-2952(76)90189-1 [DOI] [PubMed] [Google Scholar]
- 30.Bayne LJ et al. Tumor-derived granulocyte-macrophage colony-stimulating factor regulates myeloid inflammation and T cell immunity in pancreatic cancer. Cancer Cell 21, 822–835 (2012). 10.1016/j.ccr.2012.04.025 [DOI] [PMC free article] [PubMed] [Google Scholar]
- 31.Khanna C & Hunter K Modeling metastasis in vivo. Carcinogenesis 26, 513–523 (2005). 10.1093/carcin/bgh261 [DOI] [PubMed] [Google Scholar]
- 32.Bott AJ et al. Glutamine Anabolism Plays a Critical Role in Pancreatic Cancer by Coupling Carbon and Nitrogen Metabolism. Cell reports 29, 1287–1298 e1286 (2019). 10.1016/j.celrep.2019.09.056 [DOI] [PMC free article] [PubMed] [Google Scholar]
- 33.Tsai PY et al. Adaptation of pancreatic cancer cells to nutrient deprivation is reversible and requires glutamine synthetase stabilization by mTORC1. Proc Natl Acad Sci U S A 118 (2021). 10.1073/pnas.2003014118 [DOI] [PMC free article] [PubMed] [Google Scholar]
- 34.Balasubramanian MN, Butterworth EA & Kilberg MS Asparagine synthetase: regulation by cell stress and involvement in tumor biology. Am J Physiol Endocrinol Metab 304, E789–799 (2013). 10.1152/ajpendo.00015.2013 [DOI] [PMC free article] [PubMed] [Google Scholar]
- 35.Muller HJ & Boos J Use of L-asparaginase in childhood ALL. Crit Rev Oncol Hematol 28, 97–113 (1998). 10.1016/s1040-8428(98)00015-8 [DOI] [PubMed] [Google Scholar]
- 36.Egler RA, Ahuja SP & Matloub Y L-asparaginase in the treatment of patients with acute lymphoblastic leukemia. J Pharmacol Pharmacother 7, 62–71 (2016). 10.4103/0976-500X.184769 [DOI] [PMC free article] [PubMed] [Google Scholar]
- 37.Ponz-Sarvise M et al. Identification of Resistance Pathways Specific to Malignancy Using Organoid Models of Pancreatic Cancer. Clin Cancer Res 25, 6742–6755 (2019). 10.1158/1078-0432.CCR-19-1398 [DOI] [PMC free article] [PubMed] [Google Scholar]
- 38.Tiriac H et al. Organoid Profiling Identifies Common Responders to Chemotherapy in Pancreatic Cancer. Cancer Discov 8, 1112–1129 (2018). 10.1158/2159-8290.CD-18-0349 [DOI] [PMC free article] [PubMed] [Google Scholar]
- 39.Villarino N et al. A screen for inducers of bHLH activity identifies pitavastatin as a regulator of p21, Rb phosphorylation and E2F target gene expression in pancreatic cancer. Oncotarget 8, 53154–53167 (2017). 10.18632/oncotarget.18587 [DOI] [PMC free article] [PubMed] [Google Scholar]
- 40.Sullivan MR et al. Quantification of microenvironmental metabolites in murine cancers reveals determinants of tumor nutrient availability. Elife 8 (2019). 10.7554/eLife.44235 [DOI] [PMC free article] [PubMed] [Google Scholar]
- 41.Van Trimpont M et al. Novel Insights on the Use of L-Asparaginase as an Efficient and Safe Anti-Cancer Therapy. Cancers (Basel) 14 (2022). 10.3390/cancers14040902 [DOI] [PMC free article] [PubMed] [Google Scholar]
- 42.Krall AS et al. Asparagine couples mitochondrial respiration to ATF4 activity and tumor growth. Cell Metab 33, 1013–1026 e1016 (2021). 10.1016/j.cmet.2021.02.001 [DOI] [PMC free article] [PubMed] [Google Scholar]
- 43.Pathria G et al. Translational reprogramming marks adaptation to asparagine restriction in cancer. Nat Cell Biol 21, 1590–1603 (2019). 10.1038/s41556-019-0415-1 [DOI] [PMC free article] [PubMed] [Google Scholar]
- 44.Knott SRV et al. Asparagine bioavailability governs metastasis in a model of breast cancer. Nature 554, 378–381 (2018). 10.1038/nature25465 [DOI] [PMC free article] [PubMed] [Google Scholar]
- 45.Mukherjee P et al. Therapeutic benefit of combining calorie-restricted ketogenic diet and glutamine targeting in late-stage experimental glioblastoma. Commun Biol 2, 200 (2019). 10.1038/s42003-019-0455-x [DOI] [PMC free article] [PubMed] [Google Scholar]
- 46.Johnson ML et al. Phase 1 and phase 2a, first-in-human (FIH) study, of DRP-104, a broad glutamine antagonist, in adult patients with advanced solid tumors. Journal of Clinical Oncology 39, TPS3149–TPS3149 (2021). 10.1200/JCO.2021.39.15_suppl.TPS3149 [DOI] [Google Scholar]
- 47.Wang SZ et al. Unbiased Metabolic Profiling Predicts Sensitivity of High MYC-Expressing Atypical Teratoid/Rhabdoid Tumors to Glutamine Inhibition with 6-Diazo-5-Oxo-L-Norleucine. Clin Cancer Res 25, 5925–5936 (2019). 10.1158/1078-0432.CCR-19-0189 [DOI] [PMC free article] [PubMed] [Google Scholar]
- 48.Pham K et al. Novel Glutamine Antagonist JHU395 Suppresses MYC-Driven Medulloblastoma Growth and Induces Apoptosis. J Neuropathol Exp Neurol 80, 336–344 (2021). 10.1093/jnen/nlab018 [DOI] [PMC free article] [PubMed] [Google Scholar]
- 49.Wise DR et al. Myc regulates a transcriptional program that stimulates mitochondrial glutaminolysis and leads to glutamine addiction. Proc Natl Acad Sci U S A 105, 18782–18787 (2008). 10.1073/pnas.0810199105 [DOI] [PMC free article] [PubMed] [Google Scholar]
- 50.Qing G et al. ATF4 regulates MYC-mediated neuroblastoma cell death upon glutamine deprivation. Cancer Cell 22, 631–644 (2012). 10.1016/j.ccr.2012.09.021 [DOI] [PMC free article] [PubMed] [Google Scholar]
- 51.Mihara E et al. Active and water-soluble form of lipidated Wnt protein is maintained by a serum glycoprotein afamin/alpha-albumin. Elife 5 (2016). 10.7554/eLife.11621 [DOI] [PMC free article] [PubMed] [Google Scholar]
- 52.Seino T et al. Human Pancreatic Tumor Organoids Reveal Loss of Stem Cell Niche Factor Dependence during Disease Progression. Cell Stem Cell 22, 454–467 e456 (2018). 10.1016/j.stem.2017.12.009 [DOI] [PubMed] [Google Scholar]
Associated Data
This section collects any data citations, data availability statements, or supplementary materials included in this article.
Data Availability Statement
All data supporting the findings of this study are available within the paper and its Supplementary Information. Source Data files for Fig. 1–6 and Extended Data Fig. 1–9 have been provided.


