

ABSTRACT
Background
Ankle sprains are a commonly occurring musculoskeletal injury potentially resulting in persistent pain and/or altered motion. Thrust manipulation may serve as an interventional strategy but limited evidence exists on the mechanism(s) by which a change to symptoms might occur.
Objective
The study sought to quantify the immediate effect of a thrust manipulation to the ankle to determine a mechanism by which change to symptoms occurred.
Methods
Eleven participants (6 m/5f, 26.09 ± 4.25 yrs) with a history of ankle sprain that occurred greater than three months ago with recurring pain and/or altered motion were recruited. Participants underwent neurophysiological testing to assess any pain alterations and instrumented gait analysis (IGA) for biomechanical assessment pre-post thrust manipulation to the ankle.
Results
There were no significant differences in ankle dorsiflexion (DF) (p = 0.62), plantarflexion (PF) (p = 0.23), ground reaction force (GRF), or velocity (p = 0.63) following thrust manipulation compared to baseline; however, pre- and post-data did show differences in pain pressure threshold (p = 0.046). There were no significant differences in dynamic pain measurements.
Conclusions
Ankle sprains that result in persistent pain and/or altered motion can be impacted by a thrust manipulation which appears to act through neurophysiological mechanisms.
KEYWORDS: Ankle, persistent pain, neurophysiological mechanism
Introduction
Acute ankle sprains are one of the most commonly occurring musculoskeletal injuries occurring both during sporting activity and everyday mobility [1,2]. Recovery after an acute ankle sprain often includes supervised exercise programs which use the POLICE protocol of protection, ice, compression, elevation, and controlled optimal loading to address pain and functional limitations such as altered motion [3]. This controlled loading can then extend to a more dynamic exercise program as tissue healing progresses. While these measures provide sufficient guided recovery for some individuals, up to 70% of those who sustain an acute ankle sprain can go on to have residual functional limitations or physical disability [1]. This functional limitation or physical disability can be a result of any of the following symptoms presenting individually or in combination: persistent pain, instability or stiffness. For this reason, additional interventions should be considered beyond the POLICE protocol.
Researchers have provided moderate evidence suggesting the utilization of manual therapy (MT), specifically thrust and non-thrust manipulations, to improve functional outcomes such as persistent pain and altered range of motion in patients following ankle sprain [4–6]. It has also been demonstrated that, following an inversion ankle sprain, MT techniques may be beneficial in restoring or improving dorsiflexion and posterior talar glide, stride speed and step length, and distribution of forces through the foot [4]. However, the mechanism by which MT impacts these changes in pain and motion at the ankle is unclear. In other regions of the body, there are studies that support that pure biomechanical changes occur as a result of MT interventions [7,8]. However, neurophysiological mechanisms may also be at play, as MT techniques have been proposed to reduce pain in joints through altering the sensitivity of neural pathways [9–11].
Bialosky et al. propose a model explaining the mechanism of MT that considers neurophysiological effects more plausible than biomechanical effects as the element that affects change because of the many inconsistencies within the biomechanical mechanism [11]. This model categorizes neurophysiological responses as peripheral, spinal, and/or supraspinal mechanisms. According to Coronado et al., an MT stimulus initiates a train of neurophysiological events that occur at distinct but related levels of the peripheral and central nervous systems, thereby influencing the patient’s perception of pain [12]. MT has been found to reduce levels of peripheral responses when compared to a sham manipulation and venipuncture control groups [11]. There has been some evidence supporting the concept that MT counteracts pain initiated by the central nervous system through the decrease in dorsal horn activity of the spinal cord [13]. Lastly, certain supraspinal structures have been considered to play a key role as a response to pain. Evidence has found that MT decreases activation of supraspinal structures responsible for central pain processing [14]. The literature indicates the possibility for MT to affect peripheral, spinal, and/or supraspinal mechanisms, however, more research needs to be done to further support this and to understand the impact of neurophysiological input on motion at a joint.
To date, no researchers have quantified the immediate effect of a thrust manipulation to the ankle in order to better understand the effects on symptoms such as persistent pain and dynamic joint motion and loading. The purpose of this study was to quantify the immediate effect of a thrust manipulation to the ankle to determine a mechanism by which change to symptoms occurs.
Methods
Study design
A cross-sectional observational study involving participants who were at least three months post-ankle sprain was conducted after ethical approval was obtained from the University of Indianapolis Human Research Protections Program (HRRP).
Setting
All testing was completed during individual one-time testing sessions in the Movement Science Laboratory at the University of Indianapolis. Participant recruitment and data collection occurred between September 2019 and February 2020.
Participants
Eleven participants (five female, 26.09 ± 4.25 yrs; 78.4 kg + 21.5; 170 cm + 0.13; BMI 26.71 kg/m2 + 4.38) with a history of ankle sprain were recruited to the study through the use of HRPP approved flyers posted around the university. To be eligible for the study, participants had to report symptoms of pain and/or stiffness of the ankle for more than three months. Participants were excluded from the study if they had a previous history of ankle surgery, osteoarthritis, sensory impairments, severe vascular disease, refused to receive a thrust manipulation, or had any contraindications to receiving manual therapy.
The duration of time between the ankle sprain and enrollment to the study ranged from three months to two years. Every participant reported both pain and stiffness. Two individuals who were screened for the study were not included because they did not meet the criteria of duration of symptoms and presence of pain and stiffness. A graded chronic pain scale survey demonstrated that, on average, participants demonstrated a low level of chronic pain (2 out of 10 on a visual analogue scale (VAS) pain scale) during the preceding month from the day of testing. This low level of chronic pain was found to, on average, keep the participants away from their usual activities (i.e. work, school, or housework) because of the pain for about 1.4 days.
Variables
Pain testing measures
Participants underwent two different types of pain testing measures: static and dynamic. Static pain testing measures included the use of pressure pain threshold (PPT) and various heat pain indicators on a visual analogue (VAS) pain scale placed in front of them [15–21]. This VAS pain scale was a 0–100 scale with the left endpoint defined as ‘no pain’ and the right endpoint as ‘highest tolerable pain’ (Figure 1). Additional hash marks in increments of 10 were provided to simulate a 0–100 numerical rating scales. For static heat pain measurements, participants were instructed to click a participant response device, in real-time, to indicate thermal temperatures that were associated with the warm temperature crossing over into ‘pain’ (HThres), achieving a pain rating of ‘50’ on the 0–100 pain scale (H50), and the point at which a pain rating of ‘100’ on the 0–100 pain scale was reached (HTol). Dynamic pain testing measures included the use of offset analgesia and conditioned pain modulation (CPM) which provide pain ratings over time in response to changing painful stimuli. In an effort to preserve brevity these procedures are outlined in previous investigations [22–26]. All participants were familiarized to pain testing using all the static pain testing measures prior to any testing trials, ensuring reliability in participant pain rating capability. PPT at the ankle was measured using a digital handheld clinical grade pressure algometer with a 1 cm2 probe (Wagner FPX, Greenwich, CT) [15]. All heat testing utilized focal thermal stimuli (40–49°C) administered by a Pelteir-based thermode (30 mm x 30 mm, Q Sense CPM System, Medoc, Ramat Yishai, Israel) to the lateral portion of the lower leg on the same side as the affected ankle [27–29]. All temperatures were computer-controlled with safeguards in place to minimize the chance of injury. Additionally, upon clicking the participant’s handheld response device, the rising temperature was automatically stopped and reversed, giving participants complete control of their experience and setting up for the next stimuli.
Figure 1.
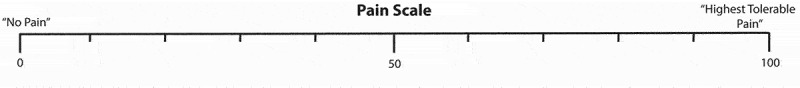
A visual representation of the pain scale (visual analog scale (VAS)). Participants were asked to rate their pain experienced in real time.
Instrumented gait analysis
A 10-camera motion analysis system (Vicon Motion Systems Ltd.) was used to record kinematic data at a rate of 100 Hz. Kinetic data were collected with two AMTI force plates (AMTI Corp. Watertown, MA) at 1000 Hz. The three-dimensional positions of 22 retro-reflective markers were recorded during each of the 10 walking trials pre and post thrust manipulation for each of the study participants. These markers were attached to the anatomical landmarks of the manubrium of the sternum, xiphisternum, and bilaterally at the acromioclavicular joints, anterior superior iliac spines, posterior superior iliac spines, medial and lateral knees, medial and lateral ankles, heels, first and fifth metatarsal heads. Cluster markers, consisting of four markers attached to a plastic plate fixed with a strap, were also attached to the bilateral thighs and shanks [30–32].
Procedures
Pre-thrust manipulation static pain testing
The study design was setup in a manner in which to provide pre-post ankle thrust manipulation comparisons in both pain scores and gait analysis. The flow of the study design can be found in Figure 2.
Figure 2.

A visual representation of the experimental protocol used for the study. Note: *PPT (Pressure Pain Threshold); HThres (Heat Pain Threshold); HTol (Heat Pain Tolerance); H50 (Heat Pain at a VAS score of 50 out of 100); CPM (Conditioned Pain Modulation).
Upon completion of the informed consent, familiarization trials occurred. Following familiarization, data collection commenced with PPT of the lateral side of the affected ankle. A constant rate of pressure to the anterior talofibular ligament, calcaneofibular ligament, tibial malleolus, and fibular malleolus was provided [33]. The participants were instructed to respond when they first began to feel pain indicating their PPT. The anterior talofibular ligament was found to be the most sensitive spot and was therefore used for statistical comparisons. Following PPT testing, participants were asked to rate their H50, the temperature of which served as the dynamic pain testing temperature.
Pre-thrust manipulation dynamic pain testing
Following the static pain testing measures participants began testing the dynamic measures of pain starting with offset analgesia. For this 40s trial, the thermode was brought to a neutral temperature (33°C), then brought into light skin contact. After a short period, the temperature was ramped (1.5°C/s) to the desired temperature, based on the participants previous H50 scores, and maintained at that temperature for 10 seconds. Upon completion of these 10 seconds, the thermode automatically increased the temperature by 1°C for an additional 10 seconds immediately followed by a return to the original thermode temperature for 20 seconds. The intensity of the pain produced by the contact thermode was rated continuously using verbal feedback every two seconds as measured by a metronome and VAS pain scale (Figure 1). Following the offset analgesia test, participants underwent a conditioned pain modulation trial. This trial consisted of exposing the participant to a 60s period of constant, non-changing heat, the temperature of which was also dictated by the participants previous H50 temperature. The participant provided verbal pain scores every 5 seconds as indicated by a metronome and VAS scale. Immediately following this stimulation, participants were once again tested on all static pain measures and another trial of offset analgesia to investigate the influence of the constant heat stimulation provided during the CPM trial. Following these pain testing trials all subjects underwent Instrumented Gait Analysis (IGA).
Pre-thrust manipulation instrumented gait analysis
Prior to the placement of the retro-reflective markers, a small dot was placed in the correct location of the skin for the marker to allow for the replacement of the markers for the retest of IGA following the thrust manipulation to the ankle. A calibration trial of both static capture and dynamic capture where the motion of the hip, knee, and ankle occurred was used to individualize marker position and calculate joint centers and segment positions for each participant during all subsequent movement testing. While wearing the markers, each participant walked ten trials of 15 meters at a comfortable cadence, which was then measured and kept consistent with a metronome throughout all trials of the study.
The kinematic and kinetic data were then processed in Visual 3D (C-Motion Inc, Rockville, MD). A local coordinate system was then used to define the model segments for the pelvis, thigh, shank and foot based on the marker position over the anatomical landmarks on the segments. During processing, a low-pass Butterworth filter with a cutoff frequency of 8 Hz was used to remove noise in the data.
Ankle thrust manipulation
Following IGA, a thrust manipulation was applied to the ankle joint. The principal investigator, a Fellow of the American Academy of Orthopaedic Physical Therapy Association for 12 years, applied the thrust manipulation to the ankles of all participants. The thrust was considered successful once the researcher felt a gapping in the ankle. If a gapping was not felt, the thrust manipulation was repeated. The second thrust was completed on five of the participants. Following the thrust, each participant again underwent the pain testing and IGA a second time. The experimental flow is outlined in Figure 2.
Quantitative variables
Pain measures included PPT, Hthres, Htol, H50, Offset Analgesia, and CPM variables. Quantitatively, PPT provided a pressure value in kilograms at the point the participant verbally indicated feeling pain. For the variables of HThres, Htol, and H50, participants indicated the point of achieving the various pain levels as indicated by the VAS scale by clicking the computer controlled handheld response device providing the investigators with the temperature (C) associated with that experience. For the dynamic pain measures the verbal pain ratings were used for comparisons. Vicon Nexus 2.2.3 was used to capture, reconstruct, manually label and filter all trials. Original walking trials were cut down to one gait cycle for the right and left sides and was exported into Visual 3D. Visual 3D pipelines were performed to calculate peak joint range and ground reaction forces. Ground reaction forces were normalized to body weight.
Statistical Methods
An a-priori power calculation using G Power determined that a minimum sample size of 24 would detect a significant effect size with a 80% power [33]. A Shapiro-Wilk test was used to assess normality of data with p < 0.05. Paired t-tests were used for all normally distributed data, and for nonnormally distributed data Wilcoxson Signed Rank tests were run. Statistical analysis was completed using SPSS version 23 (IBM, Chicago). Effect sizes were calculated from the f-statistic for offset analgesia and CPM. The PPT and all biomechanical measurements had effect sizes calculated utilizing Cohen’s D. Effect sizes are defined as following: <0.20 (trivial), ≥0.20 to < 0.50 (small), ≥0.50 to < 0.80 (medium), and ≥ 0.80 (large) [34].
Results
There were eleven participants included with a history of ankle sprain at least three months prior to data collection. Figure 3 demonstrates static pain measurements of pain pressure threshold on the anterior talofibular ligament, pre- and post-thrust manipulation. No statistical difference was measured pre- to post-thrust manipulation in offset analgesia (t(10) = −0.469, p = 0.65,) or CPM influenced stimuli of PPT (t(10) = −0.056, p = 0.957), H50 (t(10) = −1.187, p = 0.263), or Offset Analgesia (t(10) = 0.919, p = 0.380). A statistical difference was measured in pre-CPM pain pressure threshold (t(10) = −2.277, p = 0.046, d = 0.81, r = 0.609, r2 = 0.371) pre-post thrust manipulation.
Table 1.
Biomechanical outcome measures pre and post ankle thrust manipulation.
| Pre | Post | Significance | Effect Size | |
|---|---|---|---|---|
| Ankle DF(deg) | 12.82 (2.67) | 12.44 (2.67) | 0.62 | 0.15 |
| Ankle PF(deg) | 15.89 (6.64) | 16.77 (6.19) | 0.23 | 0.39 |
| Velocity (m/s)* | 1.33 (0.13)* | 1.33 (0.15)* | 0.63 | 0.147 |
| GRF | 1.13 (0.09) | 1.14 (0.09) | 0.36 | 0.29 |
Mean (SD), *Median (IQR), GRF (% body weight) = vertical force only.
Figure 3.

Comparison of PPT results pre-post thrust manipulation absent of the conditioned pain modulation test influence. Note: All three-dimensional motion analysis data are shown in Table 1. There were no statistical differences between pre- and post- test kinematic data. Mean and standard deviation (SD) were reported for all kinematic data sets in Table 1.
Discussion
The purpose of this study was to quantify the immediate effect of a thrust manipulation to the ankle to determine a mechanism by which a change to symptoms may occur. In this study, it was found that a thrust manipulation to the ankle in individuals with a history of having one or more ankle sprains over three months ago changed an individual’s pressure pain experience but not available ankle motion, loading of the joint, or gait velocity. This suggests that the effects of a thrust manipulation to a peripheral joint may occur through a local neurophysiological mechanism, rather than a pure biomechanical mechanism.
There is evidence that, in other regions of the body, biomechanical responses occur as a result of manual techniques such as thrust and non-thrust manipulations [7,8,35]. The findings from these studies contrast to those from our study which could be accounted for in differences in the study methodology. In the studies by Talbott and Witt and Snodgrass and Rivett and Robertson the measurements of the mechanical responses occurred in non-weight bearing positions and were taken right at the time of the application of the manual technique [7,35]. In the current study the measurements were taken with the joints in weight bearing positions and occurred within 15 minutes of the thrust manipulation. Cramer et al did take pre- and post- measures of mechanical change following a thrust manipulation to the lumbar spine, but their MRI measures were also in non-weight bearing and static positions [8]. The measures taken using IGA in the current study looked at motion of the affected ankle during gait which is a functional assessment of ankle performance particularly when motion has been compromised as a result of an ankle sprain. Without a potential mechanical change as a result of the thrust manipulation, it is plausible that other elements, such as neurophysiological mechanisms, are likely involved.
The proposed role of neurophysiological mechanisms leading to perceived change as a result of manual therapy are well documented [36,37]. However, much of this work has been related to the spine whereas our study focused on a peripheral joint. Our results are similar to the results found in other studies; specifically, a meta-analysis conducted by Coronado et al found that spinal manipulation has a favorable effect on increasing pressure pain threshold, or reducing pain sensitivity, when compared to other forms of intervention [12]. While Coronado et al’s meta-analysis examined spinal manipulative therapy and our study examined a thrust manipulation to a peripheral joint, it seems that a thrust manipulation, regardless of location, may decrease static pain via neurophysiological mechanisms. Bishop et al stated that there are reductions in pressure pain thresholds in response to both joint and muscle/connective tissue biased manual therapy [38]. This is comparable to our results as well and would fall into Bishop et al’s category of joint biased manual therapy.
Based on the findings of this study biomechanical effects did not appear to occur as a result of the thrust manipulation. However, it does appear that a thrust manipulation is influential in pain modulation with individuals dealing with chronic ankle pain. At this time, it is unclear how long these pain modulating effects last. These implications align with the results of a randomized control trial by Cleland et al who found that patients who received manual therapy and exercises provided by a physical therapist following a grade one or two inversion sprain demonstrated better short- and long-term outcomes in overall ankle function, as well as a significant reduction in pain, compared to those who only performed a home exercise program [5].
Strengths and limitations
There were several strengths to be considered in this study. The pre-post study design allowed each participant to act as his or her own control which improved reliability of reporting. Another strength was that every participant underwent a familiarization protocol ensuring pain rating validity and reliability. There are a number of limitations to the current study to be contemplated. Participants in this study did not undergo a physical examination establishing lower limb characteristics that could have contributed to the influence of the thrust manipulation. Within the pain data it remains possible that the changes in PPT are due to familiarization of the PPT process and not changes in the neurophysiological mechanism that can occur following a thrust manipulation. Other limitations of the current study are the sample size. An a-priori power calculation using G Power determined that a minimum sample size of 24 would detect a significant effect size with 80% power. However, data collection on 24 participants was not possible due to early cessation of the study as a result of the onset of Covid-19. Finally, we are unable to generalize our data to older populations as the mean age of participants involved in this study was 26.09 ± 4.25 years.
Conclusion
Ankle sprains are a common issue in individuals within the United States, with some acute injuries becoming chronic. It is important for clinicians to have evidence to support the interventions used to address persistent pain and/or ankle changes in motion. The results of this study suggest that MT, specifically a talocrural joint thrust manipulation, may decrease pain through a neurophysiological mechanism for those suffering from persistent ankle pain.
Biographies
Dr. Emily J. Slaven is a Professor in the Krannert School of Physical Therapy at the University of Indianapolis (UIndy). She is a board certified Orthopaedic physical therapist and is a fellow in the American Academy of Orthopaedic Manual Physical Therapists. She is an active member within the American Physical Therapy Association (APTA) APTA Indiana Chapter and the Scientific and Practice Affairs Committee of the APTA. Dr. Slaven is the Academic Residency Director for the UIndy/BodyOne Orthopaedic Clinical Residency and maintains an active clinical practice at Franciscan Health.
Dr. Nick Alarcio graduated from the Doctor of Physical Therapy program at the University of Indianapolis in 2021. He is a member of the American Physical Therapy Association. He currently works at Gesik Physical Therapy, an outpatient orthopedic and sports physical therapy clinic based in Honolulu, HI.
Dr. Chandler Fields graduated from the Krannert School of Physical Therapy at the University of Indianapolis in 2021. He currently works for Results Physiotherapy, Raleigh, NC as a staff therapist. Dr. Fields has published in the Journal of Strength and Conditioning Research. He is currently working towards his Certified Orthopedic Manual Therapist board certification as well as becoming a Certified Strength and Conditioning Specialist. His research interests include wearable technology and blood flow restriction.
Dr. Mallory Hayes is a graduate from the University of Indianapolis’ Doctor of Physical Therapy Program in 2021. She currently works in orthopaedics treating a variety of orthopedic injuries and conditions. She is currently working towards her dry needling certification. She has been working for Beacon Orthopaedics and Sports Medicine in Cincinnati, Ohio since graduating.
Dr. Emily Weiss graduated from the University of Indianapolis’ Doctor of Physical Therapy Program in 2021 and currently practices in the outpatient orthopedic setting in Indianapolis, Indiana. She is certified in Blood Flow Restriction Training and Office Ergonomics Evaluation, and she is in the process of becoming certified in Neurosomatic Therapy and the Schroth Method. Her research interests include spinal injury and rehabilitation, psychosomatic therapy, and pain science.
Dr. Nathanial R. Eckert is an Associate Professor and Practicum Director for the Master’s in Exercise Science Program at the University of Indianapolis within the Exercise Science department. He is an active member in both the American College of Sports Medicine national and regional chapters as well as a member of the US Association for the Study of Pain and Society for Neuroscience. His research interests include the neurological processes behind the pain experience and the influence of exercise on pain perception.
Correction Statement
This article has been corrected with minor changes. These changes do not impact the academic content of the article.
Funding Statement
The author(s) reported there is no funding associated with the work featured in this article.
Disclosure statement
No potential conflict of interest was reported by the authors.
References
- [1].Herzog MM, Kerr ZY, Marshall SW, et al. Epidemiology of ankle sprains and chronic ankle instability. J Athl Train. 2019;54(6):603–610. doi: 10.4085/1062-6050-447-17 [DOI] [PMC free article] [PubMed] [Google Scholar]
- [2].Delahunt E, Bleakley CM, Bossard DS, et al. Clinical assessment of acute lateral ankle sprain injuries (ROAST): 2019 consensus statement and recommendations of the International ankle consortium. Br J Sports Med. 2018;52(20):1304–1310. doi: 10.1136/bjsports-2017-098885 [DOI] [PubMed] [Google Scholar]
- [3].Bleakley CM, Glasgow P, MacAuley DC.. PRICE needs updating, should we call the POLICE? Br J Sports Med. 2012;46(4):220–221. doi: 10.1136/bjsports-2011-090297 [DOI] [PubMed] [Google Scholar]
- [4].Whitman JM, Cleland JA, Mintken PE, et al. Predicting short-term response to thrust and nonthrust manipulation and exercise in patients post inversion ankle sprain. J Orthop Sports Phys Ther. 2009;39(3):188–200. doi: 10.2519/jospt.2009.2940 [DOI] [PubMed] [Google Scholar]
- [5].Cleland JA, Mintken PE, McDevitt A, et al. Manual physical therapy and exercise versus supervised home exercise in the management of patients with inversion ankle sprain: a multicenter randomized clinical trial. J Orthop Sports Phys Ther. 2013;43(7):443–455. doi: 10.2519/jospt.2013.4792 [DOI] [PubMed] [Google Scholar]
- [6].de Ruvo R, Russo G, Lena F, et al. The effect of manual therapy plus exercise in patients with lateral ankle sprains: a critically appraised topic with a meta-analysis. J Clin Med. 2022;11(16):4925. doi: 10.3390/jcm11164925 [DOI] [PMC free article] [PubMed] [Google Scholar]
- [7].Talbott N, Witt DW. In vivo measurements of humeral movement during posterior glenohumeral mobilizations. J Man Manip Ther. 2016;24(5):269–276. doi: 10.1179/2042618615Y.0000000007 [DOI] [PMC free article] [PubMed] [Google Scholar]
- [8].Cramer GD, Ross K, Raju PK, et al. Quantification of cavitation and gapping of lumbar zygapophyseal joints during spinal manipulative therapy. J Manipulative Physiol Ther. 2012;35(8):614–621. doi: 10.1016/j.jmpt.2012.06.007 [DOI] [PMC free article] [PubMed] [Google Scholar]
- [9].Courtney CA, Steffen AD, Fernandez-de-Las-Penas C, et al. Joint mobilization enhances mechanisms of conditioned pain modulation in individuals with osteoarthritis of the knee. J Orthop Sports Phys Ther. 2016;46(3):168–176. doi: 10.2519/jospt.2016.6259 [DOI] [PubMed] [Google Scholar]
- [10].Bialosky JE, Bishop MD, Price DD, et al. The mechanisms of manual therapy in the treatment of musculoskeletal pain: a comprehensive model. Man Ther. 2009;14(5):531–538. doi: 10.1016/j.math.2008.09.001 [DOI] [PMC free article] [PubMed] [Google Scholar]
- [11].Bialosky JE, Beneciuk JM, Bishop MD, et al. Unraveling the mechanisms of manual therapy: modeling an approach. J Orthop Sports Phys Ther. 2018;48(1):8–18. doi: 10.2519/jospt.2018.7476 [DOI] [PubMed] [Google Scholar]
- [12].Coronado RA, Bialosky JE. Manual physical therapy for chronic pain: the complex whole is greater than the sum of its parts. J Man Manip Ther. 2017;25(3):115–117. doi: 10.1080/10669817.2017.1309344 [DOI] [PMC free article] [PubMed] [Google Scholar]
- [13].Malisza KL, Gregorash L, Turner A, et al. Functional MRI involving painful stimulation of the ankle and the effect of physiotherapy joint mobilization. Magn Reson Imaging. 2003;21(5):489–496. doi: 10.1016/S0730-725X(03)00074-2 [DOI] [PubMed] [Google Scholar]
- [14].Malisza KL, Stroman PW, Turner A, et al. Functional MRI of the rat lumbar spinal cord involving painful stimulation and the effect of peripheral joint mobilization. J Magn Reson Imaging. 2003;18(2):152–159. doi: 10.1002/jmri.10339 [DOI] [PubMed] [Google Scholar]
- [15].Chesterton LS, Sim J, Wright CC, et al. Interrater reliability of algometry in measuring pressure pain thresholds in healthy humans, using multiple raters. Clin J Pain. 2007;23(9):760–766. doi: 10.1097/AJP.0b013e318154b6ae [DOI] [PubMed] [Google Scholar]
- [16].Price DD, McGrath PA, Rafii A, et al. The validation of visual analogue scales as ratio scale measures for chronic and experimental pain. Pain. 1983;17(1):45–56. doi: 10.1016/0304-3959(83)90126-4 [DOI] [PubMed] [Google Scholar]
- [17].Huskisson EC. Measurement of pain. Lancet. 1974;2(7889):1127–1131. doi: 10.1016/S0140-6736(74)90884-8 [DOI] [PubMed] [Google Scholar]
- [18].Alghadir AH, Anwer S, Iqbal A, et al. Test-retest reliability, validity, and minimum detectable change of visual analog, numerical rating, and verbal rating scales for measurement of osteoarthritic knee pain. J Pain Res. 2018;11:851–856. doi: 10.2147/JPR.S158847 [DOI] [PMC free article] [PubMed] [Google Scholar]
- [19].Jensen MP, Karoly P, Braver S. The measurement of clinical pain intensity: a comparison of six methods. Pain. 1986;27(1):117–126. doi: 10.1016/0304-3959(86)90228-9 [DOI] [PubMed] [Google Scholar]
- [20].Gramling SE, Elliott TR. Efficient pain assessment in clinical settings. Behav Res Ther. 1992;30(1):71–73. doi: 10.1016/0005-7967(92)90100-U [DOI] [PubMed] [Google Scholar]
- [21].Breivik EK, Bjornsson GA, Skovlund E. A comparison of pain rating scales by sampling from clinical trial data. Clin J Pain. 2000;16(1):22–28. doi: 10.1097/00002508-200003000-00005 [DOI] [PubMed] [Google Scholar]
- [22].Cruz-Almeida Y, Fillingim RB. Can quantitative sensory testing move us closer to mechanism-based pain management? Pain Med. 2014;15(1):61–72. doi: 10.1111/pme.12230 [DOI] [PMC free article] [PubMed] [Google Scholar]
- [23].De Vita MJ, Buckheit K, Gilmour CE, et al. Development of a novel brief quantitative sensory testing protocol that integrates static and dynamic pain assessments: test-retest performance in healthy adults. Pain Med. 2022;23(2):347–351. doi: 10.1093/pm/pnab290 [DOI] [PMC free article] [PubMed] [Google Scholar]
- [24].Mertens MG, Hermans L, Crombez G, et al. Comparison of five conditioned pain modulation paradigms and influencing personal factors in healthy adults. Eur J Pain. 2021;25(1):243–256. doi: 10.1002/ejp.1665 [DOI] [PubMed] [Google Scholar]
- [25].Hermans L, Calders P, Van Oosterwijck J, et al. An overview of offset analgesia and the comparison with conditioned pain modulation: a systematic literature review. Pain Physician. 2016;19(6):307–326. doi: 10.36076/ppj/2016.19.307 [DOI] [PubMed] [Google Scholar]
- [26].Yelle MD, Rogers JM, Coghill RC. Offset analgesia: a temporal contrast mechanism for nociceptive information. Pain. 2008;134(1–2):174–186. doi: 10.1016/j.pain.2007.04.014 [DOI] [PMC free article] [PubMed] [Google Scholar]
- [27].Staud R. Abnormal endogenous pain modulation is a shared characteristic of many chronic pain conditions. Expert Rev Neurother. 2012;12(5):577–585. doi: 10.1586/ern.12.41 [DOI] [PMC free article] [PubMed] [Google Scholar]
- [28].Grill JD, Coghill RC. Transient analgesia evoked by noxious stimulus offset. J Neurophysiol. 2002;87(4):2205–2208. doi: 10.1152/jn.00730.2001 [DOI] [PubMed] [Google Scholar]
- [29].Zhang S, Li T, Kobinata H, et al. Attenuation of offset analgesia is associated with suppression of descending pain modulatory and reward systems in patients with chronic pain. Mol Pain. 2018;14:1744806918767512. doi: 10.1177/1744806918767512 [DOI] [PMC free article] [PubMed] [Google Scholar]
- [30].Duffell LD, Hope N, McGregor AH. Comparison of kinematic and kinetic parameters calculated using a cluster-based model and Vicon’s plug-in gait. Proc Inst Mech Eng H. 2014;228(2):206–210. doi: 10.1177/0954411913518747 [DOI] [PubMed] [Google Scholar]
- [31].Kaufman K, Miller E, Kingsbury T, et al. Reliability of 3D gait data across multiple laboratories. Gait Posture. 2016;49:375–381. doi: 10.1016/j.gaitpost.2016.07.075 [DOI] [PubMed] [Google Scholar]
- [32].Jensen E, Lugade V, Crenshaw J, et al. A principal component analysis approach to correcting the knee flexion axis during gait. J Biomech. 2016;49(9):1698–1704. doi: 10.1016/j.jbiomech.2016.03.046 [DOI] [PMC free article] [PubMed] [Google Scholar]
- [33].Plaza-Manzano G, Vergara-Vila M, Val-Otero S, et al. Manual therapy in joint and nerve structures combined with exercises in the treatment of recurrent ankle sprains: a randomized, controlled trial. Man Ther. 2016;26:141–149. doi: 10.1016/j.math.2016.08.006 [DOI] [PubMed] [Google Scholar]
- [34].Cook C. Clinimetrics corner: use of efect sizes in describing data. J Man Manip Ther. 2008;16(3):54–57. doi: 10.1179/jmt.2008.16.3.54E [DOI] [Google Scholar]
- [35].Snodgrass SJ, Rivett DA, Robertson VJ. Manual forces applied during cervical mobilization. J Manipulative Physiol Ther. 2007;30(1):17–25. doi: 10.1016/j.jmpt.2006.11.008 [DOI] [PubMed] [Google Scholar]
- [36].Jun P, Page I, Vette A, et al. Potential mechanisms for lumbar spinal stiffness change following spinal manipulative therapy: a scoping review. Chiropr Man Therap. 2020;28(1):15. doi: 10.1186/s12998-020-00304-x [DOI] [PMC free article] [PubMed] [Google Scholar]
- [37].Coronado RA, Gay CW, Bialosky JE, et al. Changes in pain sensitivity following spinal manipulation: a systematic review and meta-analysis. J Electromyogr Kinesiol. 2012;22(5):752–767. doi: 10.1016/j.jelekin.2011.12.013 [DOI] [PMC free article] [PubMed] [Google Scholar]
- [38].Bishop MD, Torres-Cueco R, Gay CW, et al. What effect can manual therapy have on a patient’s pain experience? Pain Manag. 2015;5(6):455–464. doi: 10.2217/pmt.15.39 [DOI] [PMC free article] [PubMed] [Google Scholar]