An official website of the United States government
Here's how you know
Official websites use .gov
A
.gov website belongs to an official
government organization in the United States.
Secure .gov websites use HTTPS
A lock (
) or https:// means you've safely
connected to the .gov website. Share sensitive
information only on official, secure websites.
As a library, NLM provides access to scientific literature. Inclusion in an NLM database does not imply endorsement of, or agreement with,
the contents by NLM or the National Institutes of Health.
Learn more:
PMC Disclaimer
|
PMC Copyright Notice
. 2023 Dec 1;2023:215.
Chemical and Cellular Formation of Reactive Oxygen Species from
Secondary Organic Aerosols in Epithelial Lining Fluid
Role of Secondary Organic Aerosols Versus Macrophages in Formation of
Reactive Oxygen Species in the Lung
This Statement, prepared by the Health Effects Institute, summarizes a
research project funded by HEI and conducted by Dr. Manabu Shiraiwa at the
University of California, Irvine, and colleagues. Research Report 215
contains both the detailed Investigators’ Report and a Commentary on
the study prepared by the Institute’s Review Committee.
SHIRAIWA 215
This study evaluated the mechanisms of aerosol-induced reactive
oxygen species formation by two pathways in the respiratory tract:
by chemical reactions and by immune cells called macrophages.
The investigators quantified aqueous reactive oxygen species
formation under various experimental conditions and developed
kinetic models of the respiratory tract. They also evaluated ambient
air samples as a contrast to the laboratory-generated
pollutants.
Results showed that the quantity and composition of reactive oxygen
species formation depends on the specific aerosol mixture, oxidation
mechanisms, and other environmental conditions. Under certain
exposure conditions, the reactive oxygen species released by
macrophages far exceeded the reactive oxygen species formation by
aqueous chemical reactions.
Aerosol-induced respiratory health effects that are mediated by
reactive oxygen species depend on a complex interplay between the
aerosol mixture, chemical reactions, environmental conditions, and
the influence of the immune cells.
BACKGROUND
Air pollution from particulate matter (PM) is associated with adverse health
effects and is a leading risk factor for morbidity and mortality worldwide. PM
is a complex mixture of microscopic particles and liquid droplets known as an
aerosol; the mixture can contain various metals and carbon-containing particles.
PM can originate from primary natural sources (e.g., windblown dust) and primary
pollutant sources (e.g., fuel combustion), but a large fraction of PM is also
formed by chemical reactions of gases in the atmosphere. PM formed in the
atmosphere from gas-phase organic precursors is known as secondary organic
aerosol (SOA). Inhalation of PM can damage tissues in the respiratory tract by
chemically generating reactive oxygen species (ROS), which are highly reactive
oxygen-containing chemicals, such as hydrogen peroxide (see Statement Figure).
Inhalation exposure can also stimulate cells called macrophages to release ROS
as part of the immune defense. Although ROS play a role in normal biological
function, a buildup of ROS can induce oxidative stress and lead to the onset and
progression of disease. Although research demonstrates that SOAs contribute to
ROS formation in the respiratory tract, this pathway remains poorly
understood.
After inhalation of air pollutants, ROS are formed in lung fluid
through chemical reactions and released by macrophages under normal
physiological conditions. Excess ROS can lead to oxidative
stress and inflammation, but the relative importance of the two pathways
is unclear. GSH = glutathione; VIT C = vitamin C.
To examine the effects of SOA exposure on the formation of ROS in lungs, HEI
funded a study by Dr. Manabu Shiraiwa of the University of California, Irvine,
titled “Formation of Reactive Oxygen Species by Organic Aerosols and
Transition Metals in Epithelial Lining Fluid” in response to HEI’s
Request for Applications 17-3 Walter A. Rosenblith New Investigator Award. Dr.
Shiraiwa proposed to investigate the kinetics and chemical mechanisms of ROS
formation in the respiratory tract by different types of air pollutants and to
quantify the relative importance of ROS formed by chemical reactions compared
with ROS released as an immune response to pollution.
APPROACH
Dr. Shiraiwa aimed to study ROS formation in the respiratory tract by designing a
series of laboratory experiments and developing kinetic models. Because ROS
formation in the respiratory tract occurs at the interface between air and
tissue in a protective liquid layer called the epithelial lining fluid (ELF),
the approach focused on aqueous reactions to approximate real-world conditions.
The first objective of the study was to identify the mechanisms and kinetics of
ROS formation by aqueous chemical reactions of SOAs. Specific tasks were to
quantify ROS formation by laboratory-generated SOAs and by ambient PM samples.
The second objective was to quantify the relative importance of ROS formed by
chemical reactions compared with the cellular release of ROS by macrophages in
synthetic ELF. Specific tasks included using kinetic modeling to estimate ROS
concentrations formed by chemical reactions within different lung regions and to
quantify ROS released by macrophage cells when exposed to SOA.
Shiraiwa and colleagues first generated SOAs in a controlled laboratory
environment by inducing oxidation of selected organic compounds in a reaction
chamber. They also collected PM from a small number of ambient air samples from
Los Angeles, California, that were used to represent urban, traffic, and
wildfire locations. They conducted various in vitro experiments to quantify the
chemical formation of several types of ROS in water and in synthetic ELF from
SOAs generated by laboratory precursors or ambient air PM samples. The synthetic
ELF contained the naturally occurring antioxidants vitamin C, citric acid,
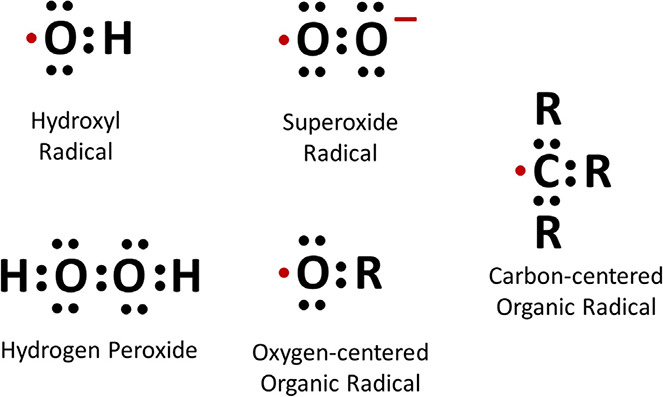
glutathione, and uric acid. They quantified several different ROS, including
hydroxyl radical, superoxide radical, carbon- and oxygen-centered radicals, and
hydrogen peroxide.
In their experiments, the investigators evaluated the effects of different
experimental conditions on ROS formation, including the addition of nitrogen
oxides (NOx), the addition of ferrous iron (Fe2+),
and changes in pH levels. Both NOx and Fe2+ are
important atmospheric oxidizing agents. They used a relatively new and sensitive
method called continuous wave electron paramagnetic resonance spectroscopy with
a spin trapping technique to capture the formation of various ROS species.
Shiraiwa and colleagues then used computer modeling to determine the ROS
chemical reaction kinetics and to estimate ROS burden in different respiratory
tract regions. Finally, they compared the chemical formation of ROS by SOAs with
the ROS released by macrophage cells when exposed to SOAs.
KEY RESULTS
Shiraiwa and colleagues found that the formation of various ROS and their
reaction kinetics strongly depended on the method of chemical oxidation and the
chemical precursor used to generate SOAs. Different experimental conditions,
including the presence of NOx or Fe2+ and changes
in pH levels, altered ROS formation. For example, the introduction of high
concentrations of NOx to laboratory-generated SOAs decreased the
formation of hydroxyl and superoxide radicals. In contrast, the introduction of
Fe2+ to SOA generally increased ROS formation. The type of
ROS formed, and the kinetics of that formation, differed when the experiment was
carried out in water versus the synthetic ELF — an effect attributed to
the presence of antioxidants in the synthetic ELF. Overall, chemical ROS
formation from SOA was highly complex and variable.
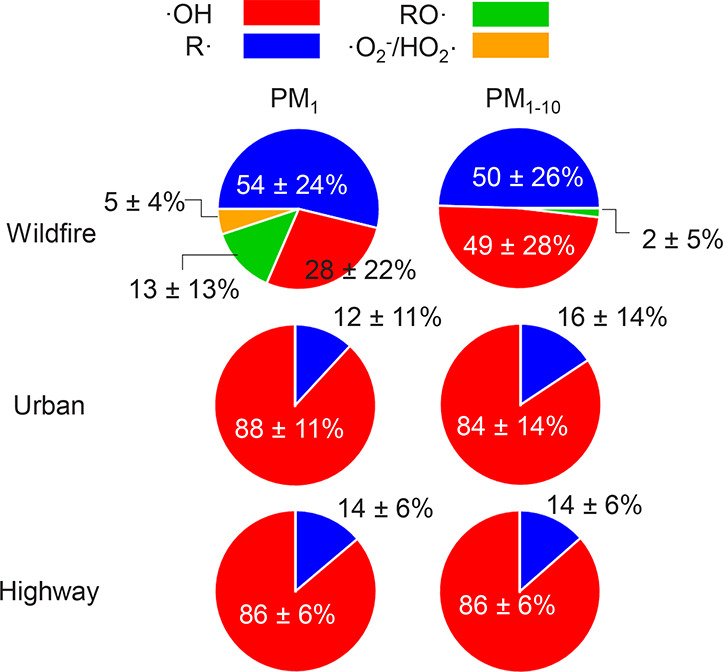
The investigators found that the quantity and composition of ROS formed by
ambient PM varied by sampling site in Los Angeles, with marked differences
between wildfire and nonwildfire samples. ROS formed per air volume were highest
in highway and lowest in wildfire samples, and the ROS formed per mass were
higher in urban compared with wildfire samples. On average, PM from urban and
highway sampling sites formed primarily hydroxyl radicals (>84%) with the
remaining proportion being carbon-centered radicals. PM from wildfire samples
formed mostly carbon-centered radicals (~50%).
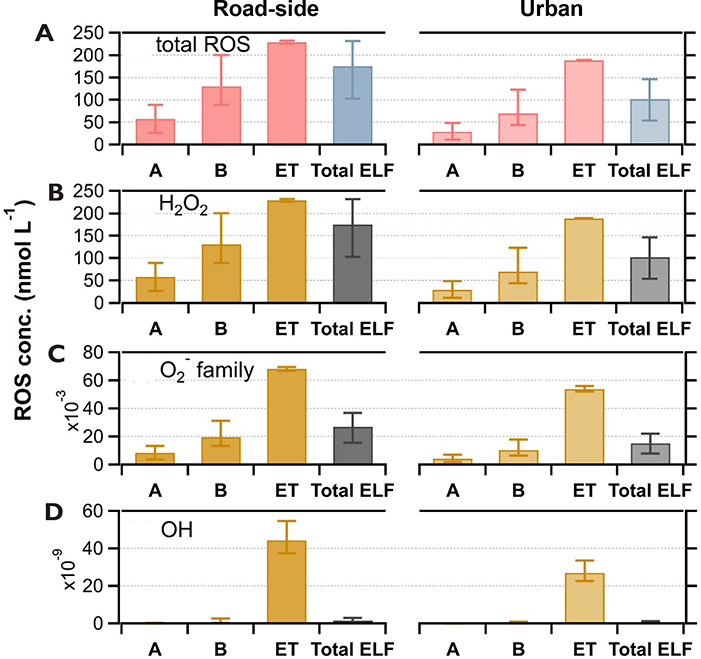
Modeling results indicated that ROS formation in the human respiratory tract
depended on the size composition of PM exposure and on ELF volume and particle
deposition in the different respiratory tract regions. ROS formation was highest
in the extrathoracic region and lowest in the alveolar region. The estimated
formation of hydrogen peroxide was highest, and hydroxyl radical was lowest. The
investigators noted that their model assumed a uniform particle size, which
would somewhat misrepresent real-world conditions because larger particles are
generally deposited in the upper respiratory tract and only smaller particles
reach deep into the lungs.
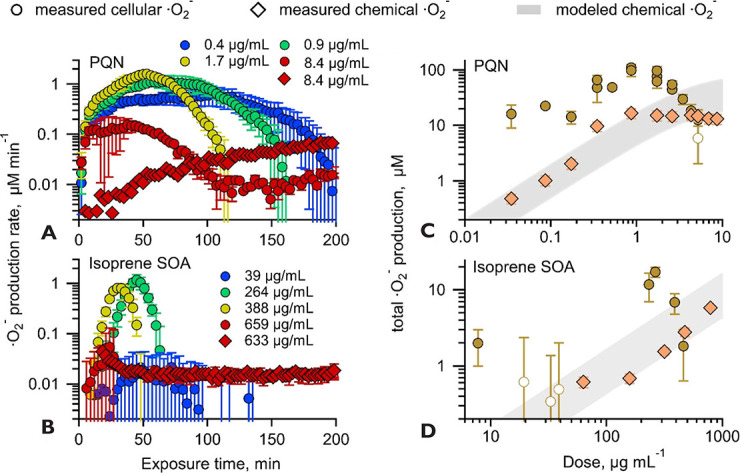
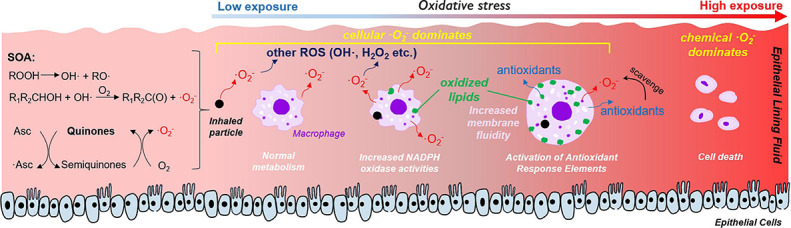
Shiraiwa and colleagues found that certain SOAs activated macrophage cells to
release higher concentrations of superoxide than what was formed through
chemical reactions in the synthetic ELF. Superoxide formation depended on the
concentration of SOA precursor and duration of the exposure. At low
concentrations, cellular formation of superoxide was 10 times higher than
chemical formation, particularly at the beginning of the experiments. The
investigators reported that the decreased superoxide formation by macrophages
over longer exposure times was due to the activation of antioxidant processes,
oxidative stress, and cell death. The chemical superoxide formation modeled by
the investigators was similar to the experimental results, providing reassurance
that the kinetic modeling approach accurately captured the processes.
INTERPRETATION AND CONCLUSIONS
Dr. Shiraiwa and colleagues demonstrated that the quantity and composition of ROS
formed by aqueous reactions highly depends on such factors as the specific
aerosol mixture, oxidation mechanisms, and other environmental conditions. They
also found that for certain exposure conditions, the ROS released by macrophages
far outweighed the ROS formation by aqueous chemical reactions. This result
implies that aerosol-induced respiratory health effects mediated by ROS might
not depend on the aerosol composition and associated chemical reactions
alone.
In its independent evaluation of the report, the HEI Review Committee members
noted that the investigators made a valuable contribution to the study of the
health effects of air pollution mediated through ROS. They thought that the work
comparing chemical versus cellular ROS formation was novel, and they appreciated
the inclusion of ambient aerosol samples from field measurements in addition to
the lab-generated aerosols. However, they thought that it was difficult to
translate the results of the experiments to real-world exposure conditions in
the human lung and that the full implications of the results were therefore
difficult to determine.
The Committee noted that the experimental methods enabled the investigators to
establish their proof of concept but that the next steps were to design
experiments under more realistic conditions. For example, the investigators used
relatively high SOA precursor concentrations in their laboratory studies to
ensure sufficient ROS yield for quantitative comparisons and selected a
macrophage cell line that is extensively used to study oxidative stress,
although not resident to the respiratory tract. Testing SOA generated from
precursor concentrations relevant to the ambient air and lung-derived
macrophages would advance future research. The investigators also simulated ELF
by including naturally occurring antioxidants and compounds, but other key
immune cells such as neutrophils would be valuable to include next. It would
also be helpful in future work to use more robust negative-control scenarios,
for example, by varying the experimental timeframes and by using nonchemical
stimuli. Furthermore, the Committee thought that the evaluation of ambient PM
samples was preliminary; it included only a few samples from three locations in
Los Angeles. Thus, any conclusions regarding wildfire versus nonwildfire PM
should be regarded with caution until a much larger set of samples has been
analyzed. The Committee noted that the kinetic modeling of ROS formation in
different respiratory tract regions demonstrated that the approach was possible.
However, as with any modeling efforts, the results hinged on the model inputs,
which can change under various realistic conditions and should be interpreted
cautiously.
In conclusion, the Committee commended Dr. Shiraiwa and colleagues for the
novelty and thoughtfulness in the study approach. This work is an important
first step in understanding the relative importance of chemical versus
biological ROS formation in the lung. Further work is recommended to evaluate
ROS formation using additional PM samples from various ambient sources and
including an evaluation of responses from other key immune cells.
Res Rep Health Eff Inst. 2023 Dec 1;2023:215.
Chemical and Cellular Formation of Reactive Oxygen Species from
Secondary Organic Aerosols in Epithelial Lining Fluid
1 Department of Chemistry, University of
California, Irvine, CA, USA
2 Division of Occupational and Environmental Medicine,
University of California, Irvine, CA,
USA
3 Department of Biomedical Engineering,
University of California, Irvine, CA,
USA
4 Department of Epidemiology, Biostatistics and
Occupational Health, McGill University,
Montreal, Canada
This Investigators’ Report is one part of Health Effects Institute
Research Report 215, which also includes a Commentary by the Review
Committee and an HEI Statement about the research project. Correspondence
concerning the Investigators’ Report may be addressed to Dr. Manabu
Shiraiwa, University of California, Irvine, Department of Chemistry, 1120
Natural Sciences II, Irvine, California, 92697-2025; email:
m.shiraiwa@uci.edu. No potential conflict of interest
was reported by the authors.
Although this document was produced with partial funding by the United States
Environmental Protection Agency under Assistance Award CR–83998101 to
the Health Effects Institute, it has not been subjected to the
Agency’s peer and administrative review and therefore may not
necessarily reflect the views of the Agency, and no official endorsement by
it should be inferred. The contents of this document also have not been
reviewed by private party institutions, including those that support the
Health Effects Institute; therefore, it may not reflect the views or
policies of these parties, and no endorsement by them should be
inferred.
Oxidative stress mediated by reactive oxygen species (ROS*) is a key process for
adverse aerosol health effects. Secondary organic aerosols (SOA) account for
a major fraction of particulate matter with aerodynamic diameter ≤2.5
μm (PM2.5). PM2.5 inhalation and deposition
into the respiratory tract causes the formation of ROS by chemical reactions
and phagocytosis of macrophages in the epithelial lining fluid (ELF), but
their relative contributions are not well quantified and their link to
oxidative stress remains uncertain. The specific aims of this project were
(1) elucidating the chemical mechanism and quantifying the formation
kinetics of ROS in the ELF by SOA; (2) quantifying the relative importance
of ROS formation by chemical reactions and macrophages in the ELF.
METHODS
SOA particles were generated using reaction chambers from oxidation of
various precursors including isoprene, terpenes, and aromatic compounds with
or without nitrogen oxides (NOx). We collected size-segregated PM
at two highway sites in Anaheim, CA, and Long Beach, CA, and at an urban
site in Irvine, CA, during two wildfire events. The collected particles were
extracted into water or surrogate ELF that contained lung antioxidants. ROS
generation was quantified using electron paramagnetic resonance (EPR)
spectroscopy with a spin-trapping technique. PM oxidative potential (OP) was
also quantified using the dithiothreitol assay. In addition, kinetic
modeling was applied for analysis and interpretation of experimental data.
Finally, we quantified cellular superoxide release by RAW264.7 macrophage
cells upon exposure to quinones and isoprene SOA using a chemiluminescence
assay as calibrated with an EPR spin-probing technique. We also applied
cellular imaging techniques to study the cellular mechanism of superoxide
release and oxidative damage on cell membranes.
RESULTS
Superoxide radicals (·O2-) were formed from
aqueous reactions of biogenic SOA generated by hydroxy radical (·OH)
photooxidation of isoprene, β-pinene, α-terpineol, and
d-limonene. The temporal evolution of ·OH and
·O2- formation was elucidated by kinetic
modeling with a cascade of aqueous reactions, including the decomposition of
organic hydroperoxides (ROOH), ·OH oxidation of primary or secondary
alcohols, and unimolecular decomposition of α-hydroxyperoxyl
radicals. Relative yields of various types of ROS reflected the relative
abundance of ROOH and alcohols contained in SOA, which generated under high
NOx conditions, exhibited lower ROS yields. ROS formation by
SOA was also affected by pH. Isoprene SOA had higher ·OH and organic
radical yields at neutral than at acidic pH. At low pH
·O2- was the dominant species generated by
all types of SOA. At neutral pH, α-terpineol SOA exhibited a
substantial yield of carbon-centered organic radicals (R·), while no
radical formation was observed by aromatic SOA.
Organic radicals in the ELF were formed by mixtures of Fe2+
and SOA generated from photooxidation of isoprene, α-terpineol, and
toluene. The molar yields of organic radicals by SOA were 5–10 times
higher in ELF than in water. Fe2+ enhanced organic radical
yields by a factor of 20–80. Ascorbate mediated redox cycling of iron
ions and sustained organic peroxide decomposition, as supported by kinetic
modeling reproducing time- and concentration-dependence of organic radical
formation, as well as by additional experiments observing the formation of
Fe2+ and ascorbate radicals in mixtures of ascorbate
and Fe3+. ·OH and superoxide were found to be
efficiently scavenged by antioxidants.
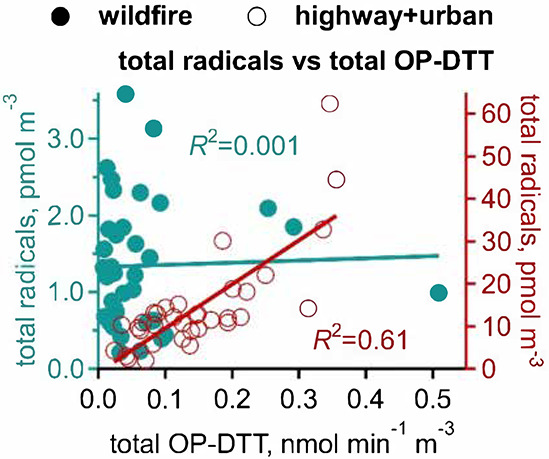
Wildfire PM mainly generated ·OH and R· with minor
contributions from superoxide and oxygen-centered organic radicals
(RO·). PM OP was high in wildfire PM, exhibiting very weak
correlation with radical forms of ROS. These results were in stark contrast
with PM collected at highway and urban sites, which generated much higher
amounts of radicals dominated by ·OH radicals that correlated well
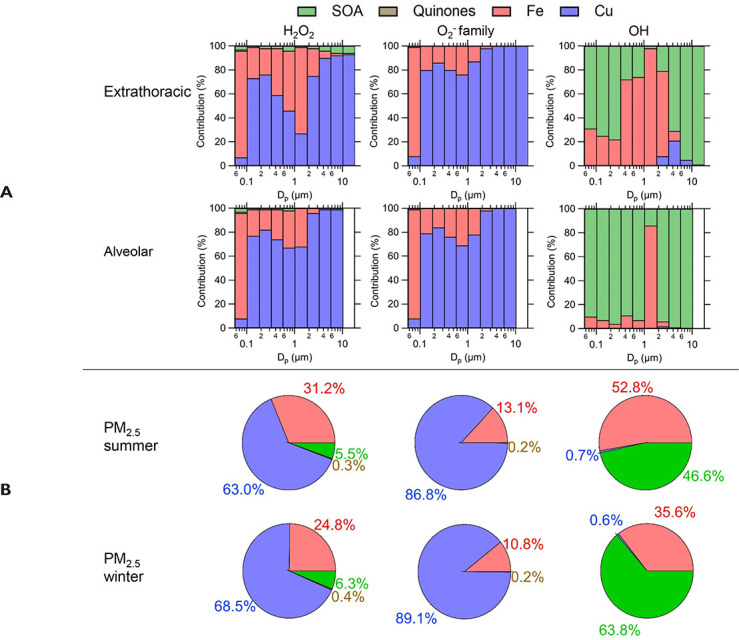
with OP. By combining field measurements of size-segregated chemical
composition, a human respiratory tract model, and kinetic modeling, we
quantified production rates and concentrations of different types of ROS in
different regions of the ELF by considering particle-size-dependent
respiratory deposition. While hydrogen peroxide (H2O2)
and ·O2- production were governed by Fe and Cu
ions, ·OH radicals were mainly generated by organic compounds and
Fenton-like reactions of metal ions. We obtained mixed results for
correlations between PM OP and ROS formation, providing rationale and
limitations of the use of oxidative potential as an indicator for PM
toxicity in epidemiological and toxicological studies.
Quinones and isoprene SOA activated nicotinamide adenine dinucleotide
phosphate (NADPH) oxidase in macrophages, releasing massive amounts of
superoxide via respiratory burst and overwhelming the superoxide formation
by aqueous chemical reactions in the ELF. The threshold dose for macrophage
activation was much smaller for quinones compared with isoprene SOA. The
released ROS caused lipid peroxidation to increase cell membrane fluidity,
inducing oxidative damage and stress. Further increases of doses led to the
activation of antioxidant response elements, reducing the net cellular
superoxide production. At very high doses and long exposure times, chemical
production became comparably important or dominant if the escalation of
oxidative stress led to cell death.
CONCLUSIONS
The mechanistic understandings and quantitative information on ROS generation
by SOA particles provided a basis for further elucidation of adverse aerosol
health effects and oxidative stress by PM2.5. For a comprehensive
assessment of PM toxicity and health effects via oxidative stress, it is
important to consider both chemical reactions and cellular processes for the
formation of ROS in the ELF. Chemical composition of PM strongly influences
ROS formation; further investigations are required to study ROS formation
from various PM sources. Such research will provide critical information to
environmental agencies and policymakers for the development of air quality
policy and regulation.
INTRODUCTION
Anthropogenic air pollution leads to a massive increase of atmospheric
PM2.5 and oxidant concentrations on local, regional, and global
scales, posing a major threat to public health (Monks et al. 2009; Pöschl and Shiraiwa
2015). The concentrations
of PM2.5 in polluted urban air are several orders of magnitude higher
than in pristine air (~10-1000 μg m-3 vs. ~1-10
μg m-3) (Pöschl and Shiraiwa 2015), and high pollutant levels can cause
serious respiratory and cardiovascular diseases, leading to elevated mortality
(Brunekreef and Holgate 2002;
Lim et al. 2013; Pope and
Dockery 2006; Rich et al. 2013). Epidemiological studies
have shown a clear correlation between air pollutants and adverse health
effects, including cardiovascular, respiratory, and allergic diseases (Dockery
et al. 1993). Ambient and indoor
air pollution by airborne PM and ozone (O3) are among the most
prominent leading risk factors for the global burden of disease (Lim et al.
2013). For example,
mortality rates in the 90 largest U.S. cities were found to rise on average by
0.5% with each 10-μg m-3 increase in PM2.5 (Kaiser
2000), and globally the
annual number of premature deaths due to air pollution are estimated to exceed 3
million with an increasing trend (Lelieveld et al. 2015; Shiraiwa et al. 2017). However, the underlying chemical processes
are poorly characterized, and a quantitative basis for assessing the relative
importance of specific air pollutants is still missing (Dockery et al. 1993; Shiraiwa et al. 2017; West et al. 2016).
Organic aerosols account for a major fraction of PM2.5 in the
atmosphere (Huang et al. 2014;
Jimenez et al. 2009). Formation
and growth of SOA is triggered by reactions of O3 and ·OH
radicals with volatile organic compounds emitted from various biogenic and
anthropogenic sources. With regard to SOA health effects, substantial amounts of
particle-bound ROS are found on ambient and laboratory-generated SOA produced
from various precursors such as α-pinene, limonene, linalool, and toluene
(Chen et al. 2011b; Pavlovic and
Hopke 2010; Venkatachari et al.
2005, 2007; Wang et al. 2010, 2011b, 2012; Zhao
and Hopke 2012). Several groups
have measured ROS in aerosol particles with offline analysis (Cho et al. 2005; Dellinger et al. 2007; Gehling and Dellinger 2013; Khachatryan et al. 2011; Kumagai et al. 1997; Venkatachari et al. 2005) and online systems (Fang et
al. 2015; Fuller et al. 2014; Wang et al. 2011a). In addition, ROOH and
peroxides were found to be major constituents of biogenic SOA and aged organic
aerosol (Docherty et al. 2005;
Epstein et al. 2014; Surratt et
al. 2006; Ziemann and Atkinson
2012). Recently, highly
oxygenated organic molecules (HOM) and extremely low volatility organic
compounds (ELVOC), which contain multiple hydroperoxide functional groups formed
by autoxidation (Crounse et al. 2013), are found to be an important constituent of SOA (Ehn et al.
2012, 2014; Jokinen et al. 2015; Mentel et al. 2015; Tröstl et al. 2016). Recent studies have shown that such HOM or
ELVOC compounds are relatively unstable (Badali et al. 2015; Krapf et al. 2016), and they may decompose upon interactions
with water to form free radicals (Riva 2016; Tong et al. 2016).
ROS are key species of both atmospheric and physiological chemistry. ROS play a
central role in the adverse health effects of air pollution, as they can cause
oxidative stress (Finkel and Holbrook 2000; Nel 2005;
Winterbourn 2008). ROS are
defined to include hydroxyl radical (·OH),
·O2-, H2O2, and
O3, as well as a wide range of R· and RO·, such as
peroxy and alkoxy radicals (Finkel and Holbrook 2000; Shiraiwa et al. 2012; Winterbourn 2008). Fine air PM contains redox-active
components like transition metals and quinones originating from gasoline and
diesel motor exhaust, cigarette smoke, and other sources including SOA formation
in the atmosphere (Cho et al. 2005; Kumagai et al. 2012; McWhinney et al. 2013; Verma et al. 2015a). Quinones are often associated with atmospheric humic-like
substances (HULIS) (Dou et al. 2015; Lin and Yu 2011; Verma et al. 2015b). Upon inhalation and deposition in the human respiratory
tract, such air pollutants can induce and sustain chemical reactions that
produce ROS in the ELF covering the airways (Gurgueira et al. 2002; Lakey et al. 2016). The ELF contains a range
of antioxidants and surfactants (van der Vliet et al. 1999), and it extends from the nasal cavity to
the pulmonary alveoli with a film thickness that decreases from several
micrometers in the upper airways to dozens of nanometers in the lungs (Mudway
and Kelly 2000). As illustrated
in Figure 1, the
redox-active pollutants and ROS undergo a multitude of radical and redox
reaction cycles in the ELF. The initial step is the transfer of electrons from
antioxidants to transition metal ions or quinones, forming reduced metal ions or
semiquinones, respectively (Charrier et al. 2014; Kumagai et al. 2012; Pöschl and Shiraiwa 2015). Transition metal ions and
quinones are regenerated by reaction with molecular oxygen (O2)
forming ·O2- radicals that are further converted
into H2O2 (Winterbourn 2008). ·OH radicals, the most reactive
form of ROS, can be produced via Fenton-like reactions of
H2O2 with iron or copper ions (Charrier and Anastasio
2011) and can also be
released upon interaction of SOA with water (Tong et al. 2016; Wang et al. 2011b). These multiphase processes have been
investigated experimentally, quantifying formation of ·OH and
H2O2 by transition metal ions and quinones in
surrogate lung lining fluid (Charrier and Anastasio 2011; Charrier et al. 2014; Jung et al. 2006; Shen and Anastasio 2011; Vidrio et al. 2008).
Interaction of air pollutants and ROS in the ELF of the human
respiratory tract. Redox-active components trigger and
sustain catalytic reaction cycles generating ROS. Asc = ascorbate;
·Asc = ascorbate radicals; H2O2 = hydrogen
peroxide; HO2 = hydroperoxyl radical; GSH = glutathione;
O2 = molecular oxygen; ·O2-
= superoxide radical; O3 = ozone; ·OH = hydroxyl
radical; SOD = superoxide dismutase; UA = uric acid; α-Toc =
α-tocopherol. Adapted from Lakey et al. 2016.
Macrophages are sentinel cells and the first cellular responders of the innate
immune system, serving several important roles in host defense: they clear dead
tissues and initiate the process of tissue repair, they ingest and destroy
microbes, and they produce cytokines to induce and regulate inflammation (Abbas
et al. 2010; Sompayrac 2022). Alveolar macrophages
reside in the ELF, protecting the lung cells and tissues from infection from
bacteria, microbes, and pathogens. Macrophages may be activated by two different
pathways: classical macrophage activation is triggered by innate immune signals.
Activated macrophages called M1 are involved in destroying microbes and
triggering inflammation, whereas M2 macrophages, by alternative macrophage
activation induced by cytokines, is relevant for tissue repair and termination
of inflammation (Abbas et al. 2010). M1 macrophages release ·O2-
after phagocytosis through a process called the respiratory
burst due to transient consumption of O2 (Forman and
Torres 2002). This process also
occurs upon exposure to atmospheric PM (Beck-Speier et al. 2005; Gurgueira et al. 2002; Kleinman et al. 2000).
Thus, ROS can be released both chemically and cellularly upon particle
deposition, but the relative importance of cellular and chemical ROS is poorly
understood and yet to be quantified. A previous study has quantified chemical
and cellular H2O2 production from macrophages upon
exposure to naphthalene SOA (Liu et al. 2020), but very limited research has been
conducted in quantifying cellular ·O2-. Cellular
release of ·O2- can be triggered by a number of
different enzymatic systems such as mitochondrial oxidative phosphorylation,
NAD(P)H (reduced nicotinamide adenine dinucleotide [phosphate]) oxidase, and
xanthine oxidase (XO) (Sachse and Wolf 2007). However, very little is known about which
·O2- generation mechanism is activated by
inhaled PM. Several methods have been developed to detect cellular
·O2- using spectroscopic (Teufelhofer et al.
2003), fluorescent (Gomes
et al. 2005; Holevinsky and
Nelson 1995), or luminescent
assays (Messner and Imlay 2002;
Yamazaki et al. 2011). The
Diogenes chemiluminescence assay is suitable for monitoring cellular
·O2- production, as Diogenes is a very
sensitive ·O2- chemiluminescence enhancer that is
nondenaturing to living cells; however, the chemiluminescence readouts show
light intensity without providing a quantitative measure for production rate or
concentration (Yamazaki et al. 2011).
While ·O2- can be converted into a less reactive
form (e.g., H2O2) by superoxide dismutase (SOD), excess
·O2- is known to be cytotoxic as it can
interfere with lipids, proteins, and DNA (Forman and Torres 2002; Kumagai et al. 1997; Sies et al. 2017; Winterbourn 2008). A specific consequence of
PM-triggered ·O2- is yet to be identified. The
antioxidant defense system can counteract ROS; however, excessive production of
ROS can overwhelm antioxidant defenses and trigger or enhance oxidative stress,
cell death, and biological aging (Finkel and Holbrook 2000; Lucas and Maes 2013; Nel 2005; Shiraiwa et al. 2012; Winterbourn 2008). Thus, characterizing the formation of ROS
in the ELF is crucial for understanding how air pollution leads to adverse
health effects like asthma, allergies, and other respiratory diseases. The
production rate and concentration of ROS induced by SOA in the ELF, however, so
far have hardly been quantified.
SPECIFIC AIMS AND STUDY DESIGN
ROS play a central role in the adverse health effects of air PM. ROS release
induced by particles can be counteracted by the antioxidant defense system;
however, it can be overwhelmed by excessive ROS production, triggering oxidative
stress (Kumagai et al. 1997;
Nel 2005; Shiraiwa et al. 2012; Winterbourn 2008). ROS are coupling
atmospheric and physiological chemistry, but their interactions at ELF are not
well understood and less quantified. Particularly poorly characterized is the
role of ROS upon respiratory deposition of SOA, as multiphase chemistry in the
ELF is highly complex — involving redox-active components, lung
antioxidants, and ROS. Previous studies (Charrier and Anastasio 2011; Charrier et al. 2014; Cho et al. 2005; Kumagai et al. 1997), including our research
team’s contributions (Arangio et al. 2016; Lakey et al. 2016; Tong et al. 2016), have shown that SOA can generate
H2O2 and ·OH radicals in the ELF. However, the
formation of other types of ROS, including superoxide and R· and
RO·, which may play an important role in oxidative stress (Birben et al.
2012; Pöschl and
Shiraiwa 2015; Pryor et al.
1995; Winterbourn 2008), had been hardly studied
and quantified. It was urgent to conduct further studies to fully unravel
kinetics and molecular mechanism of formation of ROS by biogenic and
anthropogenic SOA.
Specific Aim 1
Elucidate the chemical mechanism and quantify the formation kinetics
of ROS in the ELF by SOA.
Task A: Quantify ROS formation by aqueous
reactions of laboratory-generated SOA.
Task B: Quantify ROS formation and OP by ambient
PM.
Specific Aim 2
Quantify the relative importance of chemical ROS generated by redox
reactions and biological ROS released by macrophages in the ELF.
Task C: Model estimation of chemical ROS
concentrations in the ELF.
Task D: Quantify ROS release by macrophages
using chemiluminescence and EPR upon exposure to SOA.
The ultimate research goal is to advance the fundamental
understanding of ROS multiphase chemistry by SOA in the ELF for
better assessment, prediction, and handling of air quality and
public health. The results and implications of the proposed study
should be useful for air quality regulators for the design of
efficient control strategies against adverse aerosol health effects.
The uniqueness of this project is to quantify and compare chemical
and cellular ROS production by multipollutants (e.g., SOA,
transition metals) in the ELF by experiments and kinetic modeling to
advance the fundamental understanding of multiphase processes of ROS
for a quantitative assessment of aerosol effects on oxidative
stress.
METHODS
The research roadmap including research projects, resulting publications, and
corresponding methods is presented in Table 1.
Table 1.
Research Roadmap
Research Tasks and Publications
Methods
A. ROS formation from aqueous
reactions of SOA
A1. Superoxide formation from SOA (Wei et al. 2021b)
A2. Effects of NOx on ROS formation from
SOA (Edwards et al. 2022)
A3. Effects of pH on ROS formation from SOA (Wei et
al. 2022b)
A4. Organic radical formation by SOA in ELF (Wei et
al. 2022a)
Laboratory generation of
SOA EPR spectroscopy Fluorometric
H2O2 Assay
B. ROS formation from ambient
particles
B1. ROS formation from highway and wildfire PM (Fang
et al. 2023; Hwang et al. 2021)
B2. ROS formation vs. PM oxidative potential (Fang et
al. 2023; Hwang et al. 2021)
Ambient PM sampling using a
high-volume sampler and MOUDI EPR spectroscopy DTT
assay
C. Modeling ROS formation in
ELF (Fang et al. 2019; Lelieveld et al. 2021) Side-projects: applications to
epidemiological studies (Liu et al. 2022; Ripley et al. 2022; Stieb et
al. 2021; To et
al. 2022; Zhang
et al. 2020,
2021)
Kinetic modeling
D. Cellular vs. chemical ROS in
ELF (Fang et al. 2022)
Cell culture and exposure EPR
spectroscopy Diogenes chemiluminescence FLIM
For specific aim 1, SOA particles were generated by oxidation of biogenic and
anthropogenic precursors (such as isoprene, terpenes, and aromatics) in a
reaction chamber under various reaction conditions (Task A). Ambient particles
were collected using a high volume sampler for PM2.5 or a cascade
impactor (Task B). The collected particles on a filter were extracted into the
aqueous phase, and ROS formation was measured by multiple analytical techniques
(Task A, B). The main tool was EPR spectroscopy combined with a spin-trapping
technique for detection of radical forms of ROS (i.e., ·OH, superoxide,
R·, and RO·). H2O2 was quantified by a
fluorometric H2O2 assay, and organic (hydro-)peroxides
contained in SOA particles were measured with an iodometric-spectrophotometric
technique. The dithiothreitol (DTT) assay was used to measure OP and redox
activity of PM.
For specific aim 2, the kinetic multilayer model for surface and bulk chemistry
in the ELF (KM-SUB-ELF) (Lakey et al. 2016) was developed and applied for analysis and interpretation of
experimental data of chemical ROS concentrations due to redox reactions as
measured by EPR (Task C). As a side project, KM-SUB-ELF was applied for field
measurements of metal concentrations to estimate ROS concentrations in the ELF,
which were applied for epidemiological studies. Macrophages were exposed to SOA
that led to the release of superoxide, which was quantified using the Diogenes
chemiluminescence as calibrated by EPR with a spin-probing technique. We also
applied fluorescence lifetime imaging microscopy (FLIM) to study the cellular
mechanism of superoxide release and oxidative damage on cell membranes.
PARTICLE GENERATION AND SAMPLING
Laboratory Generation of SOA Particles
SOA particles were generated from dark ozonolysis and ·OH
photooxidation (SOAO3 and SOAOH, respectively) of
isoprene (Sigma-Aldrich, 99%), β-pinene (Sigma-Aldrich, 99%),
α-terpineol (Arcos Organics, 97%), and d-limonene (Arcos
Organics, 96%). SOAO3 particles were produced in an oxidation
flow reactor under dry and dark conditions. Prior to each experiment,
the reactor was purged with zero air (Parker 75-62 purge gas generator).
O3 was introduced into the reactor by flowing pure
O2 at 1 standard liters per minute (slm) through a
commercial O3 generator (OzoneTech OZ2SS-SS). After the
O3 concentration stabilized, pure isoprene,
β-pinene, α-terpineol and d-limonene were injected into 5
slm of purge air flow separately, using a syringe pump at a rate of
~2 μL per minute. High concentrations of precursor
(2.2×1015 cm-3 for isoprene and
1.4×1015 cm-3 for β-pinene,
α-terpineol and d-limonene) and O3
(1.8×1014 cm-3) were used to generate
enough material for analysis.
SOAOH particles were generated in a 19 L potential aerosol
mass (PAM) reactor (Kang et al. 2007). 100–500 L of VOC precursors
(isoprene, β-pinene, α-terpineol and d-limonene) were
placed in an open 1.5 mL amber glass vial, which was kept inside a glass
bottle prior to the PAM reactor. The precursors were then injected into
the chamber by a 0.5 slm of carrier flow mixed with a 6 slm of
humidified (Perma Pure humidifier, MH-110-12P-4) flow of purified air
from a zero-air generator (Model 7000, Environics). The ·OH
radicals were generated through photolysis of water molecules by 185 nm
UV radiation. The exposure time for the photooxidation of precursors in
the PAM reactor was about 3 minutes with relative humidity around
30%–40%. Despite the high ·OH concentrations
(~1011–1012 cm-3)
compared with ambient levels (~106 cm-3),
the PAM-generated SOA are found to be similar to ambient and
chamber-generated SOA in terms of yield, oxidation state,
hygroscopicity, and chemical composition (Lambe et al. 2011, 2015; Peng and Jimenez
2020). Additional
advantages of the PAM reactor include shortened experimental timescales,
ability to reach long photochemical ages, and minimized wall losses
(Peng and Jimenez 2020).
A scanning mobility particle sizer (SMPS, Grimm Aerosol Technik) was used
to record the number concentrations and size distributions of SOA
produced in the PAM reactor. The typical particle diameter of
SOAOH ranged from 30–500 nm, and the geometric
mean diameter by mass varied from 70–120 nm. Particle sampling
was initiated after the number concentrations stabilized. The SOA
particles were collected on 47mm polytetrafluoroethylene (PTFE) filters
(Millipore FGLP04700, 0.2 μm pore size) at a flow rate of 13 slm
for 40 minutes and 5 slm for 3 hours for SOAO3 and
SOAOH, respectively.
The filter samples were extracted in 1 mL spin-trap solutions (10 mM) or
Milli-Q (deionized, resistivity = 18.2 M/cm) water for 7 minutes. The
filter extracts were used for radical measurements or the
H2O2 fluorometric assay, respectively. The
mass difference before and after the extraction was regarded as SOA
dissolved in reagents, and an average molar mass of 200 g/mol was used
for the calculation of SOA molar concentrations in filter extracts. The
SOAO3 and SOAOH concentrations were in the
range of 1–16 mM, and the pH of SOA extracts varied between 4 and
6. At least three samples were prepared for each SOAO3 and
SOAOH for EPR analysis and H2O2
measurement, respectively.
Ambient Sampling with a High-Volume Sampler and a Micro-Orifice
Uniform Deposition Impactor
Highway PM
A high-volume sampler (Hi-Vol, Tisch Environmental, flow rate 1.13
m3 min-1) was used to collect ambient
PM2.5 onto prebaked 8” × 10”
micro-quartz filters at an urban site (a campus building at the
University of California, Irvine (UCI),
33°38’40.4”N
117°50’39.3”W, elevation 20 meters) and two
highway sites in Anaheim (Figure 2, Interstate 5,
33°49’09.4”N
117°55’07.5”W) and Long Beach (Figure 2, Interstate 710,
33°51’34.0”N
118°12’01.0”W) within 20 meters of the highway
roads. Interstate 5 (I-5) is one of the busiest highways in Southern
California and is known as a commuter route from Orange County to
the city of Los Angeles. The other highway site, Interstate 710
(I-710), is a major route that connects Long Beach and the Los
Angeles city with a higher fraction of heavy-duty vehicles and is
known as a heavy-duty corridor (Shirmohammadi et al. 2017). Particle
filter samples were collected for 4–12 hours daily from
1/28/2020 to 2/3/2020 at the Anaheim site, for 6–12 hours per
day from 2/4/2020 to 2/10/2020 (except on 2/9/2020) at the Long
Beach site, and for 8–11 hours at the urban site from
2/23/2020 to 2/29/2020 (except on 2/28/2020). Field blanks were
collected every other day at each site. After the collection, all
filters were wrapped in a prebaked aluminum foil and immediately
stored in a freezer (-18°C). Portions of the filters
collected from the highway sites were cut using a circular punch
with a diameter of 2.54 cm and used for measurements of
environmentally persistent free radicals (EPFR), ROS, and DTT
activities. Those from the urban sites were analyzed for EPFRs.
Measurements of EPFRs, ROS, and DTT on each filter was repeated
3–5 times. EPFR measurements were conducted within 2 weeks of
sample collection, and ROS and DTT measurements were conducted
within 4–6 months. Note that EPFRs are stable at least a year
after collection. Additionally, PM2.5 samples were
collected at both highway sites on one 47 mm Teflon-membrane filter
and two 47 mm quartz-fiber filters in parallel using a medium-volume
sampler with a Bendix Model 240 PM2.5 cyclone. These
filters were used to determine PM mass, metals, organic carbon, and
elemental carbon at the highway sites. The sampling flow rate was
37.7 L min-1 for each filter channel. The sampling
duration was 4 hours covering the following periods:
6:00–10:00, 10:00–14:00, and 14:00–18:00. The
total sampling periods overlapped with the
Sampling and wildfire locations, with smoke plumes and
wildfire hotspots from the Silverado Fire as viewed by
moderate resolution imaging spectroradiometer.
Adapted from Fang et al. 2023.
Hi-Vol sampling periods. The Teflon-membrane filters were analyzed
for PM2.5 mass and metal, while the quartz fiber filters
were analyzed for organic and elemental carbon (Wang et al. 2018).
Wildfire PM
A micro-orifice uniform deposition impactor (MOUDI Model 100NR) was
used to collect size-segregated ambient PM on Teflon filters
(Millipore Omnipore Membrane Filter, PTFE, 0.2 μm pore size,
JFWP04700) at an urban site, which is located on the rooftop of a
UCI campus building at (33°38’40.4”N
117°50’39.3”W, elevation 20 meters). In winter
2020, two wildfire events occurred near the sampling site according
to the California Department of Forestry and Fire Protection:
Silverado and Bond Fires (Figure
2). The Silverado Fire started in Silverado Canyon
(33°44’10.1”N
117°39’25.9”W) on October 26, 2020, and was
contained on November 7, 2020. The Bond Fire started off the
California State Route 241 in the Irvine area
(33°44’37.8”N
117°40’29.9”W) on December 2, 2020, and was
active for 7 days until December 10, 2020. These wildfire events
were characterized with greatly reduced visibilities and substantial
increases of PM mass concentrations up to 280 and 450 μg
m-3 for the submicron (PM1) and coarse
(PM10) fractions, respectively. Figure 2 shows the sampling and wildfire
locations and the smoke plumes from the Silverado Fire on October
26, 2020, affecting the Irvine area. The fire location was roughly
20 kilometers from the urban sampling site.
Eight sets of MOUDI filter samples were collected at the urban
location continuously for 3 days for each set during wildfire events
from October 26 to December 9, 2020. Three MOUDI sets were collected
at the highway sites (Anaheim site: 12 hrs on January 31, 2020; Long
Beach site: 12 hrs on February 7, 2020 and 5.5 hrs on February 8,
2020). Three sets were collected for 10-12 hours daily at the urban
site on February 23-25, 2020, which are considered to be urban
background samples. The MOUDI was operated with selected stages with
the remaining stages removed and without a back-up filter at a flow
rate of 30 L min-1. The 50% cut-off aerodynamic diameters
used for wildfire samples were 18, 10, 1, 0.18, and 0.056 μm.
Those for the highway and urban samples were 18, 10, 3.2, 1, 0.56,
and 0.056 μm. EPFRs, ROS formation, and OP measured with the
DTT assay (OP-DTT) in PM1 and PM1–10
are sums of the activities from MOUDI stages up to 1 μm and
between 1 and 10 μm, respectively. Field blanks were
collected without turning on the MOUDI pump at each site
(N = 11). After the collection, all blank and
sample filters were stored in petri dishes and immediately stored in
a freezer (-18°C). EPFRs, ROS formation, and OP-DTT
measurements were performed on these filter samples following the
procedures in our previous study (Hwang et al. 2021). The data are presented as per
volume of air sampled (pmol m-3 for EPFRv and ROSv, or
nmol min-1 m-3 for total OP-DTTv) or per mass
of PM (pmol μg-1 for EPFRm and ROSm, or nmol min-1
μg-1 for OP-DTTm). Frequency size
distributions of EPFRs, ROS formation, and OP were calculated by
dividing the size distribution with the sum of activities from all
MOUDI stages. Note that frequency distributions are independent of
ambient levels that can vary substantially among different sites and
sampling times.
The hourly mass concentrations of PM1 and PM10
for the urban site were obtained from the Purple Air real-time air
quality data (https://www2.purpleair.com/) from
sensors located within 0.5 kilometers of the sampling location (UCI
buildings Aldrich Hall for urban samples; the Multipurpose Science
and Technology Building for wildfire samples). The mass
concentration of PM1–10 was obtained by
subtracting the mass concentration of PM1 from
PM10. The PM mass concentrations during sampling
periods were integrated and used to normalize the data of EPFRs,
ROS, and total OP-DTT. Note that particles smaller than 56 nm were
not collected, but they only represent a minor fraction of the mass.
The Purple Air data were not available at the highway sites.
ROS DETECTION AND QUANTIFICATION
EPR Spectroscopy
Radical forms of ROS (i.e., ·OH, superoxide, R· and
RO·) were detected using a continuous wave EPR spectrometer
(Bruker) deployed in the lab at UCI. EPR spectroscopy is based on the
Zeeman effect, occurring when unpaired electrons are immersed in a
magnetic field, which splits the energy levels of the electrons into two
or more levels. The electrons with the same direction of the magnetic
field have a lower energy than the electrons with the opposite
direction. In these conditions, the sample can absorb energy from a
microwave radiation. Upon absorption, electrons have enough energy to
flip their direction against the magnetic field. The absorption spectrum
of a paramagnetic compound is recorded by irradiating the sample with a
fixed microwave frequency radiation and sweeping the magnetic field. The
absorption takes place when the gap between the energy levels matches
the energy of the microwave radiation.
The investigators successfully conducted measurements using X-band
microwave frequencies of ~9.8 GHz (Arangio et al. 2016; Tong et al. 2016). EPR spectra were
recorded at a room temperature by setting the following typical
operating parameters: a modulation frequency of 100 kHz; a microwave
frequency of 9.8 GHz; a microwave power of 2.149 mW (20 db); a
modulation amplitude of 1.0 G; a sweep width of 110.0 G; a sweep time of
175 seconds; a receiver gain of 40 db; a time constant of 40.96
milliseconds; a conversion time of 160 milliseconds; and a scan number
of 6. Paramagnetic species are characterized based on their
g-factor values. Free electrons have a
g-factor value of 2.0023 and organic radicals have
higher g-factor values (2.0030–2.0060),
depending on the number of oxygen atoms in the molecule (Dellinger et
al. 2007; Pedersen 1985).
EPR can detect and quantify relatively stable radicals, such as ascorbate
radicals (Asc·-) (Buettner and Jurkiewicz 1993), that may be
generated upon electron-transfer reactions of antioxidants and
semiquinone radicals contained in naphthalene SOA (McWhinney et al.
2013). EPR can also
detect and quantify short-lived reactive radicals by applying a
spin-trapping technique. A spin trap is a molecule that reacts
preferentially with specific radicals (i.e., ·OH, superoxide,
organic radicals etc.). Addition of a spin-trapping agent results in
reaction of spin traps with specific short-lived radicals, forming
stable radicals that can be directly detected by EPR. In this project,
we used ·OH
(5-tert-butoxycarbonyl-5-methyl-1-pyrroline-N-oxide)
(high purity, Enzo Life Sciences GmbH), which are very efficient in
trapping for ·OH, ·O2-, and organic
radicals (Tong et al. 2016; Zhao et al. 2001).
For quantification and determination of the relative abundance of
·OH, ·O2-, R·, and
RO·, EPR spectra were fit and simulated using Xenon and the
Matlab-based computational package Easyspin (Stoll and Schweiger 2006). Four types of
radicals were used to fit the spectra: BMPO-OH (hyperfine coupling
constants of aN = 14.3 G,
aHβ = 12.7 G,
aHγ = 0.61 G);
BMPO-OOH (aN = 14.3 G,
aH = 8.1 G); BMPO-R
(aγN = 15.2 G,
aH = 21.6 G); and BMPO-OR
(aN = 14.5 G,
aHβ = 16.6 G). The
deconvolution of spectra allows us to estimate the relative contribution
of four types of ROS.
The spin-counting method embedded in the Bruker software, Xenon, was used
to quantify detected radicals. In this method, the absolute amount of
free radicals was directly quantified with the spin-counting theory with
careful calibration of an EPR resonator. Spin concentrations were
calculated using the spin-counting method (Eaton et al. 2010), which we had
successfully applied in our previous studies (Arangio et al. 2016; Tong et al. 2016). The detection
limit of radicals by EPR is ~1×10¹⁰ spins
μg-1 (the number of spins or radicals per
μg of particle mass).
Diogenes Chemiluminescence
A Diogenes chemiluminescence assay combined with EPR spectroscopy was
applied to quantify cellular and chemical
·O2- production with and without SOD
pretreatments. The Diogenes chemiluminescence assay is suitable for
monitoring cellular ·O2- production
kinetics during exposure, as Diogenes is a very sensitive
·O2- chemiluminescence enhancer that is
nondenaturing to living cells (Yamazaki et al. 2011). A Diogenes probe reacts with
·O2- to emit flash chemiluminescence
signal that is proportional to the ·O2-
production rate. The output of the Diogenes chemiluminescence is in
relative light units (RLU). To convert RLU to
·O2- production rates, the Diogenes
chemiluminescence assay was calibrated with an EPR spectrometer coupled
with a spin-probe technique using the standardized cell-free
·O2- generation system — the
hypoxanthine (HX) and XO system. With the catalysis of XO, HX is
oxidized to xanthine, which is then oxidized to uric acid. This
oxidation process produces electrons that are passed to O2 to
produce ·O2- (Fridovich 1970; McCord 1985).
A spin-probe molecule CMH
(1-hydroxy-3-methoxycarbonyl-2,2,5,5-tetramethylpyrrolidine) was used to
react with ·O2- to form EPR-detectable
nitroxides radical CM· that has a characteristic three-peak EPR
spectra (Dikalov et al. 2011). CM· is stable over time and thus it can be
used to calculate the ·O2- production rate.
Instrument parameters for EPR spectra acquisition were set to the
following: a microwave frequency of 9.652 GHz; a modulation frequency of
100 kHz; a modulation amplitude of 1 G; a center field of 3520 G; a
sweep width of 80 G; a microwave power of 20 mW; a number of scans of 5;
and a receiver gain of 30 dB. Concentrations of
·O2- were obtained by simulating the
CM· spectra and counting the total number of spins using the
SpinFit and SpinCount modules embedded in the Bruker Xenon software.
The concentration of HX was fixed at 250 μM, and XO was varied in
the range of 0–0.6 mU mL-1 (U as the enzyme unit in
μmol min-1). First, XO and the probe reagent (either
50 μL Diogenes or 15 μL 3 mM CMH) were mixed in incomplete
media, yielding negligible chemiluminescence or CM· signal. Next,
HX was added to initiate the reaction in a final volume of 200
μL. Chemiluminescence and EPR measurements were then carried out
with 1.5 to 7 minutes of reaction. Pretreatments with SOD diminished the
signals to the background levels, confirming that the enhanced signals
were due to the presence of ·O2-.
·O2- production rates calculated from
the EPR spin-probe method show a linear relationship with RLU from
chemiluminescence (R2 = 0.993). Therefore,
the slope from the linear regression was used to convert the Diogenes
chemiluminescence data to ·O2- production
rate with units of μM min-1.
For cellular ·O2- measurements, after cells
were cultured in 96-well plates, the media was gently removed and 50
μL of the Diogenes probe made in sterile water was added to each
well and incubated for 2 minutes. Then 100 μL of incomplete media
(for SOD-pretreated wells, 85 μL of incomplete media and 15
μL 1,250 U mL-1 SOD in PBS buffer were added instead)
and 50 μL of sample were added to start the exposure. For
inhibitor experiments, 10 μL of the inhibitor (roughly 100
μM apocynin) was added before sample exposure. To prevent
cross-well interferences, black sealing films (AbsorbMax, EXCEL
Scientific, Inc.) were used to seal the bottom of the plates. Continuous
luminescence measurements were conducted using the plate reader every 3
minutes for 4 hours to obtain the ·O2-
production rate. The total ·O2- production
was obtained by integrating the area under the curve from the kinetic of
·O2- release as a function of exposure
time. Incomplete media and filter blanks were used as vehicle controls
for 9,10-phenanthrenequinone (PQN) and SOA, respectively. The
·O2- production rate and total
production from exposure to samples were corrected by subtracting those
from controls. Cell-free wells were also used as acellular
controls to capture any background signals, which were
subtracted from the data with cells when necessary.
For quality control, we used PQN as the positive control and calibration
using CMH to check the linearity of EPR determination of the CMH
concentration. One well of DMEM cell culture media, one well of
deinonized water, and one filter blank with and without SOD pretreatment
were run in each experiment. The measurements of chemical
·O2- production followed the same
protocol as cellular ·O2- measurements,
except cells were absent and the reaction time started when PQN or
isoprene-derived SOA particles were dissolved or extracted in incomplete
media (pH 7.4). Accounting for the time it took to prepare samples,
chemical ·O2- measurements usually started
at 15 minutes. As this delay may miss a significant portion of the
generated ROS, kinetic modeling was applied to account for ROS
generation in earlier times.
Statistical Analyses
For Diogenes chemiluminescence data, for each dose, triplicate
measurements were performed on a 96-well plate on the same
experimental day along with vehicle and acellular controls that were
used to correct experimental data. For every experiment, we included
a positive control (either 1.74 μg mL-1 PQN or 1
μM phorbol 12-myristate 13-acetate [PMA]), vehicle control
(incomplete media for PQN and filter blank for isoprene SOA), and
acellular control (without the presence of cells). Experiments with
some different doses were done on different days. One-way ANOVA
followed by the Tukey post-hoc test on the total superoxide
production from the same dose of PQN (1.74 μg
mL-1), performed on different days, show that no
significant differences were determined between the means of data
(P > 0.1). The time profile of superoxide
production and total production are presented as the mean of the
triplicate measurements, with error bars representing the
uncertainties propagated from the standard deviations of triplicate
measurements of samples and controls. For imaging, all data points
for each sample were averaged from multiple cells
(N > 10). Results were analyzed by using
unpaired student t tests. The results were
considered statistically significant at P ≤
0.05 for all exposure groups compared with control groups.
Fluorometric H2O2 Assay
A modified protocol (Wei et al. 2019) was applied for the H2O2
measurement using a fluorometric H2O2 assay kit
(MAK165, Sigma-Aldrich). 250 L DMSO and 1 mL assay buffer were added to
the red peroxidase substrate and horseradish peroxidase for
reconstitution, respectively. The reagents were divided into ten sets of
aliquots (25 L red peroxidase substrate, 100 L horseradish peroxidase,
and 2 mL assay buffer each). Prior to each analysis, one set of reagents
was used to prepare 2 mL working solutions, consisting of 20 L red
peroxidase substrate, 80 L horseradish peroxidase, and 1.9 mL assay
buffer. All H2O2 measurements were conducted
within 2 hours of the preparation of working solutions, due to the high
instability of the probe. A calibration was performed using
H2O2 standards concentrations ranging from
0.05–1.5 M, which were prepared by diluting 30 wt%
H2O2 (Sigma-Aldrich). The reaction vials (3
mL) consisted of 2.94 mL solution (Milli-Q water + filter
extracts) and 60 L working solution. The H2O2
yields from different SOA samples varied significantly, and dilution
factors were adjusted so that the final H2O2
concentrations in the reaction vial were below 1.5 M. All
H2O2 measurements were conducted with a filter
blank that used the same dilution factor as the samples. The addition of
working solution was considered to be the start of the reaction, and the
reaction vials were incubated at room temperature for 15 minutes until
the measurement. The fluorescence of the reagents was measured by a
spectrofluoro-photometer (RF-6000, Shimadzu) at excitation and emission
wavelengths of 540 and 590 nm, respectively.
Oxidative Potential by the DTT Assay
Two circular punches from each filter sample were extracted in 7 mL of
Millipore water for 8–10 minutes using the vortex mixer. The DTT
assay was conducted on the extracts and the filter using the DTT
protocol of Gao and colleagues (2017). The measured total DTT activities include the
contributions from both the water-soluble and water-insoluble fractions.
In brief, 7 mL of the extracts and the filter were incubated at
37°C with 2 mL potassium phosphate buffer and 1 mL DTT (1 mM) and
were shaken continuously in a ThermoMixer (Eppendorf North America,
Inc.). At specified time points (5, 10, 15, 20, 25 min), a small aliquot
(100 μL) of the incubated mixture was withdrawn and mixed with 1
mL trichloroacetic acid to quench the consumption of DTT. The quenched
mixture was further mixed with 2 mL Tris buffer (0.08 M with 4 mM EDTA
[ethylenediaminetetraacetate]) and 0.5 mL of DTNB (0.2 mM,
5,5’-dithiobis-(2-nitrobenzoic acid)). 1 mL of this mixture was
diluted with 9.5 mL of water and filtered using a 0.22 μm pore
syringe filter (Millex). The filtered solution was immediately measured
for absorbance at 412 nm and 700 nm wavelength using the Liquid
Waveguide Capillary Cell with an optical path length of 100 cm (World
Precision Instruments, Inc.) coupled to the ultraviolet-visible
spectrophotometer (DH-MINI, Ocean Optics, Inc.) and the multiwavelength
light detector (FLAME-T-UV-VIS-ES, Ocean Optics, Inc.). The total DTT
activities were calculated from the linear regression of absorbance
versus time and presented as the total DTT activities per volume of air
(total DTTv, pmol min-1 m-3) and per mass of
PM2.5 (total DTTm, pmol min-1
μg-1) (Fang et al. 2015). For quality control, we used PQN as
the positive control. A 5 mM solution of PQN is made in DMSO, which is
then serially diluted to a final concentration of 40.8 ng/mL in
deionized water. The standard is used in the same amount as the sample
(0.7 mL). The OP value must have a coefficient of variation less than
15%; otherwise, the experiment was repeated.
CELL CULTURE AND EXPOSURE
Cell Culture
We chose RAW 264.7 macrophages, as they are a widely applied and
established macrophage cell line for studying the oxidative stress
responses of macrophages (Forman and Torres 2002; Franzi et al. 2011; He et al. 2017; Hiura et al. 1999; Li et al. 2003). Macrophage cells (ATCC TIB-71)
were obtained and passaged in complete media (DMEM media supplemented
with 10% FBS and 1% antimycotic/ampicillin) until >80% confluent. Cells
were then seeded at a density of 4 × 10⁴ cells/mL with
200 μL per well into 96-well plates (Corning) and incubated at
37°C and 5% CO2 in an incubator for about 2 hours for
cells to fully adhere to the bottom of the culture plate.
Cytotoxicity
Cell cytotoxicity was measured using the CellTox Green Cytotoxicity
Assay, which measures the changes in membrane integrity that may occur
as a result of cell death. In brief, after cells were cultured in
96-well plates, complete media was replaced by 100 μL incomplete
media and 50 μL CellTox Green reagent for each well. The CellTox
Green reagent was made according to the package directions. To
facilitate the dye binding to DNA, cells were incubated in dark for at
least 15 minutes before 50 μL of each sample was added to
initiate exposure. Fluorescence signals were then measured with a
Microplate Reader (Promega, GloMax) for 4 hours with excitation and
emission wavelengths of 475 nm and 525 nm, respectively. The
fluorescence signals were given as RLUs.
FLUORESCENCE LIFETIME IMAGING
Phasor Approach to FLIM
The Phasor-FLIM imaging technique was applied with NADPH oxidase
activator, PMA, and inhibitor, apocynin, to study the NADPH oxidase
activities as a potential mechanism of cellular
·O2- release. The Phasor-FLIM has been
previously used to study cellular metabolism in great details (Digman et
al. 2008; Ranjit et al.
2019; Stringari et
al. 2012; Weber 1981). FLIM measures the
time a fluorophore spends during an excited state before emitting a
photon and returning to the ground state, which can vary from
picoseconds to hundreds of nanoseconds. Lifetime measurements take
advantage of absolute measurements that are independent of probe
concentration, absorption, or luminescence intensity. Furthermore, the
phasor approach has a robust computation analysis and provides an
additional dimension to fluorescence data mapping. The phasor approach
takes in fluorescence decay intensity from FLIM and Fourier-transforms
either the multi-or mono-exponential lifetime into phasor plots on a g-s
coordinate.
The NADPH oxidase complex is an important source of
·O2- in phagocytosis as activated by
bacterial products and cytokines (Bedard and Krause 2007). It should be noted
that NADH (nicotinamide adenine dinucleotide) has identical fluorescence
properties with NADPH (Rehman et al. 2017); thus FLIM cannot differentiate
NADH and NADPH, and we denote the FLIM signals as NAD(P)H. Note that
NADH reacts with O2 to produce either water or
H2O2 (Yang and Ma 2007), or produces significantly lower
·O2- than NADPH (Li and Shah 2001). Combining with the
experiments conducted using NADPH oxidase activator PMA (Nguyen et al.
2017) and inhibitor
apocynin (El-Sawalhi and Ahmed 2014), we were able to use the Phasor-FLIM method to study
the NADPH oxidase activities. NAD(P)H expresses in two forms inside
cells, bound and free states. Each state has its own fluorescence
lifetime after laser excitation, reflecting differences in structure.
Binding to proteins or enzymes causes the NAD(P)H structure to extend,
disrupting the π-π interaction and increasing the
fluorescence lifetime. Since the oxidized NAD(P)+ does
not emit auto-fluorescence, in contrast to NAD(P)H, the conversion of
NAD(P)H to NAD(P)+ will reduce the fraction of bound
NAD(P)H and cause a shift from the bound to the free end of the NAD(P)H
free-bound trajectory (Pate et al. 2014; Stringari et al. 2011). The benefits of
this method are multifold; it shows cell morphology, indicates the
localization of NADPH oxidase activities, and provides time-dependent
cellular responses without the addition of labeling probes that may
interfere with samples or cellular responses from samples.
For FLIM imaging, RAW 264.7 macrophage cells were seeded at a density of
4 × 10⁴ cells mL-1 and incubated overnight
before exposure to PQN and isoprene-derived SOA for imaging. PQN and SOA
in media in the absence of cells produced low fluorescence background
signals. Cells were imaged at 37°C and 5% CO2
environment before exposure and at different time points after the
addition of samples. FLIM images were acquired with a Zeiss LSM710 META
laser scanning microscope coupled to a 2-photon Ti:Saphirre laser (Mai
Tai, Spectra Physics, Newport Beach, CA) for excitation at 740 nm using
a 40× water-immersion objective (1.2 NA; Zeiss), and a
photomultiplier tube (H7422P-40; Hamamatsu) for detection. An ISS A320
FastFLIM box was used to collect the fluorescence decay, and data were
Fourier transformed into g and s coordinates using the SimFCS software
(Globals Software·G–SOFT LLC., Irvine UCI–CA) in
the phasor approach. 20 frames of images were collected for each time
point. The bound NAD(P)H fraction of each macrophage cell can be
obtained according to its relative location on the phasor plot. Because
NAD(P)H mainly resides in cell membranes and cytoplasm (Panday et al.
2015) and that the
fluorescence lifetimes of nuclei do not change significantly before and
after sample exposure, the nuclei were cropped out, that is, only the
fluorescence signals from the cell membranes and cytoplasm were included
in calculating the bound NAD(P)H fractions. The bound NAD(P)H fractions
from all data points for each sample were averaged from multiple cells
(N = 12–23). PQN exhibited an unusually long
lifetime distribution and relatively higher photon counts compared with
other samples (over maximum 1 μs) in that the phasors from PQN
fell outside of the NAD(P)H free-bound trajectory, while those from the
nuclei remained on the trajectory. This abnormal long lifetime was
likely caused by the delayed emission of phosphorescence from triplets
of PQN (Togashi and Nicodem 2004). The phosphorescence lifetime of aromatic ketones in a
triplet state is known to be in the range of milliseconds for
transitions forbidden by structure symmetry in the condition of low
oxygen quenching. We verified the emission of phosphorescence from PQN
using hyperspectral imaging. Before exposure, the cells’ emission
spectra exhibited a peak within a wavelength range of 450–525 nm,
which is consistent with NAD(P)H emission wavelengths. After the same
cells were exposed to PQN for 30 minutes, we observed significant
increases in the intensity below 450 nm, likely due to the emission of
phosphorescence from PQN. To avoid the lifetime of phosphorescence
interfering with the NAD(P)H fluorescence lifetime, we used PBS buffer
to wash cells after 10 minutes of incubation. After replacing with fresh
incomplete media, cells were loaded back to the FLIM system for imaging.
With this method, the lifetime phasors of PQN fell onto the NAD(P)H
free-bound trajectory.
FLIM-Laurdan
The FLIM-Laurdan imaging technique was used to study the effect of
·O2- on cell membrane fluidity as a
result of lipid peroxidation (Golfetto et al. 2013). Laurdan
(6-dodecanoyl-2-dimethylaminonaphthalene) is a fluorescent membrane
marker used to investigate membrane fluidity. This solvatochromic probe
has the ability to attach in different depths and orientation of lipid
bilayers and shift its spectral emission maximum upon hydrophobic
environmental change. When Laurdan is in a hydrophobic environment, it
has two excited states, the locally excited state, which is intrinsic to
the fluorophore, and an internal charge transfer state created by a
larger dipole moment. This polar relaxation causes water molecules in
more hydrophilic environments to reorient to the same orientation of
Laurdan’s dipole that causes energy loss. According to former
works done by the Laboratory of Fluorescence Dynamics, Laurdan lifetime
in the blue channel decreases when the probe is in a more hydrophobic
environment (Golfetto et al. 2013). Therefore, shorter Laurdan fluorescence lifetimes
correspond to increases in membrane fluidity due to lipid peroxidation.
We measured the difference of Laurdan lifetime, which does not require
the need of fluorescence intensity. Lifetime imaging is a relatively
more stable approach since it is independent of dye concentration and
also provides local changes upon the cell membrane. The dipolar
relaxation effect of Laurdan is found to cause quenching of lifetime in
both blue and green channels, only that the green channel does not shift
along the phasor plot universal circle. Hence, we used a 460/80 nm
cubical filter to collect only blue emission spectra and project phasor
points onto the universal circle to acquire absolute lifetime values.
After seeding cells in an 8-well plate, complete media was replaced with
incomplete media, and Laurdan dye was added to each well to achieve a
final concentration of 5 μM 30 minutes before exposure to
control, PQN, PMA, and isoprene-derived SOA. After some period of
exposure, the 8-well plate was loaded to the FLIM system for imaging at
800 nm.
Third Harmonic Generation Imaging
The third harmonic generation (THG) imaging technique was applied to
detect the accumulation of lipids inside the cells after exposure to PQN
(Dvornikov et al. 2019).
The excitation of the THG signal requires laser wavelengths of up to
~1000 nm, which conventional tunable titanium sapphire lasers
could not achieve. The THG imaging was carried out in the deep imaging
via emission recovery system from the Laboratory of Fluorescence
Dynamics, which uses Spectra Physics Insight DS+ femtosecond
laser tunable in the range of 68–1,300 nm. The actual focal depth
difference was found to be ~0.75 mm for a different wavelength
excitation, where NAD(P)H is 740 nm and THG is 1,050 nm. The THG signal
is generated at the interface between media with differences in third
order nonlinear susceptibility, refractive index, and dispersion, and
can be used to detect lipids. Note that THG microscopy is not affected
by long lifetime phosphorescence from PQN.
KINETIC MODELING
Aqueous Kinetic Model
A kinetic model was developed for an aqueous environment and applied to
simulate the simultaneous formation of ·OH and the superoxide
family (·O2-/HO2·), that
is, the superoxide radical and its conjugated acid
(HO2·), by aqueous reactions of SOA. The reactions
include chemical reactions of SOA components, ROS coupling reactions,
and radical-trapping reactions by BMPO. SOA chemistry includes
decomposition of ROOH, which generates ·OH radicals (Tong et al.
2016, 2018), ·OH
oxidation of primary and secondary alcohols
(R1R2CHOH) and a subsequent reaction with
O2 to form α-hydroxyperoxyl radicals
(R1R2C(O2)OH·),
decomposition of R1R2C(O2)OH· to
generate hydroperoxyl radical (HO2·) (Bothe et al.
1978; Herrmann et
al. 2005), ·OH
oxidation of ROOH (Herrmann et al. 2005),
R1R2C(O2)OH· and other SOA
components, and HO2· termination of
R1R2C(O2)OH·. Rate
coefficients of decomposition of ROOH and
R1R2C(O2)OH·, as well as
H-abstraction of R1R2CHOH, were assumed to be
independent of the structures of R groups (R1 and
R2) contained among different SOA, representing a major
model assumption. This assumption is in line with the CAPRAM 3.0 model
(Herrmann et al. 2005),
in which the rate constants of H-abstraction on alcohols vary within one
order of magnitude regardless of carbon numbers and functionalities
besides the hydroxy group. The radical composition profiles generated by
different SOA are solely determined by the relative abundance of ROOH
and R1R2CHOH groups in SOA. Potential variation of
these rate constants depending on R structures can be partly translated
into uncertainties in molar fractions of ROOH and
R1R2CHOH. The rate coefficients of ROS
coupling reactions were obtained from literature values and the unknown
rate coefficients, and molar fractions of ROOH and
R1R2CHOH contained in SOA were determined
using the Monte Carlo genetic algorithm (MCGA) to reproduce experimental
data (Berkemeier et al. 2017).
A kinetic model was also applied to simulate the radical formation by
aqueous reactions of isoprene SOA with Fe2+ in
surrogate lung fluid (SLF) containing antioxidants (see Wei et al. 2021a for details). The
reactions include radical chemistry involving SOA, ROS coupling,
reactions of Fe ions, reactions involving antioxidants, and BMPO
chemistry. The mechanisms of ·OH and
·O2-/HO2· formation
from SOA were explicitly addressed in our previous study (Wei et al.
2021b) with the
addition of Fe2+-catalyzed ROOH decomposition
(Goldstein and Meyerstein 1999; Tong et al. 2016). The RO· formation originates from
Fe2+-catalyzed decomposition of organic peroxides
(ROOR) and ROOH, which can be further converted to R· through
isomerization (Gilbert et al. 1976), decomposition (Erben-Russ et al. 1987), and bimolecular
reactions (Carrasquillo et al. 2015). Note that the rate coefficients involving SOA
chemistry were assumed to be independent of the structures of R groups
contained in isoprene SOA, representing a major model assumption. The
rate coefficients of ROS coupling reactions were obtained from
literature values. For Fe–oxidant interaction, we also consider
potential impacts of Fe–citrate ligand on the rate coefficients
as demonstrated by Gonzalez and colleagues (2017). The rate coefficients of
antioxidants with radicals and Fe ions were also adopted from
literature, except that the scavenging of R· and RO· by
ascorbate was assumed to be a few orders of magnitude slower than that
of ·OH and
·O2-/HO2·. This is in
line with the experimental results showing BMPO-OH and BMPO-OOH below
the detection limit, in contrast to the significant formation of BMPO-R
and BMPO-OR. The redox cycling of
Fe3+/Fe2+ by ascorbate is also
considered. The unknown rate coefficients and molar fractions of ROOH,
R1R2CHOH, and ROOR contained in isoprene SOA
were determined using the MCGA to reproduce experimental data
(Berkemeier et al. 2017). In the Monte Carlo search, input parameters were varied
randomly within individual bounds: the boundaries of all reaction rate
constants were generally constrained to within two or three orders of
magnitude based on literature values. The uncertainties of the rate
coefficients were obtained by running the MCGA numerous times (>100),
among which 40 parameter sets were selected that reasonably captured the
temporal trends of the experimental data.
KM-SUB-ELF Model
KM-SUB-ELF treats mass transport and chemical reactions involving ROS,
antioxidants, surfactants and redox-active components contained in PM
(Lakey et al. 2016).
The model contains over 50 reactions including Fenton and Fenton-like
chemistry, redox cycling of quinones, Fe and Cu, and
radical–radical reactions. Rate coefficients were set to
literature values when available and unknown or uncertain rate
coefficients had previously been optimized to reproduce measurements of
H2O2 and ·OH production by quinones,
Fe, and Cu in surrogate ELF, which also showed that other transition
metals such as Mn, Co, V, Ni, Zn, Cd, and Cr do not induce significant
ROS formation (Charrier and Anastasio 2011; Charrier et al. 2014). The model considers
ROS formation by SOA derived from α-and β-pinene,
isoprene, limonene, and ROS by quinones from naphthalene. Experimental
studies showed that naphthalene SOA produce mainly
H2O2 and ·O2-,
while α-and β-pinene, isoprene, and limonene SOA produce
mainly ·OH and organic radicals via the decomposition of ROOH,
which can be enhanced in the presence of iron ions via Fenton-like
reactions (Tong et al. 2016, 2018). Organic hydroperoxides generated by multigenerational
oxidation and autoxidation account for a substantial fraction of SOA
(Docherty et al. 2005;
Ehn et al. 2014). The
ROS molar yields of SOA are based on those from α-and
β-pinene, isoprene, and limonene SOA (Tong et al. 2016). The model includes
a H2O2 formation rate of 1.5 ×
109 s-1 per μg of SOA, which is based
on a 0.06% mass yield of H2O2 from terpene SOA at
pH 7.5 (Lakey et al. 2016; Wang et al. 2011b) and a total ·OH molar yield of 0.1% from SOA
(Tong et al. 2016).
For the modeling study, ambient concentrations of the different chemical
species were used as inputs to a lung deposition model, which predicts
concentrations of chemical species and OP in the ELF in different
compartments of the human respiratory tract (ICRP 1994). Fang and colleagues (2017a) collected
size-segregated ambient particles with aerodynamic diameters of
0.056–18 μm on filters at road-side and urban sites in
Atlanta, GA, in spring 2016. They measured PM OP and chemical
composition including organic carbon, brown carbon, and water-soluble
metals. As quinones and SOA measurement were not available for these
samples, their ambient concentrations were estimated from the organic
carbon ambient concentration using conversion factors based on previous
studies at the same urban site and during the same seasons (Verma et al.
2015b). In
addition, they measured PM OP for water-soluble extracts of all samples
by the DTT and ascorbic acid assays (OPDTT and
OPAA) (Fang et al. 2017b). To evaluate contributions of HULIS
to ROS formation in this study, we estimated HULIS concentrations in the
PM2.5 samples based on brown carbon measured by
absorbance at the 365 nm wavelength with an UV-VIS spectrometer.
We modeled respiratory deposition for a person doing light work, assuming
unit density spherical particles and nose-only steady breathing with a
flow rate of 1.5 m3 hr-1, a respiration frequency
of 20 min-1, and a tidal volume of 1,250 cm3.
Deposition efficiencies in different compartments of the extrathoracic,
bronchial, and alveolar regions can be found in a previous study (Fang
et al. 2017b).
Concentrations of water-soluble Fe and Cu, SOA, and quinones deposited
in the ELF for different compartments were calculated using the
following two equations: (Lakey et al. 2016)
where is the
concentration of species i (molecules cm-3)
in particle size bin j that deposited in the ELF in
respiratory compartment k; is the
ambient concentration (g m-3) of chemical species
i; is the
deposition efficiency; F is the breathing flow rate of
1.5 m3 hr-1 and t is the
accumulation time of 1.5 hours (accumulation time chosen based on the
range of time for particles to be removed by the immune system and
metabolic activities [Ghio et al. 1998, 2006]); NA is
the Avogadro number; MWi is the molecular
weight of the species i (MW for
ROS-generating quinones is 183.18 g mol-1, obtained by taking
the average value of the MW of phenanthrenequinone, 1,2-naphthoquinone,
and 1,4-naphthoquinone; MWSOA is assumed to be 200 g
mol-1); and Ak and
Dk are the ELF surface areas
(cm2) and thickness (cm) in compartment
k, respectively. is then
summed up for all size ranges to obtain the total concentration of
species i in the ELF in compartment k,
denoted as .
For the PM2.5 sample, an average deposition efficiency of
0.384 and an ELF volume of 16.7 mL were used. OP measurements were
inputted into the same equations (equations 1 and 2) to calculate the OP in the ELF, except that
the Avogadro number and MW were excluded from the
equations.
ELF concentrations of water-soluble Fe and Cu, SOA, and quinones were
inputted into the KM-SUB-ELF model to predict the concentrations and
production rates of ROS in different ELF regions for the size-segregated
samples and in the whole tract for PM2.5 samples. ROS
obtained from the model include ·OH, H2O2, and the
-O2- family. We also applied KM-SUB-ELF to quantify the
effects of PM2.5, O3, and NO2 on ROS
formation, interconversion, and reactivity, and discuss different
chemical metrics for oxidative stress, such as cumulative production of
ROS and H2O2 to ·OH conversion (Lelieveld
et al. 2021).
RESULTS
ROS FORMATION FROM AQUEOUS REACTIONS OF SOA
Superoxide Formation from SOA
Biogenic SOA were generated by both dark ozonolysis and ·OH
photooxidation (SOAO3 and SOAOH) of isoprene,
β-pinene, α-terpineol, and d-limonene. Particle water
extracts were analyzed with EPR spectroscopy coupled with a
spin-trapping technique for detection of free radicals. The observed
spectra were simulated and deconvoluted into spectra for different BMPO
adducts with radicals including ·OH,
·O2-/HO2·, R·,
and RO· (BMPO-OH, BMPO-OOH, BMPO-R, and BMPO-OR, respectively).
Note that BMPO-OOH is generated by the trapping of either
·O2- or HO2·.
Integration of deconvoluted spectra allows us to quantify contributions
from each radical species. Figure 3 shows quantifications of different types
of radicals in water extracts of SOA generated by ozonolysis or
·OH oxidation of isoprene, β-pinene, α-terpineol,
and d-limonene. Relative yields of BMPO-OH of isoprene and
β-pinene SOAO3 after 20 min of reactions are 44% and
52%, respectively, both of which further increased to >70% after 2
hours. This is in very good agreement with a previous study that
demonstrated major ·OH formation from biogenic SOA formed by
ozonolysis (Tong et al. 2018). α-terpineol SOAO3 generates
·OH exclusively, while d-limonene SOAO3 generates
·O2-/HO2· dominantly
(80%) with minor contributions from ·OH (11%) and organic
radicals (7%). In contrast to major ·OH formation by most of
SOAO3, more than 80% of radical species generated from
SOAOH are in the form of
·O2-/HO2-. All
types of SOAOH are found to have a similar
·O2-/HO2· formation
efficiency (molar concentration ratios of BMPO-radical adduct to SOA) of
0.018%-0.03%.
Relative yields of BMPO-radical adduct from aqueous
reactions of SOA generated by dark ozonolysis
(SOAO3) versus ·OH photooxidation
(SOAOH) of isoprene,
β-pinene, α-terpineol, and
d-limonene. Reprinted with permission from Wei et al.
2021b.
Copyright 2021 American Chemical Society.
The molar yields of H2O2 from SOA were also
quantified using a fluorometric H2O2 assay.
Isoprene SOA generally yields higher H2O2 compared
with other types of SOA. The H2O2 yield from
β-pinene SOAO3 (1.8% ± 0.3%) is comparable with
results of Wang and colleagues (2011b), 1.3% ± 0.9%, but around
half of the amount reported by Tong and colleagues (2018), (3.2% ±
0.7%). Isoprene SOAO3 generally produces higher
H2O2 (4.2% ± 0.7%) compared with
β-pinene SOAO3 (1.8% ± 0.3%), which is
comparable with Tong and colleagues (2018), (8.0% ± 0.8% for isoprene
SOAO3 and 3.2% ± 0.7% for β-pinene
SOAO3). For both oxidation systems with various
precursors, the production of
·O2-/HO2· is tightly
correlated with H2O2 formation, with
R2 greater than 0.9, indicating that
·O2- is an important precursor of
H2O2, or that
·O2- and H2O2
have similar types of source compounds. For β-pinene,
α-terpineol, and d-limonene SOA, the H2O2
yields from SOAO3 are about one order of magnitude higher
than those from SOAOH. This is consistent with the reaction
mechanism of ozonolysis, in which stabilized Criegee intermediates
hydrolyze to form α-hydroxyhydroperoxides that can readily
decompose into carbonyls and H2O2 (Hasson et al.
2001; Qiu et al.
2020a; Wang et al.
2011b). The
distinct profiles of ROS composition by SOAO3 and
SOAOH reflect differences in chemical compositions and
functionalities caused by different oxidation pathways. Monoterpene SOA
from ozonolysis generally contains higher fractions of ROOR
(12%–65%) compared with those from photooxidation (6%–18%)
(Docherty et al. 2005;
Mertes et al. 2012),
partly because ROOH are decomposed with prolonged UV exposure (Badali et
al. 2015; Epstein et al.
2014). As ROOH can
be a primary source of ·OH radicals through decomposition (Tong
et al. 2016, 2018), lower ROOH
fractions should lead to minor contributions of ·OH formation for
SOAOH.
Reaction Mechanism
The temporal evolution of ·OH and
·O2-/HO2·
formation from the aqueous reactions of SOA was measured. As shown
in Figure 4A,
the molar yields of BMPO-OH adducts from SOAO3 increase
over time to reach a steady state after approximately 2 hours. In
contrast, the molar yields of BMPO-OOH adducts from SOAO3
(except α-terpineol SOAO3, which was below the
detection limit) reach their maximum concentrations within a short
period of time (<30 min), followed by a slight decrease
(Figure 4B). For
SOAOH,
·O2-/HO2· yields
reach their maximum within 40 minutes but decrease gradually over 4
hours (Figure 4C). The
BMPO-OH concentrations from all SOAOH are below the
detection limit. The highly distinct time-dependent profiles of
·OH and
·O2-/HO2· formation
leads to an interesting evolution of radical composition by SOA. For
example, radical production from isoprene and β-pinene
SOAO3 is initially dominated by
·O2-/HO2·, while
·OH becomes dominant after 20 min. In comparison, d-limonene
SOAO3 and all types of SOAOH are
consistently dominated by
·O2-/HO2· (>70%)
over 4 hours.
Temporal evolution of molar yields of A. BMPO-OH and B.
BMPO-OOH adducts from aqueous reactions of SOA generated
from dark ozonolysis (SOAO3), and C. BMPO-OOH
adducts from SOA generated from ·OH
photooxidation (SOAOH) of
α-terpineol), isoprene,
β-pinene, and d-limonene. The
markers and error bars are experimental data with one
standard deviation. The dashed lines represent the best fits
of kinetic model with the shaded area denoting the modeling
uncertainties. The
·O2-/HO2· formation from
α-terpineol SOAO3 and ·OH formation
from all SOAOH are below detection limits.
Reprinted with permission from Wei et al. 2021b.
Copyright 2021 American Chemical Society.
To further elaborate on the reaction kinetics and mechanism, a
kinetic model was developed and applied to simulate the temporal
evolution of ·OH and
·O2-/HO2·
radicals. The following reactions were implemented into the kinetic
model for ·OH and
·O2-/HO2·
formation:
R1: ROOH → RO· + ·OH
R2: R1R2CHOH + ·OH
c1
R1R2C(O2)OH·
R3: R1R2C(O2)OH· →
R1C(O)R2 + HO2
·
·OH can be generated from the first-order decay of ROOH (R1)
(Chen et al. 2011a;
Tong et al. 2016,
2018). Krapf
and colleagues (2016) provided molecular evidence of the unimolecular
decomposition of labile hydroperoxides in the condensed phase
through the cleavage of the weaker O-O bond, which must lead to
·OH formation. In addition, direct ·OH formation has
been observed from the decomposition of cumene hydroperoxide (Tong
et al. 2016) (a
common proxy of atmospheric ROOH) at room temperature, and a recent
study (Tilgner and Herrmann 2018) demonstrated that the
implementation of R1 in the aqueous chemistry model CAPRAM would
account for an important source of aqueous ·OH formation from
HOM. Note that ·OH formation in R1 results from the
decomposition of ROOH without additional functionalities on the
α-carbon, as the decomposition of
α-hydroxyhydroperoxides leads to the formation of carbonyl
and H2O2 instead of to ·OH (Qiu et al.
2020a). The
generated ·OH can abstract a hydrogen atom from
α-carbon of primary or secondary alcohols to form
α-hydroxyalkyl radicals
(R1R2C(OH)·) with a yield of
c1, which immediately combine with
dissolved to form α-hydroxyperoxyl radicals
(R1R2C(O2)OH)·) (R2).
These radicals can subsequently undergo unimolecular decomposition
to form HO2· (R3) (Bothe et al. 1978; Herrmann et al.
2005).
The kinetic model also considers a number of other reactions
including ·OH loss via reactions with SOA components, ROS
coupling reactions, radical trapping by BMPO, and decay of
BMPO-radical adducts. Molar fractions of ROOH and
R1R2CHOH contained in SOA were estimated
using the MCGA to reproduce experimental data (Berkemeier et al.
2017). The
decomposition rate of ROOH estimated in this study ([0.9 –
6.5] × 10-5 s-1) is in agreement with
previous studies (Tong et al. 2016, 2017), and the lifetime of
α-hydroxyperoxyl radicals (0.002–0.06 s) is also
consistent with the aqueous chemistry model CAPRAM 3.0 (Herrmann et
al. 2005). As shown
in Figure 4, the modeling
results show good agreement with measurements within modeling
uncertainties, indicating that the above reaction mechanisms are
plausible for ·OH and
·O2-/HO2·formation
as they can explain the temporal evolution of distinct radical
profiles depending on precursors and oxidation pathways.
The model-estimated molar fractions of ROOH in isoprene,
β-pinene, and d-limonene SOAO3 are 6%–25%,
7%–35%, and 2%–12%, respectively. These estimated
ranges are reflected in uncertainties of model predictions, as
indicated by the shaded areas in Figure 4. These estimated values are comparable with the
peroxide mass fractions reported by previous studies for the same
types of SOA (~30%, ~85%, ~2%, respectively)
(Bateman et al. 2011;
Docherty et al. 2005; Nguyen et al. 2010; Shiraiwa et al. 2017), assuming that
the molar masses of peroxides and SOA components are the same. Note
that the measured total peroxide contents include both ROOR and
ROOH, which may explain the lower estimated fraction of ROOH in
isoprene and β-pinene compared with values found in the
literature. In addition, it may imply that some ROOH may be more
stable and do not decompose within the timescale of the experiment,
as has been observed for isoprene hydroxyl hydroperoxide in a recent
study (Fang et al. 2020). Significantly higher fractions of ROOH are
estimated in isoprene and β-pinene SOAO3, compared
with their corresponding SOAOH (3%–5% and
1%–3%), leading to the major contribution of ·OH
formation in SOAO3. The molar fractions of
R1R2CH(OH) in d-limonene SOA are estimated
to be higher compared with ROOH, contributing to the
·O2-/HO2·
-dominated profile for both d-limonene SOAO3 and
SOAOH. Significant amounts of
R1R2CH(OH) are predicted in most SOA
(34%–74%). Primary and secondary alcohols are generated via
multigenerational gas-phase oxidation as shown in a number of
previous experimental and theoretical studies as summarized in
review papers (Vereecken and Francisco 2012; Ziemann and Atkinson 2012).
α-terpineol SOAO3 is estimated to contain a very
small fraction of R1R2CH(OH) (0.1%–1%),
leading to suppression of the
·O2-/HO2·
formation. This is likely caused by the specific position of hydroxy
groups in α-terpineol: tertiary alcohol without α-H
for abstraction and subsequently no formation of peroxyl radicals.
The predicted very low fraction of R1R2CH(OH)
in α-terpineol SOAO3 is consistent with previous
experimental measurements (Leviss et al. 2016), showing that the primary
products (>90%) from α-terpineol ozonolysis only contain
tertiary alcohols.
Effects of NOx on ROS Formation from SOA
Naphthalene and α-pinene SOA generated in the chamber were
collected for analysis of ROS. SOA samples were extracted in a
spin-trapping BMPO solution that was able to capture different types of
radical species for detection with EPR spectroscopy. Figure 5 shows that
α-pinene SOA generated under the NOx-free condition
mainly generates ·OH radicals and
·O2-/HO2·, which is
consistent with our previous study (Wei et al. 2021b). ·OH radicals can be
generated by the decomposition of ROOH (Tong et al. 2016), and superoxide can
be formed by ·OH oxidation of primary and secondary alcohols and
unimolecular decomposition of α-hydroxyperoxy radicals (Wei et
al. 2021b). Naphthalene
SOA generated under the NOx-free condition shows the dominant
superoxide formation, which is most likely generated via redox reactions
of quinones (Tong et al. 2018). The formation of organic radicals is relatively minor
for both SOA.
Molar yields of BMPO radical adducts (BMPO-OH, BMPO-OOH,
BMPO-OR, and BMPO-R) generated from aqueous reactions of
A. α-pinene SOA and B.
naphthalene SOA, generated with NOx concentrations of
0 and 700 ppb. Error bars represent one standard deviation of 5
replicate measurements. Adapted from Edwards et al. 2022.
For SOA generated under high NOx, ROS production was
diminished for both naphthalene and α-pinene SOA. For
α-pinene SOA, the total radical yield decreased with ·OH,
and superoxide formation decreased by a factor of ~10 and
~2, respectively. For naphthalene SOA, the total radical yield
was reduced, with ·OH and superoxide reduction by a factor of
~1.5 and ~3, respectively. Given that the pH of SOA
extracts were in the range of 3–6 and considering that the pKa of
HO2· was 4.88, HO2 would be the
dominant species as the pH approaches 3,
·O2- would be dominant at pH 6, and
HO2· and ·O2-
production would be similar around pH 5. SOA extracts were slightly more
acidic for high NOx SOA compared with low NOx SOA;
in any case, we expect both species HO2· and
·O2- to be present for this pH range.
Note that our recent study showed that ROS production by α-pinene
and naphthalene SOA generated under NOx free would be higher
at lower pH (Wei et al. 2022), but the influence of NOx has a greater
effect on ROS yield than does the pH of the system. Acid may reduce the
formation of semiquinone, which may contribute to the reduction of ROS
formation.
Given that ROOH is an important source of ROS, we have quantified
peroxides using an iodometric spectrophotometric method. We found that
α-pinene SOA generated with the NOx-free condition
contains substantial amounts of peroxides, which decreased significantly
by a factor of ~7 for SOA generated with 700 ppb NOx,
while peroxide contents are comparable for naphthalene SOA for both
NOx conditions. The fate and reaction pathways of peroxy
radicals (RO2·) are critical for SOA formation. There
are competitions of NOx and HO2· to react
with RO2· radicals leading to different products as
follows:
R4: RO2 + NO → RONO2 or RO +
NO2
R5: RO2 + NO2 →
RO2NO2
R6: RO2 + HO2 → ROOH +
O2
Under high NOx conditions, R4 and R5 dominate over R6; hence,
ROOH is substantially reduced.
High-Resolution Mass Spectrometry
High-resolution mass spectrometry shows that both naphthalene and
α-pinene SOA show significant incorporation of nitrogen at
high NOx conditions. The addition of NOx
during SOA formation has led to the formation of many
nitrogen-containing compounds. While our mass spectrometry method
does not provide individual functional group information, based on
previous work we expect the nitrogen-containing groups in the
naphthalene SOA to be mostly nitroaromatics (RNO2) and in
the α-pinene SOA to be organonitrates (RONO2).
Both SOA types show monomer (>250 Da) and dimer (250–500 Da)
regions. The α-pinene SOA also shows the formation of a small
trimer region above 500 Da. The major peaks in both naphthalene SOA
conditions generally have formulas of
C8–10H6–8O2–5.
The major peaks in both α-pinene SOA conditions have formulas
of
C8–10H12–16O2–5.
For the α-pinene SOA, there are also a few C7
compounds that are abundant and less typical of previously reported
α-pinene SOA. These C7 compounds may be a result
of in-source fragmentation due to the spray voltage being too high
during mass spectrometry analysis, particularly since this is not
evident in the aromatic naphthalene SOA, which will be less
susceptible to fragmentation. The high NOx environment
saw the incorporation of nitrogen into the final product, forming an
organic nitrate. In the complete product list, more organic nitrate
compounds were present as well, agreeing with the aforementioned
studies that show the formation of these compounds in a high
NOx environment.
Effects of pH on ROS Formation from SOA
Acidity is an important physicochemical property of atmospheric aerosols,
but its effects on the ROS formation from SOA have been poorly
characterized. By applying the EPR spin-trapping technique and the
Diogenes chemiluminescence assay, we investigated radical yields and
composition at differing pH in the range of 1–7.4 from SOA
generated by oxidation of isoprene, α-terpineol, α-pinene,
β-pinene, toluene, and naphthalene. The solid color bars in
Figure 6
show the relative abundance and BMPO-radical yields from SOA generated
from six different precursors. The BMPO-radical adduct yields from
isoprene and α-terpineol SOA at neutral pH are significantly
enhanced to 0.10% and 0.035% from <0.05% and <0.02% at
acidic conditions, respectively. Isoprene SOA at neutral pH generated
substantial amounts of ·OH (45%) and R· (44%) with a very
minor contribution from RO· (8%), while α-terpineol SOA
shows dominant R· formation at neutral pH (Figure 6A, B). In comparison, both isoprene and
α-terpineol SOA produced
·O2-/HO2·
(52%–64%) predominantly in acidic conditions, while ·OH
(10%–22%) and R· and RO· (13%–33%)
constituted only minor fractions, as consistent with our recent study
(Wei et al. 2021a). It
should be noted that the highly acidic condition (pH = 1.0) does not
lead to notable differences in radical yields and relative abundance
compared with the original SOA extracts with moderately acidic
conditions (pH = 3.0–3.5).
Yields and relative abundance of different radical species
from A. isoprene SOA, B.
α-terpineol SOA, C. α-pinene SOA,
D. β-pinene SOA, E. toluene
SOA, and F. naphthalene SOA at different pH in the
presence of spin-trapping agent BMPO. The solid-colored bars
represent BMPO-radical adducts measured by EPR, while the green
dashed bars represent superoxide yields estimated from the
Diogenes assay. Note the italic bold numbers at pH 7.4 are
calculated combining the results of EPR and the Diogenes assay.
The error bars represent the error propagation from the two
duplicates in EPR measurements or the Diogenes assay with the
uncertainty in SOA mass measurements. Adapted from Wei et al.
2022.
In addition, we characterized radical formation from α-pinene,
β-pinene, toluene, and naphthalene SOA (Figure 6 C–F) at differing pH.
α-pinene and β-pinene SOA (Figure 6C, D) showed an inverse trend to
isoprene and α-terpineol SOA, with substantially lower
BMPO-radical yields at neutral pH (<0.01%) compared with acidic
conditions (0.02%–0.036%). At neutral pH, α-pinene and
β-pinene SOA mainly generated low amounts of R· and
RO·, while the dominant formation of
·O2-/HO2· (>60%) was
observed under acidic conditions, similar to isoprene and
α-terpineol SOA. For aromatic (toluene and naphthalene) SOA
(Figure 6E, F), we observed
dominant superoxide formation (90%–100%) in acidic solutions,
whereas no radicals above detection limit were found at neutral pH.
An interesting result as observed from Figure 6 is that no BMPO-OOH (green solid bars) was detected
at pH 7.4 for all SOA, raising a question if the EPR spin-trap method
with BMPO can detect superoxide efficiently at neutral pH. Given the pKa
of HO2· (4.88), the predominant form of superoxide in
acidic conditions (pH 3.0 and 1.0) should be HO2·,
whereas it is ·O2- at neutral pH
(Gutteridge 1995). It
has been reported that a nitrone spin trap can react with
HO2· very efficiently (e.g., BMPO +
HO2· → BMPO-OOH), while the trapping of
·O2- is a two-step process via an
initial addition of ·O2- to BMPO to form
the BMPO-O2- adduct followed by protonation by
water (or other acidic sources) to form BMPO-OOH (Villamena et al. 2005). As a consequence,
the overall rate of ·O2- trapping in
neutral conditions can be an order of magnitude slower compared with
HO2· trapping in acidic conditions (Tsai et al.
2003). Hence, we
applied the Diogenes chemiluminescence assay, which is more sensitive in
superoxide measurements at neutral pH. All biogenic SOA show positive
superoxide production rates, varying from 0.005–0.013 μM
min-1. In contrast, toluene and naphthalene SOA do not
generate ·O2-/HO2· above
the detection limit, as consistent with the EPR spin-trap method (Figure 6E, F). Overall, the
cross-validation by the Diogenes assay suggests that the superoxide
yields at neutral pH may be underestimated by BMPO trapping. Therefore,
we estimated the total superoxide production yields by the Diogenes
assay at neutral pH, which are added as green dashed bars in Figure 6. For isoprene and
α-terpineol SOA, the additional ·O2-
formation at pH 7.4 can further increase the enhancement factors
compared with acidic conditions, while the radical yields from
α-pinene and β-pinene SOA are still much lower at neutral
pH even after considering ·O2- formation.
Both methods confirm that superoxide formation is below the detection
limit from toluene and naphthalene SOA at pH 7.4, consolidating that
aromatic SOA containing quinone-type compounds mediate redox cycling and
·O2- formation in a pH-dependent manner
(Guin et al. 2011).
To better understand the pH effects on ROS formation mechanism from SOA,
we measured radical formation from commercially available ROOH at
differing pH. We found predominant ·OH formation (70%–90%)
from 10 mM cumene hydroperoxide and tert-butyl
hydroperoxides at neutral pH, with total radical yields up to 0.014% and
0.04%, respectively. The unimolecular decomposition of labile ROOH can
lead to ·OH formation through the cleavage of the weaker O-O bond
(Krapf et al. 2016;
Tilgner and Herrmann 2018). In acidic solutions (pH 3.0 and 1.0), however, both
ROOH generate much lower ·OH (radical yields <0.0009%).
While the first-order decomposition of peroxides should be a thermal
process depending on temperature instead of pH, it may be suppressed at
higher acidity due to the acid-catalyzed rearrangement of alkyl
hydroperoxides (Anderson and Smith 1968; Levin et al. 2006; Walling 1963). This alternative pathway would
lead to alcohol and ketone formation as the end products, involving no
radical formation (Yaremenko et al. 2016). A similar mechanism has also been
shown for aliphatic alkyl hydroperoxides including
tert-butyl hydroperoxide (Deno et al. 1970). Therefore, it may
partially account for the decreased radical formation by isoprene and
α-terpineol SOA at lower pH, although the complex and
multifunctionalized nature of ROOH in SOA may not be accurately
represented by cumene or tert-butyl hydroperoxides. The
major contribution from ·OH by isoprene SOA may be due to its
higher fraction of ROOH (3%–5%) compared with α-terpineol
SOA (1%–3%) (Wei et al. 2021b).
Quinones, often contained in aromatic SOA, are well known to induce
superoxide formation: in the presence of an electron donor, quinones can
be reduced to semiquinone radicals that can further react with dissolved
O2 to form superoxide (Bates et al. 2019; McWhinney et al. 2013). The pH dependence
of the quinone redox cycling has rarely been discussed in the context of
ambient PM, so we measured radical formation in the mixture of 0.2 mM
5-hydroxy-1,4-naphthoquinone (5-H-1,4-NQ) and 0.2 mM ascorbate. Note
that 5-H-1,4-NQ alone did not generate radicals above the detection
limit. We found significantly higher superoxide production at lower pH.
It has been demonstrated that the quinone–hydroquinone couple has
a redox potential dependent on pH in a straightforward Nernstian manner
(Guin et al. 2011),
which follows that increasing pH causes a decrease in the redox
potential (Walczak et al. 1997). This provides a thermodynamic explanation on favoring
·O2-/HO2· formation
through stronger quinone redox cycling in acidic conditions compared
with neutral pH (Figure 6E, F).
It has been shown that hydroquinones can be unstable at physiological
pH, undergoing autoxidation to form semiquinone radicals and quinones
with the concomitant generation of ·O2- and
H2O2 (Yuan et al. 2014). Further studies are necessary to
evaluate the relevance of such pathways, especially for SOA generated
from phenolics such as catechol and cresol (Hoffmann et al. 2018; Schwantes et al.
2017).
In addition to radicals, we characterized H2O2
yields from all SOA at differing pH. Overall, higher
H2O2 yields are consistently observed for all
SOA as pH decreases from 7.4 to 1.0, with the enhancement factors
varying from 1.5 to 3. This is in good agreement with Wang and
colleagues (2011b) who
observed that H2O2 generation by α-pinene,
β-pinene, and toluene SOA increased by a factor of 1.5, 2.4, and
1.75, respectively, when pH decreased from 7.5 to 3.5. Isoprene SOA
shows significantly higher yields of H2O2
(4.0%–6.6%), compared with other SOA (<2.0%) with the
H2O2 level (4.2%) in the original extract (pH
3.5), in excellent consistency with our previous study (4.3% ±
0.4%) (Wei et al. 2021b). Naphthalene SOA shows the second highest
H2O2 yields (1.4%– 2.0%), which is
comparable with Liu and colleagues (2020) (1.9%–2.5%). Qiu and
colleagues (2020b)
recently proposed that the decomposition of
α-hydroxyalkyl-hydroperoxides is a proton-catalyzed process
associated with H2O2 formation, which is a highly
plausible mechanism accounting for the elevated
H2O2 yields from biogenic SOA. For toluene and
naphthalene SOA, the enhanced superoxide formation with higher acidity
may subsequently lead to H2O2 yields because
·O2- is known as an important precursor
of H2O2 (Hayyan et al. 2016). Given the low
·O2- formation but high
H2O2 yields from naphthalene SOA, additional
H2O2 sources could be important, including
decomposition of hydroxyhydroperoxides (Liu et al. 2020), which may account for significant
fractions in naphthalene SOA (Kautzman et al. 2010).
Organic Radical Formation by SOA in ELF
Respiratory deposition of SOA and iron may lead to the generation of ROS
and free radicals in lung fluid to cause oxidative stress, but their
underlying mechanism and formation kinetics are not well understood. In
this work we demonstrate substantial formation of organic radicals in
SLF by mixtures of Fe2+ and SOA generated from
photooxidation of isoprene, α-terpineol, and toluene. Figure 7A shows the
observed EPR spectra of isoprene SOA in water and SLF in the absence of
Fe2+ or in the presence of 0.4 mM
Fe2+. As shown in Figure 7B, we find striking enhancements in the
observed total radical yields with Fe2+ addition in
both water (from 0.07% to 0.57%) and SLF (from 0.005% to 0.42%) with
large changes in radical composition. Isoprene SOA in water leads to the
predominant formation of superoxide (64%) with a minor contribution from
·OH and R·. Upon the addition of 0.4 mM
Fe2+, the radical profile becomes dominated by
·OH (77%) with contributions from
·O2-/HO2· (15%) and
R· (8%). In the presence of antioxidants in SLF without
Fe2+, only R· are observed, while a minor
contribution from RO· (16%) is also observed with 0.4 mM
Fe2+. ·OH and
·O2-/HO2· radicals
are not observed in SLF, indicating effective scavenging of these highly
reactive species by antioxidants, which is consistent with the formation
of Asc·- (Buettner and Jurkiewicz 1993) in Figure 7A.
A. EPR spectra of isoprene SOA with 0 or 0.4 mM
Fe2+ in water and SLF in the presence of
spin-trapping agent BMPO. The dashed vertical lines represent
different BMPO-radical adducts and Asc·-.
B. Yields and relative abundance of different
radical species including BMPO-OH (red), BMPO-OOH (green),
BMPO-R (yellow) and BMPO-OR (blue) from isoprene (ISO),
α-terpineol (AT), and toluene (TOL) SOA in water and SLF
with 0 or 0.4 mM Fe2+. The radical yields
shown peaked at a reaction time of 20 min in water and 60 min in
SLF, respectively. The error bars represent the error
propagation from the two duplicates in EPR measurement and the
uncertainty in SOA mass measurements. BDL = below the detection
limit. Reprinted with permission from Wei et al. 2021a. Copyright
2021 American Chemical Society.
In addition to isoprene SOA, α-terpineol and toluene SOA are also
characterized for the radical yields in water and SLF. In water,
α-terpineol and toluene SOA alone consistently generate radicals
dominated by ·O2-/HO2·
(>90%). The total radical yields are elevated by a factor of 4–8
upon Fe2+ addition: α-terpineol SOA exhibits
dominant (83%) ·OH formation, which is similar to isoprene SOA
(77%), while we observe no ·OH above the detection limit from
toluene SOA + Fe2+ in water. In SLF, Figure 7B shows consistent
enhancement effects by Fe2+ in organic radical
formation, with radical yields increasing substantially from 0.008% to
0.19% for α-terpineol SOA and from below the detection limit to
0.04% for toluene SOA, respectively. R· are the dominant species
for α-terpineol (92%) and toluene (74%) SOA with minor
contributions from RO· (8% and 26%, respectively). Overall, we
observe the highest radical yields and strongest enhancement effects of
Fe2+ (by a factor up to ~80) from isoprene
SOA, followed by α-terpineol and toluene SOA.
To elucidate the chemical mechanisms of organic radical formation by SOA
and Fe2+, we developed and applied a kinetic model to
simulate the temporal evolution of R· and RO· radicals.
The following reactions were implemented into the kinetic model for
radical formation from isoprene SOA and Fe2+ based on
previous studies:
R1: ROOH → RO· + ·OH
R7: ROOH + Fe2+ → RO- +
·OH + Fe3+
R2: R1R2CHOH + ·OH c1
R1R2C(O2)OH·
R3: R1R2C(O2)OH· →
R1C(O)R2 + HO2 ·
R8: ROOR' + Fe2+ → RO· +
R'O- + Fe3+
SOA contains ROOH, which can undergo thermal decomposition to yield
·OH radicals (R1), which can be drastically promoted by
Fe2+ with the Fenton-like reaction leading to
enhanced formation of ·OH (R7) (Tong et al. 2016). HO2· is formed
subsequently by ·OH oxidation of primary or secondary alcohols
(R1R2CHOH), followed by fast addition of
dissolved O2 (R2) and unimolecular decomposition of
α-hydroxyperoxyl radicals (R3) (Herrmann et al. 2005). Our recent study
showed that this mechanism can explain the dominated
·O2-/HO2· formation
from the aqueous reactions of isoprene and terpene SOA in the absence of
Fe2+ (Wei et al. 2021b). While organic peroxides
(ROOR’) are thermally stable, they are known to be reactive
toward Fe2+, releasing RO· radicals (R8) in
analogy to R7 (Denisov and Tumanov 2005; Eames and Watkinson 2001). To confirm
Fe2+-facilitated decomposition of ROOR, we
measured radical formation in mixtures of Fe2+ and
commercially available ROOH and peroxides in water and SLF.
tert-butyl peroxybenzoate,
tert-butyl peracetate (a ROOR) and cumene hydroperoxide
(an ROOH) produce various radicals via Fenton-like reactions of
Fe2+ in water. In SLF, only R· was formed,
and other radicals (·OH, ·O2-,
RO·) were hardly observed. It indicates efficient scavenging of
reactive radicals by antioxidants and rapid conversion of RO· to
R·. Indeed, we observed significantly higher formation of
R· than RO· from isoprene SOA in both water and SLF (Figure 8A, B), most likely due to
the rapid conversion of RO· to R· via isomerization,
decomposition, and a bimolecular reaction resulting in H abstraction
(Studer and Curran 2016).
Temporal evolution of molar yields of A. BMPO-R and
B. BMPO-OR from aqueous reactions of isoprene SOA and
Fe2+ (0–0.8 mM) in SLF. C. Yields of
R· (yellow) and RO· (blue) from isoprene SOA in
SLF as a function of [Fe2+]/[ISO] molar
ratios. The markers are experimental data. The solid lines
represent the best fits of the kinetic model and the shaded
areas represent the modeling uncertainties. D.
Organic radical yields (BMPO-R + BMPO-OR) are plotted
against total peroxide molar fractions in isoprene,
α-terpineol, and toluene SOA with 0 (square) or 0.4 mM
(circle) Fe2+. The color scale represents the
DTT consumption rate normalized by SOA mass (DTTm). The error
bars in all panels represent the error propagation from the two
duplicates in EPR measurement or total peroxide measurement and
the uncertainty in SOA mass measurements. Reprinted with
permission from Wei et al. 2021a. Copyright 2021 American
Chemical Society.
The significantly higher formation of organic radicals in SLF than in
water can be attributed to redox cycling of
Fe3+/Fe2+ mediated by
antioxidants: Fe3+ + AscH- →
Fe2+ + H+ +
Asc·-. Fe3+ can be reduced
rapidly to regenerate Fe2+ by Asc·-
(Buettner and Jurkiewicz 1996; Lakey et al. 2016; Sun et al. 2020; Valko et al. 2005) to sustain organic radical formation. The model
sensitivity analysis revealed that such recycling of
Fe2+ contributes to 5–10 times higher
organic radical formation in the SLF than in water. Note that a very
recent study suggested that Fe3+ and ascorbate
reactions are catalytic rather than redox reactions (Shen et al. 2021):
Fe3+ + ascorbate + O2
→ Fe3+ + dehydroascorbic acid +
H2O2. To further investigate the nature of the
Fe3+–ascorbate reaction, we measured
Fe2+ in the mixtures of Fe3+ and
ascorbate in water or PBS buffer solutions. We found that 12%–14%
of Fe3+ can be reduced to form Fe2+
in water, which can be further enhanced when buffered by PBS
(18%–47%). In addition, EPR measurements showed that
Asc·- is formed in the
Fe3+–ascorbate mixtures when buffered by PBS,
which is only generated by redox instead of catalytic reactions.
Interestingly, both Fe2+ and Asc·-
measurements indicate that Fe3+–ascorbate redox
reactions are highly pH-dependent and more prominent when buffered by
PBS. We also conducted sensitive analysis in the model, showing that the
redox reactions remain the dominant channel of
Fe3+–ascorbate interaction even if the
catalytic reactions are considered. Future studies are required to
elucidate the relative importance of catalytic and redox reactions
between Fe3+ and ascorbate particularly under
differing pH.
Overall, the implemented mechanisms successfully reproduce the time
dependence of organic radical formation (Figure 8A, B) as well as the concentration
dependence (Figure 8C),
demonstrating the consistency of model simulations with experiments. We
measured peroxide molar fractions in SOA, showing a positive correlation
with organic radical yields by SOA in the presence of
Fe2+ (circles in Figure 8D). It indicates that peroxides (ROOR + ROOH)
are highly probable sources of aqueous organic radical formation. This
is in line with a very recent study showing that the total ROS
production from cooking SOA can be enhanced substantially through
atmospheric aging, coinciding with the elevation in peroxide contents
(Wang et al. 2021).
Isoprene SOA is measured to have high peroxide content (~97%)
compared with the measurements of Surratt and colleagues (2006) (~61%, from
a Teflon chamber). This difference may be due to excess
RO2· chemistry in the PAM reactor, inducing more
production of peroxides through termination steps such as
RO2· + HO2· → ROOH and
RO2· + RO2· → ROOR
(Ziemann and Atkinson 2012). Toluene SOA has the lowest peroxide content with 18%,
which is consistent with a previous study (Sato et al. 2007), leading to a lower
organic radical yield.
To investigate the linkage between organic radical formation and OP, we
performed the DTT assay on mixtures of SOA and Fe2+;
the results are shown by the color scale in Figure 8D. The DTT consumption rates normalized
by SOA mass (DTTm) for isoprene SOA (33.4 ± 6.2 pmol
min-1 μg-1) and toluene SOA (22.3
± 2.5 pmol min-1 μg-1) are
consistent with previous studies (Fujitani et al. 2017; Jiang et al. 2016). With the Fe2+
addition, clear enhancements of DTTm are observed for all types of SOA.
Due to the moderate DTT activity from Fe2+ alone, SOA
and Fe2+ demonstrate a strong synergistic effect in
causing OP. Figure 8D shows no
clear association between organic radical yields and DTTm. Despite the
lowest organic radical yields from mixtures of toluene SOA and
Fe2+, they induce relatively high DTTm (42.8
± 0.4 pmol min-1 μg-1), which is
comparable with mixtures of isoprene SOA and Fe2+
(49.0 ± 11.2 pmol min-1 μg-1). Tuet
and colleagues (2017b)
reported generally higher DTT activities from anthropogenic SOA than
from biogenic SOA, although the interactions of SOA and transition
metals in OP are still understudied. Dedicated studies are necessary to
further elucidate the link between ROS formation and OP from SOA.
ROS FORMATION FROM AMBIENT PARTICLES
ROS Formation from Highway and Wildfire PM
The EPR measurements show that ambient PM2.5 collected from
the two highway sites generate mainly ·OH and R· upon
interaction with water (Figure
9). ROS from highway and urban background are
predominantly comprised of ·OH (84%-88%) with a 12%-16%
contribution from R· for both PM1 and
PM1–10. The dominant contribution of ·OH in
ROS formation at highway and urban particles is also supported by
·OH and total radical forms of ROS showing very similar size
distributions, ROSm levels, and a tight correlation
(R2 = 0.99). In contrast, for the
wildfire PM, ·OH and R· have roughly equal contributions
(~50%) to the total radical forms of ROS in
PM1–10, whereas in PM1, R· (54%)
and ·OH (28%) contribute substantially with some contribution
from RO· (13%) and
·O2-/HO2· (5%). The
correlation between ·OH and total radical forms of ROS from the
wildfire PM is strong for particle sizes larger than 1 μm
(R2 = 0.89), while the correlation for
PM1 is weaker (R2 =
0.40).
Averaged fractions of ·OH, R·, RO·,
and ·O2-/HO2·
in total radical formation in the aqueous extracts of
PM1 and PM1–10 collected
during wildfire events and at highway and urban sites in the
Los Angeles area (see sampling locations in Figure 2).
Adapted from Fang et al. 2023.
As shown in Figure
10A, ROS generated by wildfire PM have distinct
frequency size distributions compared with those in highway and urban
PM. Total radical forms of ROS in wildfire particles show a bimodal
distribution with one peak at small sizes (0.056–0.18 μm)
and the other peak at large sizes (10–18 μm), whereas
total radical forms of ROS in highway PM exhibit a single mode peaking
at the 0.56–1 μm size range; urban PM has another peak at
10–18 μm. The ambient concentrations of ROSv in
PM1 and PM1–10 follow the order of
highway > urban > wildfire (Figure
10B). In terms of ROSm, the urban PM has much higher levels
in PM1 and PM1–10 compared with the
wildfire PM. These results suggest that wildfire emissions lead to less
total radical formation compared with traffic emissions. This may be
because biomass burning PM contains many pyrolyzed, less oxidized, and
insoluble components as well as inorganics such as potassium and
sulfate, which are not redox active (Khamkaew et al. 2016; Li et al. 2021).
A. Average frequency distributions and
B. air volume-normalized and PM mass-normalized
concentrations of EPFRs, ROS, and total OP-DTT of ambient PM
collected during wildfire events (N = 8) and at
highway (N = 3) and urban (N =
3) sites. Data are presented as mean and the standard deviation
from different sampling days. PM1 and
PM1–10 are sum of all MOUDI stages up to 1
μm and between 1 and 10 μm, respectively. PM mass
concentrations are not available at the highway sites. Adapted
from Fang et al. 2023.
RO· and ·O2-/HO2·
are only observed in wildfire PM1. RO· shows a strong
correlation with total radical forms of ROS
(R2 = 0.71) and a moderate correlation
with R· (R2 = 0.53).
·O2-/ HO2· is
moderately correlated with the total radical forms of ROS
(R2 = 0.41) and ·OH
(R2 = 0.50) but is not correlated with
RO· or R·. The correlations among different radical
species suggest that the organic radicals (RO· and R·)
would be associated with similar aqueous chemistry that may be distinct
from the formation chemistry of ·OH and
·O2-/HO2·. Biomass
burning has been found to be an important primary source for ROOH (Lee
et al. 1997; Snow et
al. 2007). The
decomposition of ROOH can generate alkoxyl and ·OH radicals (Fang
et al. 2020; Tong et al.
2016, 2018). Alkoxyl radicals
can undergo decomposition (e.g., RO· → R’·
+ R”C(O)H) and isomerization (e.g., RO· →
(OH)R·) to form alkyl radicals (Chen et al. 2011a), whereas ·OH oxidizes
primary or secondary alcohols to form α-hydroxyalkyl radicals,
followed by O2 addition to form α-hydroxyperoxyl
radicals that may decompose to form
·O2-/HO2· (Wei et al.
2021b). The
correlations between ·OH and
·O2-/HO2· may also be
explained by a common role of iron ions in the decomposition of
H2O2 to form ·OH and reduction of
O2 to form ·O2- (Fenton
1894;
Santana-Casiano et al. 2005); synergistically, these Fe-mediated ·OH and
·O2- formations may be enhanced by the
presence of HULIS and quinones in biomass burning PM (Charrier and
Anastasio 2015; Gonzalez
et al. 2017; Xiong et
al. 2017). Other
chemical components in biomass burning may also explain the ROS
formation: for example, ROOR can react with iron ions to form organic
radicals (Wei et al. 2021a); Fe–organic complexes may release ROS by
photolytic reactions (Alpert et al. 2021), and EPFRs can also reduce the
O2 to form ·O2- (Khachatryan
et al. 2011). Overall,
the observed ROS formation should be a consequence of highly complex
chemistry involving a variety of reactive and redox-active components in
biomass burning PM; future laboratory studies are warranted to
characterize specific ROS formation pathways and to investigate the
interplay of different components with surrogate mixtures with known PM
components.
Measured ROS Formation vs. OP by DTT Assay
In Figure 10A, total OP-DTT for
highway and urban PM shows a unimodal distribution with the peak at
0.56-1 μm, and total OP-DTT in PM1–10 is higher
than in PM1. The highway PM has higher levels of total
OP-DTTv than does the urban PM, which may be partly caused by nonexhaust
emissions of transition metals with large OP at highways (Fang et al.
2016; Gao et al.
2017; Saffari et al.
2014; Zhang et al.
2016). The two
highway sites have similar levels of total DTT activities and the
average total DTTv (normalized by sampled air volume) and DTTm
(normalized by particle mass) are ~0.47 nmol min-1
m-3 and ~37 pmol min-1
μg-1 respectively. These values are similar or
slightly higher than previous measurements at highway or road sites
(Charrier et al. 2015;
Gao et al. 2017;
Shirmohammadi et al. 2017). The distribution of total OP-DTT for wildfire PM is
relatively uniform across different particle diameter ranges, and
submicron wildfire PM exhibits higher total OP-DTTv and OP-DTTm compared
with coarse fractions. It is worth noting that wildfire PM shows a
higher contribution from submicron particles to EPFRs, ROS formation,
and total OP-DTT compared with highway and urban PM. This observation is
consistent with the fact that DTT-active organics including quinones and
HULIS (Dou et al. 2015;
Verma et al. 2015b) are
mostly contained in the submicron size range (Garofalo et al. 2019; Kleeman et al. 1999). Since submicron
particles after inhalation can deposit deep into the lung, reaching the
alveoli (Heyder 2004),
it suggests that biomass burning contributes to deposition of organics
and ROS in the lower respiratory tract and hence may play a role in
inducing inflammatory responses and oxidative stress deeper in lung.
OP-DTT has been extensively used to indicate toxicity, assuming that it
represents the ability of aerosols to generate ROS; this assumption
still needs to be evaluated by investigating correlations between OP-DTT
and ROS formation (Fang et al. 2019; Hwang et al. 2021; Xiong et al. 2017; Zhang et al. 2022). A recent study found that secondary inorganic
components, crustal material, and biogenic SOA control PM mass
concentrations, while OP is associated mostly with anthropogenic
sources, in particular with residential biomass burning and metals from
vehicular nonexhaust emissions (Daellenbach et al. 2020). Interestingly, total OP-DTT from
highway and urban shows a positive moderate correlation with total
radical forms of ROS (R2 = 0.61, Figure 11) and
·OH (R2 = 0.59). Interestingly, the
total DTTv activities at the Anaheim are strongly correlated with ROSv
(R2 = 0.91). For individual ROS species,
the correlations of total DTTv with organic radicals
(R2 = 0.85) are stronger than with OH
radicals (R2 = 0.71), suggesting that the
DTT decay and the formation of organic radials are contributed by
similar organic compounds. This is consistent with a recent study
reporting that ROOH can consume DTT (Jiang et al. 2016). The lower correlation of total
DTTv activities with OH radicals is expected as the DTT assay is less
sensitive to Fe, which plays a large role in generating OH radicals
through Fenton chemistry (Fang et al. 2019). There is little correlation between
total DTTv activities and ROSv or individual species at the Long Beach
site (R2 ≤ 0.16).
Correlations of total radicals with total OP-DTT during
wildfire events and at highway and urban sites. Each
data point represents data obtained from an individual MOUDI
stage. Adapted from Fang et al. 2023.
Total OP-DTT from wildfire samples does not correlate with any radical
generation (R2 ≤ 0.02) (Figure 11). The correlation in
highway and urban PM samples may be explained by transition metals such
as Cu or Fe that can oxidize DTT (Charrier and Anastasio 2012; Charrier et al.
2016) and also
participate in Fenton/Fenton-like reactions with
H2O2 or hydroperoxides to generate ·OH
(Chevallier et al. 2004;
Fang et al. 2020).
Previous studies have also found mixed results for such correlation
analyses. For example, Zhang and colleagues (2022) found that OP-DTT and ROS
measurements were positively correlated for photochemically aged
naphthalene SOA with soot particles, while there was a weaker
correlation for β-pinene SOA. Xiong and colleagues (2017) found that ambient
PM2.5 samples collected from an urban site in Illinois
showed no correlation between OP-DTT and ·OH formation. The lack
of correlation between OP-DTT and total radical forms of ROS in wildfire
PM in this work indicates that OP would not be a good metric for radical
generation in biomass burning aerosols. The mixed results in this study
provide promising but cautious implications from ambient data that DTT
activities could represent ROS generation, but further measurements with
longer sampling time periods, and also at various locations with
differing sources, are necessary to better understand the associations
of ROS generation and DTT activities with oxidative stress induced by
atmospheric PM and its adverse effects on human health. As this study
did not measure nonradical forms of ROS such as
H2O2 and singlet oxygen, further studies are
necessary to fully evaluate validations and limitations of the use of OP
as an indicator of ROS formation and PM toxicity. Other OP assays such
as ascorbic acid or glutathione assays that measure the consumption of
antioxidants could also be used to assess the relations of OP with ROS
generation in future studies.
MODELING ROS FORMATION IN ELF
Respiratory deposition can lead to the formation of ROS in the ELF due to
redox reactions of PM components with lung antioxidants. As a direct
quantification of ROS is challenging, PM OP is more commonly measured using
antioxidant surrogates, including DTT and ascorbic acid, assuming that the
decay of surrogates corresponds to ROS formation. However, this assumption
has not yet been validated and the lack of ROS quantification in the
respiratory tract causes major limitations in evaluating PM impacts on
oxidative stress. By combining field measurements of size-segregated
chemical composition in Atlanta, a human respiratory tract model, and
kinetic modeling, we quantified production rates and concentrations of
different types of ROS in different regions of the ELF by considering
particle-size-dependent respiratory deposition.
ROS Concentration in ELF in Various Respiratory Regions
Figure 12 shows the
modeled total and individual ROS concentrations in the ELF in alveolar,
bronchial, and extra-thoracic regions after particle-size-dependent
respiratory deposition at road-side and urban sites in Atlanta, GA. ROS
concentrations and production rates depend strongly on the
size-dependent composition of ambient PM and their deposition
efficiencies in different ELF regions. The extrathoracic region is found
to have the highest ROS concentrations compared with the lower
respiratory tract, for all types of ROS, at both sites due to efficient
PM deposition and a small ELF volume.
Estimates of ROS concentrations in the epithelial lining
fluid in various respiratory compartments after 1.5 hours of
inhalation and deposition of ambient size-segregated
water-soluble Fe and Cu, SOA, and quinones at road-side and
urban sites in Atlanta, GA. A. Total ROS;
B–D. Individual ROS. Respiratory
compartments include alveolar (A), bronchial (B), and
extrathoracic (ET) regions. The blue and grey bars (denoted as
Total ELF) represent ROS concentrations without considering
particle-size dependence of ELF deposition in different regions
and assuming homogeneous PM deposition in the total ELF volume.
Uncertainties associated with the ELF thickness are represented
by the error bars. Other model uncertainties are discussed in
the text. Reprinted with permission from Fang et al. 2019. Copyright
2019 American Chemical Society.
In Figure 12, Total ELF
represents ROS concentrations if PM respiratory deposition would be
assumed to be homogeneous without considering the particle-size
dependence of ELF deposition in different respiratory regions.
Comparisons of ROS from Total ELF to those in each respiratory region by
considering size-dependent deposition suggest that assuming homogeneous
deposition would lead to an underestimation of ROS concentrations in the
extrathoracic region, while those in bronchi would be slightly
overestimated and those for alveoli would be largely overestimated. This
suggests that a proper consideration of the particle-size effect and
dilution due to the ELF volume variations are important for accurate
estimations of ROS concentrations in different respiratory regions.
Comparing the two sites, the road-side site has higher levels of ROS
estimated in the ELF in various respiratory compartments. This is due to
higher ambient concentrations of various chemical species at the
road-side site, resulting in higher concentrations of chemical species
and ROS formation in the ELF.
H2O2 is the most abundant ROS in the ELF owing to
its low reactivity and slow decomposition, and it is about four and ten
orders of magnitude more abundant than the
·O2- family and ·OH radicals,
respectively. Although H2O2 is not a free radical,
it may play a critical role in PM-induced oxidative stress, as
H2O2 can diffuse through cell membranes and
serve as a reservoir species to release more reactive forms of ROS in
vivo (Mathai and Sitaramam 1994). ·OH radicals are mainly generated in the
extrathoracic region. Transition metal ions are largely contained in
coarse particles, which lead to higher deposition in the extrathoracic
region, resulting in increased rates of Fenton and Fenton-like reactions
to yield ·OH radicals. While ·OH concentrations are kept
low due to scavenging by antioxidants, these results imply that
oxidative damage to cells or tissues caused by highly reactive
·OH radicals would be more likely in the extrathoracic region
than in the lower respiratory tract.
Composition-Dependent ROS Production Rates
We investigated modeled ROS production rates in different regions of ELF
by individual chemical components, including Cu, Fe, SOA, and quinones,
contained in size-segregated particles collected at the road-side site
in Atlanta. We found that Cu has the highest ROS production rates,
followed closely by Fe, while SOA rates are one order of magnitude less
than Cu or Fe. Quinones have the lowest ROS production rates. The
rate-limiting step for ROS production is the reduction of antioxidants.
ELF concentrations of Cu and Fe are similar, but Cu has the highest ROS
production rates due to the higher reaction rate coefficient
(k = 1.4 × 10⁻¹⁸ cm3
s-1) of Cu with ascorbic acid compared with the analogous
Fe reaction (k = 1.1 × 10⁻¹⁹
cm3 s-1). Quinones do not contribute
substantially to ROS production due to much lower ambient and ELF
concentrations and lower rate coefficients
(~10-21–10-19 cm3
s-1). In terms of size dependence, ROS production rates
by Cu and Fe are mostly contributed to by coarse particles with particle
sizes larger than 1 μm, while SOA and quinones have a broader
distribution with more contribution from fine particles smaller than 1
μm (PM1). Larger particles dominate the contribution
to ROS production in the extrathoracic region, mainly driven by the
effective deposition of larger particles in the upper respiratory
tract.
Figure 13A shows
the modeled contributions of different chemical species in generating
various ROS in the extrathoracic and alveolar regions.
H2O2 and ·O2-
family production rates are mostly governed (>90 %) by Cu and Fe. SOA
contribute a very small fraction (<10%) to
H2O2, and its contribution to the
·O2- family is negligible. The relative
importance of Cu and Fe depends highly on particles sizes: at larger
sizes, Cu contributes the most, whereas Fe plays a larger role at
smaller size ranges. Figure 13B
shows average contributions in the respiratory tract without considering
particle-size-dependent deposition by PM2.5, showing that Cu
has the largest contribution to both the H2O2 and
·O2- families, followed by Fe. This
also suggests that the role of Fe in ROS production can be
underestimated if size-dependent deposition is not considered.
Correlations between Cu and H2O2 or
·O2- production rates are strong
(R2 > 0.90). The high similarity in
chemical sensitivity of H2O2 and the
·O2- family leads to strong
correlations between them (R2 ≥
0.92), except in the extrathoracic region where the correlation is
moderate (R2 = 0.6). The low correlation in
the extrathoracic region may be due to the high contribution of Fe to
H2O2 generation in this region.
Modeled contributions of Cu, Fe, SOA, and quinones to
production rates of H2O2,
·O2- family, and ·OH. A.
in the extrathoracic and alveolar regions based on
size-dependent deposition of particles collected at the
road-side site and B. in the respiratory tract
(without considering size-dependent deposition) based on
PM2.5 particles collected at the urban site in
Atlanta in summer and winter. Reprinted with permission from
Fang et al. 2019. Copyright 2019 American Chemical Society.
In contrast, OH has a different chemical selectivity from other ROS, as
shown by weaker correlations with H2O2 and the
·O2- family
(R2 = 0.25–0.84). ·OH
production rates are mainly attributed to SOA and Fe due to
decomposition of ROOH and Fenton reactions, respectively. SOA and Fe can
be comparably important in generating ·OH. In the extrathoracic
region, Fe plays a major role by contributing more than 60% of the
·OH production for the 0.35–3.2 μm size range,
while the SOA contribution dominates in smaller and larger particles
(Figure 13A). In the
alveoli, SOA contribute most of the ·OH production except for the
1–1.8 μm size range where Fe is responsible for producing
more than 80% of ·OH radicals. For overall PM2.5
contributions in summer, contributions from Fe and SOA are approximately
equal, and SOA show a larger contribution (on average 64%) in winter
(Figure 13B). ROS
production of SOA may depend on various factors such as precursors and
levels of oxidants (i.e., O3, ·OH, NOx)
upon formation and aging (Chowdhury et al. 2018; Tong et al. 2018). Further experiments are required
using SOA formed in a wide range of conditions along with detailed
chemical characterization for a better evaluation of ROS activity and
toxicity of SOA.
ROS Production Rates vs. OP
Figure 14 shows the
comparisons of modeled production rates of H2O2,
the ·O2- family, and ·OH with the OP
by the DTT and ascorbic acid assays. Modeled
·O2- family production rates show
moderate to strong correlations with OPDTT and
OPAA in the extrathoracic (R2
= 0.76–0.83) and alveolar regions (R2
= 0.55–0.72). Correlations to chemical species show that both the
·O2- family production rates and
OPDTT correlate well with quinones and Cu in the
extrathoracic region. In the alveolar region
·O2- family production rates only
correlate with Cu (R2 = 0.99), while
OPDTT correlates mainly with organic species
(R2 = 0.69).
Correlations between oxidative potential measured by the
dithiothreitol (OPDTT) and ascorbic acid (OPAA) assays and
H2O2, the ·O2-
family, and ·OH production rates. A. by
size-dependent respiratory deposition of the size-segregated
particles collected from both road-side and urban sites in
extrathoracic and alveolar regions and B. by
respiratory deposition of PM2.5 particles collected
at the urban site in summer and winter in the total ELF.
Reprinted with permission from Fang et al. 2019. Copyright 2019 American
Chemical Society.
Moderate to strong correlations of ·O2-
family production rates with OPDTT and OPAA are
also found for PM2.5 samples in summer
(R2 = 0.69 and 0.49 for OPDTT
and OPAA, respectively), whereas the correlation is weaker in
winter (R2 = 0.27 and 0.32 for
OPDTT and OPAA, respectively). The
·O2- family production is mainly
governed by Cu and Fe via metal redox chemistry converting O2
to ·O2-. Organics contribute little for all
sizes or ELF regions due to low ELF concentrations of quinones and low
·O2- production of SOA.
OPDTT in the alveolar region is dominated by
accumulation-mode organic species (Fang et al. 2017b). ·O2-
production rates correlate better with OP in the extrathoracic region
than in the alveolar region.
H2O2 shows a strong correlation with OP, as
H2O2 is mainly produced by
·O2- reacting with various species
including quinones, Fe, Cu, and ascorbic acid, as well as by
decomposition of certain species (e.g., hydroxyhydroperoxides) in SOA
(Wang et al. 2011b).
Previous studies have also found correlations of OP with
H2O2 production rates for quinones and metal
ions (Xiong et al. 2017), as well as for laboratory-generated SOA (Tong et al.
2018). In the
extrathoracic region, correlations of H2O2 with OP
measures (R2 = 0.43 and 0.36 for
OPDTT or OPAA, respectively) are much lower
than those for the ·O2- family
(R2 = 0.76 and 0.83 for OPDTT
or OPAA, respectively). These weaker correlations may be due
to a low activity of Fe in the DTT and ascorbic acid assays, whereas Fe
is effective in H2O2 generation.
In contrast, ·OH production rates do not show strong correlations
with OPDTT or OPAA (R2
= 0.08–0.55). The lack of correlation between OH production rates
and OP measures is consistent with low correlations of ·OH with
·O2- and H2O2
production rates. ·OH radicals are mainly generated by SOA
through decomposition of ROOH and Fenton reactions of Fe with
H2O2 (·OH production rates are strongly
associated with Fe [R2 ≥ 0.90]).
Since the DTT and ascorbic acid assays are less sensitive to Fe
(R2 < 0.4) (Fang et al. 2016), ·OH and OP
correlations become stronger when removing high-Fe data points
(R2 increases from below 0.32 to
0.53–0.76). This suggests that organic compounds may contribute
to both ·OH production and OP, which is consistent with a recent
study finding that ROOH can consume DTT (Jiang and Jang 2018).
In winter, OPDTT is mainly driven by organic species as shown
by the strong correlation with quinones and SOA
(R2 = 0.81) and the moderate to weak
correlation with Cu and Fe (R2 <
0.35). In winter, biomass burning is a major PM source in Atlanta with a
high abundance of aromatics or HULIS (Fang et al. 2016); previous studies have shown that
HULIS plays an important role in DTT decay and ·O2
production (Lin and Yu 2011; Verma et al. 2015b). HULIS concentrations are at much higher levels in
winter than in summer, due to high levels of biomass burning in winter
in the southeastern United States. Estimated HULIS concentrations were
implemented into the KM-SUB-ELF model, assuming that HULIS would have a
similar or one order of magnitude higher
·O2- generating capability than
quinones. With this estimation the correlation between OPDTT
and the model ·O2- family, as well as
H2O2 production rate in winter, improves
substantially (R2 increases from ~0.3
to 0.4–0.7), supporting the hypothesis that HULIS are the missing
sources of ROS production in the model. This exercise also suggests the
potential use of brown carbon measurements to estimate ROS generation
from HULIS activities. In fact, brown carbon shows strong correlations
with measured 1,4-naphthoquinone (R2 = 0.84)
and moderate correlations with 1,2-naphthoquinone
(R2 = 0.47), two of the three
ROS-generating quinones species. Recent studies have shown that ROS
formation and the OP of HULIS can be altered significantly upon complex
formation with metals (Gonzalez et al. 2017; Wei et al. 2019) or in the presence of pyridine,
imidazole, and their alkyl derivatives (Dou et al. 2015). Other potential chemical species
affecting ROS generation but not included in the model are peroxyacyl
nitrates and electron-deficient alkenes (Jiang and Jang 2018). Further laboratory
experiments and implementation into the model are required to evaluate
the impact of ROS generation by these species.
CELLULAR VS. CHEMICAL ROS IN ELF
Figure 15A and B show the measured
temporal evolution of control-corrected chemical and cellular
·O2- production rates upon exposure to PQN
and isoprene-derived SOA, respectively. Cellular
·O2- production rate increased to
~0.4 μM min-1 when exposed to 0.4 μg
mL-1 of PQN. With increased doses of 0.9 and 1.7 μg
mL-1, cellular ·O2- production
rates increased and reached maximum at ~1 μM min-1
after ~50 minutes, followed by decreases over time. At a higher dose
of 8.4 μg mL-1, macrophages responded faster to reach a
lower peak at ~0.2 μM min-1 at 40 minutes and
decreased more swiftly afterward. At all doses, cellular
·O2- production rates eventually decreased
to the level observed for controls with ~0.1 μM
min-1, which may be regulated by mitochondrial respiration
(Winterbourn 2008). In the
absence of cells, PQN triggered redox reactions to produce
·O2- increasingly to reach ~0.1
μM min-1 over a few hours. While relatively low doses of
PQN stimulate macrophages for ·O2- release for
a few hours, much higher doses of isoprene SOA are required for
·O2- release, which lasts less than 1 hour.
With doses of isoprene SOA increasing from 264 μg mL-1 to
388 μg mL-1, cellular ·O2-
production rates reached their peaks above ~1 μM
min-1 and decreased to control levels earlier in time with a
faster cellular response at higher doses. At the very high dose of 659
μg mL-1, the peak cellular
·O2- release rate is comparable to the
chemical ·O2- production rate of ~0.05
μM min-1 via aqueous reactions of SOA components in the
absence of cells.
Total ·O2- production upon
exposure to PQN and isoprene-derived SOA. Cellular
·O2- release from RAW264.7
macrophages (circles) and chemical (diamonds) is shown in time
profiles (A, B) and in dose–response curves (C, D). A
& B. Markers are color-coded with dose (in g/mL).
Data points with error bars represent the average and uncertainties
calculated from error propagation based on variabilities from
samples and controls (see Statistical Analyses section for details).
C & D. Statistically insignificant
(P > 0.05, unpaired t test)
comparisons of exposure groups with vehicle controls are plotted as
open circles. Chemical production of
·O2- was also simulated using
kinetic models with shaded areas representing model uncertainties.
Adapted from Fang et al. 2022.
The dose–response relationships are shown in Figure 15C and D, where responses are given as total
·O2- production as obtained from the
integration of control-corrected ·O2-
production rates over exposure time. The measured chemical total
·O2- production increased with an increase
of dose. PQN generates ·O2- via redox-cycling
reactions with antioxidants (D’Autréaux and Toledano 2007; Lakey et al. 2016), while isoprene-derived
SOA yields ·O2- via a series of aqueous
reactions including decomposition of α-hydroxyperoxyl radicals and
ROOH, as well as ·OH oxidation of primary or secondary alcohols (Wei
et al. 2021b). We applied
kinetic models that include these chemical mechanisms to simulate chemical
·O2- production (Lakey et al. 2016; Wei et al. 2021b), producing consistent
results as the measurements (shaded areas).
Interestingly, cellular ·O2- release induced by
PQN and isoprene-derived SOA shows inverted U-shaped dose– response
distributions. Under low doses, macrophages release
·O2- under regular cellular metabolisms
with a control level of ~23 μM, which is comparable to or
higher than the chemical ·O2- production. Once
the dose reaches a threshold, macrophages are activated and cellular total
·O2- production increases sharply,
dominating over chemical ·O2- production. The
onset dose of cell activation for PQN (~0.2 μg
mL-1) is much lower than isoprene-derived SOA (>40 μg
mL-1), indicating that macrophages are more sensitive to PQN
than isoprene-derived SOA in producing ROS. This suggests that quinones are
intrinsically more toxic than isoprene-derived SOA, consistent with previous
studies that show anthropogenic aromatics have higher toxicity compared with
biogenic aerosols (Offer et al. 2022; Tuet et al. 2017a,b).
Cellular ·O2- production induced by PQN and
isoprene-derived SOA then decreased at higher doses, surpassed by chemical
·O2- production. The decreases of cellular
·O2- release at higher doses (Figure 15C and D) and longer exposure time (Figure 15A and B) are not due to cell death. Cell cytotoxicity measurements
show that cells exposed to doses of up to 5 μg mL-1 for
PQN and 923 μg mL-1 for isoprene SOA have fluorescence
signals similar to that of filter blanks (fresh filter without particle
collection) (unpaired t test, P > 0.05).
These signals were much lower than those from the positive control lysed
cells (P < 0.05), confirming that cells are alive
during the whole course of exposure. Instead, the decreased cellular release
of ·O2- is most likely due to redox homeostasis
by cells upregulating the antioxidant response elements to scavenge ROS for
protection against proinflammatory effects (Droge 2002). Previous studies have found that
antioxidant enzymes can be upregulated by the transcription factor Nrf2 when
oxidative stress is induced upon exposure to ambient and diesel exhaust PM
containing polycyclic aromatic hydrocarbons and quinones (Gurgueira et al.
2002; Li et al. 2004; Pardo et al. 2020).
Note that cell cytotoxicity measurements also imply that the range of doses
applied in this study are reasonable. The conversion of doses to ambient PM
concentrations is highly complex as respiratory deposition is largely
affected by the nature of breathing (nasal vs. oral, tidal volume, and
frequency), individual differences in lung anatomy, the airflow patterns in
the lung airways, and the presence of deposition hotspots in the lung (Porra
et al. 2018). Phalen and
colleagues (2006)
demonstrated by dosimetry model predictions that the surface PM deposition
can reach up to 85.5 μg cm-2 but vary by up to three
orders of magnitude in the tracheobronchial region. With a bottom area of
0.32 cm2 and a working volume of 0.2 mL of a 96-well plate, the
surface doses for SOA and PQN in the current study are 5–412
μg cm-2 and 0.02–5.3 μg cm-2,
respectively. Combining all the uncertainties and variabilities (up to four
orders of magnitude), and also considering that the surface area of the
alveolar region is about 200 times larger and the deposition in the alveolar
region is up to 3 fold higher than in the tracheobronchial region (Vicente
et al. 2021), the applied
surface doses are within relevant ranges for real-life exposure scenarios
and are consistent with the doses applied in previous submerged cell
exposure studies.
We then applied cellular imaging techniques to study the mechanism of
cellular ·O2- release and its impacts on cell
membranes. Selected doses that activate massive cellular
·O2- release were used for exposure. In the
Phasor-FLIM method, the NAD(P)H fluorescence lifetime is visualized in polar
coordinates by calculating the Fourier sine and cosine transformation of the
FLIM photon histogram curve (Digman et al. 2008). The cell membranes and cytoplasm mainly
fall along a metabolic trajectory represented by a line joining positions of
free NAD(P)H and protein-bound NAD(P)H on a phasor plot (Figure 16A) (Digman et al.
2008; Stringari et al.
2012). The relative
locations on the trajectory can be used to obtain the bound NAD(P)H
fractions (Figure 16B). Macrophages
exposed to PQN and isoprene-derived SOA show lower bound NAD(P) H fractions
than the controls, indicating that the bound state NADPH is oxidized to
nonfluorescent NADP+, releasing superoxide: NADPH +
2O2 → NADP+ +
H+ + 2·O2- (Cross
and Segal 2004; Wientjes and
Segal 1995). A
bound-to-free shift of NAD(P)H is observed upon exposure to PMA, commonly
used as an inducer to activate NADPH oxidase and increase endogenous
·O2- production. Additionally, apocynin (or
Apo), a specific NADPH oxidase inhibitor, results in higher bound NAD(P)H
fractions in cells than those without the inhibitor (Figure 16B). Consequently, apocynin reduces cellular
·O2- production substantially upon exposure
to PQN, isoprene-derived SOA, and PMA (Figure 16C). These observations strongly indicate that PQN and
isoprene-derived SOA trigger cellular ·O2-
production mainly through activating the NADPH oxidase.
NADPH oxidase activities and oxidative stress on cell
membranes. A. Phasor plot of the FLIM images from RAW
264.7 macrophage treated with control (vehicle) and all samples.
B. NAD(P)H bound fractions based on phasor
locations in A for macrophage treated with control and samples with
and without NADPH oxidase inhibitor apocynin (Apo). The box plots
show the median, 10, 25, 75, and 90 percentiles. C.
Effect of apocynin on total ·O2-
production. Bars with error bars represent the average from
triplicates and the standard deviation. D. Membrane
fluidity measured with FLIM with a Laurdan probe. E.
Locations and intensity of lipid accumulation from THG imaging on
cells treated with 9,10-phenanthrenequinone (PQN). Unpaired
t test, ***P < 0.0001,
** P < 0.001. §FLIM images were taken
from cells after 10-min exposure of PQN, washed with PBS buffer, and
replaced with fresh incomplete media. BDL = below detectable limit;
ISO = isoprene-derived SOA; PMA = phorbol 12-myristate 13-acetate.
Adapted from Fang et al. 2022.
To investigate the impact of generated ·O2- on
cell membranes, we used the emission spectrum of a solvatochromic probe,
Laurdan, which is incorporated into the hydrophobic phase in the membrane
(Golfetto et al. 2013).
Since Laurdan dye adheres mostly to cell membranes, only the fluorescence
signals from cell membranes were selected for fluorescence lifetime
calculations. A total of 15 cells from each sample were averaged and
presented as violin plots in Figure
16D. We observed significant decreases in the fluorescence
lifetimes of the Laurdan probe on cell membranes from macrophages exposed to
PQN, isoprene SOA, and PMA, which indicates that these samples cause an
increase in membrane fluidity, an important parameter in membrane integrity
and cell health. In addition, the THG microscopy imaging shows that
10–20 minutes of exposure to PQN causes an increase of THG signal
around cell membranes, suggesting the accumulation of lipids (Figure 16E). Bright-field cell images
also suggest that macrophages may have taken up oxidized low-density
lipoprotein-forming foam cells, a key event suggested to involve the
activation of NADPH oxidase observed in previous studies (Aviram et al.
1996; Forman and Torres
2001). Therefore, with
the revealing of increased membrane fluidity and laden lipids around the
cell membranes, we suggest that macrophages are undergoing lipid
peroxidation caused by ·O2- or other ROS
produced thereafter.
DISCUSSION AND CONCLUSIONS
In this project, we aimed to investigate the chemical mechanism and formation
kinetics of ROS by SOA in the ELF and also to quantify the relative importance
of ROS formation by chemical reactions and macrophages. We generated SOA
particles using a reaction chamber and collected ambient PM next to major
highways and at an urban site during wildfire events. The collected particles on
filters were extracted, and the generated ROS was quantified using EPR
spectroscopy with a spin-trapping technique. Kinetic modeling was applied for
the analysis and interpretation of experimental data. PM OP was also quantified
using the DTT assay. Finally, we quantified cellular and chemical superoxide
generation by representative anthropogenic and biogenic PM components using a
chemiluminescence assay combined with EPR spectroscopy as well as kinetic
modeling. We also applied cellular imaging techniques to study the cellular
mechanism of superoxide release and oxidative damage on cell membranes.
Our work elucidates ROS generation pathways from aqueous reactions of biogenic
SOA. Multigenerational atmospheric oxidation and autoxidation of biogenic VOCs
by ·OH and O3 leads to the formation of HOM and ELVOC (Bianchi
et al. 2019; Ehn et al. 2014). Most of these compounds
contain alcohol and hydroperoxide functional groups. After condensation into the
particle phase, a fraction of ROOH decomposes to form ·OH, which can act
as an ignition step for a cascade of ROS formation pathways. The e-folding times
for the ROOH decomposition are estimated to be 4–30 hours, which
represent average lifetimes for different ROOH compounds; some of them may have
shorter timescales (Krapf et al. 2016; Pospisilova et al. 2020), while others may be very stable (Kenseth et al. 2018; Zhang et al. 2017). This decomposition process
can be accelerated by photolysis (Badali et al. 2015; Epstein et al. 2014) and Fenton-like reactions of transition
metal ions (Fang et al. 2020;
Tong et al. 2016, 2017).
While a recent study (Zhang et al. 2017) found that the PAM-reactor-generated α-pinene SOA
contain substantial amounts of particle-phase HOM, consistent with the gas-phase
measurements in previous studies (Ehn et al. 2012, 2014; Kirkby et al. 2016), we acknowledge a caveat of this work that the particle mass
concentrations in the PAM reactor are much higher compared with ambient
conditions, leading to more prominent condensation of semi-volatile organic
compounds. While this study serves as a proof of concept and provides
mechanistic insights into possible mechanisms of ROS formation, future studies
are warranted to investigate the ROS formation from SOA generated under
atmospherically relevant conditions. Higher oxidant and precursor concentrations
would increase the chance of RO2· to react with each other to
form ROOR. With lower concentrations in the ambient atmosphere,
RO2· would favorably react with HO2· to form
ROOH, which would increase the ROS formation potential of SOA.
·OH radicals released by ROOH decomposition can abstract hydrogen from
primary or secondary alcohols (R1R2CH(OH)) to form
α-hydroxyalkyl radicals, which quickly react with dissolved O2
to form α-hydroxyperoxyl radicals. Within milliseconds
α-hydroxyperoxyl radicals can undergo unimolecular decomposition to form
·O2-/HO2· radicals. Through
HO2· termination, α-hydroxyperoxyl radicals form
α-hydroxyalkyl hydroperoxides, which can decompose to generate
H2O2, another important ROS (Qiu et al. 2020a; Sauer et al. 1999). Other feasible pathways of
H2O2 formation by SOA have also been discussed in the
literature, including hydrolysis of diacyl peroxides or peroxy acids (Ziemann
2002). The relative
contributions of different H2O2 sources still warrant
further studies.
The aqueous phase chemical reactions that generate ROS are affected by pH.
Inhalation and deposition of organic aerosols can lead to oxidative stress by
the formed ROS at physiological pH. Under neutral conditions organic
hydroperoxides can preferably undergo unimolecular decomposition to generate
highly reactive ·OH radicals, which can initiate a cascade of reactions
to propagate further radical formation (Gligorovski et al. 2015), as well as to directly attack biological
components and induce pathological processes such as lipid peroxidation (Yin et
al. 2011). The formed organic
radicals can be persistent even in the presence of antioxidants (Wei et al.
2021a), although their
capacity in causing OP still warrants further studies. Our work then establishes
the mechanisms driving organic radical formation by the interactions between SOA
and Fe2+ in the ELF. While ROOR are thermally stable under
physiological temperature (Sanchez and Myers 2004), the chemical lifetimes of ROOR with
respect to Fe2+ reactions were calculated to be 0.3–46
hours, depending on Fe2+ concentrations in the experimental
range of 0.05–0.8 mM. Meanwhile, the antioxidant defense system can
counteract ROS formation: for example, ascorbate efficiently scavenges
·OH and ·O2-/HO2· (Adams
et al. 1965; Nadezhdin and
Dunford 1979). In comparison,
organic radicals, especially R·, react with ascorbate more slowly by
multiple orders of magnitude, leading to much longer lifetimes (Buettner and
Jurkiewicz 1996). A recent study
found that the reaction rates of ascorbate and glutathione with alkyl radicals
are too slow to protect proteins from peroxidation (Nauser and Gebicki 2017). The rapid redox cycling of
Fe3+/Fe2+ maintained by ascorbate can
further facilitate the ROOR decomposition and subsequent organic radical
formation. Note that Fe3+/Fe2+ redox cycles
can also be mediated by ROS such as superoxide (Gonzalez et al. 2017; Voelker and Sedlak 1995), which can be hindered by
the addition of antioxidants through direct scavenging of ROS. Antioxidants play
a reciprocal role by depleting short-lived reactive radicals while amplifying
organic radical formation. While this study used synthetic ELF containing lung
antioxidants, future studies may apply alternative approaches using
appropriately concentrated components to represent true ELF concentrations or
bronchoalveolar lavage fluid from healthy and diseased participants.
We found that a variety of radicals are generated by ambient PM collected in the
Los Angeles Basin. Highway PM mainly generate ·OH, while wildfire PM
mainly generate R· and ·OH, with minor contributions from
superoxide and RO·. Evaluating the representativeness of the PM
investigated in this project requires further studies of PM collected from
different locations in the United States and around the world. OP-DTT is found
to be high in wildfire PM, exhibiting little correlation with radical forms of
ROS, which are in stark contrast with highway PM that correlate well with
OP-DTT. The relation between OP and ROS formation is highly complex. Various
acellular OP assays (e.g., ascorbic acid and glutathione) and cellular assays
should be applied to conduct a comprehensive evaluation of PM OP (Shahpoury et
al. 2022). In addition, for
complete ROS quantification and robust intercomparison with PM OP, different
methods of ROS measurements should be applied, and ROS that were not measured in
this study, such as singlet oxygen and peroxy nitrite, should also be
quantified.
Epithelial cell membranes contain phospholipid bilayers, and ·OH and
HO2· are known to initiate a cascade of propagation
reactions known as lipid peroxidation (Ayala et al. 2014; Yin et al. 2011), which may alter the membrane fluidity and
trigger the inactivation of membrane-embedded proteins functioning as ion
channels and receptors (Los and Murata 2004). Our results on the persistency of organic radicals even in
the presence of antioxidants imply that organic radicals may also participate in
radical chain reactions involved in lipid peroxidation. Despite the significance
in numerous pathological processes, lipid peroxidation has not been linked
mechanistically to radical formation from organic aerosols and transition
metals, which underlines the need for future studies. Overall, our experimental
and modeling results demonstrate the central role of Fe2+ in
inducing organic radical formation by facilitating ROOR decomposition in lung
fluid, which highlights the significance of the interactions among redox-active
components in ambient PM in potentially causing oxidative stress.
A novel aspect of our modeling study is the derivation of production rates of
different types of ROS in the ELF, based on ambient measurements of redox-active
chemical components, for comparison with OP measurements. For both the
size-segregated data in different respiratory regions and PM2.5 in
different seasons, OP shows strong correlations with modeled
·O2- family and H2O2
production rates in the ELF, but not with ·OH production rates. These
correlations can be explained by the major chemical species that contribute to
ROS production and DTT/ascorbic acid loss. The correlations are consistent with
the fact that the rate-limiting step for ·O2- and
H2O2 is the reaction between antioxidants and
redox-active components, while that for ·OH is Fenton and Fenton-like
reactions or SOA decomposition without involving antioxidants. Direct
measurements of ROS in the ELF or in its surrogate are currently lacking, which
needs to be addressed in future studies for more robust comparisons with OP
measurements.
Figure 17 summarizes
multitier chemical and cellular response mechanisms in SOA exposure in ELF. At
low doses or early exposure, ·O2- is mainly
produced from normal cellular metabolism via mitochondrial respiration with
minor contributions from chemical reactions. After a threshold dose to
macrophages, NADPH oxidase activities are upregulated for respiratory burst,
releasing massive amounts of ·O2-, which can cause
oxidative stress by increasing cell membrane fluidity through lipid
peroxidation. Further increases of doses or exposure time leads to the
activation of antioxidant response elements, reducing the net cellular
·O2- production. Chemical
·O2- production may become comparably important
at very high doses, especially if escalation of oxidative stress leads to cell
death. Given that cellular ·O2- release mostly
dominates over its chemical production by PM-reactive and redox-active
components, widely applied acellular assays that measure OP and ROS activity may
need to be interpreted with caution. Note that alveolar macrophages reside
primarily in alveoli, so chemical ROS should still be relevant for causing
oxidative stress in the upper respiratory tract, including the extrathoracic and
bronchial regions.
Multitier chemical and cellular response mechanisms upon PM
deposition in epithelial lining fluid. Cellular
·O2- release by alveolar macrophages
via activation of NADPH oxidase dominates over chemical
·O2- production, causing lipid
peroxidation and activation of antioxidant response elements. Adapted
from Fang et al. 2022.
Future studies should be extended to include other chemical compounds that have
high OP and redox activity, such as transition metals; the presence of metals in
ambient PM might enhance the importance of chemical ROS (Charrier and Anastasio
2012; Fang et al. 2019; Guo et al. 2019; Shirmohammadi et al. 2015). In this study, we used RAW
264.7 macrophages as an established cell line for studying the oxidative stress
responses of macrophages. Other immortalized alveolar cell lines such as NR8383,
MH-S, THP-1, and also primary alveolar macrophages may need to be used to
confirm and to strengthen the findings of this project. While current work is
based on the standard submerged cell culture method, this classical condition
should be extended to represent more realistic conditions with multiple types of
cells, including macrophages and endothelial cells, to simulate synthetic
interactions between cell populations (Li et al. 2002) with an application of the air-liquid
interface for simulating exposure and respiratory deposition of aerosol
particles (Offer et al. 2022).
The knowledge on ROS formation by PM obtained in this project and the developed
kinetic model can provide useful metric (i.e., ROS levels in lung lining fluid)
to epidemiological studies. We applied the KM-SUB-ELF model to estimate ROS
concentrations in ELF by using measured ambient concentrations of Fe and Cu.
Their concentrations in the ELF can be estimated using their ambient
concentrations, their fractional solubilities, breathing rate, PM deposition
rate, and total ELF volume. Then, the KM-SUB-ELF model estimated ROS generation
in human respiratory tract by resolving mass transport and chemical reactions
between lung antioxidants and Fe and Cu ions. The estimated ELF concentrations
were found to have positive associations with respiratory diseases (Zhang et al.
2021), cardiovascular
diseases (Zhang et al. 2020),
and COVID-19 incidences (Stieb et al. 2021), strongly indicating the connection between oxidative stress
in lungs and various adverse health outcomes.
In conclusion, the mechanistic understandings and quantifications of ROS
formation obtained in this project provide a basis for further elucidation of
adverse health effects and oxidative stress upon respiratory deposition of
PM2.5. For a comprehensive assessment of PM toxicity and health
effects via oxidative stress, we demonstrated that it is important to consider
both chemical reactions and cellular processes for the formation of ROS upon
respiratory deposition. Chemical composition of PM strongly influences ROS
formation triggered by PM; thus, further investigations are required that will
study ROS formation from various PM components such as different types of
carbonaceous aerosols, inorganic components, and metals emitted from a variety
of sources including transportation (tailpipe and nontailpipe emissions), fossil
fuel combustion, industrial and agricultural activities, and biomass burning.
Such research will provide critical information to environmental agencies and
policymakers for the development of air quality policy and regulation.
ACKNOWLEDGMENTS
Research described in this report was conducted under contract to the HEI (RFA
17-3), an organization jointly funded by the U.S. Environmental Protection
Agency (Assistance Award No. CR–83998101) and certain motor vehicle and
engine manufacturers. The contents of this article do not necessarily reflect
the views of HEI, or its sponsors, nor do they necessarily reflect the views and
policies of the U.S. Environmental Protection Agency or motor vehicle and engine
manufacturers. We thank our collaborators including William Brune, Rodney Weber,
Heejung Jung, Xiaoliang Wang, Cynthia Wong, Katherine Hopstock, Haijie Tong,
Steven Lelieveld, Thomas Berkemeier, and Ulrich Pöschl, as well as all
coauthors on manuscripts stemmed from this project.
Footnotes
* A list of abbreviations and other terms appears at the end of
this volume.
ABOUT THE AUTHORS
Manabu Shiraiwa is Professor of Chemistry at UCI. He received a B.S.
and an M.S. at the University of Tokyo and a Ph.D. from the Max Planck Institute
for Chemistry in 2011. He has worked as a group leader at the Max Planck
Institute for Chemistry and as a JSPS postdoc fellow at the California Institute
of Technology. He is the lead PI of this project. His primary research interests
are multiphase chemistry of atmospheric aerosols and their impacts on climate,
outdoor and indoor air quality, and public health.
Ting Fang was a postdoctoral researcher working with Dr. Shiraiwa in
the Department of Chemistry at UCI. She received a Ph.D. at the Georgia
Institute of Technology and is currently Assistant Professor at HKUST
Guangzhou.
Jinlai Wei was a graduate student working with Dr. Shiraiwa in the
Department of Chemistry at UCI and received a Ph.D. in 2022.
Pascale S.J. Lakey is a project scientist working with Dr. Shiraiwa
in the Department of Chemistry at UCI. She received a Ph.D. from the University
of Leeds, UK.
Brian C.H. Hwang was a graduate student working with Dr. Shiraiwa in
the Department of Chemistry at UCI and received a Ph.D. in 2021.
Kasey C. Edwards is a graduate student working with Dr. Shiraiwa in
the Department of Chemistry at UCI.
Sukriti Kapur is a graduate student working with Dr. Shiraiwa in the
Department of Chemistry at UCI.
Jessica E. Monterrosa Mena is a graduate student working with Dr.
Kleinman in the Division of Occupational and Environmental Medicine at UCI.
Yu-Kai Huang is a graduate student working with Dr. Digman in the
Department of Biomedical Engineering at UCI.
Michelle A. Digman is Associate Professor in the Department of
Biomedical Engineering at UCI.
Scott A. Weichenthal is Associate Professor in the Department of
Epidemiology, Biostatistics and Occupational Health at McGill University,
Canada.
Sergey Nizkorodov is Professor of Chemistry in the Department of
Chemistry at UCI.
Michael T. Kleinman is Professor of Environmental Toxicology in the
Division of Occupational and Environmental Medicine at UCI.
OTHER PUBLICATIONS RESULTING FROM THIS RESEARCH
Fang T, Hwang BCH, Kapur S, Hopstock K, Wei J, Nguyen V, Nizkorodov SA, Shiraiwa
M. 2023. Wildfire particulate matter as a source of environmentally persistent
free radicals and reactive oxygen species. Environ Sci Atmos
3:581–594.
Fang T, Huang Y-K, Wei J, Monterrosa Mena JE, Lakey PSJ, Kleinman MT, Digman MA,
Shiraiwa, M. 2022. Superoxide release by macrophages through NADPH oxidase
activation dominating chemistry by isoprene secondary organic aerosols and
quinones to cause oxidative damage on membranes. Environ Sci Technol
56:17029-17038; doi.10.1021/acs.est.2c03987.
Liu J, Banerjee S, Oroumiyeh F, Shen J, del Rosario I, Lipsitt J, Paulson S, Ritz
B, Su J, Weichenthal S, Lakey P, Shiraiwa M, Zhu Y, Jerrett M. 2022. Cokriging
with a low-cost sensor network to estimate spatial variation of brake and
tire-wear metals and oxidative stress potential in Southern California. Environ
Int 168:107481; doi:10.1016/j.envint.2022.107481.
Ripley S, Minet L, Zalzal J, Godri Pollitt K, Gao D, Lakey PSJ, Shiraiwa M, Maher
BA, Hatzopoulou M, Weichenthal S. 2022. Predicting spatial variations in
multiple measures of PM2.5 oxidative potential and magnetite
nanoparticles in Toronto and Montreal, Canada. Environ Sci Technol
56:7256–7265; doi:10.1021/acs.est.1c05364.
To T, Terebessy E, Zhu J, Zhang K, Lakey PSJ, Shiraiwa M, Hatzopoulou M, Minet L,
Weichenthal S, Dell S, Stieb D. 2022. Does early life exposure to exogenous
sources of reactive oxygen species (ROS) increase the risk of respiratory and
allergic diseases in children? A longitudinal cohort study. Environ Health
21:90; doi:10.1186/s12940-022-00902-7.
Wei J, Fang T, Lakey PSJ, Shiraiwa M. 2021. Iron-facilitated organic radical
formation from secondary organic aerosols in surrogate lung fluid. Environ Sci
Technol 56:7234–7243; doi.10.1021/acs.est.1c04334.
Wei J, Fang T, Shiraiwa M. 2022. Effects of acidity on reactive oxygen species
formation from secondary organic aerosols. ACS Environ 2:336–345;
doi.10.1021/acsenvironau.2c00018.
Hwang B, Fang T, Pham R, Wei J, Gronstal S, Lopez B, Frederickson C, Galeazzo T,
Wang X, JungH, Shiraiwa M. 2021. Environmentally persistent free radicals,
reactive oxygen species generation, and oxidative potential from highway
PM2.5. ACS Earth Space Chem 5:1865–1875.
Lelieveld S, Wilson J, Dovrou E, Mishra A, Lakey PSJ, Shiraiwa M, Pöschl
U, Berkemeier T. 2021. Hydroxyl radical production by air pollutants in
epithelial lining fluid governed by interconversion and scavenging of reactive
oxygen species. Environ Sci Technol 55:14069–14079.
Stieb DM, Evans GJ, To TM, Lakey PSJ, Shiraiwa M, Hatzopoulou M, et al. 2021.
Within-city variation in reactive oxygen species from fine particle air
pollution and COVID-19. Am J Respir Crit Care Med 204:168–177.
Wei J, Fang T, Wong C, Lakey PSJ, Nizkorodov SA, Shiraiwa M. 2021. Superoxide
formation from aqueous reactions of biogenic secondary organic aerosols.
Environ. Sci Technol 55:260–270; doi.10.1021/acs.est.0c07789.
Zhang Z, Weichenthal S, Kwong JC, Burnett R T, Hatzopoulou M, Jerrett M, van
Donkelaar A, Bai L, Martin RV, Copes R, Lu H, Lakey P, Shiraiwa M, Chen H. 2021.
A population-based cohort study of respiratory disease and long-term exposure to
iron and copper in fine particulate air pollution and their combined impact on
reactive oxygen species generation in human lungs. Environ Sci Technol
55:3807–3818.
Zhang Z, Weichenthal S, Kwong JC, Burnett RT, Hatzopoulou M, Jerrett M, van
Donkelaar A, Bai, L, Martin RV, Copes R, Lu H, Lakey P, Shiraiwa M, Chen H.
2020. Long-term exposure to iron and copper in fine particulate air pollution
and their combined impact on reactive oxygen species concentration in lung
fluid: A population-based cohort study of cardiovascular disease incidence and
mortality in Toronto, Canada. Int J Epidemiol 50:589–601;
doi.10.1093/ije/dyaa230.
Fang T, Lakey PSJ, Weber RJ, Shiraiwa M. 2019. Oxidative potential of particulate
matter and generation of reactive oxygen species in epithelial lining fluid,
Environ Sci Technol 53:12784–12792; doi.10.1021/acs.est.9b03823.
REFERENCES
Abbas AK, Lichtman AH, Pillai S. 2010. Basic
immunology. Functions and Disorders of the Immune
system. Philadelphia,
PA:Saunders
Elsevier. [Google Scholar]
Adams G, Boag J, Currant J, Michael B. 1965. Absolute Rate
Constants for the Reaction of the Hydroxyl radical with Organic
Compounds. New
York:Academic
Press. [Google Scholar]
Alpert PA, Dou J, Corral Arroyo P, Schneider F, Xto J, Luo B, et al. 2021.
Photolytic radical persistence due to anoxia in viscous
aerosol particles. Nat Commun
12:1769.
[DOI] [PMC free article] [PubMed] [Google Scholar]
Anderson GH, Smith JG. 1968. Acid-catalyzed
rearrangement of hydroperoxides. II. Phenylcycloalkyl
hydroperoxides. Can J Chem
46:1561–1570. [Google Scholar]
Arangio AM, Tong H, Socorro J, Pöschl U, Shiraiwa M. 2016. Quantification
of environmentally persistent free radicals and reactive oxygen species
in atmospheric aerosol particles. Atmos Chem
Phys
16:13105–13119. [Google Scholar]
Aviram M, Rosenblat M, Etzioni A, Levy R. 1996. Activation of
NADPH oxidase is required for macrophage-mediated oxidation of
low-density lipoprotein. Metabolism
45:1069–1079.
[DOI] [PubMed] [Google Scholar]
Ayala A, Muñoz MF, Argüelles S. 2014. Lipid
peroxidation: Production, metabolism, and signaling mechanisms of
malondialdehyde and 4-hydroxy-2-nonenal. Oxid
Med Cell Longev
2014:360438.
[DOI] [PMC free article] [PubMed] [Google Scholar]
Badali KM, Zhou S, Aljawhary D, Antiñolo M, Chen WJ, Lok A, et al. 2015.
Formation of hydroxyl radicals from photolysis of
secondary organic aerosol material. Atmos Chem
Phys
15:7831–7840. [Google Scholar]
Bateman AP, Nizkorodov SA, Laskin J, Laskin A. 2011. Photolytic
processing of secondary organic aerosols dissolved in cloud
droplets. Phys Chem Chem Phys
13:12199–12212.
[DOI] [PubMed] [Google Scholar]
Bates JT, Fang T, Verma V, Zeng L, Weber RJ, Tolbert PE, et al. 2019. Review
of acellular assays of ambient particulate matter oxidative potential:
Methods and relationships with composition, sources, and health
effects. Environ Sci Technol
53:4003–4019.
[DOI] [PubMed] [Google Scholar]
Beck-Speier I, Dayal N, Karg E, Maier KL, Schumann G, Schulz H, et al. 2005.
Oxidative stress and lipid mediators induced in alveolar
macrophages by ultrafine particles. Free Radic
Biol Med
38:1080–1092.
[DOI] [PubMed] [Google Scholar]
Bedard K, Krause K-H. 2007. The NOX family
of ROS-generating NADPH oxidases: Physiology and
pathophysiology. Physiol Rev
87:245–313.
[DOI] [PubMed] [Google Scholar]
Berkemeier T, Ammann M, Krieger UK, Peter T, Spichtinger P, Pöschl U, et al. 2017.
Technical note: Monte Carlo genetic algorithm (MCGA) for
model analysis of multiphase chemical kinetics to determine transport
and reaction rate coefficients using multiple experimental data
sets. Atmos Chem Phys
17:8021–8029. [Google Scholar]
Bianchi F, Kurten T, Riva M, Mohr C, Rissanen MP, Roldin P, et al. 2019. Highly
oxygenated organic molecules (HOM) from gas-phase autoxidation involving
peroxy radicals: A key contributor to atmospheric
aerosol. Chem Rev
119:3472–3509.
[DOI] [PMC free article] [PubMed] [Google Scholar]
Birben E, Sahiner UM, Sackesen C, Erzurum S, Kalayci O. 2012. Oxidative
stress and antioxidant defense. World Allergy
Organ J
5:1–11.
[DOI] [PMC free article] [PubMed] [Google Scholar]
Bothe E, Schuchmann MN, Schulte-Frohlinde D, Vonsonntag C. 1978. HO2
elimination from α-hydroxyalkylperoxyl radicals in
aqueous-solution. Photochem Photobiol
28:639–644. [Google Scholar]
Brunekreef B, Holgate ST. 2002. Air pollution
and health. Lancet
360:1233–1242.
[DOI] [PubMed] [Google Scholar]
Buettner GR, Jurkiewicz BA. 1993. Ascorbate free
radical as a marker of oxidative stress: An EPR study.
Free Radical Biol Med
14:49–55.
[DOI] [PubMed] [Google Scholar]
Buettner GR, Jurkiewicz BA. 1996. Catalytic
metals, ascorbate and free radicals: Combinations to
avoid. Rad Res
145:532–541. [PubMed] [Google Scholar]
Carrasquillo AJ, Daumit KE, Kroll JH. 2015. Radical
reactivity in the condensed phase: Intermolecular versus intramolecular
reactions of alkoxy radicals. J Phys Chem
Lett
6:2388–2392.
[DOI] [PMC free article] [PubMed] [Google Scholar]
Charrier JG, Anastasio C. 2011. Impacts of
antioxidants on hydroxyl radical production from individual and mixed
transition metals in a surrogate lung fluid.
Atmos Environ
45:7555–7562. [DOI] [PMC free article] [PubMed] [Google Scholar]
Charrier JG, Anastasio C. 2012. On
dithiothreitol (DTT) as a measure of oxidative potential for ambient
particles: Evidence for the importance of soluble transition
metals. Atmos Chem Phys
12:9321–9333. [DOI] [PMC free article] [PubMed] [Google Scholar]
Charrier JG, Anastasio C. 2015. Rates of
hydroxyl radical production from transition metals and quinones in a
surrogate lung fluid. Environ Sci
Technol
49:9317–9325.
[DOI] [PMC free article] [PubMed] [Google Scholar]
Charrier JG, McFall AS, Richards-Henderson NK, Anastasio C. 2014. Hydrogen
peroxide formation in a surrogate lung fluid by transition metals and
quinones present in particulate matter. Environ
Sci Tech
48:7010–7017. [DOI] [PMC free article] [PubMed] [Google Scholar]
Charrier JG, McFall AS, Vu KK, Baroi J, Olea C, Hasson A, et al. 2016. A bias
in the “mass-normalized” DTT response — An effect
of non–linear concentration–response curves for copper and
manganese. Atmos Environ
(1994)
144:325–334. [DOI] [PMC free article] [PubMed] [Google Scholar]
Charrier JG, Richards-Henderson NK, Bein KJ, McFall AS, Wexler AS, Anastasio C. 2015. Oxidant
production from source-oriented particulate matter — part 1:
Oxidative potential using the dithiothreitol (DTT)
assay. Atmos Chem Phys
15:2327–2340. [Google Scholar]
Chen Q, Liu Y, Donahue NM, Shilling JE, Martin ST. 2011a.
Particle-phase chemistry of secondary organic material:
Modeled compared to measured O:C and H:C elemental ratios provide
constraints. Environ Sci Technol
45:4763–4770.
[DOI] [PubMed] [Google Scholar]
Chen X, Hopke PK, Carter WPL. 2011b. Secondary
organic aerosol from ozonolysis of biogenic volatile organic compounds:
Chamber studies of particle and reactive oxygen species
formation. Environ Sci Technol
45:276–282.
[DOI] [PubMed] [Google Scholar]
Chevallier E, Jolibois RD, Meunier N, Carlier P, Monod A. 2004.
“Fenton-like” reactions of
methylhydroperoxide and ethylhydroperoxide with Fe2+
in liquid aerosols under tropospheric conditions.
Atmos Environ
38:921–933. [Google Scholar]
Cho AK, Sioutas C, Miguel AH, Kumagai Y, Schmitz DA, Singh M, et al. 2005. Redox
activity of airborne particulate matter at different sites in the Los
Angeles Basin. Environ Res
99:40–47.
[DOI] [PubMed] [Google Scholar]
Chowdhury PH, He Q, Lasitza Male T, Brune WH, Rudich Y, Pardo M. 2018. Exposure of
lung epithelial cells to photochemically aged secondary organic aerosol
shows increased toxic effects. Environ Sci
Technol Lett
5:424–430. [Google Scholar]
Cross AR, Segal AW. 2004. The NADPH
oxidase of professional phagocytes–prototype of the
NOx electron transport chain systems.
Biochim Biophys Acta
1657:1–22. [DOI] [PMC free article] [PubMed] [Google Scholar]
Crounse JD, Nielsen LB, Jørgensen S, Kjaergaard HG, Wennberg PO. 2013. Autoxidation
of organic compounds in the atmosphere. J Phys
Chem Lett
4:3513–3520. [Google Scholar]
D’Autréaux B, Toledano MB. 2007. ROS as
signalling molecules: Mechanisms that generate specificity in ROS
homeostasis. Nat Rev Mol Cell Biol
8:813–824.
[DOI] [PubMed] [Google Scholar]
Daellenbach KR, Uzu G, Jiang J, Cassagnes L-E, Leni Z, Vlachou A, et al. 2020. Sources
of particulate-matter air pollution and its oxidative potential in
Europe. Nature
587:414419. [DOI] [PubMed] [Google Scholar]
Dellinger B, Loninicki S, Khachatryan L, Maskos Z, Hall RW, Adounkpe J, et al. 2007.
Formation and stabilization of persistent free
radicals. Proc Combust Inst
31:521–528.
[DOI] [PMC free article] [PubMed] [Google Scholar]
Denisov ET, Tumanov VE. 2005. Estimation of
the bond dissociation energies from the kinetic characteristics of
liquid-phase radical reactions. Russ Chem
Rev
74:825–858. [Google Scholar]
Deno NC, Billups WE, Kramer KE, Lastomirsky RR. 1970. Rearrangement
of aliphatic primary, secondary, and tertiary alkyl hydroperoxides in
strong acid. J Org Chem
35:3080–3082. [Google Scholar]
Digman MA, Caiolfa VR, Zamai M, Gratton E. 2008. The phasor
approach to fluorescence lifetime imaging analysis.
Biophys J
94:L14–L16.
[DOI] [PMC free article] [PubMed] [Google Scholar]
Dikalov SI, Kirilyuk IA, Voinov M, Grigor’ev IA. 2011. EPR detection
of cellular and mitochondrial superoxide using cyclic
hydroxylamines. Free Rad Res
45:417–430. [DOI] [PMC free article] [PubMed] [Google Scholar]
Docherty KS, Wu W, Lim YB, Ziemann PJ. 2005. Contributions
of organic peroxides to secondary aerosol formed from reactions of
monoterpenes with O3. Environ Sci
Technol
39:4049–4059.
[DOI] [PubMed] [Google Scholar]
Dockery DW, Pope CA, Xu XP, Spengler JD, Ware JH, Fay ME, et al. 1993. An
association between air pollution and mortality in 6 United States
cities. N Engl J Med
329:1753–1759.
[DOI] [PubMed] [Google Scholar]
Dou J, Lin P, Kuang B-Y, Yu JZ. 2015. Reactive
oxygen species production mediated by humic-like substances in
atmospheric aerosols: Enhancement effects by pyridine, imidazole, and
their derivatives. Environ Sci Technol
49:6457–6465.
[DOI] [PubMed] [Google Scholar]
Droge W. 2002. Free radicals
in the physiological control of cell function.
Physiol Rev
82:47–95.
[DOI] [PubMed] [Google Scholar]
Dvornikov A, Malacrida L, Gratton E. 2019. The DIVER
microscope for imaging in scattering media.
Methods Protoc
2:53.
[DOI] [PMC free article] [PubMed] [Google Scholar]
Eames J, Watkinson M. 2001. Catalytic
allylic oxidation of alkenes using an asymmetric
Kharasch–Sosnovsky reaction. Angewandte
Chem Int Ed Engl
40:3567–3571. [DOI] [PubMed] [Google Scholar]
Edwards KC, Klodt AL, Galeazzo T, Schervish M, Wei J, Fang T, et al. 2022. Effects
of nitrogen oxides on the production of reactive oxygen species and
environmentally persistent free radicals from α-pinene and
naphthalene secondary organic aerosols. J Phys
Chem A
126:7361–7372;
doi.10.1021/acs.jpca.2c05532.
[DOI] [PMC free article] [PubMed] [Google Scholar]
Ehn M, Kleist E, Junninen H, Petaja T, Lonn G, Schobesberger S, et al. 2012. Gas
phase formation of extremely oxidized pinene reaction products in
chamber and ambient air. Atmos Chem
Phys
12:5113–5127. [Google Scholar]
Ehn M, Thornton JA, Kleist E, Sipila M, Junninen H, Pullinen I, et al. 2014. A large
source of low-volatility secondary organic aerosol.
Nature
506:476-479.
[DOI] [PubMed] [Google Scholar]
El-Sawalhi MM, Ahmed LA. 2014. Exploring the
protective role of apocynin, a specific NADPH oxidase inhibitor, in
cisplatin-induced cardiotoxicity in rats.
Chem-Biol Interact
207:58–66.
[DOI] [PubMed] [Google Scholar]
Epstein SA, Blair SL, Nizkorodov SA. 2014. Direct
photolysis of α-pinene ozonolysis secondary organic aerosol:
Effect on particle mass and peroxide content.
Environ Sci Technol
48:11251–11258.
[DOI] [PubMed] [Google Scholar]
Erben-Russ M, Michel C, Bors W, Saran M. 1987. Absolute rate
constants of alkoxyl radical reactions in aqueous
solution. J Phys Chem
91:2362–2365. [Google Scholar]
Fang T, Guo H, Zeng L, Verma V, Nenes A, Weber RJ. 2017a. Highly acidic
ambient particles, soluble metals, and oxidative potential: A link
between sulfate and aerosol toxicity. Environ
Sci Technol
51:2611–2620.
[DOI] [PubMed] [Google Scholar]
Fang T, Hwang BCH, Kapur S, Hopstock K, Wei J, Nguyen V, et al. 2023.
Wildfire particulate matter as a source of
environmentally persistent free radicals and reactive oxygen
species. Environ Sci Atmos
3:581–594. [Google Scholar]
Fang T, Huang Y-K, Wei J, Monterrosa Mena JE, Lakey PSJ, Kleinman MT, et al. 2022.
Superoxide release by macrophages through NADPH oxidase
activation dominating chemistry by isoprene secondary organic aerosols
and quinones to cause oxidative damage on membranes.
Environ Sci Technol
56:17029-17038;
doi.10.1021/acs.est.2c03987.
[DOI] [PMC free article] [PubMed] [Google Scholar]
Fang T, Lakey PSJ, Rivera-Rios JC, Keutsch FN, Shiraiwa M. 2020. Aqueous-phase
decomposition of isoprene hydroxy hydroperoxide and hydroxyl radical
formation by Fenton-like reactions with iron ions.
J Phys Chem A
124:5230–5236.
[DOI] [PubMed] [Google Scholar]
Fang T, Lakey PSJ, Weber RJ, Shiraiwa M. 2019. Oxidative
potential of particulate matter and generation of reactive oxygen
species in epithelial lining fluid. Environ Sci
Technol
53:12784–12792;
doi.10.1021/acs.est.9b03823.
[DOI] [PubMed] [Google Scholar]
Fang T, Verma V, Bates JT, Abrams J, Klein M, Strickland MJ, et al. 2016.
Oxidative potential of ambient water-soluble
PM2.5 in the southeastern United States: Contrasts in
sources and health associations between ascorbic acid (AA) and
dithiothreitol (DTT) assays. Atmos Chem
Phys
16:3865–3879. [Google Scholar]
Fang T, Verma V, Guo H, King LE, Edgerton ES, Weber RJ. 2015. A
semi-automated system for quantifying the oxidative potential of ambient
particles in aqueous extracts using the dithiothreitol (DTT) assay:
Results from the Southeastern Center for Air Pollution and Epidemiology
(SCAPE). Atmos Meas Tech
8:471–482. [Google Scholar]
Fang T, Zeng L, Gao D, Verma V, Stefaniak AB, Weber RJ. 2017b. Ambient size
distributions and lung deposition of aerosol dithiothreitol-measured
oxidative potential: Contrast between soluble and insoluble
particles. Environ Sci Technol
51:6802–6811.
[DOI] [PMC free article] [PubMed] [Google Scholar]
Fenton HJH. 1894.
LXXIII.— Oxidation of tartaric acid in presence of
iron. J Chem Soc Trans
65:899–910. [Google Scholar]
Finkel T, Holbrook NJ. 2000. Oxidants,
oxidative stress and the biology of ageing.
Nature
408:239–247.
[DOI] [PubMed] [Google Scholar]
Forman HJ, Torres M. 2001. Redox
signaling in macrophages. Mol Aspects
Med
22:189–216.
[DOI] [PubMed] [Google Scholar]
Forman HJ, Torres M. 2002. Reactive
oxygen species and cell signaling. Am J Resp
Crit Care Med
166:S4–S8.
[DOI] [PubMed] [Google Scholar]
Franzi LM, Bratt JM, Williams KM, Last JA. 2011. Why is
particulate matter produced by wildfires toxic to lung
macrophages?
Toxicol Appl Pharmacol
257:182–188.
[DOI] [PMC free article] [PubMed] [Google Scholar]
Fridovich I. 1970. Quantitative
aspects of the production of superoxide anion radical by milk xanthine
oxidase. J Biol Chem
245:4053–4057.
[PubMed] [Google Scholar]
Fujitani Y, Furuyama A, Tanabe K, Hirano S. 2017. Comparison of
oxidative abilities of PM2.5 collected at traffic and
residential sites in Japan. Contribution of transition metals and
primary and secondary aerosols. Aerosol Air Qual
Res
17:574–587. [Google Scholar]
Fuller SJ, Wragg FPH, Nutter J, Kalberer M. 2014. Comparison of
on-line and off-line methods to quantify reactive oxygen species (ROS)
in atmospheric aerosols. Atmos Environ
92:97–103. [Google Scholar]
Gao D, Fang T, Verma V, Zeng L, Weber R. 2017. A method for
measuring total aerosol oxidative potential (OP) with the dithiothreitol
(DTT) assay and comparisons between an urban and roadside site of
water-soluble and total OP. Atmos Meas Tech
Discuss
2017:1–25. [Google Scholar]
Garofalo LA, Pothier MA, Levin EJT, Campos T, Kreidenweis SM, Farmer DK. 2019. Emission and
evolution of submicron organic aerosol in smoke from wildfires in the
western United States. ACS Earth Space
Chem
3:1237–1247. [Google Scholar]
Gehling W, Dellinger B. 2013.
Environmentally persistent free radicals and their
lifetimes in PM2.5. Environ Sci
Technol
47:8172–8178..
[DOI] [PMC free article] [PubMed] [Google Scholar]
Ghio AJ, Richards JH, Dittrich KL, Samet JM. 1998. Metal storage
and transport proteins increase after exposure of the rat lung to an air
pollution particle. Toxicol Path
26:388–394.
[DOI] [PubMed] [Google Scholar]
Ghio AJ, Turi JL, Yang F, Garrick LM, Garrick MD. 2006. Iron
homeostasis in the lung. Biol Res
39:67–77.
[DOI] [PubMed] [Google Scholar]
Gilbert BC, Holmes RG, Laue HA, Norman RO. 1976. Electron spin
resonance studies. Part L. Reactions of alkoxyl radicals generated from
alkyl hydroperoxides and titanium (III) ion in aqueous
solution. J Chem Soc, Perkin Trans
2:1047–1052. [Google Scholar]
Goldstein S, Meyerstein D. 1999. Comments on
the mechanism of the “Fenton like”
reaction. Acc Chem Res
32:547–550. [Google Scholar]
Golfetto O, Hinde E, Gratton E. 2013. Laurdan
fluorescence lifetime discriminates cholesterol content from changes in
fluidity in living cell membranes. Biophys
J
104:1238–1247.
[DOI] [PMC free article] [PubMed] [Google Scholar]
Gomes A, Fernandes E, Lima JLFC. 2005. Fluorescence
probes used for detection of reactive oxygen species.
J Biochem Biophys Methods
65:45–80.
[DOI] [PubMed] [Google Scholar]
Gonzalez DH, Cala CK, Peng Q, Paulson SE. 2017. Hulis
enhancement of hydroxyl radical formation from Fe(II): Kinetics of
fulvic acid–Fe(II) complexes in the presence of lung
antioxidants. Environ Sci Technol
51:7676–7685.
[DOI] [PubMed] [Google Scholar]
Guin PS, Das S, Mandal PC. 2011.
Electrochemical reduction of quinones in different media:
A review. Int J Electrochem
2011:816202. [Google Scholar]
Guo H-b, Li M, Lyu Y, Cheng T-t, Xv J-j, Li X. 2019. Size-resolved
particle oxidative potential in the office, laboratory, and home:
Evidence for the importance of water-soluble transition
metals. Environ Pollut
246:704–709.
[DOI] [PubMed] [Google Scholar]
Gurgueira SA, Lawrence J, Coull B, Murthy GG, Gonzalez-Flecha B. 2002. Rapid
increases in the steady-state concentration of reactive oxygen species
in the lungs and heart after particulate air pollution
inhalation. Environ Health Perspect
110:749–755. [DOI] [PMC free article] [PubMed] [Google Scholar]
Gutteridge J. 1995. Lipid
peroxidation and antioxidants as biomarkers of tissue
damage. Clin Chem
41:1819–1828.
[PubMed] [Google Scholar]
Hasson AS, Ho AW, Kuwata KT, Paulson SE. 2001. Production of
stabilized Criegee intermediates and peroxides in the gas phase
ozonolysis of alkenes: 2. Asymmetric and biogenic
alkenes. J Geophys Res-Atmos
106:34143–34153. [Google Scholar]
Hayyan M, Hashim MA, AlNashef IM. 2016. Superoxide
ion: Generation and chemical implications. Chem
Rev
116:3029–3085.
[DOI] [PubMed] [Google Scholar]
He M, Ichinose T, Yoshida S, Ito T, He C, Yoshida Y, et al. 2017.
PM2.5-induced lung inflammation in mice:
Differences of inflammatory response in macrophages and type II alveolar
cells. J Appl Toxicol
37:1203–1218.
[DOI] [PubMed] [Google Scholar]
Herrmann H, Tilgner A, Barzaghi P, Majdik Z, Gligorovski S, Poulain L, et al. 2005. Towards
a more detailed description of tropospheric aqueous phase organic
chemistry: CAPRAM 3.0. Atmos Environ
39:4351–4363. [Google Scholar]
Heyder J. 2004. Deposition of
inhaled particles in the human respiratory tract and consequences for
regional targeting in respiratory drug delivery.
Proc Am Thorac Soc
1:315–320.
[DOI] [PubMed] [Google Scholar]
Hiura TS, Kaszubowski MP, Li N, Nel AE. 1999. Chemicals in
diesel exhaust particles generate reactive oxygen radicals and induce
apoptosis in macrophages. J Immunol
163:5582–5591.
[PubMed] [Google Scholar]
Hoffmann EH, Tilgner A, Wolke R, Böge O, Walter A, Herrmann H. 2018. Oxidation of
substituted aromatic hydrocarbons in the tropospheric aqueous phase:
Kinetic mechanism development and modelling.
Phys Chem
20:10960–10977. [DOI] [PubMed] [Google Scholar]
Holevinsky KO, Nelson DJ. 1995. Simultaneous
detection of free radical release and membrane current during
phagocytosis. J Biol Chem
270:8328–8336.
[DOI] [PubMed] [Google Scholar]
Hwang B, Fang T, Pham R, Wei J, Gronstal S, Lopez B, et al. 2021.
Environmentally persistent free radicals, reactive oxygen
species generation, and oxidative potential of highway
PM2.5. ACS Earth Space Chem
5:1865–1875. [Google Scholar]
Huang R-J, Zhang Y, Bozzetti C, Ho K-F, Cao J-J, Han Y, et al. 2014. High
secondary aerosol contribution to particulate pollution during haze
events in China. Nature
514:218–222.
[DOI] [PubMed] [Google Scholar]
ICRP.
1994. Publication 66: Human Respiratory Tract
Model for Radiological Protection.
Oxford, UK:
Pergamon. [Google Scholar]
Jiang H, Jang M. 2018. Dynamic
oxidative potential of atmospheric organic aerosol under ambient
sunlight. Environ Sci Technol
52:7496–7504.
[DOI] [PubMed] [Google Scholar]
Jiang H, Jang M, Sabo-Attwood T, Robinson SE. 2016. Oxidative
potential of secondary organic aerosols produced from photooxidation of
different hydrocarbons using outdoor chamber under ambient
sunlight. Atmos Environ
131:382–389. [Google Scholar]
Jimenez JL, Canagaratna MR, Donahue NM, Prevot ASH, Zhang Q, Kroll JH, et al. 2009.
Evolution of organic aerosols in the
atmosphere. Science
326:1525–1529.
[DOI] [PubMed] [Google Scholar]
Jokinen T, Berndt T, Makkonen R, Kerminen V-M, Junninen H, Paasonen P, et al. 2015.
Production of extremely low volatile organic compounds
from biogenic emissions: Measured yields and atmospheric
implications. Proc Natl Acad Sci USA
112:7123–7128.
[DOI] [PMC free article] [PubMed] [Google Scholar]
Jung H, Guo B, Anastasio C, Kennedy IM. 2006. Quantitative
measurements of the generation of hydroxyl radicals by soot particles in
a surrogate lung fluid. Atmos Environ
40:1043–
1052. [Google Scholar]
Kaiser J. 2000. Evidence
mounts that tiny particles can kill.
Science
289:22–23.
[DOI] [PubMed] [Google Scholar]
Kang E, Root MJ, Toohey DW, Brune WH. 2007. Introducing
the concept of potential aerosol mass (PAM).
Atmos Chem Phys
7:5727–5744. [Google Scholar]
Kautzman KE, Surratt JD, Chan MN, Chan AWH, Hersey SP, Chhabra PS, et al. 2010.
Chemical composition of gas- and aerosol-phase products
from the photooxidation of naphthalene. J Phys
Chem A
114:913–934.
[DOI] [PubMed] [Google Scholar]
Kenseth CM, Huang Y, Zhao R, Dalleska NF, Hethcox JC, Stoltz BM, et al. 2018.
Synergistic O3 + OH oxidation pathway
to extremely low-volatility dimers revealed in β-pinene secondary
organic aerosol. Proc Nat Acad Sci USA
115:8301–8306.
[DOI] [PMC free article] [PubMed] [Google Scholar]
Khachatryan L, Vejerano E, Lomnicki S, Dellinger B. 2011.
Environmentally persistent free radicals (EPFRs). 1.
Generation of reactive oxygen species in aqueous
solutions. Environ Sci Technol
45:8559–8566.
[DOI] [PMC free article] [PubMed] [Google Scholar]
Khamkaew C, Chantara S, Janta R, Pani SK, Prapamontol T, Kawichai S, et al. 2016.
Investigation of biomass burning chemical components over
Northern Southeast Asia during 7-SEAS/BASELinE 2014
campaign. Aerosol Air Qual Res
16:2655–2670. [Google Scholar]
Kirkby J, Duplissy J, Sengupta K, Frege C, Gordon H, Williamson C, et al. 2016.
Ion-induced nucleation of pure biogenic
particles. Nature
533:521–526.
[DOI] [PMC free article] [PubMed] [Google Scholar]
Kleeman MJ, Schauer JJ, Cass GR. 1999. Size and
composition distribution of fine particulate matter emitted from wood
burning, meat charbroiling, and cigarettes.
Environ Sci Tech
33:3516–3523. [Google Scholar]
Kleinman MT, Bufalino C, Rasmussen R, Hyde D, Bhalla DK, Mautz WJ. 2000. Toxicity of
chemical components of ambient fine particulate matter
(PM2.5) inhaled by aged rats. J Appl
Toxicol
20:357–364..
[DOI] [PubMed] [Google Scholar]
Krapf M, El Haddad I, Bruns EA, Molteni U, Daellenbach KR, Prévôt ASH, et al. 2016. Labile
peroxides in secondary organic aerosol.
Chem-US
1:603–616. [Google Scholar]
Kumagai Y, Arimoto T, Shinyashiki M, Shimojo N, Nakai Y, Yoshikawa T, et al. 1997.
Generation of reactive oxygen species during interaction
of diesel exhaust particle components with NADPH-cytochrome P450
reductase and involvement of the bioactivation in the DNA
damage. Free Radic Biol Med
22:479–487.
[DOI] [PubMed] [Google Scholar]
Kumagai Y, Shinkai Y, Miura T, Cho AK. 2012. The chemical
biology of naphthoquinones and its environmental
implications. Annu Rev Pharmacol
Toxicol
52:221–247.
[DOI] [PubMed] [Google Scholar]
Lakey PSJ, Berkemeier T, Tong H, Arangio AM, Lucas K, Pöschl U, et al. 2016.
Chemical exposure-response relationship between air
pollutants and reactive oxygen species in the human respiratory
tract. Sci Rep
6:32916; doi.10.1038/
srep32916.
[DOI] [PMC free article] [PubMed] [Google Scholar]
Lambe AT, Ahern AT, Williams LR, Slowik JG, Wong JPS, Abbatt JPD, et al. 2011.
Characterization of aerosol photooxidation flow reactors:
Heterogeneous oxidation, secondary organic aerosol formation and cloud
condensation nuclei activity measurements. Atmos
Meas Tech
4:445–461. [Google Scholar]
Lambe AT, Chhabra PS, Onasch TB, Brune WH, Hunter JF, Kroll JH, et al. 2015. Effect
of oxidant concentration, exposure time, and seed particles on secondary
organic aerosol chemical composition and yield.
Atmos Chem Phys
15:3063–3075. [Google Scholar]
Lee M, Heikes BG, Jacob DJ, Sachse G, Anderson B. 1997. Hydrogen
peroxide, organic hydroperoxide, and formaldehyde as primary pollutants
from biomass burning. J
GeophyRes–Atmos
102:1301–1309. [Google Scholar]
Lelieveld J, Evans JS, Fnais M, Giannadaki D, Pozzer A. 2015. The
contribution of outdoor air pollution sources to premature mortality on
a global scale. Nature
525:367–371.
[DOI] [PubMed] [Google Scholar]
Lelieveld S, Wilson J, Dovrou E, Mishra A, Lakey PSJ, Shiraiwa M, et al. 2021.
Hydroxyl radical production by air pollutants in
epithelial lining fluid governed by interconversion and scavenging of
reactive oxygen species. Environ Sci
Technol
55:14069–14079.
[DOI] [PMC free article] [PubMed] [Google Scholar]
Levin ME, Gonzales NO, Zimmerman LW, Yang J. 2006. Kinetics of
acid-catalyzed cleavage of cumene hydroperoxide.
J Hazard Mater
130:88–106.
[DOI] [PubMed] [Google Scholar]
Leviss DH, Van Ry DA, Hinrichs RZ. 2016. Multiphase
ozonolysis of aqueous α-terpineol.
Environ Sci Technol
50:11698–11705.
[DOI] [PubMed] [Google Scholar]
Li J-M, Shah AM. 2001. Differential
NADPH– versus NADH– dependent superoxide production by
phagocyte–type endothelial cell NADPH oxidase.
Cardiovasc Res
52:477–486.
[DOI] [PubMed] [Google Scholar]
Li N, Alam J, Venkatesan MI, Eiguren-Fernandez A, Schmitz D, Di Stefano E, et al. 2004. Nrf2 is
a key transcription factor that regulates antioxidant defense in
macrophages and epithelial cells: Protecting against the proinflammatory
and oxidizing effects of diesel exhaust chemicals.
J Immunol
173:3467–3481.
[DOI] [PubMed] [Google Scholar]
Li N, Sioutas C, Cho AK, Schmitz D, Misra C, Sempf J, et al. 2003.
Ultrafine particulate pollutants induce oxidative stress
and mitochondrial damage. Environ Health
Perspect
111:455–460.
[DOI] [PMC free article] [PubMed] [Google Scholar]
Li N, Wang M, Oberley TD, Sempf JM, Nel AE. 2002. Comparison of
the pro-oxidative and proinflammatory effects of organic diesel exhaust
particle chemicals in bronchial epithelial cells and
macrophages. J Immunol
169:4531–4341.
[DOI] [PubMed] [Google Scholar]
Li W, Ge P, Chen M, Tang J, Cao M, Cui Y, et al. 2021. Tracers
from biomass burning emissions and identification of biomass
burning. Atmosphere
12:1401. [Google Scholar]
Lim SS, Vos T, Flaxman AD, Danaei G, Shibuya K, Adair-Rohani H, et al. 2013. A
comparative risk assessment of burden of disease and injury attributable
to 67 risk factors and risk factor clusters in 21 regions, 1990-2010: A
systematic analysis for the Global Burden of Disease Study
2010. Lancet
380:2224–2260. [DOI] [PMC free article] [PubMed] [Google Scholar]
Lin P, Yu JZ. 2011. Generation of
reactive oxygen species mediated by humic-like substances in atmospheric
aerosols. Environ Sci Technol
45:10362–10368.
[DOI] [PubMed] [Google Scholar]
Liu J, Banerjee S, Oroumiyeh F, Shen J, del Rosario I, Lipsitt J, et al. 2022.
Cokriging with a low-cost sensor network to estimate
spatial variation of brake and tire-wear metals and oxidative stress
potential in Southern California. Environ
Int
168:107481;
doi:10.1016/j.envint.2022.107481.
[DOI] [PubMed] [Google Scholar]
Liu F, Saavedra MG, Champion JA, Griendling KK, Ng NL. 2020. Prominent
contribution of hydrogen peroxide to intracellular reactive oxygen
species generated upon exposure to naphthalene secondary organic
aerosols. Environ Sci Technol Lett
7:171–177. [Google Scholar]
Los DA, Murata N. 2004. Membrane
fluidity and its roles in the perception of environmental
signals. Biochim Biophys Acta
1666:142–157.
[DOI] [PubMed] [Google Scholar]
Lucas K, Maes M. 2013. Role of the
toll like receptor (TLR) radical cycle in chronic inflammation: Possible
treatments targeting the TLR4 pathway. Mol
Neurobiol
48:190–204.
[DOI] [PMC free article] [PubMed] [Google Scholar]
Mathai JC, Sitaramam V. 1994. Stretch
sensitivity of transmembrane mobility of hydrogen peroxide through voids
in the bilayer. Role of cardiolipin. J Biol
Chem
269:17784–17793.
[PubMed] [Google Scholar]
McCord JM. 1985. Oxygen-derived
free radicals in postischemic tissue injury. N
Eng J Med
312:159–163. [DOI] [PubMed] [Google Scholar]
Mentel TF, Springer M, Ehn M, Kleist E, Pullinen I, Kurtén T, et al. 2015.
Formation of highly oxidized multifunctional compounds:
Autoxidation of peroxy radicals formed in the ozonolysis of alkenes
— deduced from structure–product
relationships. Atmos Chem Phys
15:6745–6765. [Google Scholar]
Mertes P, Pfaffenberger L, Dommen J, Kalberer M, Baltensperger U. 2012. Development of
a sensitive long path absorption photometer to quantify peroxides in
aerosol particles (Peroxide-LOPAP). Atmos Meas
Tech
5:2339–2348. [Google Scholar]
Messner KR, Imlay JA. 2002. In vitro
quantitation of biological superoxide and hydrogen peroxide
generation. Methods Enzymol
349:354–361.
[DOI] [PubMed] [Google Scholar]
Monks PS, Granier C, Fuzzi S, Stohl A, Williams ML, Akimoto H, et al. 2009.
Atmospheric composition change – global and
regional air quality. Atmos Environ
43:5268–5350. [Google Scholar]
Mudway IS, Kelly FJ. 2000. Ozone and the
lung: A sensitive issue. Mol Aspects
Med
21:1–48.
[DOI] [PubMed] [Google Scholar]
Nadezhdin AD, Dunford HB. 1979. The oxidation
of ascorbic acid and hydroquinone by perhydroxyl radicals. A flash
photolysis study. Can J Chem
57:3017–3022. [Google Scholar]
Nauser T, Gebicki JM. 2017. Reaction rates
of glutathione and ascorbate with alkyl radicals are too slow for
protection against protein peroxidation in vivo.
Arch Biochem Biophys
633:118–123.
[DOI] [PubMed] [Google Scholar]
Nel A. 2005. Air
pollution–related illness: Effects of particles.
Science
308:804–806.
[DOI] [PubMed] [Google Scholar]
Nguyen GT, Green ER, Mecsas J. 2017. Neutrophils to
the ROScue: Mechanisms of NADPH oxidase activation and bacterial
resistance. Front Cell Infect Microbiol
7:373.
[DOI] [PMC free article] [PubMed] [Google Scholar]
Nguyen TB, Bateman AP, Bones DL, Nizkorodov SA, Laskin J, Laskin A. 2010.
High-resolution mass spectrometry analysis of secondary
organic aerosol generated by ozonolysis of isoprene.
Atmos Environ
44:1032–1042. [Google Scholar]
Offer S, Hartner E, Di Bucchianico S, Bisig C, Bauer S, Pantzke J, et al. 2022. Effect
of atmospheric aging on soot particle toxicity in lung cell models at
the air–liquid interface: Differential toxicological impacts of
biogenic and anthropogenic secondary organic aerosols
(SOAs). Environ Health Perspect
130:027003.
[DOI] [PMC free article] [PubMed] [Google Scholar]
Panday A, Sahoo MK, Osorio D, Batra S. 2015. NADPH
oxidases: An overview from structure to innate
immunity–associated pathologies. Cell Mol
Immuno
12:5–23. [DOI] [PMC free article] [PubMed] [Google Scholar]
Pardo M, Qiu X, Zimmermann R, Rudich Y. 2020. Particulate
matter toxicity is NRF2 and mitochondria dependent: The roles of metals
and polycyclic aromatic hydrocarbons. Chem Res
Toxicol
33:1110–1120.
[DOI] [PMC free article] [PubMed] [Google Scholar]
Pate KT, Stringari C, Sprowl–Tanio S, Wang K, TeSlaa T, Hoverter NP, et al. 2014. Wnt
signaling directs a metabolic program of glycolysis and angiogenesis in
colon cancer. EMBO J
33:1454–1473.
[DOI] [PMC free article] [PubMed] [Google Scholar]
Pavlovic J, Hopke PK. 2010. Detection of
radical species formed by the ozonolysis of
α-pinene. J Atmos Chem
66:137–155. [Google Scholar]
Pedersen JA. 1985. Handbook of
EPR Spectra from Quinones and Quinols.
Boca Raton, FL:CRC
Press. [Google Scholar]
Phalen RF, Oldham MJ, Nel AE. 2006.
Tracheobronchial particle dose considerations for in
vitro toxicology studies. Toxicol Sci
92:126–132.
[DOI] [PubMed] [Google Scholar]
Pope CA, Dockery DW. 2006. Health effects
of fine particulate air pollution: Lines that connect.
J Air Waste Manag Assoc
56:709–742.
[DOI] [PubMed] [Google Scholar]
Porra L, Dégrugilliers L, Broche L, Albu G, Strengell S, Suhonen H, et al. 2018.
Quantitative imaging of regional aerosol deposition, lung
ventilation and morphology by synchrotron radiation CT.
Sci Repo
8:3519. [DOI] [PMC free article] [PubMed] [Google Scholar]
Pöschl U, Shiraiwa M. 2015. Multiphase
chemistry at the atmosphere–biosphere interface influencing
climate and public health in the anthropocene.
Chem Rev
115:4440–4475.
[DOI] [PubMed] [Google Scholar]
Pospisilova V, Lopez–Hilfiker FD, Bell DM, El Haddad I, Mohr C, Huang W, et al. 2020. On the
fate of oxygenated organic molecules in atmospheric aerosol
particles. Sci Adv
6:eaax8922.
[DOI] [PMC free article] [PubMed] [Google Scholar]
Pryor WA, Squadrito GL, Friedman M. 1995. The cascade
mechanism to explain ozone toxicity – the role of lipid ozonation
products. Free Radical Biol Med
19:935–941.
[DOI] [PubMed] [Google Scholar]
Qiu J, Liang Z, Tonokura K, Colussi AJ, Enami S. 2020a. Stability of
monoterpene–derived
α–hydroxyalkyl–hydroperoxides in aqueous organic
media: Relevance to the fate of hydroperoxides in aerosol particle
phases. Environ Sci Technol
54:3890–3899.
[DOI] [PubMed] [Google Scholar]
Qiu J, Tonokura K, Enami S. 2020b.
Proton–catalyzed decomposition of
α–hydroxyalkyl-hydroperoxides in water.
Environ Sci Technol
54:10561–10569.
[DOI] [PubMed] [Google Scholar]
Ranjit S, Malacrida L, Stakic M, Gratton E. 2019. Determination
of the metabolic index using the fluorescence lifetime of free and bound
nicotinamide adenine dinucleotide using the phasor
approach. J Biophotonics
12:e201900156.
[DOI] [PMC free article] [PubMed] [Google Scholar]
Rehman AU, Anwer AG, Gosnell ME, Mahbub SB, Liu G, Goldys EM. 2017. Fluorescence
quenching of free and bound NADH in HeLa cells determined by
hyperspectral imaging and unmixing of cell
autofluorescence. Biomed Opt Express
8:1488–1498.
[DOI] [PMC free article] [PubMed] [Google Scholar]
Rich DQ, Ozkaynak H, Crooks J, Baxter L, Burke J, Ohman–Strickland P, et al. 2013. The
triggering of myocardial infarction by fine particles is enhanced when
particles are enriched in secondary species.
Environ Sci Tech
47:9414–9423. [DOI] [PMC free article] [PubMed] [Google Scholar]
Ripley S, Minet L, Zalzal J, Godri Pollitt K, Gao D, Lakey PSJ, et al. 2022.
Predicting spatial variations in multiple measures of
PM2.5 oxidative potential and magnetite nanoparticles in
Toronto and Montreal, Canada. Environ Sci
Technol
56:7256– 7265;
doi:10.1021/acs.est.1c05364.
[DOI] [PubMed] [Google Scholar]
Riva M. 2016. Multiphase
chemistry of highly oxidized molecules: The case of organic
hydroperoxides. Chem
1:526–528. [Google Scholar]
Sachse A, Wolf G. 2007. Angiotensin
II–induced reactive oxygen species and the
kidney. J Am Soc Nephrol
18:2439–2446.
[DOI] [PubMed] [Google Scholar]
Saffari A, Daher N, Shafer MM, Schauer JJ, Sioutas C. 2014. Seasonal and
spatial variation in dithiothreitol (DTT) activity of quasi-ultrafine
particles in the Los Angeles Basin and its association with chemical
species. J Environ Sci Health A Tox Hazard Subst
Environ Eng
49:441–451.
[DOI] [PubMed] [Google Scholar]
Sanchez J, Myers TN. 2004. Peroxides and
Peroxide Compounds, Organic Peroxides.
In
Kirk–Othmer Encyclopedia of Chemical Technology
(5th edition). Hoboken,
NJ:Wiley Interscience,
1–86. [Google Scholar]
Santana-Casiano JM, González-Dávila M, Millero FJ. 2005. Oxidation of
nanomolar levels of Fe(II) with oxygen in natural
waters. Environ Sci Technol
39:2073–2079.
[DOI] [PubMed] [Google Scholar]
Sato K, Hatakeyama S, Imamura T. 2007. Secondary
organic aerosol formation during the photooxidation of toluene:
NOx dependence of chemical composition.
J Phys Chem
111:9796–
9808. [DOI] [PubMed] [Google Scholar]
Sauer F, Schafer C, Neeb P, Horie O, Moortgat GK. 1999. Formation of
hydrogen peroxide in the ozonolysis of isoprene and simple alkenes under
humid conditions. Atmos Environ
33:229–241. [Google Scholar]
Schwantes RH, Schilling KA, McVay RC, Lignell H, Coggon MM, Zhang X, et al. 2017.
Formation of highly oxygenated low-volatility products
from cresol oxidation. Atmos Chem Phys
17:3453–3474. [Google Scholar]
Shahpoury P, Zhang ZW, Filippi A, Hildmann S, Lelieveld S, Mashtakov B, et al. 2022.
Inter-comparison of oxidative potential metrics for
airborne particles identifies differences between acellular chemical
assays. Atmos Poll Res
13:101596. [Google Scholar]
Shen H, Anastasio C. 2011. Formation of
hydroxyl radical from San Joaquin Valley particles extracted in a
cell–free surrogate lung fluid. Atmos
Chem Phys
11:9671–9682.
[DOI] [PMC free article] [PubMed] [Google Scholar]
Shen J, Griffiths PT, Campbell SJ, Utinger B, Kalberer M, Paulson SE. 2021. Ascorbate
oxidation by iron, copper and reactive oxygen species: Review, model
development, and derivation of key rate constants.
Sci Rep
11:7417.
[DOI] [PMC free article] [PubMed] [Google Scholar]
Shiraiwa M, Selzle K, Pöschl U. 2012. Hazardous
components and health effects of atmospheric aerosol particles: Reactive
oxygen species, soot, polycyclic aromatic compounds and allergenic
proteins. Free Radical Res
46:927–939.
[DOI] [PubMed] [Google Scholar]
Shiraiwa M, Ueda K, Pozzer A, Lammel G, Kampf CJ, Fushimi A, et al. 2017. Aerosol
health effects from molecular to global scales.
Environ Sci Technol
51:13545–13567.
[DOI] [PubMed] [Google Scholar]
Shirmohammadi F, Hasheminassab S, Wang D, Saffari A, Schauer JJ, Shafer MM, et al. 2015.
Oxidative potential of coarse particulate matter
(PM10-2.5) and its relation to water solubility and
sources of trace elements and metals in the Los Angeles
Basin. Environ Sci: Processes Impacts
17:2110–2121. [DOI] [PMC free article] [PubMed] [Google Scholar]
Shirmohammadi F, Wang D, Hasheminassab S, Verma V, Schauer JJ, Shafer MM, et al. 2017.
Oxidative potential of on-road fine particulate matter
(PM2.5) measured on major freeways of Los Angeles, CA,
and a 10-year comparison with earlier roadside studies.
Atmos Environ
148:102–114. [Google Scholar]
Sies H, Berndt C, Jones DP. 2017. Oxidative
stress. Annu Rev Biochem
86:715–748.
[DOI] [PubMed] [Google Scholar]
Snow JA, Heikes BG, Shen H, O’Sullivan DW, Fried A, Walega J. 2007. Hydrogen
peroxide, methyl hydroperoxide, and formaldehyde over North America and
the North Atlantic. J Geophys Res Atmos
112(D12);
doi:10.1029/2006JD007746. [Google Scholar]
Sompayrac LM. 2022. How the immune
system works. Malden,
MA:John Wiley &
Sons. [Google Scholar]
Stieb DM, Evans GJ, To TM, Lakey PSJ, Shiraiwa M, Hatzopoulou M, et al. 2021.
Within–city variation in reactive oxygen species
from fine particle air pollution and COVID–19.
Am J Respir Crit Care Med
204:168–177.
[DOI] [PMC free article] [PubMed] [Google Scholar]
Stoll S, Schweiger A. 2006. Easyspin, a
comprehensive software package for spectral simulation and analysis in
EPR. J Mag Reson
178:42–55. [DOI] [PubMed] [Google Scholar]
Stringari C, Cinquin A, Cinquin O, Digman MA, Donovan PJ, Gratton E. 2011. Phasor
approach to fluorescence lifetime microscopy distinguishes different
metabolic states of germ cells in a live tissue.
Proc Natl Acad Sci USA
108:13582.
[DOI] [PMC free article] [PubMed] [Google Scholar]
Stringari C, Edwards RA, Pate KT, Waterman ML, Donovan PJ, Gratton E. 2012. Metabolic
trajectory of cellular differentiation in small intestine by phasor
fluorescence lifetime microscopy of NADH. Sci
Rep
2:568.
[DOI] [PMC free article] [PubMed] [Google Scholar]
Studer A, Curran DP. 2016. Catalysis of
radical reactions: A radical chemistry perspective.
Angew Chem Int Ed Engl
55:58–102.
[DOI] [PubMed] [Google Scholar]
Sun H, Xie G, He D, Zhang L. 2020. Ascorbic acid
promoted magnetite Fenton degradation of alachlor: Mechanistic insights
and kinetic modeling. Applied Catalysis
B:Environmental
267:118383;
doi.10.1016/j.apcatb.2019.118383. [Google Scholar]
Surratt JD, Murphy SM, Kroll JH, Ng NL, Hildebrandt L, Sorooshian A, et al. 2006.
Chemical composition of secondary organic aerosol formed
from the photooxidation of isoprene. J Phys Chem
A
110:9665–9690.
[DOI] [PubMed] [Google Scholar]
Teufelhofer O, Weiss R-M, Parzefall W, Schulte-Hermann R, Micksche M, Berger W, et al. 2003.
Promyelocytic HL60 cells express NADPH oxidase and are
excellent targets in a rapid spectrophotometric microplate assay for
extracellular superoxide. Toxicol Sci
76:376–383.
[DOI] [PubMed] [Google Scholar]
Tilgner A, Herrmann H. 2018. Tropospheric
aqueous-phase OH oxidation chemistry: Current understanding, uptake of
highly oxidized organics and its effects.
In:
Multiphase environmental chemistry in the atmosphere.
Washington DC:American
Chemical Society,
1299:49–85. [Google Scholar]
To T, Terebessy E, Zhu J, Zhang K, Lakey PSJ, Shiraiwa M, et al. 2022. Does
early life exposure to exogenous sources of reactive oxygen species
(ROS) increase the risk of respiratory and allergic diseases in
children? A longitudinal cohort study. Environ
Health
21:90;
doi:10.1186/s12940-022-00902-7.
[DOI] [PMC free article] [PubMed] [Google Scholar]
Togashi DM, Nicodem DE. 2004. Photophysical
studies of 9,10-phenanthrenequinones.
Spectrochim Acta A Mol Biomol Spectrosc
60:3205–3212.
[DOI] [PubMed] [Google Scholar]
Tong H, Arangio AM, Lakey PSJ, Berkemeier T, Liu F, Kampf CJ, et al. 2016.
Hydroxyl radicals from secondary organic aerosol
decomposition in water. Atmos Chem Phys
16:1761–1771. [Google Scholar]
Tong H, Lakey PSJ, Arangio AM, Socorro J, Kampf CJ, Berkemeier T, et al. 2017.
Reactive oxygen species formed in aqueous mixtures of
secondary organic aerosols and mineral dust influencing cloud chemistry
and public health in the anthropocene. Faraday
Discuss
200:251–270.
[DOI] [PubMed] [Google Scholar]
Tong H, Lakey PSJ, Arangio AM, Socorro J, Shen F, Lucas K, et al. 2018.
Reactive oxygen species formed by secondary organic
aerosols in water and surrogate lung fluid.
Environ Sci Technol
52:11642–11651.
[DOI] [PubMed] [Google Scholar]
Tröstl J, Chuang WK, Gordon H, Heinritzi M, Yan C, Molteni U, et al. 2016. The
role of low–volatility organic compounds in initial particle
growth in the atmosphere. Nature
533:527–
531.
[DOI] [PMC free article] [PubMed] [Google Scholar]
Tsai P, Ichikawa K, Mailer C, Pou S, Halpern HJ, Robinson BH, et al. 2003. Esters
of 5-Carboxyl-5-methyl-1-pyrroline N-Oxide: A family of
spin traps for superoxide. J Org Chem
68:7811–7817.
[DOI] [PubMed] [Google Scholar]
Tuet WY, Chen Y, Fok S, Champion JA, Ng NL. 2017a. Inflammatory
responses to secondary organic aerosols (SOA) generated from biogenic
and anthropogenic precursors. Atmos Chem
Phys
17:11423–11440. [Google Scholar]
Tuet WY, Chen Y, Xu L, Fok S, Gao D, Weber RJ, et al. 2017b.
Chemical oxidative potential of secondary organic aerosol
(SOA) generated from the photooxidation of biogenic and anthropogenic
volatile organic compounds. Atmos Chem
Phys
17:839–853. [Google Scholar]
Valko M, Morris H, Cronin MTD. 2005. Metals,
toxicity and oxidative stress. Curr Med
Chem
12:1161–1208.
[DOI] [PubMed] [Google Scholar]
van der Vliet A, O’Neill CA, Cross CE, Koostra JM, Volz WG, Halliwell B, et al. 1999.
Determination of low–molecular–mass
antioxidant concentrations in human respiratory tract lining
fluids. Am J Physiol-Lung C
276:L289–L296. [DOI] [PubMed] [Google Scholar]
Venkatachari P, Hopke PK, Brune WH, Ren X, Lesher R, Mao J, et al. 2007.
Characterization of wintertime reactive oxygen species
concentrations in Flushing, New York. Aerosol
Sci Technol
41:97–111. [Google Scholar]
Venkatachari P, Hopke PK, Grover BD, Eatough DJ. 2005. Measurement of
particle-bound reactive oxygen species in rubidoux
aerosols. J Atmos Chem
50:49–58. [Google Scholar]
Vereecken L, Francisco JS. 2012. Theoretical
studies of atmospheric reaction mechanisms in the
troposphere. Chem Soc Rev
41:6259–6293.
[DOI] [PubMed] [Google Scholar]
Verma V, Fang T, Xu L, Peltier RE, Russell AG, Ng NL, et al. 2015a.
Organic aerosols associated with the generation of
reactive oxygen species (ROS) by water-soluble
PM2.5. Environ Sci Technol
49:4646–4656.
[DOI] [PubMed] [Google Scholar]
Verma V, Wang Y, El-Afifi R, Fang T, Rowland J, Russell AG, et al. 2015b.
Fractionating ambient humic-like substances (HULIS) for
their reactive oxygen species activity – Assessing the importance
of quinones and atmospheric aging. Atmos
Environ
120:351–359. [Google Scholar]
Vicente ED, Alves CA, Martins V, Almeida SM, Lazaridis M. 2021. Lung-deposited
dose of particulate matter from residential exposure to smoke from wood
burning. Environ Sci Poll Res
28:65385–65398. [DOI] [PubMed] [Google Scholar]
Vidrio E, Jung H, Anastasio C. 2008. Generation of
hydroxyl radicals from dissolved transition metals in surrogate lung
fluid solutions. Atmos Environ
42:4369–4379. [DOI] [PMC free article] [PubMed] [Google Scholar]
Villamena FA, Merle JK, Hadad CM, Zweier JL. 2005. Superoxide
radical anion adduct of 5,5–dimethyl–1–pyrroline
N– oxide (DMPO). 1. The thermodynamics of
formation and its acidity. J Phys Chem
A
109:6083–6088.
[DOI] [PubMed] [Google Scholar]
Voelker BM, Sedlak DL. 1995. Iron reduction
by photoproduced superoxide in seawater. Mar
Chem
50:93–102. [Google Scholar]
Walczak MM, Dryer DA, Jacobson DD, Foss MG, Flynn NT. 1997. pH dependent
redox couple: An illustration of the Nernst equation.
J Chem Educ
74:1195. [Google Scholar]
Walling C. 1963. Chemistry of
the organic peroxides. Radiat Res Sup
3:3–16. [PubMed] [Google Scholar]
Wang S, Takhar M, Zhao Y, Al Rashdi LNS, Chan AWH. 2021. Dynamic
oxidative potential of organic aerosol from heated cooking
oil. ACS Earth Space Chem
5:1150–1162. [Google Scholar]
Wang X, Ho K-F, Chow JC, Kohl SD, Chan CS, Cui L, et al. 2018. Hong
Kong vehicle emission changes from 2003 to 2015 in the Shing Mun
Tunnel. Aerosol Sci Tech
52:1085–1098. [Google Scholar]
Wang Y, Arellanes C, Curtis DB, Paulson SE. 2010. Probing the
source of hydrogen peroxide associated with coarse mode aerosol
particles in Southern California. Environ Sci
Technol
44:4070–4075.
[DOI] [PubMed] [Google Scholar]
Wang Y, Arellanes C, Paulson SE. 2012. Hydrogen
peroxide associated with ambient fine-mode, diesel, and biodiesel
aerosol particles in Southern California.
Aerosol Sci Technol
46:394–402. [DOI] [PubMed] [Google Scholar]
Wang Y, Hopke PK, Sun L, Chalupa DC, Utell MJ. 2011a. Laboratory
and field testing of an automated atmospheric particle–bound
reactive oxygen species sampling–analysis system.
J Toxicol
2011. [DOI] [PMC free article] [PubMed] [Google Scholar]
Wang Y, Kim H, Paulson SE. 2011b. Hydrogen
peroxide generation from α- and β-pinene and toluene
secondary organic aerosols. Atmos
Environ
45:3149–3156. [Google Scholar]
Weber G. 1981. Resolution of
the fluorescence lifetimes in a heterogeneous system by phase and
modulation measurements. J Phys Chem
85:949–953. [Google Scholar]
Wei J, Fang T, Lakey PSJ, Shiraiwa M. 2021a.
Iron-facilitated organic radical formation from secondary
organic aerosols in surrogate lung fluid.
Environ Sci Technol
56:7234–7243;
doi.10.1021/acs.est.1c04334. [DOI] [PubMed] [Google Scholar]
Wei J, Fang T, Shiraiwa M. 2022. Effects of
acidity on reactive oxygen species formation from secondary organic
aerosols. ACS Environmental Au
2:336–345;
doi.10.1021/acsenvironau.2c00018.
[DOI] [PMC free article] [PubMed] [Google Scholar]
Wei J, Fang T, Wong C, Lakey PSJ, Nizkorodov SA, Shiraiwa M. 2021b. Superoxide
formation from aqueous reactions of biogenic secondary organic
aerosols. Environ Sci Technol
55:260–270.
[DOI] [PubMed] [Google Scholar]
Wei J, Yu H, Wang Y, Verma V. 2019. Complexation
of iron and copper in ambient particulate matter and its effect on the
oxidative potential measured in a surrogate lung fluid.
Environ Sci Technol
53:1661–1671.
[DOI] [PubMed] [Google Scholar]
West JJ, Cohen A, Dentener F, Brunekreef B, Zhu T, Armstrong B, et al. 2016. What we
breathe impacts our health: Improving understanding of the link between
air pollution and health. Environ Sci
Technol
50:4895–4904.
[DOI] [PMC free article] [PubMed] [Google Scholar]
Wientjes FB, Segal AW. 1995. NADPF oxidase
and the respiratory burst. Semin Cell
Biol
6:357–365.
[DOI] [PubMed] [Google Scholar]
Winterbourn CC. 2008. Reconciling
the chemistry and biology of reactive oxygen species.
Nature Chem Biol
4:278–286.
[DOI] [PubMed] [Google Scholar]
Xiong Q, Yu H, Wang R, Wei J, Verma V. 2017. Rethinking
dithiothreitol–based particulate matter oxidative potential:
Measuring dithiothreitol consumption versus reactive oxygen species
generation. Environ Sci Technol
51:6507–6514.
[DOI] [PubMed] [Google Scholar]
Yamazaki T, Kawai C, Yamauchi A, Kuribayashi F. 2011. A highly
sensitive chemiluminescence assay for superoxide detection and chronic
granulomatous disease diagnosis. Trop Med
Health
39:41–45.
[DOI] [PMC free article] [PubMed] [Google Scholar]
Yang X, Ma K. 2007.
Characterization of an exceedingly active NADH oxidase
from the anaerobic hyperthermophilic bacterium thermotoga
maritima. J Bacteriol
189:3312–3317.
[DOI] [PMC free article] [PubMed] [Google Scholar]
Yaremenko IA, Vil’ VA, Demchuk DV, Terent’ev AO. 2016. Rearrangements
of organic peroxides and related processes.
Beilstein J Org Chem
12:1647–1748.
[DOI] [PMC free article] [PubMed] [Google Scholar]
Yuan X, Miller CJ, Pham AN, Waite TD. 2014. Kinetics and
mechanism of auto– and copper–catalyzed oxidation of
1,4–naphthohydroquinone. Free Radic Bio
Med
71:291–302.
[DOI] [PubMed] [Google Scholar]
Zhang X, Lambe AT, Upshur MA, Brooks WA, Gray Bé A, Thomson RJ, et al. 2017. Highly
oxygenated multifunctional compounds in α-pinene secondary
organic aerosol. Environ Sci Technol
51:5932–5940.
[DOI] [PubMed] [Google Scholar]
Zhang X, Staimer N, Tjoa T, Gillen DL, Schauer JJ, Shafer MM, et al. 2016.
Associations between microvascular function and
short–term exposure to traffic–related air pollution and
particulate matter oxidative potential. Environ
Health
15:81.
[DOI] [PMC free article] [PubMed] [Google Scholar]
Zhang ZH, Hartner E, Utinger B, Gfeller B, Paul A, Sklorz M, et al. 2022. Are
reactive oxygen species (ROS) a suitable metric to predict toxicity of
carbonaceous aerosol particles?
Atmos Chem Phys
22:1793–1809. [Google Scholar]
Zhang Z, Weichenthal S, Kwong JC, Burnett RT, Hatzopoulou M, Jerrett M, et al. 2020.
Long-term exposure to iron and copper in fine particulate
air pollution and their combined impact on reactive oxygen species
concentration in lung fluid: A population-based cohort study of
cardiovascular disease incidence and mortality in Toronto,
Canada. Int J Epidemiol
50:589–601;
doi.10.1093/ije/dyaa230. [DOI] [PubMed] [Google Scholar]
Zhang Z, Weichenthal S, Kwong JC, Burnett RT, Hatzopoulou M, Jerrett M, et al. 2021. A
population-based cohort study of respiratory disease and long-term
exposure to iron and copper in fine particulate air pollution and their
combined impact on reactive oxygen species generation in human
lungs. Environ Sci Technol
55:3807–3818.
[DOI] [PubMed] [Google Scholar]
Zhao H, Joseph J, Zhang H, Karoui H, Kalyanaraman B. 2001. Synthesis and
biochemical applications of a solid cyclic nitrone spin trap: A
relatively superior trap for detecting superoxide anions and glutathiyl
radicals. Free Radical Biol Med
31:599–606.
[DOI] [PubMed] [Google Scholar]
Zhao J, Hopke PK. 2012. Concentration
of reactive oxygen species (ROS) in mainstream and sidestream cigarette
smoke. Aerosol Sci Technol
46:191–197. [Google Scholar]
Ziemann PJ. 2002. Evidence for
low volatility diacyl peroxides as a nucleating agent and major
component of aerosol formed from reactions of O3 with
cyclohexene and homologous compounds. J Phys
Chem A
106:4390–4402. [Google Scholar]
Ziemann PJ, Atkinson R. 2012. Kinetics,
products, and mechanisms of secondary organic aerosol
formation. Chem Soc Rev
41:6582–6605.
[DOI] [PubMed] [Google Scholar]
Res Rep Health Eff Inst. 2023 Dec 1;2023:215.
Commentary by Review Committee
Research Report 215, Chemical and Cellular Formation of Reactive
Oxygen Species from Secondary Organic Aerosols in Epithelial Lining
Fluid, Shiraiwa et al.
Dr. Manabu Shiraiwa’s 3-year study, “Formation of Reactive
Oxygen Species by Organic Aerosols and Transition Metals in Epithelial
Lining Fluid,” began in November 2018. Total expenditures were
$450,000. The draft Investigators’ Report from Shiraiwa and
colleagues was received for review in July 2022. A revised report, received
in December 2022, was accepted for publication in February 2023. During the
review process, the HEI Review Committee and the investigators had the
opportunity to exchange comments and to clarify issues in both the
Investigators’ Report and the Review Committee’s
Commentary.
This document has not been reviewed by public or private party institutions,
including those that support the Health Effects Institute; therefore, it may
not reflect the views of these parties, and no endorsements by them should
be inferred.
Atmospheric aerosols are a mixture of organic (e.g., carbon-containing) and
inorganic microscopic particles and liquid droplets, known as particulate matter
(PM*), that are
suspended in the air. Commonly used as a proxy for overall air quality levels,
PM can be emitted directly from combustion sources (such as smokestacks, vehicle
exhaust, and wildfires) but is also formed by chemical reactions in the
atmosphere (World Health Organization [WHO] 2022). Even at relatively low levels of exposure,
PM is associated with adverse health effects, namely respiratory and
cardiovascular disease and mortality, and is recognized as a leading risk factor
of morbidity and mortality worldwide (Global Burden of Disease [GBD] 2020; International Agency for
Research and Cancer [IARC] 2016;
United States Environmental Protection Agency [U.S. EPA 2019]). Laboratory and human studies show that PM
exposure leads to poor health outcomes through various biological mechanisms,
including oxidative stress and inflammation, both of which are induced by
reactive oxygen species (ROS) (Li et al. 2022).
ROS are highly reactive oxygen-containing chemicals, such as hydrogen peroxide
and hydroxyl radicals, and are part of normal biological function. For example,
ROS are byproducts of aerobic metabolism and play a role in such processes as
cell differentiation, apoptosis, and immunity (Pizzino et al. 2017). However, the overproduction
and accumulation of ROS due to environmental and other insults can damage
essential cell components and lead to the onset and progression of disease
(Pizzino et al. 2017). In the
context of inhaled pollutants and their downstream health effects, understanding
ROS formation in the respiratory tract is essential but poorly characterized.
Research focused on the epithelial lining fluid (ELF) — a protective
liquid layer above the mucosa that contains antioxidants, surfactants, and
immune cells — is needed because it is a critical interface between lung
tissue and the outside environment. Ambient inhalable aerosols contain
components such as transition metals that can catalyze ROS formation in the ELF
(Gurgueira et al. 2002; Lakey et
al. 2016). In response to
aerosol exposure, immune cells called macrophages can also release ROS in the
ELF as part of their kill and capture campaign primarily
intended for microbial invasion. The relative importance of ROS formation by
chemical reactions compared with macrophage ROS generation and release is
unknown. Better characterization of these ROS formation pathways might lead to
the development of clinical or public health interventions to reduce air
pollution health effects.
To begin to examine the effects of air pollution exposure on the formation of ROS
in lungs, Dr. Manabu Shiraiwa of the University of California, Irvine, submitted
an application to HEI titled “Formation of Reactive Oxygen Species by
Organic Aerosols and Transition Metals in Epithelial Lining Fluid” in
response to HEI’s Request for Applications 17-3 Walter A. Rosenblith New
Investigator Award. This award was established to provide support for an
outstanding new investigator to conduct research on air pollution and health and
is unrestricted with respect to the specific topic of air pollution health
research. Dr. Shiraiwa proposed to investigate the kinetics and chemical
mechanisms of ROS formation in synthetic ELF by different types of air
pollutants and to quantify the relative importance of ROS formed by chemical
reactions in the ELF compared with ROS released as an immune response to the
pollution. HEI funded the study because Dr. Shiraiwa was an established
atmospheric chemist who has expertise in ROS kinetic modeling and was proposing
interdisciplinary chemistry and toxicology work to elucidate the role of
chemically versus biologically produced ROS in air pollution health effects,
using state-of-the-art methods to capture formation of a variety of ROS species
in a controlled environment.
This Commentary provides the HEI Review Committee’s independent evaluation
of the study. It is intended to aid the sponsors of HEI and the public by
highlighting both the strengths and limitations of the study and by placing the
Investigators’ Report into scientific and regulatory perspective.
SCIENTIFIC AND REGULATORY BACKGROUND
Aerosol air pollution is associated with a myriad of health effects, including
respiratory, cardiovascular, and neurological diseases, cancer, and poor birth
outcomes (GBD 2020; IARC 2016; U.S. EPA 2019). Particle size determines
deposition in the respiratory tract and influences subsequent health effects.
For example, coarse particles (PM between 2.5 and 10 μm in average
aerodynamic diameter) mostly deposit in the upper respiratory tract, whereas
fine particles (PM <2.5 μm in aerodynamic diameter, or
PM2.5) can deposit deep in the lower respiratory tract; they can
directly enter the bloodstream, or compounds adsorbed onto the particles can
enter the lung and vascular tissues (Li et al. 2022). A substantial body of evidence has led the
U.S. EPA to conclude that the link between exposure to PM2.5 and
mortality is causal (U.S. EPA 2019). Although air pollution levels have decreased over the past
few decades in high-income countries, associated health effects are still
observed at levels at and below current air quality standards (Brauer et al.
2019, 2022; Brunekreef et al. 2021; Chen and Hoek 2020; Dominici et al. 2019, 2022). Accordingly, the WHO revised its air quality guidelines (WHO
2021), and some governmental
agencies, such as the U.S. EPA, have proposed further lowering the regulatory
standards for PM (U.S. EPA 2023). They continue to review the scientific evidence to evaluate the
need for even lower standards.
Despite their public health importance, the complex time-varying chemistry of
atmospheric aerosols is not fully understood. Primary aerosols originate
directly from their anthropogenic (e.g., fuel and biomass combustion) or natural
sources (e.g., sea salt and mineral dust). The carbonaceous fraction of PM
includes such components as organic carbon and black carbon, whereas the
inorganic fraction includes such compounds as sulfates and nitrates. Secondary
organic aerosols (SOAs) form by gas-to-particle conversion in the atmosphere
when organic gases react with oxidizing agents such as ozone (see Commentary Figure 1).
SOA precursors can be biogenic or anthropogenic in origin. Biogenic precursors,
including isoprene and pinene, are primarily emitted from plants and are
abundant in the ambient atmosphere (Shrivastava et al. 2017). Anthropogenic precursors such as
naphthalene are emitted from fuel burning and coal tar processing (Jia and
Batterman 2010). SOAs are the
major fraction of organic aerosols in the atmosphere and are thus an important
aspect of air pollution health effects (Shrivastava et al. 2017).
Anthropogenic and biogenic volatile organic gases are emitted into
the atmosphere and react with oxidizing agents such as ozone in a
gas-to-particle conversion to form SOAs. SOAs (and other
aerosols) are inhaled into the respiratory tract and can form ROS in the
ELF through chemical reactions. ROS are also formed cellularly by
macrophages under normal physiological conditions. However, aerosols
exposure can increase cellular ROS formation. Antioxidants like vitamin
C and glutathione (GSH) scavenge and neutralize ROS. When antioxidant
systems are overwhelmed, ROS can accumulate and induce oxidative stress,
which leads to cell damage and death.
Research has demonstrated that redox active air pollutants, including SOAs,
contribute to ROS formation in the lung ELF, where they undergo redox cycling
and interact with host antioxidants and immune cells, including macrophages
(Pöschl and Shiraiwa 2015). In response to foreign substances, certain types of macrophages
classified as M1 macrophages activate to a proinflammatory state and release ROS
to kill microbes and signal the disturbance to neighboring cells. Macrophage ROS
generation is beneficial when compartmentalized to specific cells and tissues in
need, and in healthy tissues ROS are kept in balance by scavenging antioxidants.
However, excess ROS can lead to oxidative stress, tissue damage, and
overwhelming or chronic inflammation (Canton et al. 2021). Thus, ROS are formed in lung ELF both
chemically and cellularly, but the relative importance of each formation pathway
is poorly characterized, partly because it is difficult to measure various
species of ROS and determine their origin. To shed light on this question, the
current study aimed to combine kinetic modeling of ROS formation with
experimental quantification of ROS produced by chemical reactions of SOA in
synthetic lung ELF and by macrophages exposed to SOA in vitro.
SUMMARY OF APPROACH AND METHODS
STUDY AIMS AND APPROACH
To begin to characterize the formation of ROS in the ELF of lungs following
inhalation of SOAs, Dr. Shiraiwa and colleagues aimed to accomplish the
following:
Identify the mechanisms and kinetics of ROS formation by aqueous
chemical reactions of SOAs. Specific tasks were to
Quantify ROS formation by laboratory-generated SOAs
Quantify ROS formation by ambient PM samples
Quantify the relative importance of ROS formed by chemical reactions
compared with the cellular release of ROS by macrophages in
synthetic ELF. Specific tasks were to
Use kinetic modeling to estimate ROS concentrations formed by
chemical reactions within different lung compartments
Quantify ROS released by macrophage cells when exposed to
SOA
Shiraiwa and colleagues first generated SOAs in a controlled laboratory
environment by inducing oxidation of selected biogenic and anthropogenic
organic compounds in a reaction chamber. They also collected PM from a small
number of ambient air samples from the Los Angeles, California, region that
were used to represent real-world PM from urban, traffic, and wildfire
locations. They conducted various in vitro experiments to quantify the
chemical formation of several different types of ROS in water and in
synthetic lung ELF from SOAs generated by laboratory precursors or ambient
air PM samples. The synthetic lung ELF contained the antioxidants ascorbate
(vitamin C), citric acid, glutathione, and uric acid. They also evaluated
laboratory-generated and ambient PM for their oxidative potential, a measure
of particle capacity to take electrons from (or oxidize) other molecules and
generate ROS. In their experiments, the investigators evaluated the effects
of different experimental conditions on ROS formation, including the
addition of nitrogen oxides (NOx), the addition of ferrous iron
(Fe2+), and changes in pH levels ranging from 1 to
7.4. Both NOx, a traffic-related air pollutant, and
Fe2+, a transition metal of natural and anthropogenic
origin, are recognized as important atmospheric oxidizing agents
(Pöschl and Shiraiwa 2015). They used a relatively new and sensitive method called
continuous wave electron paramagnetic resonance (EPR) spectroscopy with a
spin trapping technique to capture the formation of various ROS species.
In addition, Shiraiwa and colleagues used computer modeling to determine the
ROS chemical reaction kinetics and developed a combined model of the human
respiratory tract and reaction kinetics to estimate ROS burden in different
compartments of the respiratory system after inhalation exposure. Finally,
in collaboration with a leading toxicologist in the field, Dr. Michael
Kleinman, Shiraiwa compared the chemical formation of ROS by SOAs with the
ROS released by macrophage cells when exposed to SOAs.
METHODS AND STUDY DESIGN
Aerosol Generation and Sampling
Laboratory-Generated Particles
SOA particles were generated by the oxidation of biogenic SOA
precursors, including isoprene, α-pinene, β-pinene,
α-terpineol, and d-limonene, and such anthropogenic SOA
precursors as naphthalene and toluene. Not all precursors were used
for all experiments. The investigators used two methods of oxidation
(dark ozonolysis and hydroxyl photooxidation). In experiments using
dark ozonolysis oxidation, ozone was first injected into an
oxidation flow reactor using pure oxygen and an ozone generator. In
hydroxyl photooxidation, hydroxyl radicals were generated by
ultraviolet photolysis of water molecules. The SOA precursors that
formed from ozone or hydroxyl radicals were then separately injected
into a potential aerosol mass (PAM) reactor, and SOA particles were
collected on to 47-mm polytetrafluoroethylene (PTFE) filters.
Ambient Air Particle Sampling
The investigators sampled ambient PM from sites representative of
urban, highway, and wildfire environments in the Los Angeles region.
First, they used a high-volume sampler with microquartz filters to
collect ambient PM samples during periods without nearby wildfires.
Samples were separated into PM size fractions <1 micron
(PM1) and 1–10 microns (PM1-10).
The single urban site was atop a University of California, Irvine,
campus building (20 meters high) and the two highway sites were
located within 20 meters of interstates I-5 and I-710, the latter of
which has a higher fraction of heavy-duty vehicles. Each sample was
collected for 4–12 hours daily over 5–6 days during
January and February 2020. Portions of the sampling collection
filters were used to measure environmentally persistent free
radicals for all sites and to measure ROS and oxidative potential
within six months of sampling.
During two major wildfire events that occurred about 20 kilometers
away from the Los Angeles sites in October and November 2020, the
investigators sampled size-segregated ambient PM using a
Micro-Orifice Uniform Deposition Impactor (MOUDI Model 100NR) with
Teflon filters. Eight sets of continuous 3-day samples were
collected at the rooftop urban site during each fire event. MOUDI
samples that were previously collected from the same urban and
highway locations earlier that year (January and February 2020) were
used as baseline nonfire samples. To normalize the measurements,
hourly mass concentrations of PM1 and PM10
were collected at the urban site using the Purple Air real-time air
quality data located within 0.5 kilometers of the sampling site.
Purple Air data were not available for the highway sites.
ROS Detection and Quantification
The investigators used several techniques to quantify ROS formation in
water, in synthetic lung ELF, and from macrophage cells that were
exposed to SOAs generated by laboratory-based biogenic volatile organic
compounds and to ambient air PM samples. Radical forms of ROS were
detected using a relatively new and sensitive method called continuous
wave electron paramagnetic resonance (EPR) spectroscopy with a spin
trapping technique that enables detection of some shorter-lived
radicals; these included the hydroxyl radical, superoxide radical, and
carbon-centered and oxygen-centered organic radicals (Commentary Figure
2). To quantify the absolute and relative abundance of
the radicals, EPR spectra were fitted and simulated using software
packages to process the spin counting methods. Hydrogen peroxide was
measured using a fluorometric hydrogen peroxide assay and
spectrofluorophotometry; organic hydroperoxides within the SOA particles
were measured with an iodometric-spectrophotometric technique. The
assays included negative controls and were calibrated with standards.
Oxidative potential was quantified with positive controls using the
dithiothreitol (DTT) assay and a Liquid Waveguide Capillary Cell coupled
to the ultraviolet-visible spectrophotometer and the multiwavelength
light detector. Total DTT was calculated using linear regression of time
and absorbance.
ROS Chemical Formulas quantified. Red dots represent
unpaired electrons.
To quantify the relative importance of chemical versus cellular ROS
formation, the investigators used a chemiluminescence assay combined
with EPR spectroscopy to detect superoxide formed in the absence and
presence of macrophages. The investigators used RAW 264.7 macrophage
cells, a cultured mouse cell line, because it had previously been used
to study oxidative stress. Experiments were performed in triplicate with
positive and negative controls. Note that there was a 15-minute delay in
superoxide measurement due to sample preparation; this delay likely
missed a large portion of early ROS formation. To account for that,
kinetic modeling was applied. Superoxide formation time profiles and
total formation were calculated using the mean of triplicates. For
imaging, all data points for each sample were averaged from multiple
cells (N > 10). Unpaired t tests were
used to test whether SOA-exposed and control groups of cells differed in
superoxide concentrations.
Kinetic Modeling
Shiraiwa and colleagues developed a kinetic model to simulate the
simultaneous formation of hydroxyl radicals and superoxide by aqueous
chemical reactions of SOA. This kinetic model combined experimental
findings with known information about several individual chemical
reactions into a more comprehensive model of SOA and ROS chemistry.
Rate-constant model inputs were based on the relative abundance of
certain functional groups (published values obtained from experiments by
other researchers) or on a Monte Carlo genetic algorithm. Kinetic
modeling was also used to simulate ROS formation by aqueous chemical
reactions of isoprene-generated SOA with Fe2+ in
synthetic lung ELF that contained antioxidants.
To estimate the concentration and rate of ROS formation in different
regions of the respiratory tract, the investigators built on their
previously developed human respiratory tract model and a kinetic
multilayer model for surface and bulk chemistry in the ELF (KM-SUB-ELF)
(Lakey et al. 2016). The
human respiratory tract model estimated particle deposition in the
entire tract and within the extrathoracic, bronchial, and alveolar
regions with inhalation parameters for a person doing light work while
breathing through their nose. The KM-SUB-ELF model incorporated over 50
relevant chemical reactions, included rate constants from literature
values when available, and accounted for ROS formation by α- and
β-pinene-, isoprene-, and limonene-generated SOAs; by quinones
from naphthalene; and by transition metals copper and iron. The models
were applied to previously collected urban and roadside, size-segregated
PM samples from Atlanta, Georgia (Fang et al. 2017). They modeled the formation of
hydrogen peroxide and hydroxyl and superoxide radicals. Lastly, in an
attempt to integrate results of the modeling with experimental data, the
investigators compared the KM-SUB-ELF modeled ROS formation with
oxidative potential as measured by the DTT and ascorbic acid assays for
different respiratory tract regions and for the Atlanta PM samples taken
in winter versus summer.
SUMMARY OF KEY FINDINGS
ROS FORMATION BY LABORATORY-GENERATED SOAS
Shiraiwa and colleagues evaluated which ROS molecules formed under various
conditions to understand various contributing factors better and to obtain
detailed data for input into kinetic modeling. They found that the formation
of various ROS depended on the method of aqueous oxidation and the SOA
precursor and that reaction kinetics varied (see Commentary Table
1). Ozonolysis of α-terpineol exclusively formed
hydroxyl radical adducts, and ozonolysis of d-limonene formed 80% superoxide
radical adducts. Ozonolysis of isoprene and β-pinene yields were
almost evenly split between the hydroxyl and superoxide radical adducts. ROS
yields for the hydroxyl photooxidation of all tested biogenic compounds were
mostly superoxide radical adducts and excluded the formation of any hydroxyl
radical adducts.
Carbon- and oxygen-centered organic radical adduct formation was relatively
low. In experiments of hydrogen peroxide formation, isoprene-generated SOA
formed higher levels than the other SOA precursors, and oxidation by
ozonolysis generally formed higher levels than by hydroxyl photooxidation.
Superoxide and hydrogen peroxide formation were highly correlated
(R2 > 0.9). Kinetic modeling showed that
ROS formation varied by time. Hydroxyl radical adduct formation by
ozonolysis increased rapidly and reached a steady state after 2 hours.
However, superoxide formation by both oxidation methods reached a maximum
concentration within 30–40 minutes and then decreased slowly
thereafter after exposure to most biogenic precursors.
Commentary Table 1.
Summary of Chemical ROS Formation by Oxidation Method, SOA Precursor,
and Changes in the Experimental Conditions
0, negative result; +, low yield; ++,
moderate yield; +++, high yield; ↑,
increased yield; ↓, decreased yield; =, no change; NA,
not tested.
Different experimental conditions, including the presence of NOx
or Fe2+ and changes in pH levels, altered ROS formation in
water and synthetic ELF (Commentary Table 1). The introduction of high concentrations of
NOx (700 ppb) to SOA generated by α-pinene or
naphthalene decreased hydroxyl radical formation by a factor of 10 and 1.5,
respectively, and decreased superoxide formation by a factor of 2 and 3,
respectively. NOx also reacted with the SOA precursors to form
many nitrogen-containing compounds, although the individual specifics of
which could not be resolved with the current laboratory methods. At neutral
pH (7.4), α-terpineol-generated SOAs primarily formed carbon-centered
radical adducts; at lower pH (<3.5), the overall ROS radical
formation decreased despite small increases in the hydroxyl radical,
superoxide, and oxygen-centered radical adducts. Similarly, at lower pH
levels the overall ROS formation by isoprene-generated SOAs decreased,
despite small increases in superoxide. In contrast, at lower pH levels
α-pinene-, β-pinene-, toluene-, and naphthalene-generated SOAs
had higher overall ROS radical formation, which was dominated by superoxide
adducts. Hydrogen peroxide formation was also increased at lower pH levels
for all SOAs.
The introduction of Fe2+ to SOA generated by photooxidation
of isoprene, α-terpineol, and toluene increased ROS formation in both
water and synthetic lung ELF. However, there were some differences in the
radical species that would be attributable to the presence of ascorbate in
the synthetic lung ELF. Isoprene- and α-terpineol-generated SOA
dramatically increased hydroxyl radical adduct formation in water and
carbon-centered radical adduct formation in synthetic lung ELF. Radical
formation peaked at a reaction time of 20 and 60 minutes for water and
synthetic lung ELF, respectively. DTT activity was also higher with the
introduction of Fe2+ to SOAs, demonstrating a link between
aqueous experimental measures of oxidative potential and ROS formation.
Overall, chemical ROS formation from SOA was highly complex and heavily
dependent on the precursor, oxidation method, and experimental
conditions.
ROS FORMATION BY AMBIENT PM SAMPLES
The investigators found that the quantity and composition of ROS formed by
ambient PM varied by sampling site in the Los Angeles region, with marked
differences between wildfire and nonwildfire samples. ROS formed per air
volume were highest in highway and lowest in wildfire samples, and the ROS
formed per mass were higher in urban compared with wildfire samples. The
total radicals associated with different PM size fractions showed a bimodal
distribution for wildfire samples (radical concentrations peaked at
0.056–0.18 and 10–18 μm PM size fractions) and urban
samples (radical concentration peaked at 0.56–1 and 10–18
μm PM size fractions), whereas highway samples exhibited a total
radical peak in the 0.56–1 μm PM size range. On average, PM
from urban and highway sampling sites formed primarily hydroxyl radicals
(>84%) with the remaining proportion being carbon-centered radicals for both
PM1 and PM1-10 extracts. Wildfire samples formed
mostly carbon-centered radicals (~50%). PM1 extracts
formed 28% hydroxyl, 13% superoxide, and 5% oxygen-centered radicals,
whereas PM1-10 extracts formed 49% hydroxyl and 2% superoxide
radicals. Carbon-centered radical formation was correlated with
oxygen-centered radical formation (R2 = 0.53),
whereas hydroxyl radical formation was correlated with superoxide formation
(R2 = 0.50), suggesting distinct chemical
formation pathways.
Oxidative potential was highest in highway samples. Oxidative potential
measurements at different PM size fractions were similar for the highway and
urban sites and peaked at the 0.56-1 μm PM size fraction. After
normalization, oxidative potential was higher per volume in
PM1-10 compared with PM1 extracts and was
correlated with total ROS formation (R2 = 0.61).
In contrast, for wildfire samples the oxidative potential measurements were
similar across the different PM sizes, but after normalization the
measurements were higher per volume and per mass in the PM1
extracts and did not correlate with total ROS formation
(R2 < 0.01).
ROS FORMATION IN THE ELF
Modeling results indicated that ROS formation in the human respiratory tract
depended on the size composition of PM exposure and on ELF volume and
particle deposition in the different respiratory tract regions. ROS
formation was highest in the extrathoracic region and lowest in the alveolar
region. The investigators noted that assuming a uniform particle
distribution in the respiratory tract would underestimate ROS formation in
the extrathoracic cavity and overestimate it in the bronchial and alveolar
regions. The estimated formation of hydrogen peroxide was highest, and
hydroxyl radical was lowest in ELF. ROS formation was higher for the
roadside PM compared with urban ambient PM samples from Atlanta. In terms of
specific chemical exposure, the modeled ROS formation was highest for
copper, followed by iron; it was an order of magnitude lower for SOAs and
lowest for quinones. Copper exposure was estimated to form mostly hydrogen
peroxide and superoxide, whereas SOAs primarily formed hydroxyl radicals.
The investigators noted that assuming a uniform particle distribution in the
respiratory tract would misrepresent ROS formation by iron in the
extrathoracic versus alveolar regions. The modeled formation of hydrogen
peroxide and superoxide showed moderate to high correlations with the
measured oxidative potential, demonstrating good agreement between the two
methods, whereas the modeled formation of the hydroxyl radical had low
correlation with measured oxidative potential.
CHEMICAL VERSUS CELLULAR ROS FORMATION IN THE SYNTHETIC ELF
Shiraiwa and colleagues found that quinones and isoprene-generated SOA
activated macrophage cells to release higher concentrations of superoxide
than what was formed through chemical reactions in the synthetic lung ELF.
Superoxide formation depended on the concentration of SOA precursor and
duration of the exposure. At low concentrations, cellular formation of
superoxide was about 10 times higher than chemical formation, particularly
at the beginning of the experiments. The threshold dose for macrophage
activation was smaller for quinones than for isoprene. The investigators
reported that the decreased superoxide formation by macrophages over longer
exposure times was due to the activation of antioxidant processes, oxidative
stress, and cell death. The chemical superoxide production modeled by the
investigators was similar to the experimental results, providing reassurance
that the kinetic modeling approach accurately captured the processes.
HEI REVIEW COMMITTEE’S EVALUATION
This study investigated the potential kinetics and chemical mechanisms of ROS
formation in the ELF of the respiratory tract following inhalation of different
aerosols. It also quantified the relative importance of ROS formed by chemical
reactions in the ELF compared with ROS released by macrophages as an immune
response to aerosol exposure. Dr. Shiraiwa and colleagues demonstrated that
quantity and composition of ROS formed by aqueous reactions highly dependent on
such factors as the specific aerosol mixture, oxidation mechanisms, and other
environmental conditions. They also found that for certain exposure conditions,
the ROS released by macrophages dwarfed the ROS formation by aqueous chemical
reactions.
In its independent evaluation of the report, the Review Committee noted that the
investigators made a valuable contribution to the study of the health effects of
air pollution mediated through ROS, bridging the fields of chemistry and
toxicology. They thought that the work comparing chemical versus cellular ROS
formation was novel, and they appreciated the inclusion of ambient aerosol
samples from field measurements in addition to the lab-generated aerosols. The
results showing higher ROS yields from macrophages compared with yields from
aqueous chemical reactions were considered particularly important.
EVALUATION OF THE METHODOLOGICAL APPROACH
The Committee appreciated several aspects of the methodological approach,
including the use of both ambient aerosol samples and laboratory-generated
SOA, testing the influence of various experimental factors, such as
copollutants and pH, and combining both experimental and modeling efforts.
They also noted that the use of probes specific to different ROS was
superior to other nonspecific methods. However, they thought that it was
difficult to translate the results of the experiments to real-world
conditions in the human lung after inhalation of ambient pollutants and that
the full implications of the results were therefore difficult to determine.
Thus, the Committee thought that this work should be considered a valuable
initial foray, with considerably more research needed.
It was unclear how well some aspects of the laboratory methods relate to more
complex biological systems. The current results advance our mechanistic
understanding of substrate influence on radical yields. However, given that
results are obtained in a synthetic ELF, the question remains open as to
whether they are representative of in vivo outcomes. Although the macrophage
cell line used in this study is frequently used in other in vitro toxicity
assays and is a useful starting point, it is derived from a leukemia
virus-induced mouse tumor. As such, it is not part of immune defense in the
respiratory system and does not mimic macrophage behavior in lung tissues
well. An immortalized alveolar macrophage cell line that is more responsive
to soluble and particulate stimuli would have been more representative of an
immune response to inhaled aerosols. It will be important for future work to
repeat the experiments using lung-derived macrophage cell lines or primary
cells. It would also be useful to examine ROS formation by other key immune
system players, such as neutrophils, whose influx to the lung is associated
with many respiratory conditions, and to consider the use of co-cultures in
which two or more types of lung cell coexist and interact with each
other.
Regarding the aerosol generation, the Committee questioned the concentrations
of the laboratory-generated SOAs because the experiments used higher SOA
precursor concentrations than would be observed in the ambient atmosphere,
thereby possibly affecting the interpretation of the results. The
investigators acknowledge this difference and note similarities in SOA yield
and average oxidation state compared with SOAs formed under more realistic
conditions but note that important differences would be expected in the
molecular composition of the SOA formed. Future work could shed light on
this issue by generating SOA with different equipment. Furthermore, the
investigators evaluated only a few ambient air samples that were taken at
various times from three locations in Los Angeles. Thus, it is unclear how
representative the ROS formation results are from SOA generated by the
ambient air samples. The report could have been improved by further
discussion of how representative these samples were to aerosol mixtures in
other locations in the region, the broader United States, or around the
world.
The Committee appreciated the investigators’ efforts to evaluate ROS
formation using both species-specific probes and oxidative potential by the
DTT assay but noted that a more comprehensive evaluation would enhance
future work to better align with the overarching goal to elucidate aerosol
lung toxicity mediated through ROS. The investigators acknowledged that only
a few ROS were quantified within a chemical reaction time range limited by
feasibility. Thus, important ROS formation could have been missed. Other
important nonradical forms of ROS, such as singlet oxygen, might also play
an important role in aerosol-induced health effects. In addition, there is
no consensus on which assays are most suitable to measure ROS, because none
of the assays currently available show good correlations of redox potential
with PM toxicity (Pietrogrande et al. 2022). Although the DTT assay is simple and
commonly used, it provides limited insight in this context. Other assays
such as dichloro-dihydro-fluorescein diacetate are currently preferred for
studying ROS formation in cells.
Lastly, the Committee thought that the kinetic modeling, particularly with
ROS formation in different compartments of the respiratory tract, was well
done and demonstrated that the approach was possible. However, as with any
modeling efforts, the results hinge on the model inputs, which can change
under various realistic conditions. Thus, the results should be interpreted
cautiously. Further work in this area might help in efforts to improve our
understanding of ROS formation under various conditions and other pathways
to mitigate respiratory toxicity. As noted in the report, Dr. Shiraiwa and
colleagues later applied their kinetic model to estimate ROS as a metric of
exposure to metal components in PM in epidemiological studies and found
associations with respiratory and cardiovascular diseases. The Committee did
not review the methods and results of these epidemiological collaborations
because it was outside the scope of the current report, but they thought
that it was a novel and useful approach to exposure assessment.
DISCUSSION OF THE FINDINGS AND INTERPRETATION
A key strength of this study is that it quantified the relative importance of
ROS formation by chemical reactions in the ELF compared with the ROS
released by activated macrophages. The investigators found that under
certain experimental conditions, the ROS macrophage release far outweighed
the ROS formed by chemical reactions. This result implies that
aerosol-induced respiratory health effects mediated by ROS might not depend
on the aerosol composition and associated chemical reactions alone. Instead,
future work will also need to consider macrophage and other immune cell
activation after aerosol exposure.
In this study, only laboratory-generated SOAs were used to evaluate chemical
versus macrophage ROS yields. Future work is warranted to evaluate chemical
versus biological yields from real-world aerosol samples. It would also be
helpful in future work to use robust negative-control scenarios, for
example, by varying the experimental timeframes and by using nonchemical
stimuli, such as roughness of the culture surface, and to test a variety of
relevant macrophage cell lines and other immune cells, such as neutrophils,
as multiple types of cells can be recruited to the respiratory system as
part of the immune response.
The investigators reported that ambient PM samples from the two highway
traffic locations had higher ROS yields compared with samples from an urban
site before and during nearby wildfire events. These results are intriguing
and are consistent with a study showing that nontailpipe roadway PM might be
more toxic than PM from other sources (Shirmohammadi et al. 2016). The potential for
higher toxicity in nontailpipe PM is thought to be due to the synergistic
effects of redox-active metals and organics on ROS formation. This theory is
also consistent with results in this study showing that laboratory-generated
SOAs act synergistically with Fe2+ to elicit substantially
higher ROS formation. However, it is important to note that only a few
ambient samples were collected from just three locations in this study.
Thus, the results comparing roadside, urban, and wildfire samples remain
preliminary and must be verified in future studies with much larger sets of
samples. Wildfire smoke has high compositional variability (Jaffe et al.
2020), and the limited
sampling cannot be generalized to other wildfires.
CONCLUSIONS
This study aimed to identify the kinetics and chemical mechanisms of ROS
formation in the ELF of the respiratory tract after aerosol exposure and to
quantify the relative importance of ROS formed by aqueous chemical reactions
in the ELF compared with ROS released by macrophages as an immune response
to aerosol exposure. The investigators tested ROS formation under several
different experimental scenarios and used both laboratory-generated and
ambient air-sampled SOAs. Overall, the Review Committee commended Dr.
Shiraiwa and colleagues for the novelty and thoughtfulness in the study
approach. The study demonstrated that the quantity and composition of ROS
formed by aqueous reactions is highly dependent on such factors as the
specific aerosol mixture, oxidation mechanisms, and other environmental
conditions. Kinetic modeling suggested that ROS formation in the respiratory
tract is highest in the extrathoracic cavity and lowest in the alveolar
region. The study also found that under certain experimental conditions, ROS
released by macrophages outweighs ROS formed by chemical reactions in ELF.
This work is an important first step in understanding the relative
importance of chemical versus biological ROS formation in the lung. Further
work is recommended by extending the use of PM samples from various ambient
sources and including an evaluation of responses in other types of immune
cells.
ACKNOWLEDGMENTS
The HEI Review Committee is grateful to Annemoon van Erp for oversight of the
study; to Eva Tanner for assistance with review of the report and in preparing
its Commentary; to Carol Moyer for editing of this Report and its Commentary;
and to Hope Green and Kristin Eckles for their roles in preparing this Research
Report for publication.
Footnotes
* A list of abbreviations and other terms appears at the end of
this volume.
REFERENCES
Brauer M, Brook JR, Christidis T, Chu Y, Crouse DL, Erickson A. 2019.
Mortality–Air Pollution Associations in
Low-Exposure Environments (MAPLE): Phase 1. Research Report
202. Boston,
MA:Health Effects
Institute. [PMC free article] [PubMed] [Google Scholar]
Brauer M, Brook JR, Christidis T, Chu Y, Crouse DL, Erickson A, et al. 2022.
Mortality–Air Pollution Associations in Low
Exposure Environments (MAPLE): Phase 2. Research Report
212. Boston,
MA:Health Effects
Institute. [PMC free article] [PubMed] [Google Scholar]
Brunekreef B, Strak M, Chen J, Andersen ZJ, Atkinson RW, Bauwelinck M. 2021. Mortality and
Morbidity Effects of Long-Term Exposure to Low-Level PM2.5,
BC, NO2, and O3: An Analysis of European Cohorts
in the ELAPSE Project. Research Report 208.
Boston, MA:Health Effects
Institute. [PMC free article] [PubMed] [Google Scholar]
Canton M, Sánchez-Rodríguez R, Spera I, Venegas FC, Favia M, Viola A, et al. 2021.
Reactive oxygen species in macrophages: Sources and
targets. Front Immunol
12:734229;
doi:10.3389/fimmu.2021.734229.
[DOI] [PMC free article] [PubMed] [Google Scholar]
Chen J, Hoek G. 2020. Long-term
exposure to PM and all-cause and cause-specific mortality: A systematic
review and meta-analysis. Environ Int
143:105974; doi:10.1016/j.
envint.2020.105974.
[DOI] [PubMed] [Google Scholar]
Dominici F, Schwartz J, Qian D, Braun D, Choirat C, Zanobetti A. 2019. Assessing
Adverse Health Effects of Long-Term Exposure to Low Levels of Ambient
Air Pollution: Phase 1. Research Report 200.
Boston, MA:Health Effects
Institute. [PMC free article] [PubMed] [Google Scholar]
Dominici F, Zanobetti A, Schwartz J, Braun D, Sabath B, Wu X. 2022. Assessing
Adverse Health Effects of Long-Term Exposure to Low Levels of Ambient
Air Pollution: Implementation of Causal Inference Methods. Research
Report 211. Boston,
MA:Health Effects
Institute. [PMC free article] [PubMed] [Google Scholar]
Fang T, Guo H, Zeng L, Verma V, Nenes A, Weber RJ. 2017. Highly acidic
ambient particles, soluble metals, and oxidative potential: A link
between sulfate and aerosol toxicity. Environ
Sci Technol
51:2611–2620;
doi:10.1021/acs.est.6b06151.
[DOI] [PubMed] [Google Scholar]
Global Burden of Disease
(GBD) 2019 Risk Factors Collaborators. 2020.
Global burden of 87 risk factors in 204 countries and
territories, 1990–2019: A systematic analysis for the Global
Burden of Disease Study 2019. Lancet
396:1223–1249;
doi:10.1016/S0140-6736(20)30752-2.
[DOI] [PMC free article] [PubMed] [Google Scholar]
Gurgueira SA, Lawrence J, Coull B, Murthy GG, González-Flecha B. 2002. Rapid
increases in the steady-state concentration of reactive oxygen species
in the lungs and heart after particulate air pollution
inhalation. Environ Health Perspect
110:749–55. [DOI] [PMC free article] [PubMed] [Google Scholar]
International Agency for
Research and Cancer (IARC). 2016.
Outdoor air pollution.
In:
Monograph on the evaluation of carcinogenic risks to
humans. Vol. 109. Lyon,
France:IARC. [Google Scholar]
Jaffe DA, O’Neill SM, Larkin NK, Holder AL, Peterson DL, Halofsky JE, et al. 2020.
Wildfire and prescribed burning impacts on air quality in
the United States. J Air Waste Manag
Assoc
70:583–615;
doi:10.1080/10962247.2020.1749731.
[DOI] [PMC free article] [PubMed] [Google Scholar]
Jia C, Batterman S. 2010. A critical
review of naphthalene sources and exposures relevant to indoor and
outdoor air. Int J Environ Res Public
Health
7:2903–2939;
doi:10.3390/ ijerph7072903.
[DOI] [PMC free article] [PubMed] [Google Scholar]
Lakey PSJ, Berkemeier T, Tong H, Arangio AM, Lucas K, Pöschl U, et al. 2016.
Chemical exposure-response relationship between air
pollutants and reactive oxygen species in the human respiratory
tract. Sci Rep
6:32916; doi:10.1038/
srep32916.
[DOI] [PMC free article] [PubMed] [Google Scholar]
Li T, Yu Y, Sun Z, Duan J. 2022. A
comprehensive understanding of ambient particulate matter and its
components on the adverse health effects based from epidemiological and
laboratory evidence. Part Fibre Toxicol
19:67; doi:10.1186/
s12989-022-00507-5.
[DOI] [PMC free article] [PubMed] [Google Scholar]
Pietrogrande MC, Demaria G, Colombi C, Cuccia E, Dal Santo U. 2022. Seasonal and
Spatial variations of PM10 and PM2.5 Oxidative
Potential in Five Urban and Rural Sites across Lombardia Region,
Italy. IJERPH
19:7778; doi:10.3390/
ijerph19137778.
[DOI] [PMC free article] [PubMed] [Google Scholar]
Pizzino G, Irrera N, Cucinotta M, Pallio G, Mannino F, Arcoraci V, et al. 2017.
Oxidative stress: Harms and benefits for human
health. Oxid Med Cell Longev
2017:1–13;
doi:10.1155/2017/8416763. [DOI] [PMC free article] [PubMed] [Google Scholar]
Pöschl U, Shiraiwa M. 2015. Multiphase
chemistry at the atmosphere–biosphere interface influencing
climate and public health in the Anthropocene.
Chem Rev
115:4440–4475;
doi:10.1021/cr500487s.
[DOI] [PubMed] [Google Scholar]
Shirmohammadi F, Hasheminassab S, Wang D, Schauer JJ, Shafer MM, Delfino RJ, et al. 2016. The
relative importance of tailpipe and non-tailpipe emissions on the
oxidative potential of ambient particles in Los Angeles,
CA. Faraday Discuss
189:361–380;
doi:10.1039/C5FD00166H.
[DOI] [PMC free article] [PubMed] [Google Scholar]
Shrivastava M, Cappa CD, Fan J, Goldstein AH, Guenther AB, Jimenez JL, et al. 2017. Recent
advances in understanding secondary organic aerosol: Implications for
global climate forcing. Rev Geophys
55:509–559;
doi:10.1002/2016RG000540. [Google Scholar]
United States Environmental
Protection Agency (U.S. EPA)
2019. Integrated Science Assessment for
Particulate Matter. Washington,
DC:U.S.
EPA. [PubMed] [Google Scholar]
United States Environmental
Protection Agency (U.S. EPA). 2023.
Public Hearing for the Reconsideration of the National
Ambient Air Quality Standards for Particulate Matter.
Federal Register
88:6215–6217.
Washington, DC:U.S.
EPA. [Google Scholar]


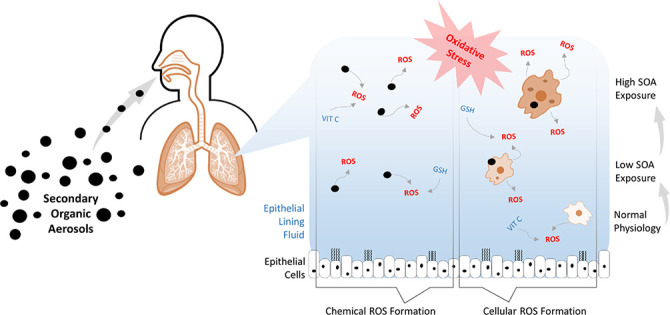

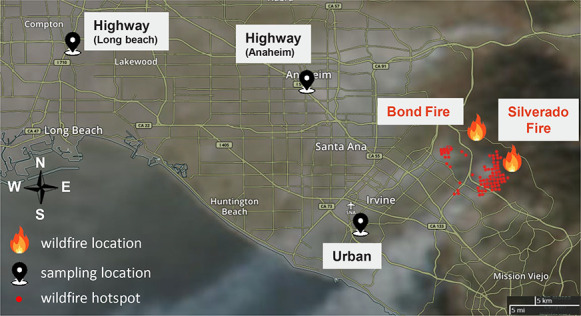


 is the
concentration of species i (molecules cm-3)
in particle size bin j that deposited in the ELF in
respiratory compartment k;
is the
concentration of species i (molecules cm-3)
in particle size bin j that deposited in the ELF in
respiratory compartment k;  is the
ambient concentration (g m-3) of chemical species
i;
is the
ambient concentration (g m-3) of chemical species
i;  is the
deposition efficiency; F is the breathing flow rate of
1.5 m3 hr-1 and t is the
accumulation time of 1.5 hours (accumulation time chosen based on the
range of time for particles to be removed by the immune system and
metabolic activities [Ghio et al.
is the
deposition efficiency; F is the breathing flow rate of
1.5 m3 hr-1 and t is the
accumulation time of 1.5 hours (accumulation time chosen based on the
range of time for particles to be removed by the immune system and
metabolic activities [Ghio et al.  is then
summed up for all size ranges to obtain the total concentration of
species i in the ELF in compartment k,
denoted as
is then
summed up for all size ranges to obtain the total concentration of
species i in the ELF in compartment k,
denoted as  .
.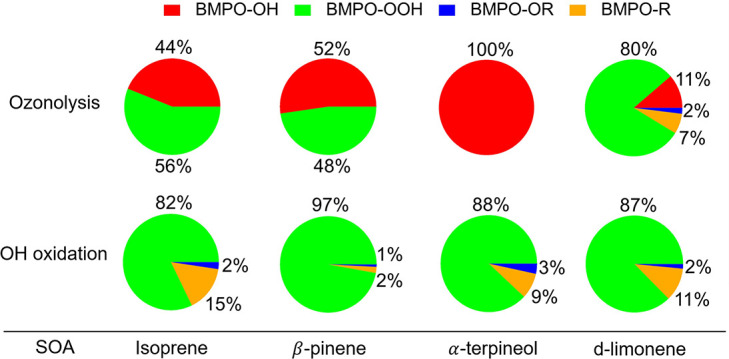
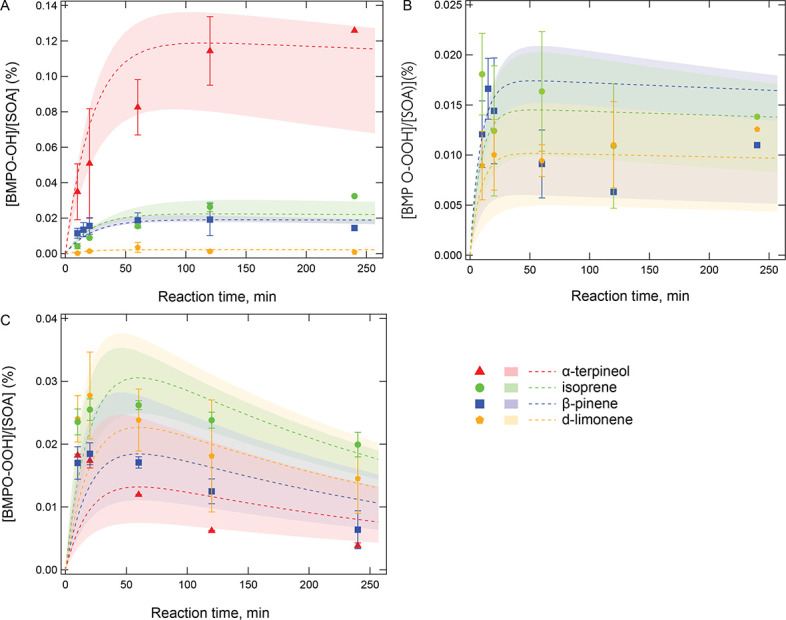
 c1
R1R2C(O2)OH·
c1
R1R2C(O2)OH·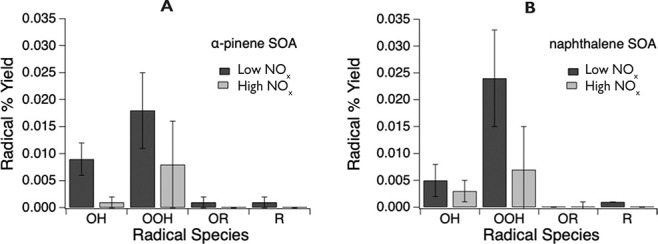
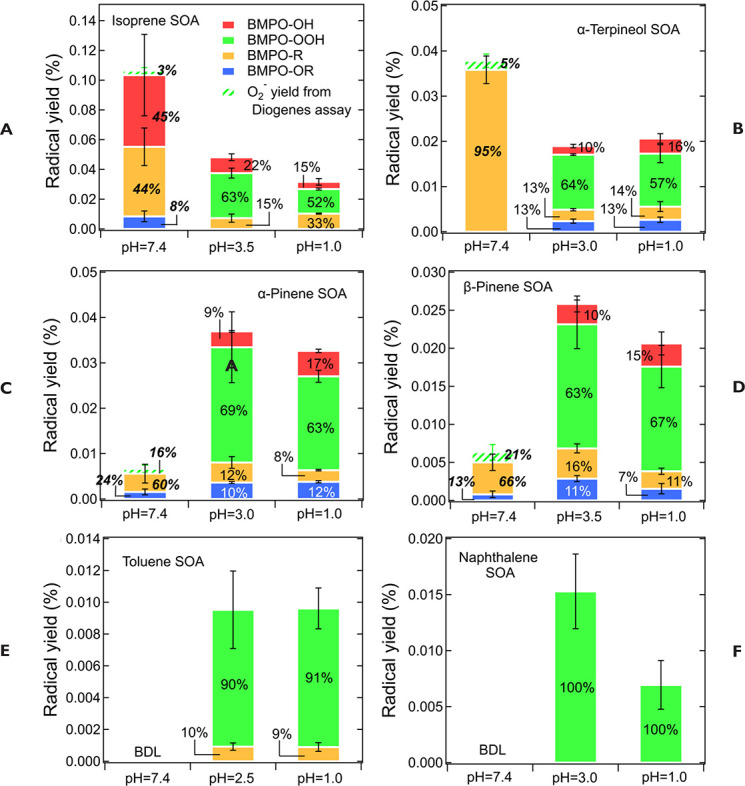

 c1
R1R2C(O2)OH·
c1
R1R2C(O2)OH·