Abstract
Certain genetic alterations and right-sided primary tumor location are associated with resistance to anti-epidermal growth factor (EGFR) treatment in metastatic colorectal cancer (mCRC). The phase 3 PARADIGM trial (n = 802) demonstrated longer overall survival with first-line anti-EGFR (panitumumab) versus antivascular endothelial growth factor (bevacizumab) plus modified FOLFOX6 in patients with RAS wild-type mCRC with left-sided primary tumors. This prespecified exploratory biomarker analysis of PARADIGM (n = 733) evaluated the association between circulating tumor DNA (ctDNA) gene alterations and efficacy outcomes, focusing on a broad panel of gene alterations associated with resistance to EGFR inhibition, including KRAS, NRAS, PTEN and extracellular domain EGFR mutations, HER2 and MET amplifications, and ALK, RET and NTRK1 fusions. Overall survival was prolonged with panitumumab plus modified FOLFOX6 versus bevacizumab plus modified FOLFOX6 in patients with ctDNA that lacked gene alterations in the panel (that is, negative hyperselected; median in the overall population: 40.7 versus 34.4 months; hazard ratio, 0.76; 95% confidence interval, 0.62–0.92) but was similar or inferior with panitumumab in patients with ctDNA that contained any gene alteration in the panel (19.2 versus 22.2 months; hazard ratio, 1.13; 95% confidence interval, 0.83–1.53), regardless of tumor sidedness. Negative hyperselection using ctDNA may guide optimal treatment selection in patients with mCRC. ClinicalTrials.gov registrations: NCT02394834 and NCT02394795.
Subject terms: Prognostic markers, Cancer genetics
In an exploratory preplanned biomarker analysis of the phase 3 PARADIGM trial, a lack of resistance gene alterations in baseline circulating tumor DNA (negative hyperselection) was associated with prolonged overall survival after first-line panitumumab with chemotherapy in patients with RAS wild-type metastatic colorectal cancer.
Main
For patients with unresectable RAS wild-type (WT) recurrent or metastatic colorectal cancer (mCRC), standard first-line treatment includes chemotherapy combined with either an anti-epidermal growth factor receptor (EGFR) monoclonal antibody (for example, panitumumab or cetuximab) or an antivascular endothelial growth factor (VEGF) antibody (bevacizumab)1–3. The phase 3 PARADIGM trial (NCT02394795) in patients with unresectable RAS WT mCRC demonstrated longer overall survival (OS) with first-line panitumumab plus modified 5-fluorouracil, l-leucovorin, oxaliplatin (mFOLFOX6) versus bevacizumab plus mFOLFOX6 in patients with left-sided primary tumors (that is, tumors originating from the descending colon, sigmoid colon, rectosigmoid and rectum; median OS: 37.9 versus 34.3 months, respectively; hazard ratio (HR), 0.82; P = 0.03) and in the overall patient population (36.2 versus 31.3 months; HR, 0.84; P = 0.03)4. Exploratory analyses showed poorer survival (20.2–23.2 months) in patients with tumors originating from the right side of the colorectum4. These results support panitumumab plus mFOLFOX6 as a preferred treatment option for patients with RAS WT and left-sided primary mCRC.
Differences in outcomes with anti-EGFR treatment in mCRC may be attributed to tumor genomic and molecular profiles associated with primary resistance to EGFR inhibition, such as the BRAF V600E mutation and high microsatellite instability (MSI-H), among others5–7. Based on 2022 guidelines from the American Society of Clinical Oncology, the decision to initiate anti-EGFR treatment should be guided by the primary tumor location and testing for BRAF and RAS (KRAS and NRAS) mutations and deficient mismatch repair or MSI2. Several other less common molecular alterations have been linked to primary resistance to EGFR inhibitors, including mutations in PTEN and EGFR extracellular domain (ECD), amplifications of HER2 and MET, and fusions of ALK, RET and NTRK1 (refs. 8–13). Whereas individual molecular markers have guided drug development and improved patient selection for many targeted therapies, testing for a combination of multiple molecular markers has the potential to guide more precise therapy selection for patients with mCRC14.
To allow for molecular negative hyperselection of patients most likely to benefit from anti-EGFR treatment, previous studies have worked towards establishing a testing panel that includes a broad array of rare genomic alterations linked to primary resistance to EGFR inhibition15–18. These studies demonstrated that detection of any of the panel-prespecified genetic alterations in tumor biopsy samples, as well as primary tumor sidedness, were predictive of clinical outcomes on anti-EGFR therapy15–18. Genotyping of tumors based on testing of circulating tumor DNA (ctDNA) released from cancer cells into the plasma (that is, liquid biopsy) is a minimally invasive alternative to tissue biopsy that may be particularly advantageous for identifying patients with mCRC who may benefit from anti-EGFR therapy19–21. In this prespecified exploratory biomarker analysis of the phase 3 PARADIGM trial (NCT02394834), we tested ctDNA in baseline plasma samples from more than 700 patients with RAS WT mCRC to investigate the utility of ctDNA-based negative hyperselection for predicting treatment outcomes with mFOLFOX6 combined with either panitumumab or bevacizumab.
Results
Patients
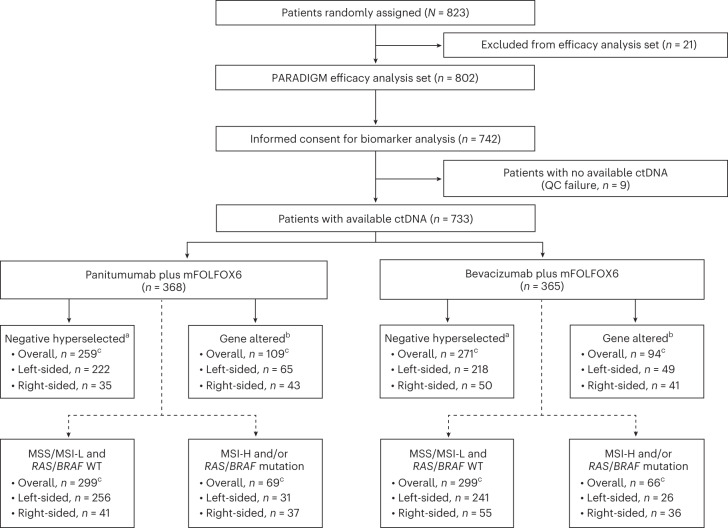
Of the 802 patients with RAS WT mCRC included in the PARADIGM efficacy analysis population, 733 patients (91.4%) provided informed consent for this biomarker study and had baseline blood plasma samples that were evaluable for ctDNA (Fig. 1). Among these 733 patients, 554 patients (75.6%) had left-sided primary tumors, 169 (23.1%) had right-sided primary tumors, and 10 (1.4%) had multiple primary lesions in both the left and right sides. For the biomarker-evaluable population, median follow-up as of the data cutoff date (14 January 2022) was 61.4 months (95% confidence interval (CI), 60.5–62.9 months) in the panitumumab + mFOLFOX6 group and 60.5 months (95% CI, 59.5–62.9 months) in the bevacizumab + mFOLFOX6 group.
Fig. 1. Patient flow chart for analysis of gene alteration status.
a‘Negative hyperselected’ was defined as plasma ctDNA being negative for all prespecified gene alterations, including mutations in BRAF V600E, KRAS, PTEN, EGFR ECD exons 1–16 and NRAS, amplifications of HER2 and MET, and gene fusions of RET, NRTK1 and ALK. b‘Gene altered’ was defined as detection of any of the following in ctDNA: a mutation in BRAF V600E, KRAS, PTEN, EGFR ECD exons 1–16 and/or NRAS, amplification of HER2 and/or MET, and gene fusion of RET, NRTK1 and/or ALK. cSome patients had multiple primary lesions on both the left and right sides. The dotted line represents an additional exploratory analysis assessing genetic alterations of MSS/MSI status and RAS/BRAF mutations based on guideline recommendations. ECD, extracellular domain; QC, quality control.
Patient ctDNA was assessed for 90 mutations, 26 amplifications and 3 rearrangements in mCRC-related genes using a custom NGS-based panel (Methods). Maximum variant allele frequency is reported for all samples in Supplementary Table 1. We report results of a preplanned analysis for negative hyperselection, meaning plasma ctDNA was negative for all prespecified gene alterations associated with resistance to anti-EGFR antibody therapy15,17,22–24, including mutations in BRAF V600E, KRAS, NRAS, PTEN and EGFR ECD exons 1–16, amplifications of HER2 and MET, and gene fusions of RET, NRTK1 and ALK. A total of 530 patients (72.3%) met these negative hyperselection criteria (Table 1). Patients with left-sided primary tumors met negative hyperselection criteria at a higher rate (79.4%: 440 of 554 patients) than patients with right-sided primary tumors (50.3%: 85 of 169 patients).
Table 1.
Demographics and baseline characteristics by negative hyperselection status
| Overall (N = 733) | Negative hyperselecteda (n = 530) | Gene alteredb (n = 203) | ||||
|---|---|---|---|---|---|---|
| Panitumumab + mFOLFOX6 (n = 368) | Bevacizumab + mFOLFOX6 (n = 365) | Panitumumab + mFOLFOX6 (n = 259) | Bevacizumab + mFOLFOX6 (n = 271) | Panitumumab + mFOLFOX6 (n = 109) | Bevacizumab + mFOLFOX6 (n = 94) | |
| Age category | ||||||
| 20–64 years | 149 (40.5) | 152 (41.6) | 104 (40.2) | 116 (42.8) | 45 (41.3) | 36 (38.3) |
| 65–79 years | 219 (59.5) | 213 (58.4) | 155 (59.8) | 155 (57.2) | 64 (58.7) | 58 (61.7) |
| Sex | ||||||
| Female | 134 (36.4) | 120 (32.9) | 87 (33.6) | 83 (30.6) | 47 (43.1) | 37 (39.4) |
| Male | 234 (63.6) | 245 (67.1) | 172 (66.4) | 188 (69.4) | 62 (56.9) | 57 (60.6) |
| ECOG PS | ||||||
| 0 | 304 (82.6) | 288 (78.9) | 220 (84.9) | 213 (78.6) | 84 (77.1) | 75 (79.8) |
| 1 | 63 (17.1) | 77 (21.1) | 39 (15.1) | 58 (21.4) | 24 (22.0) | 19 (20.2) |
| Primary tumor locationc | ||||||
|
Left sided (n = 554) |
287 (78.0) | 267 (73.2) | 222 (85.7) | 218 (80.4) | 65 (59.6) | 49 (52.1) |
|
Right sidee (n = 169) |
78 (21.2) | 91 (24.9) | 35 (13.5) | 50 (18.5) | 43 (39.4) | 41 (43.6) |
| Number of metastatic organs | ||||||
| 1 | 181 (49.2) | 178 (48.8) | 141 (54.4) | 139 (51.3) | 40 (36.7) | 39 (41.5) |
| ≥2 | 187 (50.8) | 187 (51.2) | 118 (45.6) | 132 (48.7) | 69 (63.3) | 55 (58.5) |
| Metastatic site | ||||||
| Liver | 254 (69.0) | 248 (67.9) | 173 (66.8) | 182 (67.2) | 81 (74.3) | 66 (70.2) |
|
Liver only site of metastases |
96 (26.1) | 102 (27.9) | 73 (28.2) | 78 (28.8) | 23 (21.1) | 24 (25.5) |
| Previous primary tumor resection | 222 (60.3) | 244 (66.8) | 166 (64.1) | 184 (67.9) | 56 (51.4) | 60 (63.8) |
Data are presented as n (%).
a‘Negative hyperselected’ was defined as plasma ctDNA being negative for all prespecified gene alterations, including mutations in BRAF V600E, KRAS, PTEN, EGFR ECD exons 1–16, and NRAS, amplifications of HER2 and MET, and gene fusions of RET, NRTK1 and ALK.
b‘Gene altered’ was defined as detection of any of the following in ctDNA: a mutation in BRAF V600E, KRAS, PTEN, EGFR ECD exons 1–16 and/or NRAS, amplification of HER2 and/or MET, and gene fusion of RET, NRTK1 and/or ALK.
cSome patients had multiple primary lesions on both the left and right sides.
dPrimary tumors originating from the descending colon, sigmoid colon, rectosigmoid and rectum.
ePrimary tumors originating from the right side of the colon, defined as cecum, ascending colon or transverse colon.
ECOG, Eastern Cooperative Oncology Group; PS, performance status.
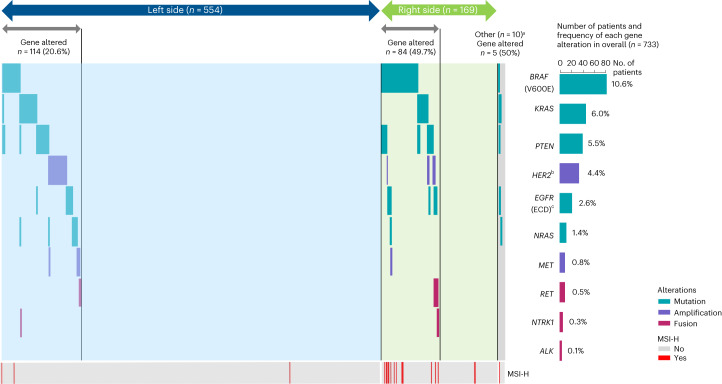
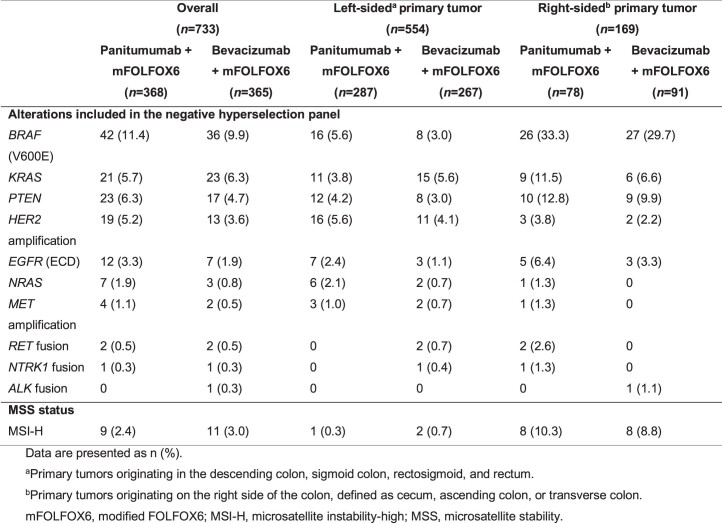
Among the 203 (27.7%) patients with at least one gene alteration, the most common alterations were BRAF V600E mutation (10.6%), KRAS mutation (6.0%) and PTEN mutation (5.5%) (Fig. 2). Most patients had only one mutation in the left-sided (93.0%; 106 of 114 patients), right-sided (73.8%; 62 of 84 patients) and overall populations (84.2%; 171 of 203 patients), with co-occurrence of multiple mutations most common in right-sided mCRC (Fig. 2). The frequency of gene alterations is summarized by primary tumor location and treatment group in Extended Data Table 1.
Fig. 2. Oncoprint showing the incidence and co-occurrence of genomic alterations.
aPatients who had multiple primary lesions on both the left and right sides. bThe custom panel (Tak_Seq3) has a 1.25 threshold for HER2 (thresholds were set based on noise in normal samples). cEGFR (ECD): exons 1–16 (1–620).
Extended Data Table 1.
Incidence of genetic alterations by tumor sidedness and treatment group
Outcomes by negative hyperselection status
Overall survival
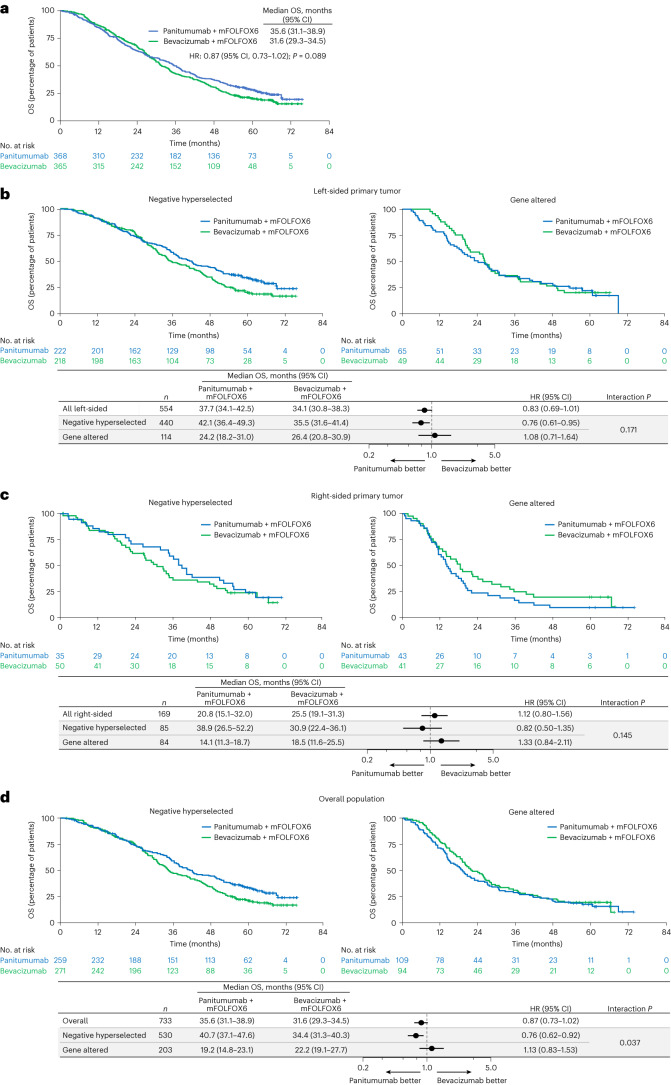
For the total biomarker-evaluable population, median OS was 35.6 months (95% CI, 31.1–38.9 months) with panitumumab + mFOLFOX6 and 31.6 months (95% CI, 29.3–34.5 months) with bevacizumab + mFOLFOX6 (HR for death stratified by age and presence of liver metastasis: 0.87; 95% CI, 0.73–1.02; Fig. 3a). For patients meeting negative hyperselection criteria (that is, no gene alteration detected), OS was longer with panitumumab versus bevacizumab in patients with left-sided primary tumors (median 42.1 versus 35.5 months; HR, 0.76; 95% CI, 0.61–0.95; P value for interaction between treatment group and negative hyperselection status = 0.171; Fig. 3b), and there was a trend for longer OS with panitumumab versus bevacizumab in patients with right-sided tumors (38.9 versus 30.9 months; HR, 0.82; 95% CI, 0.50–1.35; interaction P = 0.145; Fig. 3c). In the overall negative hyperselected population, median OS was longer with panitumumab versus bevacizumab (40.7 versus 34.4 months; HR, 0.76; 95% CI, 0.62–0.92; interaction P = 0.037; Fig. 3d).
Fig. 3. Overall survival in the biomarker-marker evaluable population overall and by negative hyperselection status.
a, Kaplan–Meier estimates of OS in the overall biomarker-evaluable population (all ctDNA-evaluable patients). b–d Kaplan–Meier estimates of OS by negative hyperselection status in patients with left-sided primary tumors (b), patients with right-sided primary tumors (c) and the overall population (all ctDNA-evaluable patients) (d). The forest plots below the Kaplan–Meier plots in b, c and d show HR ± 95% CI. A Cox proportional hazard model without stratification factors was used to calculate HRs for group comparisons and P values for the interaction between negative hyperselection status and treatment group. Statistical tests were two-sided without adjustment for multiple comparisons.
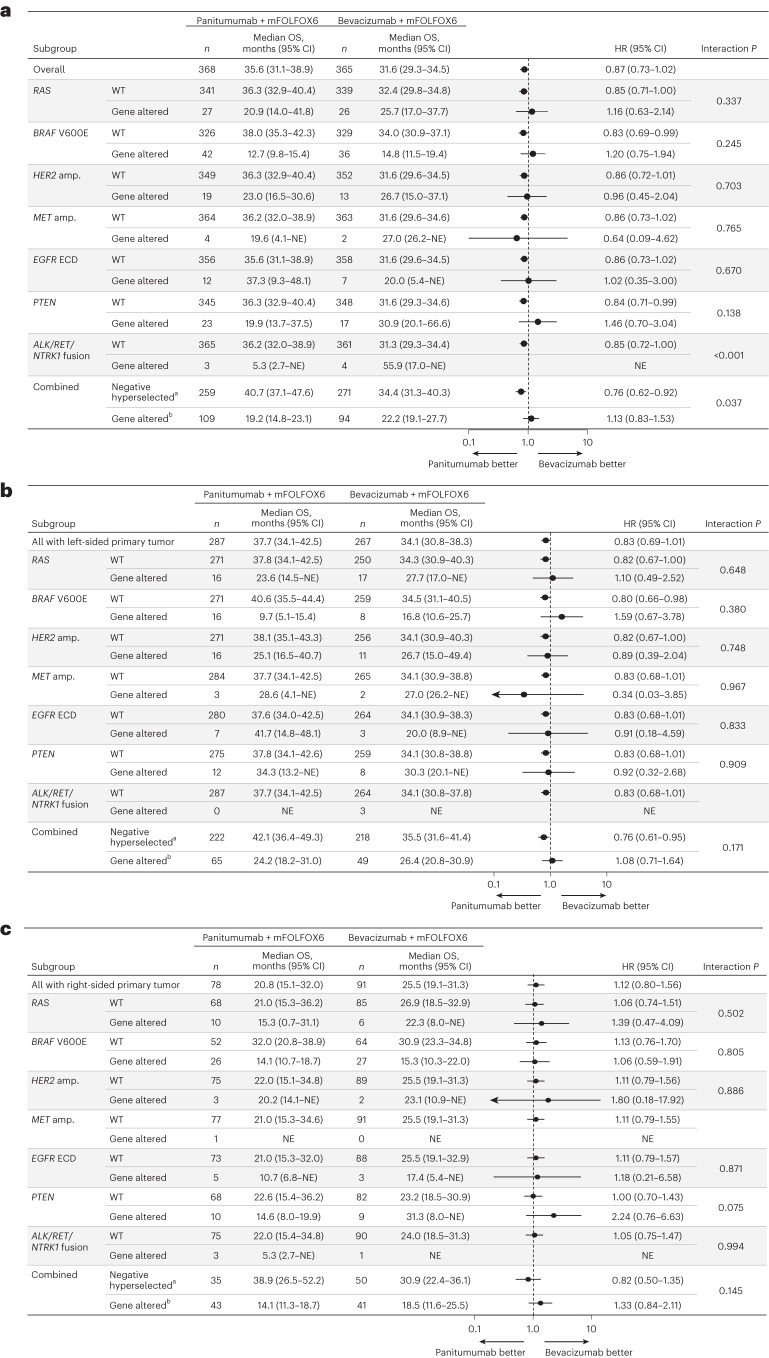
For patients with any gene alteration, median OS was similar or inferior with panitumumab versus bevacizumab regardless of primary tumor sidedness. Median OS with panitumumab versus bevacizumab in gene-altered patients was 24.2 versus 26.4 months in patients with left-sided primary tumors (HR, 1.08; 95% CI, 0.71–1.64; Fig. 3b), 14.1 versus 18.5 months in patients with right-sided primary tumors (HR, 1.33; 95% CI, 0.84–2.11; Fig. 3c) and 19.2 versus 22.2 months in the overall population (HR, 1.13; 95% CI, 0.83–1.53; Fig. 3d). Results of the subgroup analysis of OS by specific gene alterations are shown for the overall population in Fig. 4a, and for the left-sided and right-sided populations in Fig. 4b and 4c, respectively.
Fig. 4. Overall survival by specific gene alteration.
a–c, OS by specific gene alteration in the overall population (a), patients with left-sided primary tumors (b) and patients with right-sided primary tumors (c). Data plotted are HRs ± 95% CI. A Cox proportional hazard model without stratification factors was used to calculate HRs for group comparisons and P values for the interaction between negative hyperselection status and treatment group. Statistical tests were two-sided without adjustment for multiple comparisons. aNegative hyperselected patients were WT for all of the following: RAS, BRAF V600E, HER2 amp., MET amp., EGFR ECD, PTEN and ALK/RET/NTRK1 fusion. bGene-altered patients had at least one of the following alterations: RAS, BRAF V600E, HER2 amp., MET amp., EGFR ECD, PTEN or ALK/RET/NTRK1 fusion. amp., amplification; NE, not estimable.
Progression-free survival
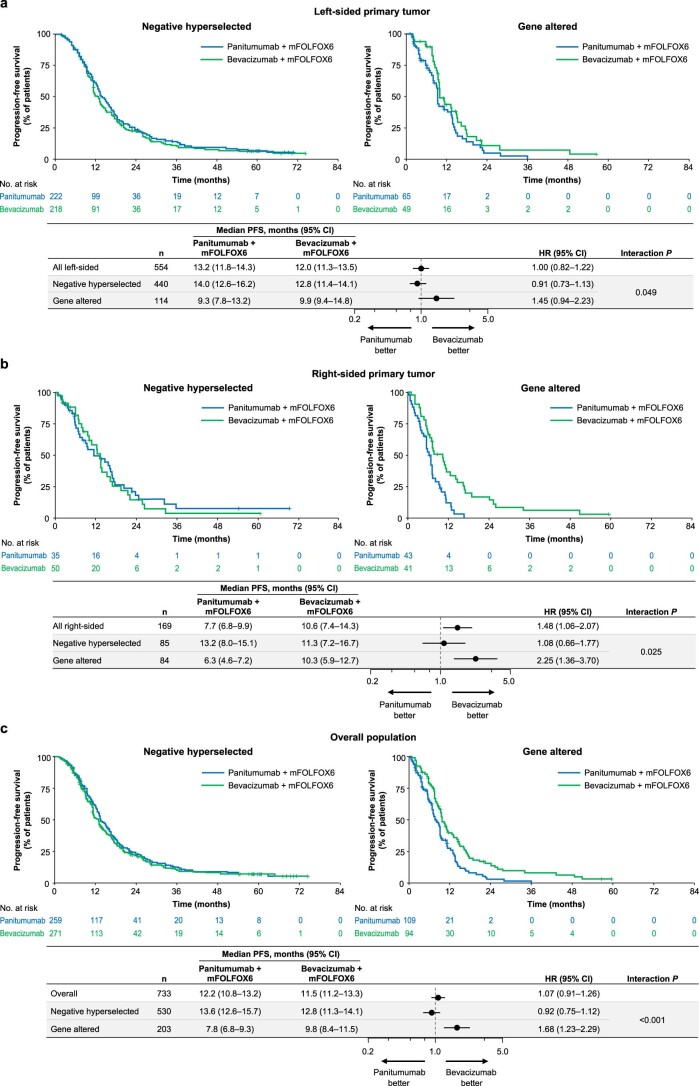
For negative hyperselected patients, progression-free survival (PFS) was similar with panitumumab + mFOLFOX6 versus bevacizumab + mFOLFOX6 in the left-sided (14.0 versus 12.8 months; HR, 0.91; 95% CI, 0.73–1.13; P value for interaction between treatment group and negative hyperselection status = 0.049), right-sided (13.2 versus 11.3 months; HR, 1.08; 95% CI, 0.66–1.77; interaction P = 0.025) and overall populations (median, 13.6 versus 12.8 months; HR, 0.92; 95% CI, 0.75–1.12; interaction P < 0.001; Extended Data Fig. 1). For patients with any gene alteration, median PFS was similar with panitumumab and bevacizumab in the left-sided population (9.3 versus 9.9 months; HR, 1.45; 95% CI, 0.94–2.23) but shorter with panitumumab than bevacizumab in the right-sided (6.3 versus 10.3 months; HR, 2.25; 95% CI, 1.36–3.70) and overall populations (7.8 versus 9.8 months; HR, 1.68; 95% CI, 1.23–2.29; Extended Data Fig. 1).
Extended Data Fig. 1. Progression-free survival (PFS) by negative hyperselection status.
Kaplan–Meier estimates of PFS in (a) patients with left-sided primary tumors, (b) patients with right-sided primary tumors and (c) the overall population (all ctDNA-evaluable patients). The forest plots below each Kaplan–Meier plot show the HR ± 95% CI. A Cox proportional hazard model without stratification factors was used to calculate HRs for group comparisons and P values for the interaction between negative hyperselection status and treatment group. Statistical tests were two-sided without adjustment for multiple comparisons. ctDNA, circulating tumor DNA; HR, hazard ratio; mFOLFOX6, modified FOLFOX6.
Response rate
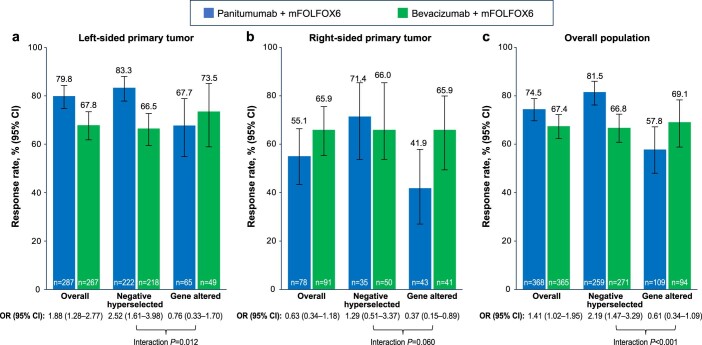
Among negative hyperselected patients, response rates were higher with panitumumab versus bevacizumab in the left-sided population (83.3% (95% CI, 77.8–88.0) versus 66.5% (95% CI, 59.8–72.7); odds ratio (OR), 2.52 (95% CI, 1.61–3.98); interaction P = 0.012), with a similar trend in the right-sided population (71.4% (95% CI, 53.7–85.4) versus 66.0% (95% CI, 51.2–78.8); OR, 1.29 (95% CI, 0.51–3.37); interaction P = 0.060; Extended Data Fig. 2), although the right-sided between-group difference was relatively small (+5.4%). In the overall negative hyperselected population, the response rate was higher with panitumumab (81.5% (95% CI, 76.2–86.0)) than with bevacizumab (66.8% (95% CI, 60.8–72.4)); OR, 2.19 (95% CI, 1.47–3.29); interaction P < 0.001). For patients with any gene alteration, the response rate was similar with panitumumab (67.7% (95% CI, 54.9–78.8)) versus bevacizumab (73.5% (95% CI, 58.9–85.1); OR, 0.76 (95% CI, 0.33–1.70)) in the left-sided population but lower with panitumumab (41.9% (95% CI, 27.0–57.9)) than bevacizumab (65.9% (95% CI, 49.4–79.9); OR, 0.37 (95% CI, 0.15–0.89)) in the right-sided population, with a similar trend in the overall gene-altered population (57.8% (95% CI, 48.0–67.2) versus 69.1% (95% CI, 58.8–78.3); OR, 0.61 (95% CI, 0.34–1.09); Extended Data Fig. 2).
Extended Data Fig. 2. Response rate by negative hyperselection status.
Response rates in (a) patients with left-sided primary tumors, (b) patients with right-sided primary tumors and (c) the overall population (all ctDNA-evaluable patients). Data plotted are percentages of patients with a response ± 95% CIs. ORs were calculated by logistic regression analysis. Statistical tests were two-sided without adjustment for multiple comparisons. ctDNA, circulating tumor DNA; mFOLFOX6, modified FOLFOX6; OR, odds ratio.
Depth of response
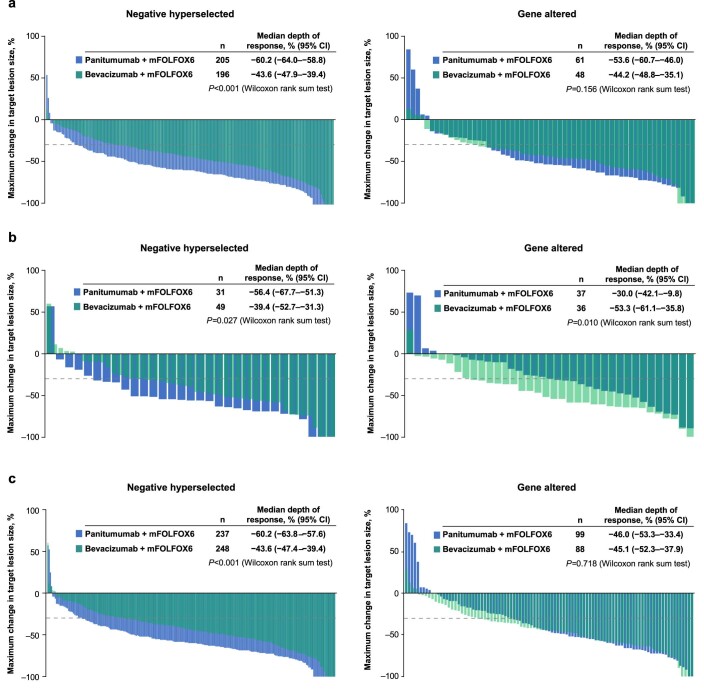
Median depth of response (maximum change in target lesion size) was greater with panitumumab versus bevacizumab among negative hyperselected patients with left-sided tumors (−60.2% (95% CI, −64.0 to −58.8) versus −43.6% (95% CI, −47.9 to −39.4)) and right-sided tumors (−56.4% (95% CI, −67.7 to −51.3) versus −39.4% (95% CI, −52.7 to −31.3)) and in the overall negative hyperselected population (−60.2% (95% CI, −63.8 to −57.6) versus −43.6% (95% CI, −47.4 to −39.4)). In gene-altered patients, depth of response was similar with panitumumab and bevacizumab in the left-sided (−53.6% (95% CI, −60.7 to −46.0) versus −44.2% (95% CI, −48.8 to −35.1)), right-sided (−30.0% (95% CI, −42.1 to −9.8) versus −53.3% (95% CI, −61.1 to −35.8)) and overall populations (−46.0% (95% CI, −53.3 to −33.4) versus −45.1% (95% CI, −52.3 to −37.9); Extended Data Fig. 3).
Extended Data Fig. 3. Depth of response by negative hyperselection status.
Best change in target lesion size in negative hyperselected and gene altered (a) patients with left-sided primary tumors, (b) patients with right-sided primary tumors and (c) overall population (all ctDNA-evaluable patients). P values were calculated using a Wilcoxon rank sum test. Statistical tests were two-sided without adjustment for multiple comparisons. ctDNA, circulating tumor DNA; mFOLFOX6, modified FOLFOX6.
Curative resection rate
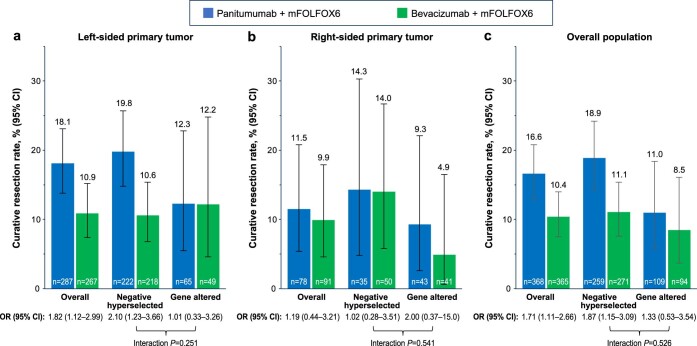
For negative hyperselected patients, the curative resection rate was higher with panitumumab versus bevacizumab in the left-sided population (19.8% (95% CI, 14.8–25.7) versus 10.6% (95% CI, 6.8–15.4); OR, 2.10 (95% CI, 1.23–3.66)) and similar between treatments in the right-sided population (14.3% (95% CI, 4.8–30.3) versus 14.0% (95% CI, 5.8–26.7); OR, 1.02 (95% CI, 0.28–3.51); Extended Data Fig. 4). In the overall negative hyperselected population, the curative resection rate was higher with panitumumab (18.9% (95% CI, 14.3–24.2)) than bevacizumab (11.1% (95% CI, 7.6–15.4); OR, 1.87 (95% CI, 1.15–3.09)). In patients with gene alterations, the curative resection rate was nearly identical with panitumumab and bevacizumab in the left-sided population (12.3% (95% CI, 5.5–22.8) versus 12.2% (95% CI, 4.6–24.8); OR, 1.01 (95% CI, 0.33–3.26)) but trended higher with panitumumab in the right-sided population (9.3% (95% CI, 2.6–22.1) versus 4.9% (95% CI, 0.6–16.5); OR, 2.00 (95% CI, 0.37–15.0); Extended Data Fig. 4). In the overall gene-altered population, the curative resection rate was 11.0% (95% CI, 5.8–18.4) with panitumumab and 8.5% (95% CI, 3.7–16.1) with bevacizumab (OR, 1.33 (95% CI, 0.53–3.54)).
Extended Data Fig. 4. Curative resection rates by negative hyperselection status.
Curative resection rates in (a) patients with left-sided primary tumors, (b) patients with right-sided primary tumors and (c) the overall population (all ctDNA-evaluable patients). Data plotted are percentages of patients with curative resection ± 95% CIs. ORs were calculated by logistic regression analysis. Statistical tests were two-sided without adjustment for multiple comparisons. ctDNA, circulating tumor DNA; mFOLFOX6, modified FOLFOX6; OR, odds ratio.
Outcomes by RAS/BRAF and microsatellite stability status
Current clinically adopted biomarkers (RAS/BRAF and microsatellite stable (MSS) status) in the first-line mCRC population were also explored. Among 733 ctDNA-evaluable patients, 598 patients (81.6%) were WT for RAS and BRAF and were MSS or had low microsatellite instability (MSI-L), including 497 (67.8%) with left-sided primary tumors and 96 (13.1%) with right-sided primary tumors (Fig. 1 and Supplementary Table 2). A total of 135 patients (18.4%) had BRAF V600E (78 patients (10.6%)) and/or RAS mutations (53 patients (7.2%)) and/or MSI-H (20 patients (2.7%)).
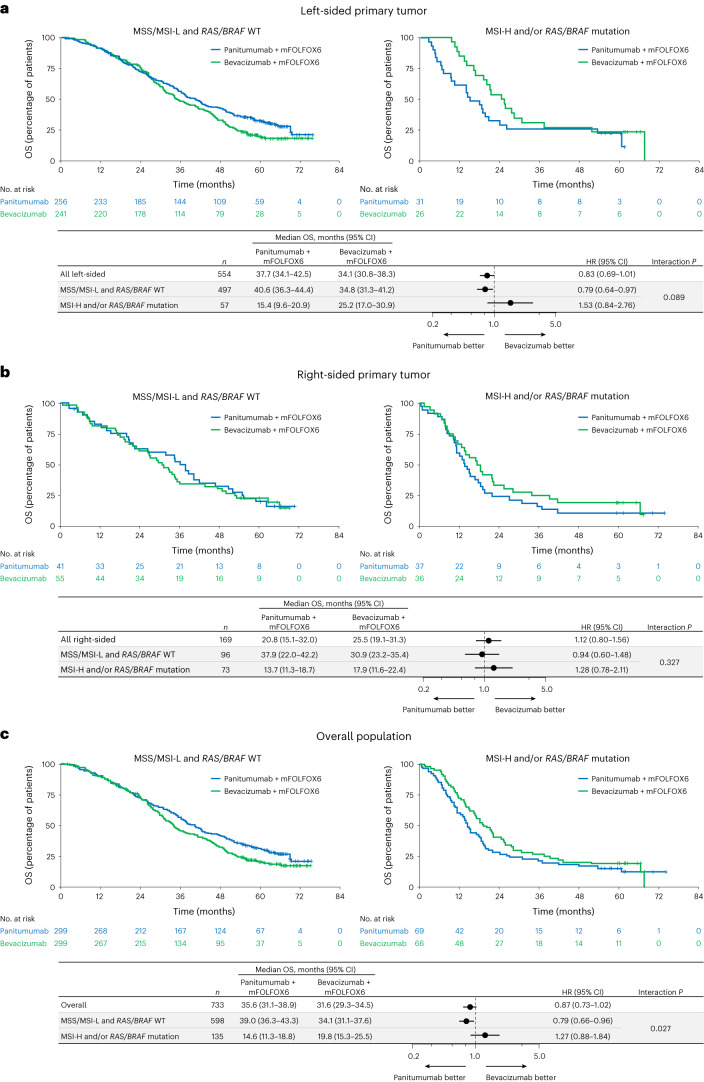
Median OS between panitumumab versus bevacizumab in patients with RAS/BRAF WT and MSS/MSI-L was 40.6 versus 34.8 months (HR, 0.79; 95% CI, 0.64–0.97; interaction P = 0.089; Fig. 5a) in the left-sided, 37.9 versus 30.9 months (HR, 0.94; 95% CI, 0.60–1.48; interaction P = 0.327; Fig. 5b) in the right-sided and 39.0 versus 34.1 months (HR, 0.79; 95% CI, 0.66–0.96; interaction P = 0.027; Fig. 5c) in the overall populations. For patients with RAS/BRAF mutation or MSI-H, median OS was inferior or similar with panitumumab versus bevacizumab in the left-sided (15.4 versus 25.2 months; HR, 1.53; 95% CI, 0.84–2.76; Fig. 5a), right-sided (13.7 versus 17.9 months; HR, 1.28; 95% CI, 0.78–2.11; Fig. 5b) and overall populations (14.6 versus 19.8 months; HR, 1.27; 95% CI, 0.88–1.84; Fig. 5c).
Fig. 5. Overall survival by RAS/BRAF and MSS status.
a–c, Kaplan–Meier estimates of OS in patients with left-sided primary tumors (a), patients with right-sided primary tumors (b) and the overall population (all ctDNA-evaluable patients) (c). The forest plots below each Kaplan–Meier plot show HR ± 95% CI. A Cox proportional hazard model without stratification factors was used to calculate HRs for group comparisons and P values for the interaction between negative hyperselection status and treatment group. Statistical tests were two-sided without adjustment for multiple comparisons.
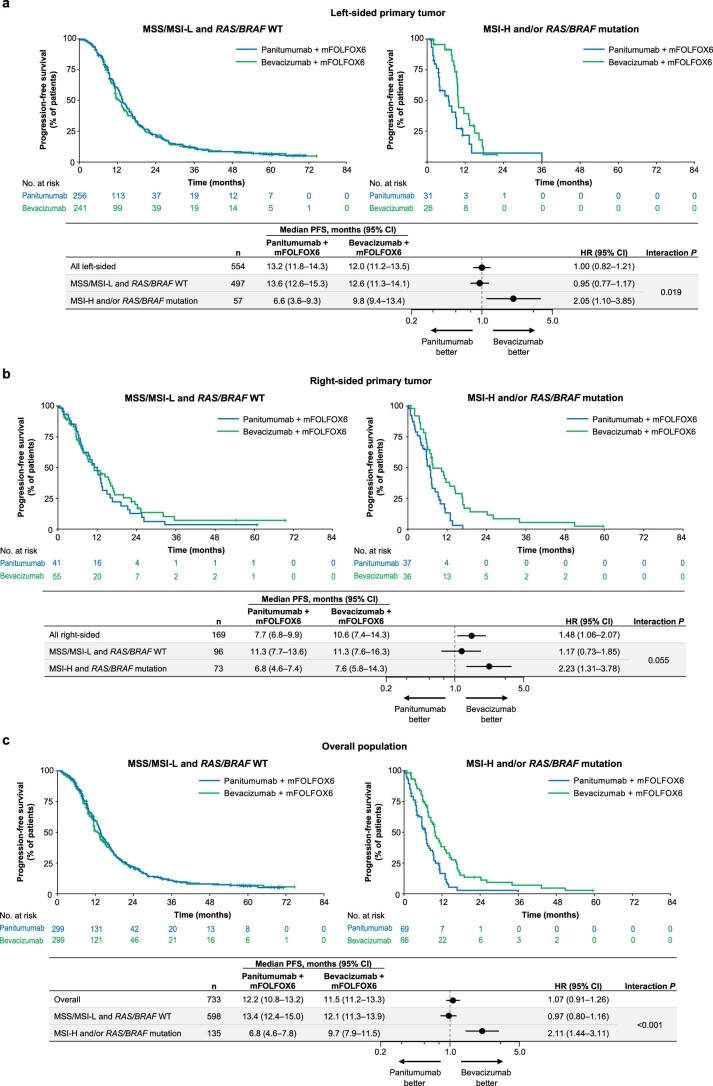
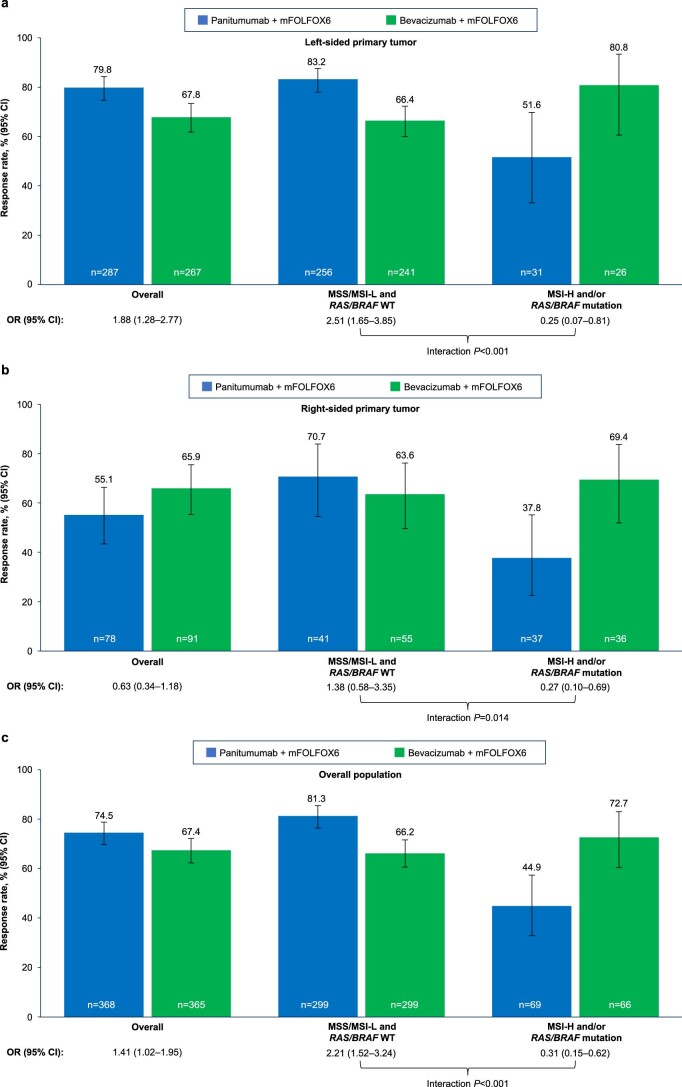
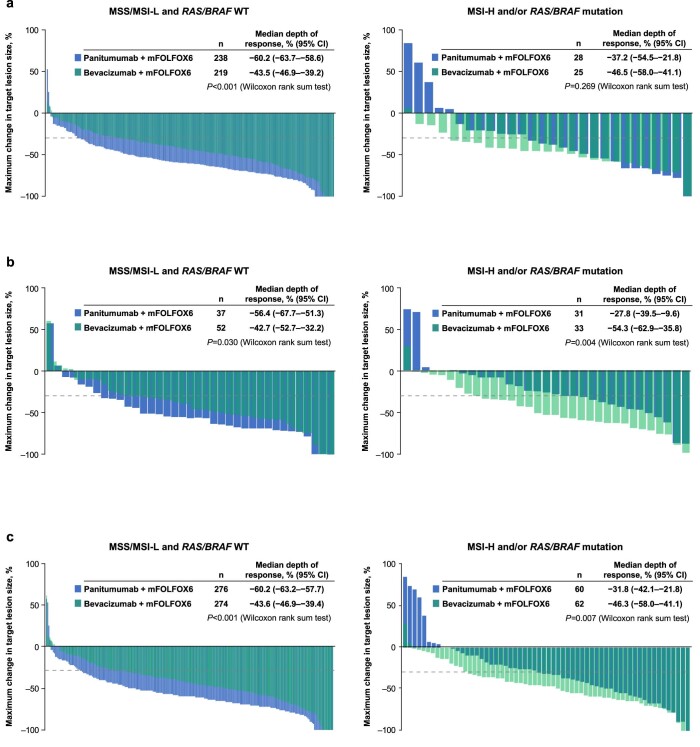
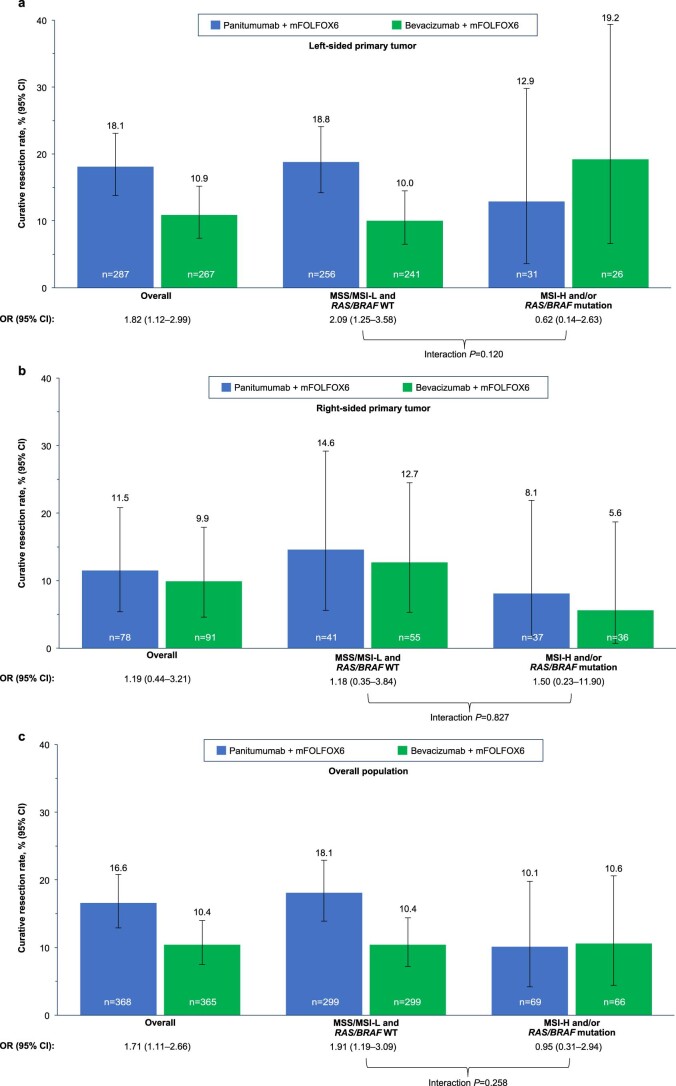
Median PFS was comparable between panitumumab and bevacizumab for RAS/BRAF WT and MSS/MSI-L patients but tended to be shorter with panitumumab than bevacizumab in patients with a RAS/BRAF mutation and/or MSI-H, regardless of tumor sidedness (Extended Data Fig. 5). Antitumor response rates (Extended Data Fig. 6) and depth of response (Supplementary Table 3 and Extended Data Fig. 7) tended to improve with panitumumab versus bevacizumab in RAS/BRAF WT and MSS/MSI-L patients and poorer with panitumumab than bevacizumab for patients with a RAS/BRAF mutation and/or MSI-H, regardless of sidedness. Response rates are shown by specific gene alteration in Supplementary Fig. 1. Curative resection rates are shown by RAS/BRAF and MSS status in Extended Data Fig. 8.
Extended Data Fig. 5. Progression-free survival (PFS) by RAS/BRAF and MSS status.
Kaplan–Meier estimates of PFS in (a) patients with left-sided primary tumors, (b) patients with right-sided primary tumors and (c) the overall population (all ctDNA-evaluable patients). The forest plots below each Kaplan–Meier plot show the HR ± 95% CI. A Cox proportional hazard model without stratification factors was used to calculate HRs for group comparisons and P values for the interaction between negative hyperselection status and treatment group. Statistical tests were two-sided without adjustment for multiple comparisons. HR, hazard ratio; mFOLFOX6, modified FOLFOX6; MSI-H, microsatellite instability–high; MSI-L, microsatellite instability–low; MSS, microsatellite stable; WT, wild type.
Extended Data Fig. 6. Response rates by RAS/BRAF and MSS status.
Response rates in (a) patients with left-sided primary tumors, (b) patients with right-sided primary tumors and (c) the overall population (all ctDNA-evaluable patients). Data plotted are percentages of patients with a response ± 95% CIs. ORs were calculated by logistic regression analysis. Statistical tests were two-sided without adjustment for multiple comparisons. mFOLFOX6, modified FOLFOX6; MSI-H, microsatellite instability–high; MSI-L, microsatellite instability–low; MSS, microsatellite stable; OR, odds ratio; WT, wild type.
Extended Data Fig. 7. Depth of response by RAS/BRAF and MSS status.
Best change in target lesion size in patients with MSS/MSI-L and RAS/BRAF WT or MSI-H and/or a RAS/BRAF mutation in (a) patients with left-sided primary tumors, (b) patients with right-sided primary tumors and (c) the overall population overall population (all ctDNA-evaluable patients). Dotted line at −30% indicated threshold for partial response per RECIST v1.1. P values were calculated using a Wilcoxon rank sum test. Statistical tests were two-sided without adjustment for multiple comparisons. ctDNA, circulating tumor DNA; mFOLFOX6, modified FOLFOX6; MSI-H, microsatellite instability–high; MSI-L, microsatellite instability–low; MSS, microsatellite stable; WT, wild type.
Extended Data Fig. 8. Curative resection rates by RAS/BRAF and microsatellite stability status.
Curative resection rates in (a) patients with left-sided primary tumors, (b) patients with right-sided primary tumors and (c) the overall population (all ctDNA-evaluable patients). Data plotted are percentages of patients with curative resection ± 95% CIs. ORs were calculated by logistic regression analysis. Statistical tests were two-sided without adjustment for multiple comparisons. mFOLFOX6, modified FOLFOX6; MSI-H, microsatellite instability–high; MSI-L, microsatellite instability–low; MSS, microsatellite stable; WT, wild type.
Safety
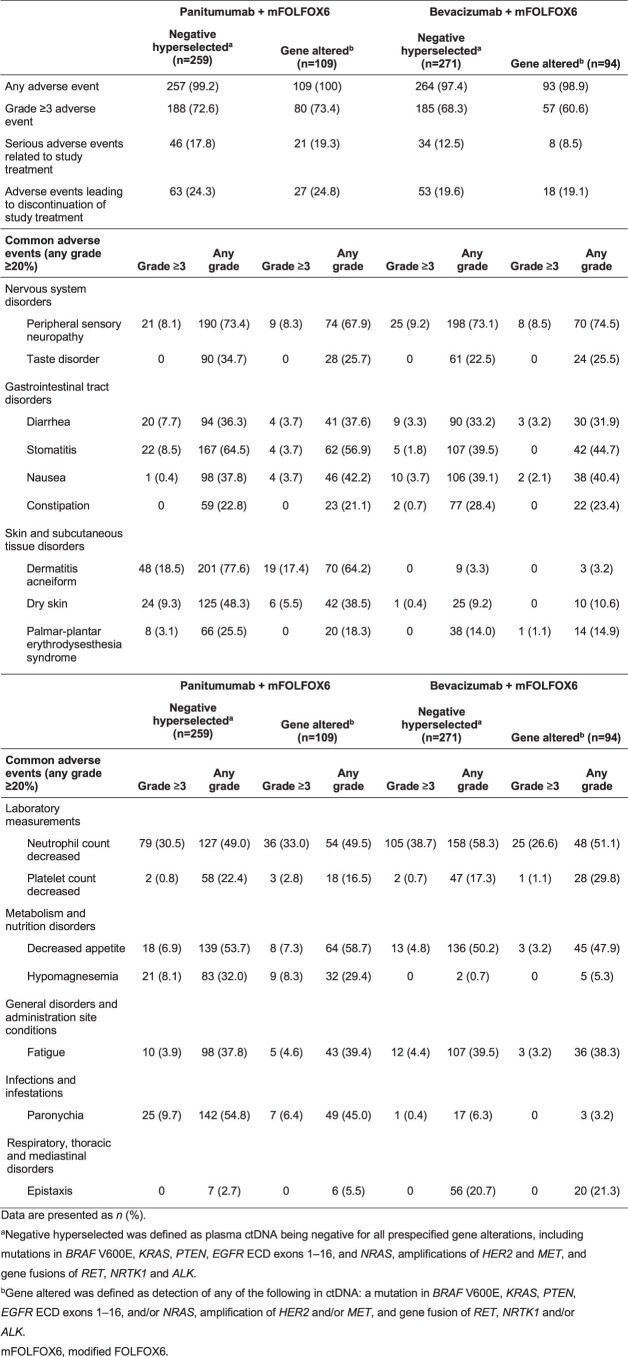
Adverse events occurred in 98.6% of patients in the biomarker population (Extended Data Table 2). The incidence of adverse events and grade 3 or higher adverse events was similar in negative hyperselected and gene-altered patients in each treatment group. A similar trend was observed when the triple-negative group (RAS/BRAF WT and MSS/MSI-L) was compared with the mutation (RAS/BRAF mutation and MSI-H) group (Supplementary Table 4).
Extended Data Table 2.
Adverse events
Discussion
In this prespecified exploratory biomarker analysis of the PARADIGM study, we investigated the potential prognostic and predictive role of hyperselecting patients for anti-EGFR treatment based on detection of a broad array of genetic alterations in plasma ctDNA in patients with RAS WT unresectable mCRC. Genetic alterations were chosen for evaluation due to reported associations with resistance to EGFR inhibition8–13, with an additional exploratory analysis assessing genetic alterations of MSS/MSI status and RAS/BRAF mutations based on guideline recommendations2. To our knowledge, this is the first report of negative hyperselection using ctDNA in a large phase 3 trial population (> 700 patients). Our results suggest that negative hyperselection using a validated and adequately sensitive plasma ctDNA assay may inform appropriate selection of patients for panitumumab treatment regardless of tumor sidedness (left versus right). For patients meeting negative hyperselection criteria, OS was prolonged with panitumumab + mFOLFOX6 compared with bevacizumab + mFOLFOX6 in patients with left-sided primary tumors (median 42.1 versus 35.5 months; HR, 0.76; 95% CI, 0.61–0.95). Higher rates of antitumor response (83.3% versus 66.5%), curative resection (19.8% versus 10.6%) and greater depth of response (median, −60.2% versus −43.6%) with panitumumab versus bevacizumab may have contributed to the improved OS in this negative hyperselected left-sided population.
The prevalence of any genetic alteration associated with resistance was higher among patients with right-sided (49.7%) versus left-sided (26.0%) primary tumors in this study, which is consistent with previous reports6,7,15,16. Of note, even in the patients with right-sided primary tumors, negative hyperselected patients showed numerically longer OS (38.9 versus 30.9 months; HR, 0.82; 95% CI, 0.50–1.35) as well as evidence of improved response rate (71.4% versus 66.6%) and depth of response (median, −56.4% versus −39.4%) with panitumumab versus bevacizumab. The wide 95% CIs for the HR in this correlation may be attributed to the low number of patients with right-sided tumors in our study population. Nevertheless, these results suggest that the primary tumor location may not be the sole determinant and support the notion that primary tumor location serves as a clinical surrogate marker reflecting the intricate molecular landscape of primary resistance to anti-EGFR antibodies. Although exploratory, our findings suggest that certain patients with right-sided colorectal cancer may benefit from first-line anti-EGFR antibodies with chemotherapy if negative hyperselection is feasible. Thus, while our data suggest that negative hyperselection status may be more informative for treatment selection than tumor sidedness, further investigations are necessary to confirm whether anti-EGFR antibody therapy is truly beneficial for negatively hyperselected patients with right-sided mCRC.
Although each of the candidate gene alterations in the negative hyperselection panel had a low frequency individually, prohibiting detection of an effect of individual mutations, it was possible to clarify the therapeutic effect by combining multiple gene alterations associated with resistance. Notably, few patients had multiple gene alterations, and the mutual exclusivity of the gene alterations indirectly supports their role as oncogenic drivers.
Anti-EGFR therapy with doublet chemotherapy is currently considered the treatment of choice for patients with left-sided, RAS and BRAF WT, and MSS mCRC2,25. When we stratified patients by the presence of MSI-H and/or a RAS/BRAF mutation, consistent with current American Society of Clinical Oncology and European Society for Medical Oncology guidelines2,25, patients appeared more appropriately selected for anti-EGFR therapy than when stratified by tumor sidedness alone. However, the ability to predict OS with panitumumab versus bevacizumab in the overall population appeared further improved with the more comprehensive negative hyperselection panel (median, 40.7 versus 34.4 months; HR, 0.76; 95% CI, 0.62–0.92) compared with the current gene testing recommendations (RAS/BRAF and MSS; median, 39.0 versus 34.1 months; HR, 0.79; 95% CI, 0.66–0.96). Moreover, among the right-sided population, the OS HR was changed from 0.94 in RAS/BRAF and MSS to 0.82 after negative hyperselection. Therefore, in addition to checking for the presence or absence of RAS and BRAF mutations and MSS status in both left- and right-sided primary tumors, expanding testing using the ctDNA-based gene panel evaluated in this study may prove useful for identifying patients for anti-EGFR antibody-based therapy.
There are some limitations to this study. Detailed analyses of tumor specimens have not yet been conducted. While the enrollment criteria required patients to have RAS WT tumor tissue based on local assessment using a validated test, a small proportion of patients was found to have RAS mutations (6.0% with KRAS and 1.4% with NRAS mutations) according to the ctDNA test. Patients with RAS alterations detected in ctDNA had poorer survival (median; panitumumab 20.9 months versus bevacizumab 25.7 months) than those with RAS WT in ctDNA (36.3 versus 32.4 months). A similar level of discordance between tumor tissue and ctDNA results was observed in the PERSEIDA trial, in which RAS mutations were detected in ctDNA at baseline in 12.6% of patients who were RAS WT according to tumor tissue biopsy at baseline26. There are three possible reasons for the observed discordance. First, spatial heterogeneity of tumor mutational profiles27 may have affected the tumor tissue results. Tissue assays using biopsy samples capture the tumor profile of a limited region, whereas ctDNA may capture a more complete set of tumor genetic information. Second, there were differences in the timing of sampling for tumor tissue and liquid biopsy. In some cases, tumor specimens were resected during the nonmetastatic stage, and RAS mutations may have emerged during the onset of metastatic disease after surgery. Third, assay sensitivities may have differed for the tissue and liquid biopsy assays. Whereas increasing the sensitivity of tissue next-generation sequencing (NGS) assays might improve the concordance rate, results would likely still be confounded by the spatial and timing differences in tumor and ctDNA sampling. Further investigation is required to better understand discrepancies in tumor tissue and ctDNA results and their implications. Nevertheless, previous studies have shown that plasma detection of RAS mutations has a high level of concordance with tissue biopsy results and a similar predictive level for benefit of anti-EGFR treatment as standard tumor tissue testing19,20. The detection of gene fusions and amplifications in ctDNA is technically challenging, limiting the ability of ctDNA assays to detect copy numbers and fusions. Factors related to clonal hematopoiesis of indeterminate potential were not specifically filtered, although ctDNA were cleaned using an algorithm validated to exclude false positives28. However, it was not possible to completely eliminate mutations related to clonal hematopoiesis. Furthermore, we cannot exclude the possibility that some patients may have been included in the negative hyperselection category because mutations were undetectable in plasma owing to low ctDNA shedding. However, the maximum variant allele frequency was ≥ 1.0% in 87% of samples, suggesting that the mutation profiles were consistent in ctDNA and tumor tissue in these cases29. Finally, this study was not statistically powered for comparisons between specific subgroups. Thus, additional studies are needed to confirm the findings.
In conclusion, our results show that negative hyperselection based on ctDNA-testing using a comprehensive panel of gene alterations associated with resistance to anti-EGFR therapy allows for the identification of patients with mCRC who may derive benefit from first-line treatment with panitumumab combined with chemotherapy.
Methods
Study design and patient population
The PARADIGM study (NCT02394795) was a randomized, open-label, phase 3 trial conducted at 197 sites in Japan between May 2015 and January 20224,30. The study enrolled patients (age 20–79 years) with RAS WT unresectable adenocarcinoma originating in the colorectum who had not received previous chemotherapy for mCRC30. Screening for KRAS and NRAS mutations was performed using approved in vitro diagnostic tests31. KRAS and NRAS were required to be WT within exon 2 codons 12 and 13, exon 3 codons 59 and 61, and exon 4 codons 117 and 146 (refs. 4,32). Other key inclusion criteria were Eastern Cooperative Oncology Group performance status of 0 or 1 and presence of at least one evaluable lesion according to Response Evaluation Criteria in Solid Tumors version 1.1.
Patients were randomly allocated (1:1) to panitumumab + mFOLFOX6 or to bevacizumab + mFOLFOX6 (ref. 4). Randomization was stratified by study site, age (20–64 versus 65–79 years) and presence or absence of liver metastases30. The primary endpoint of PARADIGM was OS, which was tested hierarchically; first in patients with left-sided tumors and then in the overall population. Secondary endpoints were PFS, response rate, duration of response and curative resection rate. Depth of response was an exploratory endpoint. The data cutoff date for these data from the final analysis was 14 January 2022. Patient sex was determined by patient report and was not considered in the study design. Clinical data were collected using EDC Classic Rave (v.2020.2.0). Methods and clinical results of PARADIGM have been published previously4,30.
This exploratory biomarker analysis included patients who were enrolled in the main study (PARADIGM) and provided informed consent for the additional biomarker study (NCT02394834). The biomarker study protocol was approved by the institutional review boards or ethics committees at each participating center. The study was conducted in compliance with the protocol and ethical principles based on the Declaration of Helsinki, Ethical Guidelines on Medical Research Involving Human Subjects and International Council for Harmonisation of Technical Requirements for Pharmaceuticals for Human Use Guideline for Good Clinical Practice. The protocol and statistical analysis plan are available in the Supplementary Information.
Molecular analyses
Baseline plasma ctDNA (> 10 ng ml−1 and > 10 nmol DNA) from patients enrolled in the biomarker study was assessed using a custom NGS-based panel (PlasmaSELECT-R 91, Personal Genome Diagnostics, Inc. Baltimore, MD). The panel was designed to detect 90 mutations, 26 amplifications and 3 rearrangements in mCRC-related genes, as well as MSI (Supplementary Table 5). The analytical sensitivity for detection was 92% and 83% for sequence mutations with mutant allele fraction of 0.10% and 0.20%, respectively, 100% (20% tumor purity) for high-level focal amplifications, 100% (0.10% tumor purity) for translocations, and 100% (0.50% tumor purity) for MSI. The specificity ranged from 99.9998% to 100.0%, depending on alteration type, and the reproducibility was 100% for liquid biopsy genotyping analyses for specimens meeting sample acceptance criteria. Targeted genomic regions spanned 250 kb. Prespecified gene alterations for negative hyperselection for anti-EGFR antibody therapy were KRAS, NRAS, BRAF (V600E), PTEN and ECD EGFR mutations (exons 1–16 (1–620)), HER2 and MET amplifications, and ALK, RET and NTRK1 fusions. The panel had a 1.25 threshold for HER2; thresholds were set based on noise in normal samples. An additional exploratory analysis based on current guideline recommendations regarding clinically relevant biomarkers assessed gene alterations of MSS/MSI-L versus MSI-H status and RAS (KRAS/NRAS) and BRAF V600E mutations.
Statistical analysis
The association of negative hyperselection status (all negative versus gene altered (that is, any positive biomarker)) with OS, PFS, response rate, depth of response and curative resection rate was evaluated in patients who were included in the efficacy analysis and had evaluable baseline ctDNA samples. Efficacy outcomes were also evaluated according to RAS, BRAF (V600E) and MSI status (all negative versus any positive biomarker). OS was defined as the time from the day of randomization (day 1) until death from any cause. PFS was the time from the day of randomization until disease progression or death; for patients who underwent curative resection, the PFS period ended on the day when preoperative diagnostics confirmed no progressive disease. For patients who discontinued study treatment due to an adverse event or other reasons without disease progression or death, PFS was the time until progressive disease or death after subsequent therapy or the patient was censored at the last follow-up date4. The response rate was defined as the percentage of patients whose best overall response was either complete response or partial response. PFS and OS were analyzed according to the Kaplan–Meier method4.
Patient characteristics at baseline were summarized by treatment group, gene-altered status and tumor sidedness using descriptive statistics. A Cox proportional hazard model without stratification factors was used to calculate HRs, and 95% CIs for group comparisons and P values for the interaction between negative hyperselection status and treatment group. ORs for group comparisons of response rates and curative resection rates were calculated by logistic regression analysis. All statistical tests were two-sided without adjustment for multiple comparisons. Statistical analyses were conducted using R (v.4.0.5) using the following packages: gtsummary (v.1.7.0), survival (v.3.5-5), survminer (v.0.4.9), g gplot2 (v.3.4.2), forester (0.2.0) and Complex Heatmap (v.2.13.1).
Reporting summary
Further information on research design is available in the Nature Portfolio Reporting Summary linked to this article.
Online content
Any methods, additional references, Nature Portfolio reporting summaries, source data, extended data, supplementary information, acknowledgements, peer review information; details of author contributions and competing interests; and statements of data and code availability are available at 10.1038/s41591-023-02791-w.
Supplementary information
Supplementary Tables 1–5, Fig. 1, Protocol and Statistical Analysis Plan.
Acknowledgements
We thank the patients, their families and their caregivers; the PARADIGM investigators and their team members at each study site; and colleagues from Takeda Pharmaceutical Company Ltd. We would especially like to thank Y. Sakakibara of Takeda Pharmaceutical Company Ltd. for her contribution to the PARADIGM study and scientific advice for exploratory analyses, and S. Badola of Takeda Pharmaceuticals in Cambridge, MA for providing technical and scientific advice for ctDNA panel design, development and data analysis. The authors would like to acknowledge Tohoku Medical Megabank Organization for providing germline variant data in the Japanese population and Dynacom Co. for exploratory analysis of ctDNA data. Professional medical writing assistance was provided by L. Creutz and L. Gallagher of Peloton Advantage, LLC, an OPEN Health company, and funded by Millennium Pharmaceuticals, Inc., Cambridge, MA, USA, a wholly owned subsidiary of Takeda Pharmaceutical Company Ltd. We acknowledge K. Nomura of Takeda Pharmaceutical Company Ltd. for editorial assistance. The study was sponsored by Takeda Pharmaceutical Company Ltd. and complied with the Good Publication Practice (GPP) guidelines33.
Extended data
Author contributions
K.S., K.M., J.W., K. Yamazaki, E.O., T.S., T.N., Y.K., T.K., I.M., K. Yamanaka, M.H., J.S., R.Y., K.A., A.O., H.U., K.T. and T.Y. conceived of, designed and planned the study. K.S., K. Muro, J.W., K. Yamazaki, H. Ohori, M.S., A.T., N.A., H. Ojima, Y.Y., K. Miwa, H.Y., E.O., T.S., T.N., Y.K., T.K., I.M., K. Yamanaka, M.H., K.A., A.O., H.U., K.T. and T.Y. acquired the data. All authors contributed to interpretation of data, writing of the manuscript and critical review and revision of the manuscript. All authors had full access to all of the data in the study. K.S. and T.Y. had final responsibility for the decision to submit for publication.
Peer review
Peer review information
Nature Medicine thanks Clara Montagut, John Strickler and Peter Gibbs for their contribution to the peer review of this work. Primary Handling Editor: Ulrike Harjes, in collaboration with the Nature Medicine team.
Data availability
The datasets, including individual participant data supporting the results reported in this article, will be made available within 3 months from initial request to researchers who provide a methodologically sound proposal. The initial contact for the request will be made with the corresponding author (K.S.). The data are not publicly available due to privacy/ethical restrictions and intellectual property reasons and will be provided after de-identification in compliance with applicable privacy laws, data protection and requirements for consent and anonymization. Researchers will be requested to execute the contract with Takeda Pharmaceutical Company Ltd. for the usage of the data.
Competing interests
K.S.: Personal fees for consulting and advisory role from Bristol-Myers Squibb, Takeda, Ono Pharmaceutical, Novartis, Daiichi Sankyo, Amgen, Boehringer Ingelheim, Merck Pharmaceutical, Astellas, Guardant Health Japan, Janssen, AstraZeneca, Zymeworks Biopharmaceuticals, ALX Oncology and Bayer; honoraria from Bristol-Myers Squibb, Ono Pharmaceutical, Janssen, Eli Lilly, Astellas and AstraZeneca; research funding (all to institution) from Astellas, Ono Pharmaceutical, Daiichi Sankyo, Taiho Pharmaceutical, Chugai, Merck Pharmaceutical, Amgen, Eisai, PRA Health Sciences and Syneos Health, outside of the submitted work. K. Muro: Consulting and advisory role for Chugai Pharma, AstraZeneca, Ono Pharmaceutical and Amgen; honoraria from Chugai Pharma, Ono Pharmaceutical, Takeda, Eli Lilly, Bayer, Sanofi, Bristol-Myers Squibb and Taiho Pharmaceutical; research grant from Taiho Pharmaceutical, Astellas Pharma, Amgen Astellas Biopharma, (rest to institution) Merck Sharp & Dohme, Daiichi Sankyo, Shionogi, Kyowa Kirin, Gilead Sciences, Merck Serono, Pfizer, Sanofi, PAREXEL, Mediscience Planning, Sumitomo Dainippon Pharma, Solasia Pharma and Ono Pharmaceutical. J.W.: Speakers bureau for Covidien Japan, Johnson & Johnson/Janssen, Eli Lilly Japan and Takeda; research funding (to institution) from Medtronic, TERUMO and Stryker Japan. K. Yamazaki: Honoraria from Chugai Pharma, Daiichi Sankyo, Yakult Honsha, Takeda, Bayer, Merck Serono, Taiho Pharmaceutical, Eli Lilly, Sanofi, Ono Pharmaceutical, Merck Sharp & Dohme and Bristol-Myers Squibb; research funding (to institution) from Taiho Pharmaceutical. H. Ohori: Honoraria from Daiichi Sankyo, Yakult Honsha, Takeda, Taiho Pharmaceutical, Eli Lilly, Merck Sharp & Dohme and Bristol-Myers Squibb. N.A., M.Y., H. Ojima, Y.Y., K. Miwa, H.Y., K.A. and A.O. report having no relationships to disclose. A.T.: Grants from Takeda, Ono Pharmaceutical, Merck Sharp & Dohme, Bristol-Myers Squibb, Isofol Medical AB, Hutchison Medipharma, Incyte Corporation, Pfizer, Daiichi Sankyo; personal fees from Eli Lilly Japan, Taiho Pharmaceutical, Ono Pharmaceutical, Chugai Pharmaceutical, Takeda, Merck Serono and Merck Sharp & Dohme. A.M.: Personal fees from Eli Lilly Japan, Taiho Pharmaceutical, Ono Pharmaceutical, Bristol-Myers Squibb and Daiichi Sankyo. M.S.: Honoraria from Yakult Honsha, Takeda, Merck Serono, Taiho Pharmaceutical, Eli Lilly, Ono Pharmaceutical and Johnson & Johnson. E.O.: Speakers bureau for Chugai Pharma, Eli Lilly Japan, Takeda, Ono Pharmaceutical, Bayer Yakuhin and Bristol-Myers Squibb Japan. T.S.: Consulting and advisory role for Takeda; speakers bureau for Chugai Pharma, Eli Lilly Japan, Taiho Oncology, Takeda, Bayer Yakuhin, Ono Yakuhin and Daiichi Sankyo/UCB Japan. T.N.: Honoraria from Chugai Pharma, Taiho Pharmaceutical, Kaken Pharmaceutical, Daiichi Sankyo, Eli Lilly Japan, Takeda, Merck, Bayer and Boehringer Ingelheim; research funding (all to institution) from Chugai Pharma, Taiho Pharmaceutical, Kaken Pharmaceutical, Daiichi Sankyo and Eli Lilly Japan. Y.K.: Speakers bureau for Ono Pharmaceutical, Taiho, Chugai, Eli Lilly and Bayer Yakuhin; research funding from Ono Pharmaceutical, Taiho, Daiichi Sankyo, Chugai and IQVIA. T.K.: Honoraria from Chugai Pharma, Yakult Honsha, Ono Pharmaceutical, Takeda, Eli Lilly Japan, Taiho Pharmaceutical and Asahi Kasei; research funding from Chugai Pharma. I.M.: Employment with Takeda Pharmaceutical Company Ltd. K. Yamanaka: Employment with Takeda Pharmaceutical Company Ltd. M.H.: Employment with Takeda Pharmaceutical Company Ltd. J.S.: Employment with Takeda Pharmaceutical Company Ltd. T.M.: Honoraria from Chugai Pharma, AstraZeneca and Mivarisan. K. Yamamoto: Honoraria from Chugai Pharma, J-Pharma, Johokiko, Triceps and CMIC Holdings; research funding from Taiho, Boehringer Ingelheim, Takeda, Daiichi Sankyo and Astellas. R.Y.: Honoraria from Chugai Pharma, Takeda and BitBiome; consulting and advisory role for Takeda. H.U.: Speakers bureau for Takeda, Chugai Pharma and Taiho. K.T.: Honoraria from Chugai Pharma, Novartis, Takeda, Miyarisan Pharmaceutical, Bristol-Myers Squibb Japan, AstraZeneca, Illumina, Eisai, Boehringer Ingelheim Seiyaku and Bayer Yakuhin. T.Y.: Honoraria from Chugai Pharma, Merck, Bayer Yakuhin, Ono Pharmaceutical, Takeda, and Merck Sharp & Dohme; consulting and advisory role for Sumitomo Corp.; research funding (all to institution) from Merck Sharp & Dohme, Daiichi Sankyo, Ono Pharmaceutical, Taiho Pharmaceutical, Amgen, Sanofi, Pfizer, Genomedia, Sysmex, Nippon Boehringer Ingelheim, Eisai, FALCO Biosystems, Roche Diagnostics and Chugai Pharma.
Footnotes
Publisher’s note Springer Nature remains neutral with regard to jurisdictional claims in published maps and institutional affiliations.
Extended data
is available for this paper at 10.1038/s41591-023-02791-w.
Supplementary information
The online version contains supplementary material available at 10.1038/s41591-023-02791-w.
References
- 1.Chiorean EG, et al. Treatment of patients with late-stage colorectal cancer: ASCO resource-stratified guideline. JCO Glob. Oncol. 2020;6:414–438. doi: 10.1200/JGO.19.00367. [DOI] [PMC free article] [PubMed] [Google Scholar]
- 2.Morris VK, et al. Treatment of metastatic colorectal cancer: ASCO guideline. J. Clin. Oncol. 2023;41:678–700. doi: 10.1200/JCO.22.01690. [DOI] [PMC free article] [PubMed] [Google Scholar]
- 3.Yoshino T, et al. Pan-Asian adapted ESMO clinical practice guidelines for the diagnosis, treatment and follow-up of patients with metastatic colorectal cancer. ESMO Open. 2023;8:101558. doi: 10.1016/j.esmoop.2023.101558. [DOI] [PMC free article] [PubMed] [Google Scholar]
- 4.Watanabe J, et al. Panitumumab vs bevacizumab added to standard first-line chemotherapy and overall survival among patients with RAS wild-type, left-sided metastatic colorectal cancer: a randomized clinical trial. JAMA. 2023;329:1271–1282. doi: 10.1001/jama.2023.4428. [DOI] [PMC free article] [PubMed] [Google Scholar]
- 5.Dienstmann R, et al. Consensus molecular subtypes and the evolution of precision medicine in colorectal cancer. Nat. Rev. Cancer. 2017;17:79–92. doi: 10.1038/nrc.2016.126. [DOI] [PubMed] [Google Scholar]
- 6.Yamauchi M, et al. Assessment of colorectal cancer molecular features along bowel subsites challenges the conception of distinct dichotomy of proximal versus distal colorectum. Gut. 2012;61:847–854. doi: 10.1136/gutjnl-2011-300865. [DOI] [PMC free article] [PubMed] [Google Scholar]
- 7.Lee MS, Menter DG, Kopetz S. Right versus left colon cancer biology: integrating the consensus molecular subtypes. J. Natl Compr. Canc. Netw. 2017;15:411–419. doi: 10.6004/jnccn.2017.0038. [DOI] [PubMed] [Google Scholar]
- 8.Therkildsen C, Bergmann TK, Henrichsen-Schnack T, Ladelund S, Nilbert M. The predictive value of KRAS, NRAS, BRAF, PIK3CA and PTEN for anti-EGFR treatment in metastatic colorectal cancer: a systematic review and meta-analysis. Acta Oncol. 2014;53:852–864. doi: 10.3109/0284186X.2014.895036. [DOI] [PubMed] [Google Scholar]
- 9.Montagut C, et al. Identification of a mutation in the extracellular domain of the epidermal growth factor receptor conferring cetuximab resistance in colorectal cancer. Nat. Med. 2012;18:221–223. doi: 10.1038/nm.2609. [DOI] [PubMed] [Google Scholar]
- 10.Bardelli A, et al. Amplification of the MET receptor drives resistance to anti-EGFR therapies in colorectal cancer. Cancer Discov. 2013;3:658–673. doi: 10.1158/2159-8290.CD-12-0558. [DOI] [PMC free article] [PubMed] [Google Scholar]
- 11.Pietrantonio F, et al. ALK, ROS1, and NTRK rearrangements in metastatic colorectal cancer. J. Natl. Cancer Inst. 2017;109:abstr. doi: 10.1093/jnci/djx089. [DOI] [PubMed] [Google Scholar]
- 12.Medico E, et al. The molecular landscape of colorectal cancer cell lines unveils clinically actionable kinase targets. Nat. Commun. 2015;6:7002. doi: 10.1038/ncomms8002. [DOI] [PubMed] [Google Scholar]
- 13.Bertotti A, et al. A molecularly annotated platform of patient-derived xenografts (‘xenopatients’) identifies HER2 as an effective therapeutic target in cetuximab-resistant colorectal cancer. Cancer Discov. 2011;1:508–523. doi: 10.1158/2159-8290.CD-11-0109. [DOI] [PubMed] [Google Scholar]
- 14.Sorscher S. Molecular markers of molecular markers. J. Clin. Oncol. 2019;37:2291. doi: 10.1200/JCO.19.00746. [DOI] [PubMed] [Google Scholar]
- 15.Cremolini C, et al. Negative hyper-selection of metastatic colorectal cancer patients for anti-EGFR monoclonal antibodies: the PRESSING case-control study. Ann. Oncol. 2017;28:3009–3014. doi: 10.1093/annonc/mdx546. [DOI] [PubMed] [Google Scholar]
- 16.Randon G, et al. Negative ultraselection of patients with RAS/BRAF wild-type, microsatellite-stable metastatic colorectal cancer receiving anti-EGFR-based therapy. JCO Precis. Oncol. 2022;6:e2200037. doi: 10.1200/PO.22.00037. [DOI] [PMC free article] [PubMed] [Google Scholar]
- 17.Morano F, et al. Negative hyperselection of patients with RAS and BRAF wild-type metastatic colorectal cancer who received panitumumab-based maintenance therapy. J. Clin. Oncol. 2019;37:3099–3110. doi: 10.1200/JCO.19.01254. [DOI] [PMC free article] [PubMed] [Google Scholar]
- 18.Kind AJ, et al. Negative hyperselection for mutations associated with anti-EGFR antibody resistance in RAS wildtype metastatic colorectal cancer (mCRC): evaluation of the PANAMA trial (AIO-KRK-0212, maintenance therapy with 5-FU, folinic acid (FU/FA) with or without panitumumab) J. Clin. Oncol. 2022;40:abstr. 3536. doi: 10.1200/JCO.2022.40.16_suppl.3536. [DOI] [Google Scholar]
- 19.Grasselli J, et al. Concordance of blood- and tumor-based detection of RAS mutations to guide anti-EGFR therapy in metastatic colorectal cancer. Ann. Oncol. 2017;28:1294–1301. doi: 10.1093/annonc/mdx112. [DOI] [PMC free article] [PubMed] [Google Scholar]
- 20.Vidal J, et al. Plasma ctDNA RAS mutation analysis for the diagnosis and treatment monitoring of metastatic colorectal cancer patients. Ann. Oncol. 2017;28:1325–1332. doi: 10.1093/annonc/mdx125. [DOI] [PMC free article] [PubMed] [Google Scholar]
- 21.Diaz LA, Jr., et al. The molecular evolution of acquired resistance to targeted EGFR blockade in colorectal cancers. Nature. 2012;486:537–540. doi: 10.1038/nature11219. [DOI] [PMC free article] [PubMed] [Google Scholar]
- 22.Douillard JY, et al. Panitumumab-FOLFOX4 treatment and RAS mutations in colorectal cancer. N. Engl. J. Med. 2013;369:1023–1034. doi: 10.1056/NEJMoa1305275. [DOI] [PubMed] [Google Scholar]
- 23.Clarke CN, Kopetz ES. BRAF mutant colorectal cancer as a distinct subset of colorectal cancer: clinical characteristics, clinical behavior, and response to targeted therapies. J. Gastrointest. Oncol. 2015;6:660–667. doi: 10.3978/j.issn.2078-6891.2015.077. [DOI] [PMC free article] [PubMed] [Google Scholar]
- 24.Zhao B, et al. Mechanisms of resistance to anti-EGFR therapy in colorectal cancer. Oncotarget. 2017;8:3980–4000. doi: 10.18632/oncotarget.14012. [DOI] [PMC free article] [PubMed] [Google Scholar]
- 25.Cervantes A, et al. Metastatic colorectal cancer: ESMO clinical practice guideline for diagnosis, treatment and follow-up. Ann. Oncol. 2023;34:10–32. doi: 10.1016/j.annonc.2022.10.003. [DOI] [PubMed] [Google Scholar]
- 26.Valladares-Ayerbes M, et al. Evolution of RAS mutations in cell-free DNA of patients with tissue RAS wild-type metastatic colorectal cancer receiving first-line treatment: the PERSEIDA study. Cancers (Basel) 2022;14:6075. doi: 10.3390/cancers14246075. [DOI] [PMC free article] [PubMed] [Google Scholar]
- 27.Del Carmen S, et al. Spatio-temporal tumor heterogeneity in metastatic CRC tumors: a mutational-based approach. Oncotarget. 2018;9:34279–34288. doi: 10.18632/oncotarget.26081. [DOI] [PMC free article] [PubMed] [Google Scholar]
- 28.Al Zoughbi W, et al. Validation of a circulating tumor DNA-based next-generation sequencing assay in a cohort of patients with solid tumors: a proposed solution for decentralized plasma testing. Oncologist. 2021;26:e1971–e1981. doi: 10.1002/onco.13905. [DOI] [PMC free article] [PubMed] [Google Scholar]
- 29.Aoki Y, et al. Clinical validation of plasma-based genotyping for RAS and BRAF V600E mutation in metastatic colorectal cancer: SCRUM-Japan GOZILA substudy. JCO Precis. Oncol. 2023;7:e2200688. doi: 10.1200/PO.22.00688. [DOI] [PMC free article] [PubMed] [Google Scholar]
- 30.Yoshino T, et al. Rationale for and design of the PARADIGM study: randomized phase III study of mFOLFOX6 plus bevacizumab or panitumumab in chemotherapy-naïve patients with RAS (KRAS/NRAS) wild-type, metastatic colorectal cancer. Clin. Colorectal Cancer. 2017;16:158–163. doi: 10.1016/j.clcc.2017.01.001. [DOI] [PubMed] [Google Scholar]
- 31.Taniguchi H, et al. Japanese Society of Medical Oncology Clinical Guidelines: RAS (KRAS/NRAS) mutation testing in colorectal cancer patients. Cancer Sci. 2015;106:324–327. doi: 10.1111/cas.12595. [DOI] [PMC free article] [PubMed] [Google Scholar]
- 32.Yoshino T, et al. Clinical validation of a multiplex kit for RAS mutations in colorectal cancer: results of the RASKET (RAS KEy Testing) prospective, multicenter study. EBioMedicine. 2015;2:317–323. doi: 10.1016/j.ebiom.2015.02.007. [DOI] [PMC free article] [PubMed] [Google Scholar]
- 33.DeTora LM, et al. Good Publication Practice (GPP) guidelines for company-sponsored biomedical research: 2022 update. Ann. Intern. Med. 2022;175:1298–1304. doi: 10.7326/M22-1460. [DOI] [PubMed] [Google Scholar]
Associated Data
This section collects any data citations, data availability statements, or supplementary materials included in this article.
Supplementary Materials
Supplementary Tables 1–5, Fig. 1, Protocol and Statistical Analysis Plan.
Data Availability Statement
The datasets, including individual participant data supporting the results reported in this article, will be made available within 3 months from initial request to researchers who provide a methodologically sound proposal. The initial contact for the request will be made with the corresponding author (K.S.). The data are not publicly available due to privacy/ethical restrictions and intellectual property reasons and will be provided after de-identification in compliance with applicable privacy laws, data protection and requirements for consent and anonymization. Researchers will be requested to execute the contract with Takeda Pharmaceutical Company Ltd. for the usage of the data.


