

Abstract
Background.
Left ventricular (LV) remodeling has adverse effects on the prognosis of patients with myocardial infarction (MI). The aim of this study is to identify the risk factors of LV remodeling in MI patients by radionuclide myocardial imaging.
Methods and Results.
This retrospective study consisted of 92 patients who had a history of definite prior MI on ECG and underwent both resting gated single photon emission computed tomography (SPECT) myocardial perfusion imaging (MPI) and positron emission tomography (PET) myocardial metabolism imaging. LV remodeling was defined as > mean + 2SD of LV end-diastolic volume index (LVEDVi) in the normal database. LV enlargement, cardiac dysfunction, wall thickening abnormalities expressed as summed thickening score (STS) were more severe in the old MI patients as compared to those with subacute MI. STS (Odds ratio, 1.296; P = .004) and the proportion of segments with reduced wall thickening in segments with normal perfusion (Odds ratio, 1.110; P = .001) were identified as the independent factors of LV remodeling in subacute and old MI patients in the multivariate binary regression model. Total perfusion deficit (TPD), viable myocardium, scar, and the proportion of segments with reduced wall thickening in segments with decreased perfusion showed strong correlation with LV remodeling in the univariate regression model as well.
Conclusions.
LV remodeling in old MI patients is more extensive and severe than that in subacute MI patients. LV wall thickening abnormalities as expressed by STS and the proportion of segments with reduced wall thickening in segments with normal perfusion are the independent risk factors of LV remodeling in MI patients. (J Nucl Cardiol 2018)
Keywords: SPECT, PET, myocardial infarction, left ventricular remodeling, summed thickening score
INTRODUCTION
Left ventricular (LV) remodeling is a complex process accompanied by LV enlargement and shape changes as well as cardiac dysfunction. Previous studies have indicated that progressive LV remodeling is associated with poor prognosis, which can prohibit improvement in LV ejection fraction (LVEF) after revascularization and affect long-term prognosis negatively.1–3 Therefore, it is of great importance to assess LV remodeling and its risk factors in patients with myocardial infarction (MI).
Cardiac magnetic resonance (CMR) is identified as the most accurate measurement for cardiac function and LV remodeling due to its high spatial resolution.4 LV volume is a recognized indicator of LV remodeling and the measurement at a single time point and over time can predict clinical outcomes in patients with heart failure and in those after MI.5 Single photon emission computed tomography (SPECT) myocardial perfusion imaging (MPI) is another reliable technique for assessing LV remodeling as it can measure parameters such as abnormal perfusion location and size, LV volume, wall thickening abnormalities, and LV function. Furthermore, Wei et al.6 demonstrated that LV volume measured by electrocardiogram (ECG) gated SPECT correlates well with that by CMR. 18F-fluorodeoxyglucose (18F-FDG) positron emission tomography (PET) myocardial metabolism imaging can accurately assess myocardial viability when combined with MPI.
Berti et al.7 showed that infarct severity was more effective than infarct size, but both were helpful for predicting LV remodeling after acute MI. However, Nijland et al.8 identified myocardial viability as an independent predictor of progressive LV dilatation after acute MI, and concluded that LV enlargement was more severe in patients without viability than those with viability at three months. Nevertheless, the interactions between the total perfusion deficit (TPD), infarct size, myocardial viability, wall thickening abnormalities, and the presence of LV remodeling by radionuclide myocardial imaging in MI patients are not clearly revealed yet. It has been shown that LVEF correlates well with regional wall thickening, and meanwhile, summed thickening score (STS) which reveals the global wall thickening abnormalities is the independent predictor of LV mechanical dyssynchrony.9,10 The aim of this study is to identify the independent factors of LV remodeling in MI patients who are likely to suffer from LV remodeling.
METHODS
Study Population and Protocol
We retrospectively studied 125 consecutive patients who had a history of MI and underwent both gated SPECT MPI and 18F-FDG PET myocardial metabolism imaging at the Third Affiliated Hospital of Soochow University from October 2010 to November 2016. Patients with acute MI, severe valve disease, hypertrophic/dilated cardiomyopathy, significant arrhythmia, prior percutaneous coronary intervention, or coronary artery bypass grafting were excluded. All eligible patients were divided into two subgroups. One group was referred as the subacute MI group which included all those patients having the first MI more than 3 months, but not more than 6 months. The second was referred as the old MI group which included all the patients who had MI 6 months ago or a remote history of MI without current evidence of ischemia documented by nuclear perfusion imaging. The protocol was approved by the ethics committee of the Third Affiliated Hospital of Soochow University and written informed consent was obtained from each patient.
Image Acquisition
Resting gated SPECT MPI was performed 60 to 90 minutes after injection of 99mTc-sestamibi (99mTc-MIBI) (740 to 925 MBq) in all subjects, using a 2-detector 90° camera (Symbia T16, Siemens Medical Systems, Erlangen, Germany) equipped with a low-energy and high-resolution parallel hole collimator centered on the 140 keV photopeak with a 20% symmetric energy window. An ECG R-wave detector provided gating to acquire 8 emission frames per cardiac cycle. Sixty-four images covering 180° were acquired with a 64 × 64 matrices and 1.45 magnification. Transaxial images were reconstructed using the filtered back projection method (order, 5; cutoff frequency, 0.4) and no attenuation correction was performed. Horizontal long-axis, vertical long-axis, and short-axis images were obtained.
After 6 hours of fasting on the following day, all patients underwent 18F-FDG cardiac PET study. Depending on their blood glucose level, an oral glucose of 25 to 50 g was given to the patients. For diabetics, acipimox was administrated (500 mg oral dose) before glucose loading. Insulin was intravenously administrated if the blood glucose level > 9.00 mmol/L at 45 minutes after oral glucose administration with close monitoring of blood glucose. When the blood glucose level reached 5.55 to 7.77 mmol/L, 18F-FDG (3 MBq/kg) was administered intravenously.11 Metabolic images were acquired 1 to 2 hours after tracer injection using a 64-slice CT (Biograph mCT 64-s, Siemens Medical Systems, Erlangen, Germany). The cardiac PET scan was performed with a 128 × 128 matrices, a magnification of 2, and a photopeak of 511 keV. Transaxial images were reconstructed using the iterative method (OSEM algorithm; iterations, 4; subsets, 8). Horizontal long-axis, vertical long-axis, and short-axis images were obtained.
Assessment of LV Remodeling, Cardiac Function, and Myocardial Viability
SPECT and PET images were evaluated by consensus of two experienced observers, who were blinded to the patients’ clinical data. Visual evaluation of myocardial perfusion in each segment was based on short-axis and vertical long-axis images divided into 17 segments using a five-point continuous scoring system (0 = normal; 1 = mildly abnormal; 2 = moderately abnormal; 3 = severely abnormal; 4 = absence of segmental uptake).12
The QGS software package (QGS 2009, Cedars-Sinai Medical Center, Los Angeles, CA, USA) was used to quantitatively measure LV end-diastolic volume (LVEDV), LV end-systolic volume (LVESV), LVEF, and STS from gated SPECT MPI. Based on the principle of QGS software in measuring wall thickening, a scale of 0 to 3 was applied to score the wall thickening for each segment on the AHA 17-segmentation polar map (0 = normal, 1 = mildly reduced, 2 = moderately to severely reduced, 3 = no thickening) and STS was calculated as the total score of wall thickening from all the 17 segments (Figure 1).13 LV remodeling was defined as abnormal when the LVEDV index (LVEDVi) exceeded a predefined threshold value as derived from our hospital normal database of 95 patients who had suspected chest tightness or chest pain but did not have CAD by normal electrocardiogram, echocardiography, and stress/rest MPI. The LVEDVi threshold was set to mean + 2 × SD for LVEDVi of the control group.14
Figure 1.
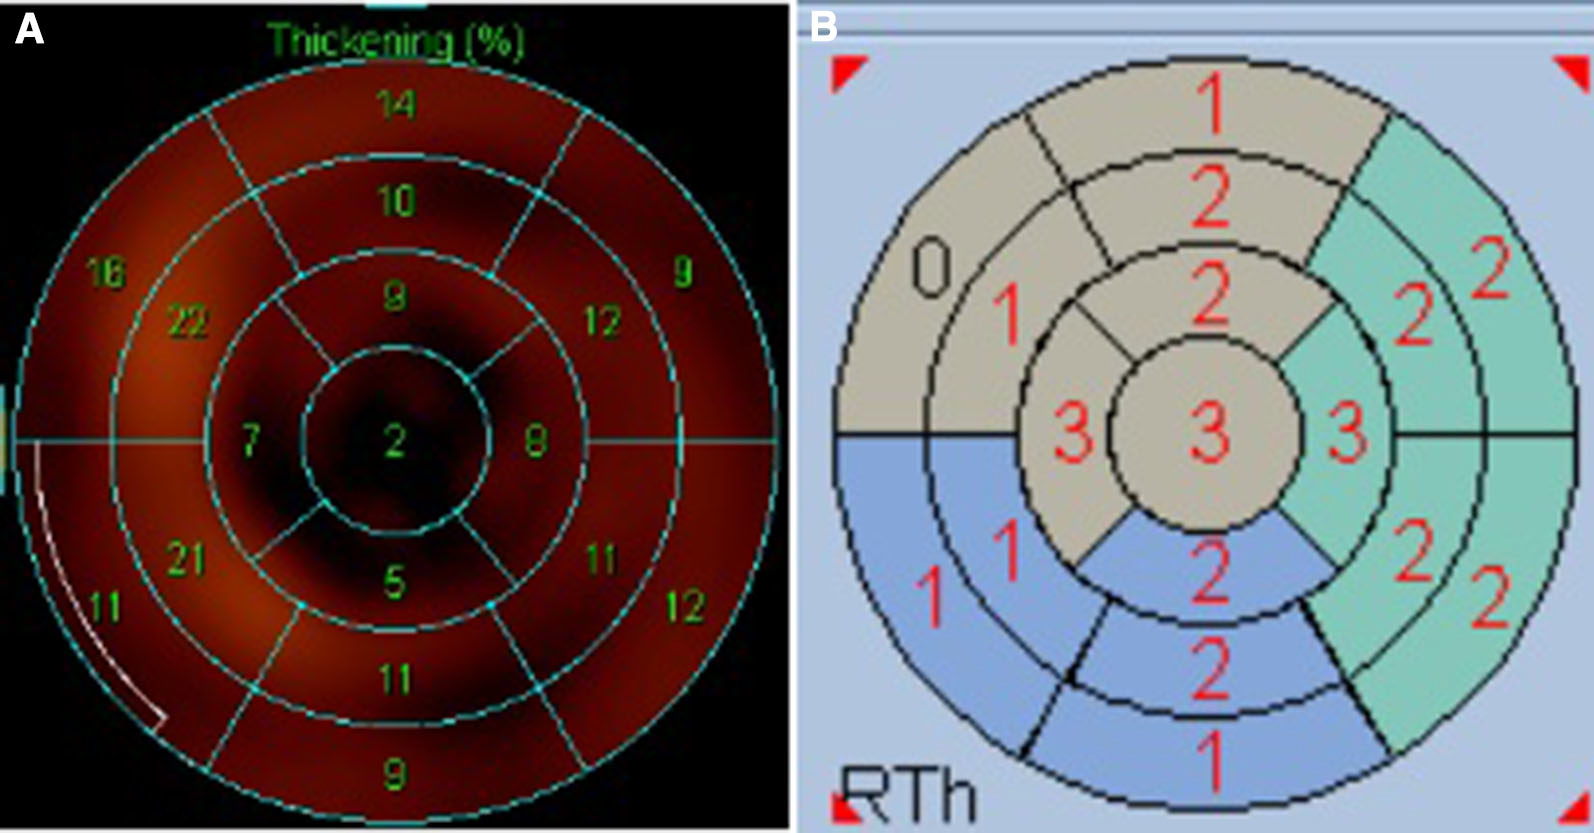
Quantification of left ventricular wall thickening in the 17-segmentation model by the QGS software package. A The wall thickening ratio of each segment. B The scale of 0 to 3 for grading the wall thickening of each segment (0 = normal, 1 = mildly reduced, 2 = moderately to severely reduced, 3 = no thickening). The total score of wall thickening in the 17 segments is referred to the summed thickening score (STS).
Myocardial viability was assessed by reference to previous studies.15 Reconstructed SPECT/PET imaging datasets were imported to a dedicated software package (QPS 2009, Cedars-Sinai Medical Center, Los Angeles, CA, USA). The TPD, which reflects both severity and extent of perfusion defect, was calculated as percentage of the LV myocardium from the rest MPI by QPS. An automated method of image analysis was applied to the SPECT/PET imaging data to yield quantified measures of the extent and severity of scar and mismatch. Quantification of the viability scores (mismatch and scar areas) was performed after direct image count normalization between the perfusion and viability scans. The method of assigning mismatch and scar scores was according to the PARR-1 study,16 with automatic registration and utilization of normal limits for resting perfusion. When the normalized perfusion value at a given polar map location was lower than the normalized 18F-FDG uptake, the mismatch score was calculated from the difference between the two values. The scar score was calculated relative to the normalized 18F-FDG uptake in each segment. When normalized perfusion exceeded 18F-FDG uptake, the scar score was assigned a value equal to the normalized perfusion value in that segment.
Statistical Analysis
IBM SPSS (Version 19.0, SPSS Inc, Chicago, IL) was used for all statistical analysis in this study. Continuous data were expressed as mean ± SD, the measurements from skewed distribution were presented as Median (Q1 to Q3), and categorical variables were described as percentages. Unpaired t test or Mann–Whitney U test were performed when appropriate to compare the parameters between two groups. The comparison of categorical variables was made with Fisher’s exact test or Chi-square analysis. In addition, we conducted a univariate regression model to identify factors for the presence of LV remodeling. Furthermore, a multivariate analyses including STS, TPD, viable myocardium, scar, the proportion of segments with reduced wall thickening in segments with normal perfusion, and the proportion of segments with reduced wall thickening in segments with decreased perfusion were performed by logistic regression analysis to identify the independent factors of LV remodeling. A two-sided P value of .05 or lower was regarded as statistically significant.
RESULTS
Two patients with prior coronary artery bypass grafting, one patient with prior percutaneous coronary intervention, three patients with dilated cardiomyopathy, eight patients with normal resting gated SPECT MPI, and 19 patients with unqualified 18F-FDG myocardial metabolism images were excluded. The final study cohort consisted of 92 subjects (82.6% males; 62.9 ± 8.6 years old) and 38 of the 92 patients (41.3%) had old MI. The demographic data and clinical characteristics of all patients were listed in Table 1. In addition, there were 23 diabetics, 21 hyperlipidemia, and two hypertensive patients in the control group (70 males and 25 females, 62.0 ± 6.9 years old). There was no significant differences in age and gender between the MI group and the control group (all P >.05).
Table 1.
MI patient characteristics
| Variable | Value |
|---|---|
|
| |
| Age (years) | 62.9 ± 8.6 |
| Males, n | 76 (82.6%) |
| BMI (kg/m2) | 24.58 ± 3.02 |
| Hypertension, n | 68 (73.9%) |
| Diabetes, n | 31 (33.7%) |
| Hyperlipidemia, n | 11 (12.0%) |
| COPD, n | 2 (2.2%) |
| History of angina pectoris, n | 74 (80.4%) |
| Stenosis vessel number, n | 2.51 ± 0.70 |
| CCS class | 1.53 ± 1.04 |
| NYHA class | 1.85 ± 1.13 |
| LVEDVi (ml/m2) | 72.83 ± 35.94 |
| LVESVi (ml/m2) | 42.68 ± 35.13 |
| LVEF (%) | 47.91 ± 15.88 |
| STS | 8.5 (1.3–18.8) |
| TPD (%) | 16.41 ± 14.20 |
| Viable myocardium (%) | 6 (2–11.8) |
| Scar (%) | 5 (2–9.8) |
| Reduced thickening segments/normal perfusion segments (%) | 9.55 (0.00–36.46) |
| Reduced thickening segments/decreased perfusion segments (%) | 66.67 (20.00–100.00) |
MI, Myocardial infarction; BMI, body mass index; COPD, chronic obstructive pulmonary disease; CCS, Canadian class classification of angina pectoris; NYHA, New York Heart Association classification of heart failure; LVEDVi, left ventricular end-diastolic volume index; LVESVi, left ventricular end-systolic volume index; LVEF, left ventricular ejection fraction; STS, summed thickening score; TPD, total perfusion deficit
LV enlargement, cardiac dysfunction, global wall thickening abnormalities as expressed by STS and TPD in the subacute or old MI group were significantly more severe as compared to those in the control group (all P < .001) (Table 2). In the two MI subgroups, these parameters were even more severe in the old MI group (all P <.01) (Table 2, Figure 2) and an example was illustrated in Figure 3. Meanwhile, compared to subacute MI patients, there was a higher proportion of LV remodeling in the old MI group, but the difference was not statistically significant (57.89% vs 38.89%; χ2 = 3.236, P = .072).
Table 2.
LVEDVi, LVESVi, LVEF, STS, and TPD in the control group and patients with subacute or old MI
| Control group (n = 95) | Subacute MI group (n = 54) | P value* | Old MI group (n = 38) | P value* | P value‡ | |
|---|---|---|---|---|---|---|
|
| ||||||
| LVEDVi (ml/m2) | 43.49 ± 9.52 | 64.44 ± 26.14 | < .001 | 84.75 ± 44.16 | < .001 | < .01 |
| LVESVi (ml/m2) | 13.74 ± 5.90 | 33.70 ± 23.99 | < .001 | 55.44 ± 43.89 | < .001 | < .01 |
| LVEF (%) | 69.52 ± 8.20 | 52.43 ± 13.73 | < .001 | 41.50 ± 16.69 | < .001 | < .01 |
| STS | 0 (0–0) | 6.0 (1.0–13.5) | < .001 | 12.5 (7.0–24.75) | < .001 | < .01 |
| TPD (%) | 0 (0–0) | 12.72 ± 12.21 | < .001 | 21.66 ± 15.30 | < .001 | < .01 |
MI, Myocardial infarction; LVEDVi, left ventricular end-diastolic volume index; LVESVi, left ventricular end-systolic volume index; LVEF, left ventricular ejection fraction; STS, summed thickening score; TPD, total perfusion deficit
P Comparison between the control group and the two MI subgroups
P Comparison between the subacute and old MI group
Figure 2.

Comparisons of LV enlargement, cardiac dysfunction, and global wall thickening abnormalities and TPD between the subacute and old MI group.
Figure 3.

An example to illustrate the time dependency of left ventricular remodeling after MI. A Gated MPI of a patient with subacute MI, LVEDVi = 71.47 ml/m2, LVESVi = 36.30 ml/m2, LVEF = 49%, TPD = 25%; B gated MPI of a patient with old MI, LVEDVi = 89.33 ml/m2, LVESVi = 61.76 ml/m2, LVEF = 31%, TPD = 48%; C left ventricular wall thickening in the 17-segmentation of the patient with subacute MI, the STS is 9; D left ventricular wall thickening in the 17-segmentation of the patient with old MI, the STS is 22.
Among the 92 patients, 43 patients (46.7%) had LV remodeling assessed by gated MPI according to the cutoff value (LVEDVi = 62.53 ml/m2) of the low-risk patients as defined in the Methods section. There were significant differences between patients with and without LV remodeling for STS, TPD, viable myocardium, scar, the proportion of segments with reduced wall thickening in segments with normal perfusion, and the proportion of segments with reduced wall thickening in segments with decreased perfusion (Figure 4). Age, gender, Canadian class classification of angina pectoris (CCS), New York Heart Association classification of heart failure (NYHA), clinical risk factors (such as diabetes, hypertension, hyperlipidemia, chronic obstructive pulmonary disease (COPD), and history of angina pectoris showed no significant difference between the two groups (Table 3).
Figure 4.
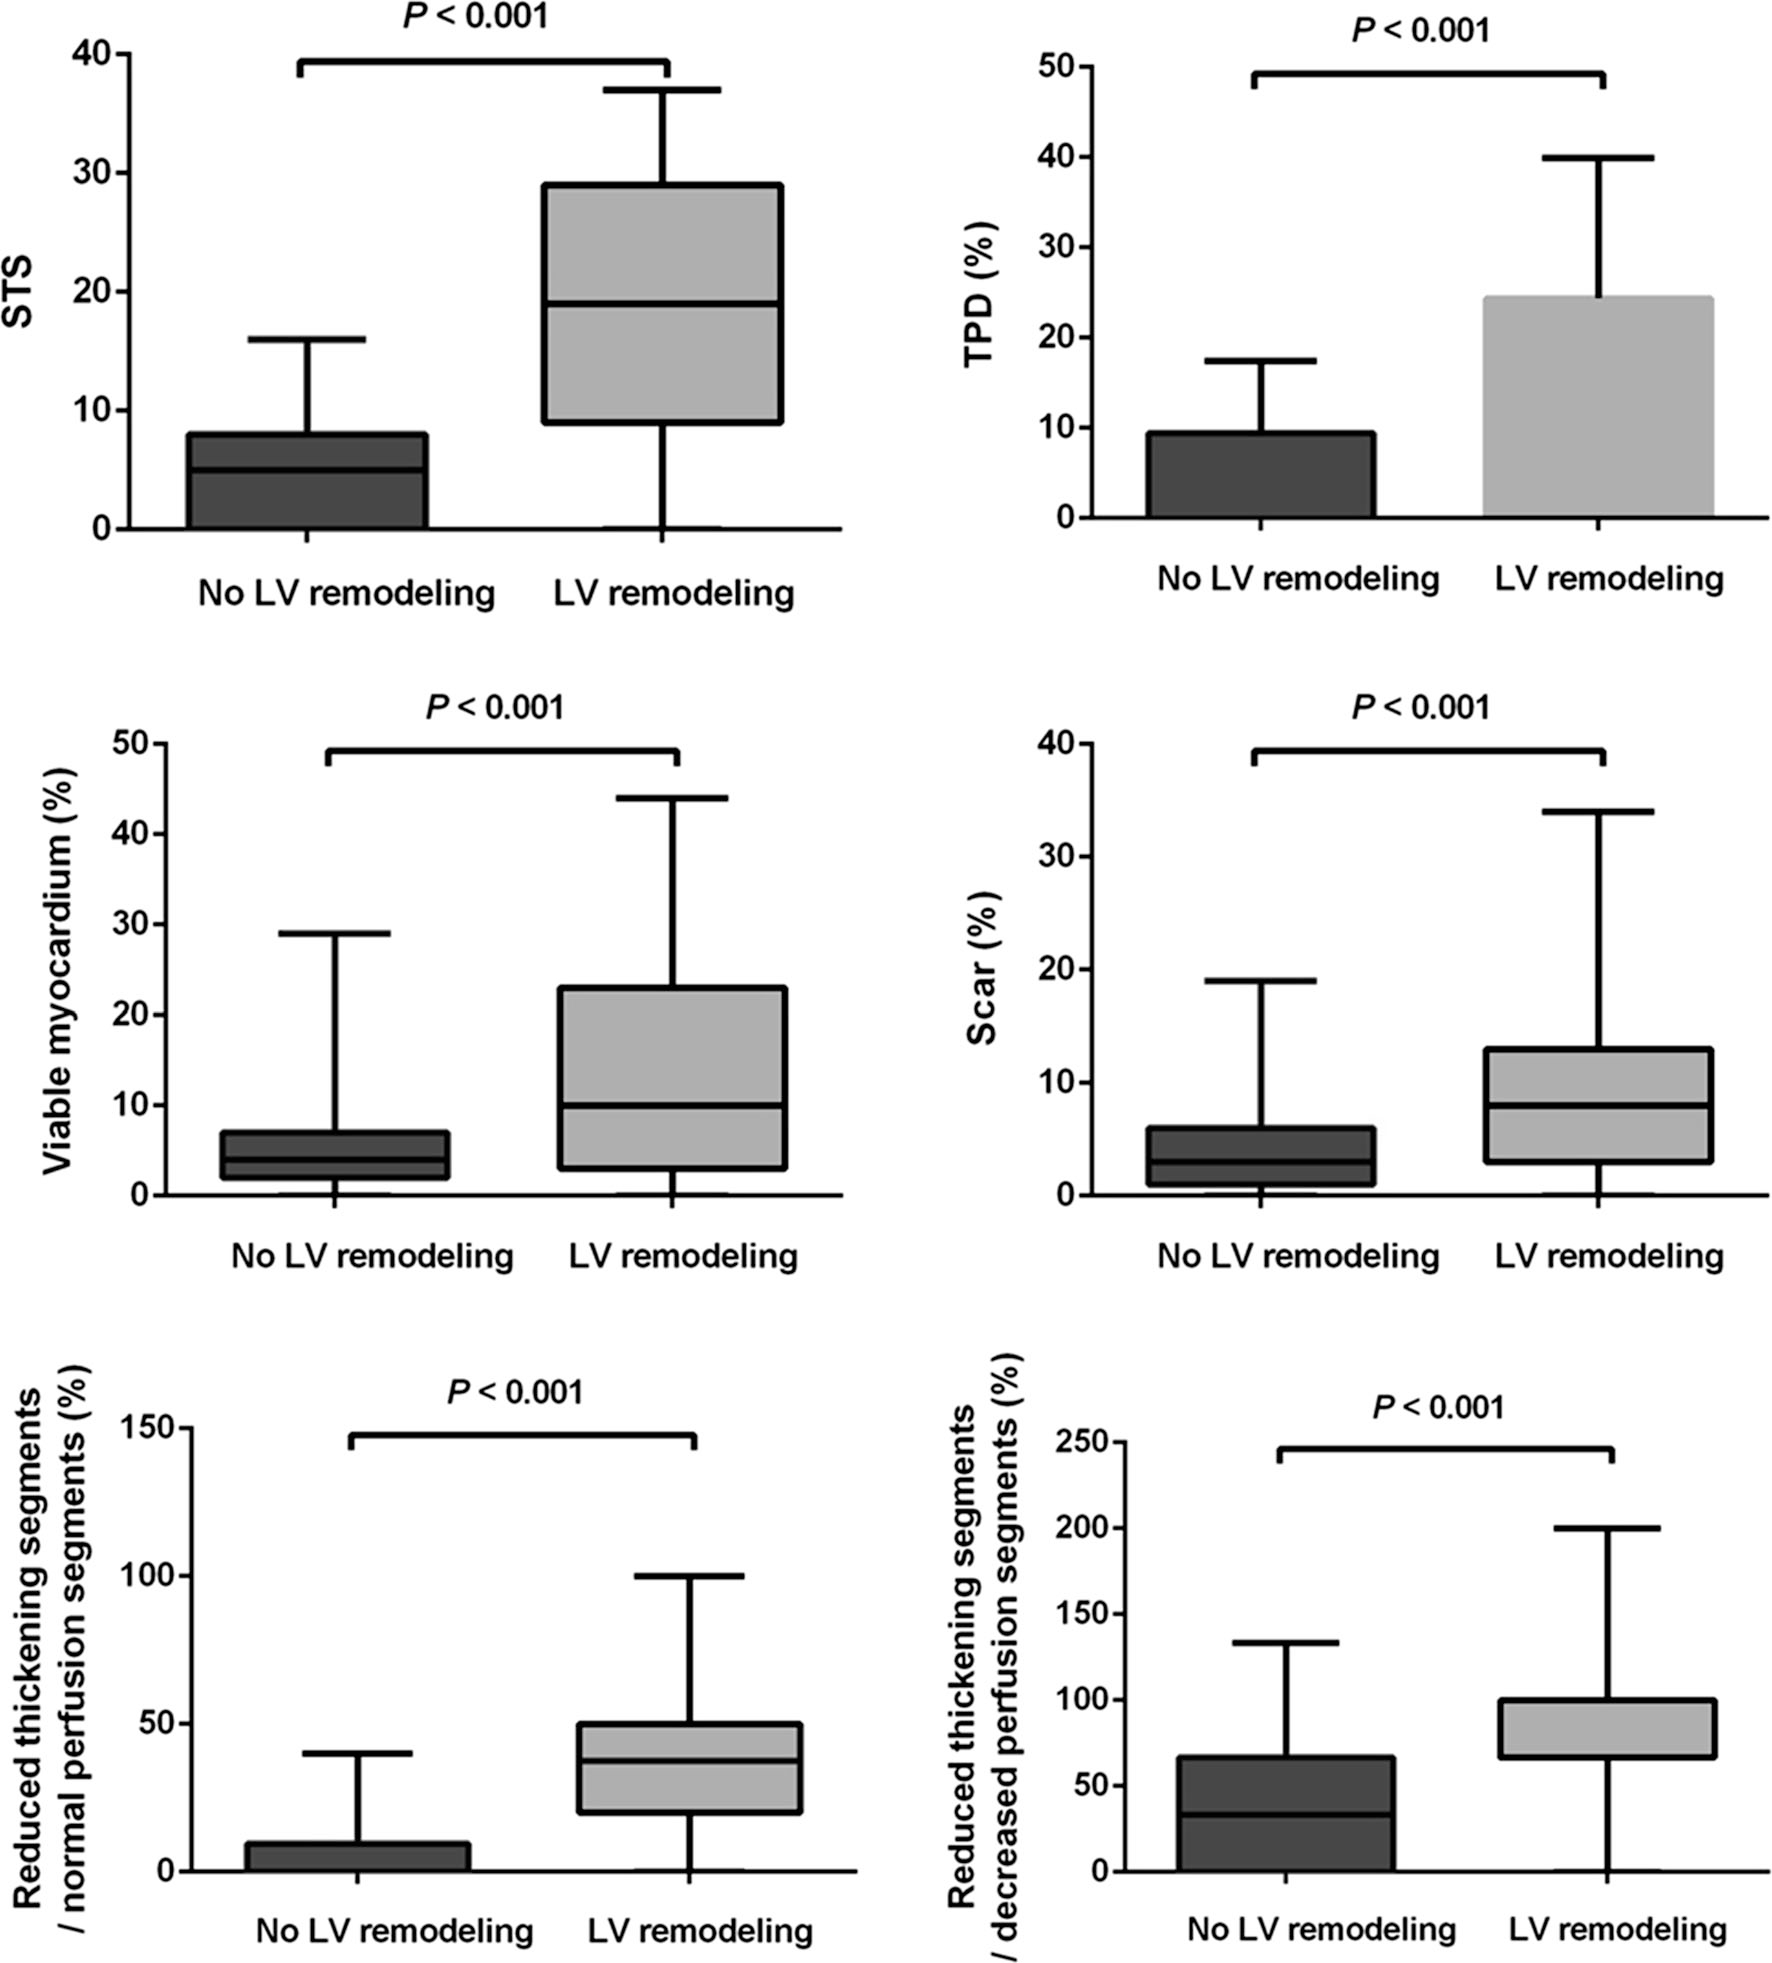
Comparisons of STS, TPD, viable myocardium, scar, and the proportion of segments with reduced wall thickening in segments with normal perfusion and decreased perfusion between the patients with and without LV remodeling.
Table 3.
Comparison between the LV remodeling and non-LV remodeling group
| No LV remodeling (n = 49) | LV remodeling (n = 43) | T, z or χ2 | P value | |
|---|---|---|---|---|
|
| ||||
| Age (years) | 63.6 ± 8.4 | 62.0 ± 8.8 | 0.838 | .404 |
| Males, n | 40 (81.6%) | 36 (83.7%) | 0.070 | .792 |
| BMI (kg/m2) | 24.80 ± 3.06 | 24.34 ± 2.98 | 0.732 | .466 |
| Hypertension, n | 40 (81.6%) | 28 (65.1%) | 3.240 | .072 |
| Diabetes, n | 14 (28.6%) | 17 (39.5%) | 1.232 | .267 |
| Hyperlipidemia, n | 8 (16.3%) | 3 (7.0%) | 1.902 | .168 |
| COPD, n | 1 (2%) | 1 (2.3%) | 0.009 | .926 |
| History of angina pectoris, n | 42 (85.7%) | 32 (74.4%) | 1.857 | .173 |
| CCS class | 1.63 ± 1.11 | 1.42 ± 1.07 | 0.938 | .351 |
| NYHA class | 1.75 ± 1.00 | 1.95 ± 1.27 | − 0.827 | .411 |
| LVEDVi (ml/m2) | 48.56 ± 7.70 | 100.48 ± 35.51 | − 9.980 | < .001 |
| LVESVi (ml/m2) | 20.27 ± 5.60 | 68.21 ± 37.22 | − 8.908 | < .001 |
| LVEF (%) | 58.76 ± 7.93 | 35.56 ± 13.47 | 10.210 | < .001 |
| STS | 5 (0–8) | 19 (9–29) | − 6.260 | < .001 |
| TPD (%) | 9.43 ± 7.97 | 24.37 ± 15.57 | − 5.897 | < .001 |
| Viable myocardium (%) | 4 (2–7) | 10 (3–23) | − 3.804 | < .001 |
| Scar (%) | 3 (1–6) | 8 (3–13) | − 4.145 | < .001 |
| Reduced thickening segments/normal perfusion segments (%) | 0.00 (0.00–9.55) | 37.5 (20–50) | − 5.842 | < .001 |
| Reduced thickening segments/decreased perfusion segments (%) | 33.33 (0.00–66.67) | 100.00 (66.67–100.00) | − 4.787 | < .001 |
BMI, Body mass index; COPD, chronic obstructive pulmonary disease; CCS, Canadian class classification of angina pectoris; NYHA, New York Heart Association classification of heart failure; LVEDVi, left ventricular end-diastolic volume index; LVESVi, left ventricular end-systolic volume index; LVEF, left ventricular ejection fraction; STS, summed thickening score; TPD, total perfusion deficit
In the univariate regression model (Table 4), STS, TPD, viable myocardium, scar, the proportion of segments with reduced wall thickening in segments with normal perfusion, and the proportion of segments with reduced wall thickening in segments with decreased perfusion were identified as the risk factors of LV remodeling in MI patients, whereas age, gender, and other clinical data were not predictive for LV remodeling. Moreover, in the multivariate binary regression model including STS, TPD, viable myocardium, scar, the proportion of segments with reduced wall thickening in segments with normal perfusion and decreased perfusion, STS (Odds ratio, 1.296; P = .004), and the proportion of segments with reduced wall thickening in segments with normal perfusion (Odds ratio, 1.110; P = .001) were identified as the independent factors of LV remodeling in those patients (Table 5). In the 1564 myocardial segments of 92 patients, there were 472 myocardial segments with decreased myocardial perfusion and 556 myocardial segments with reduced wall thickening. In addition, there were 194 myocardial segments with reduced wall thickening but normal myocardial perfusion (Figure 5).
Table 4.
Univariate regression model
| Odds ratio | 95% CI odds ratio | P value | |
|---|---|---|---|
|
| |||
| Age | 0.979 | 0.933–1.028 | .399 |
| Gender | 1.157 | 0.391–3.426 | .792 |
| Hypertension | 0.420 | 0.161–1.094 | .076 |
| Diabetes | 1.635 | 0.684–3.904 | .269 |
| Hyperlipidemia | 0.384 | 0.095–1.553 | .180 |
| COPD | 1.195 | 0.072–19.706 | .901 |
| History of angina pectoris | 0.485 | 0.169–1.390 | .178 |
| CCS class | 0.833 | 0.568–1.221 | .349 |
| NYHA class | 1.171 | 0.811–1.692 | .399 |
| Summed thickening score | 1.246 | 1.137–1.365 | < .001 |
| TPD | 1.105 | 1.056–1.157 | < .001 |
| Viable myocardium | 1.133 | 1.059–1.213 | < .001 |
| Scar | 1.158 | 1.062–1.261 | .001 |
| Reduced thickening segments/normal perfusion segments (%) | 1.104 | 1.058–1.151 | < .001 |
| Reduced thickening segments/decreased perfusion segments (%) | 1.029 | 1.016–1.042 | < .001 |
COPD, Chronic obstructive pulmonary disease; CCS, Canadian class classification of angina pectoris; NYHA, New York Heart Association classification of heart failure; STS, summed thickening score; TPD, total perfusion deficit
Table 5.
Multivariate regression model
| Odds ratio | 95% CI Odds ratio | P value | |
|---|---|---|---|
|
| |||
| STS | 1.296 | 1.084–1.549 | .004 |
| TPD | 0.452 | 0.116–1.760 | .252 |
| Viable myocardium | 2.135 | 0.537–8.485 | .282 |
| Scar | 2.188 | 0.543–8.816 | .271 |
| Reduced thickening segments/normal perfusion segments (%) | 1.110 | 1.041–1.184 | .001 |
| Reduced thickening segments/decreased perfusion segments (%) | 0.995 | 0.974–1.016 | .654 |
STS, Summed thickening score; TPD, total perfusion deficit
Figure 5.

Myocardial perfusion and wall thickening of 1564 segments in the 92 MI patients.
DISCUSSION
Among the present study population, LV remodeling and cardiac dysfunction were more severe in old MI group as compared to the subacute MI group. The multivariate binary regression model analysis showed that among the myocardial perfusion and metabolism parameters, wall thickening abnormities as expressed by STS and the proportion of segments with reduced wall thickening in segments with normal perfusion showed the closest relationship with LV remodeling in MI patients, indicating that the abnormal wall thickening, especially the abnormal wall thickening in remote areas, plays an important role in LV remodeling, which emphasized the importance of the remote regional function after MI. In addition, the univariate regression model analysis also indicated significant correlation between LV remodeling and TPD, viable myocardium, scar, and the proportion of segments with reduced wall thickening in segments with decreased perfusion.
LV remodeling is a progressive process, which starts very soon after MI, even though its clinical symptoms may not be demonstrated for years.17 Although in the early period after MI, left ventricle dilates as a compensatory mechanism to improve LV pumping function (through the Frank Starling mechanism) as well as myocardial hypertrophy in the non-infarcted areas which is compensatory and aimed at preserving cardiac output in response to infarcted myocardium; those changes through a positive feedback loop by the Laplace relationship can lead to progressive adverse LV remodeling and to heart failure.18,19 This study found that LV remodeling, cardiac dysfunction, and perfusion deficits were significantly more severe in the old MI group while compared to the subacute MI group, indicating that there was a time dependency of the LV remodeling process after MI and larger infarct size correlated with greater adverse LV remodeling. In addition, more severe abnormal wall thickening was also seen in the old MI group, which suggested that it might play an important role in the progressive LV remodeling process.
Lund et al.20 found that infarct size was a powerful predictor for LV remodeling in patients with reperfused MI by using contrast-enhanced MR. Berti et al.7 found that the infarct severity (mainly the degree of transmural infarction) was more valuable than infarct size in predicting LV remodeling. O’Regan et al.21 also demonstrated that the degree of transmural MI measured by CMR played an important role in regional LV remodeling after a year. However, different from the above studies, our study suggested the closest relationship between wall thickening abnormities and LV remodeling in MI patients. Several factors may contribute to the differences. First, Berti et al. determined the infarct size as perfusion defect at rest which was quantified as percentage of LV wall, with the threshold at 60% of peak uptake in MPI and Lund et al. determined the infarct size by contrast-enhanced MR. However, our study determined the scar size by combining SPECT MPI and 18F-FDG PET imaging as described in the Methods section. Differences in calculating scar size contributed to the variances. Second, the different characteristics of the selected cohort between those studies may be another important factor. Patients with MI were enrolled in the studies of Lund and Berti and the threshold of infarct size for predicting LV remodeling were 24% and 22.3%, respectively. However, all subjects enrolled in our study had definite perfusion deficit but the scar size was significantly smaller, which may lower the effect of scar size in the multivariate binary regression model of LV remodeling. Besides, the degree of transmural MI was not analyzed in our study. To our knowledge, it is the first time that the global wall thickening abnormalities as expressed by STS from gated MPI have been found to be the independent factors associated with LV remodeling.
Previous animal studies indicated a close relationship between myocardial wall thickening and coronary artery flow, and the reduction in blood flow of around 10–20% was found to impair regional (but not global) wall thickening within an ischemic zone.22 However, a CMR study indicated the reduction of wall thickening and contractility in the remote non-infarct regions of patients both with acute and chronic MI, which was closely related to extracellular matrix expansion induced by inflammatory response after MI.23 In our study, segments with abnormal wall thickening were more than those with myocardial perfusion deficit and there were 194 segments with reduced wall thickening but normal perfusion, furthermore, the proportion of segments with reduced wall thickening in segments with normal perfusion also showed well correlation with LV remodeling after MI in the multivariate regression model, which indicated that remote myocardial function had been already impaired although with no abnormalities in MPI and wall thickening was more effective than myocardial perfusion in reflecting myocardial injury. LV wall thickening is mainly the thickening of inner myocardium layer, while the middle and outer layer of myocardium have limited effect on wall thickening. Subendocardial myocardium is more prone to ischemia. Ishizu et al.24 suggested that subendocardial wall thickening had been impaired in patients with coronary artery disease even when the global wall thickening abnormality was not significant and reduced wall thickening may be an important marker of severe coronary stenosis. Moreover, global wall thickening abnormalities also develop progressively with increased coronary stenosis.22 According to the Laplace’s law, LV wall stress is proportional to the ventricular cavity pressure and radius, and inversely proportional to the wall thickness. When the wall thickening and contractility of ischemic myocardium decrease, the LV wall stress and myocardial oxygen consumption will increase, which leads to more severe myocardial contractile dysfunction, myocardial ischemia, and increased ventricular pressure load, thus resulting in the further LV enlargement and worse LV function. Therefore, wall thickening abnormalities may be an important factor correlated with LV remodeling in MI patients. It is a new finding that the global abnormal wall thickening, especially the abnormal wall thickening in remote areas, plays an important role in the process of LV remodeling after MI, which can suggest the importance of the function in the remote regions. Early assessment of severity of global wall thickening abnormalities especially the function of the remote regions in MI patients and effective therapy to improve wall thickening abnormalities may contribute to prevent or reverse progressive LV remodeling.
LIMITATION
This study has the following limitations that should be considered. The patient population is relatively small and retrospectively selected. Patients enrolled in this study had mildly impaired or even normal LV function and small infarct size, which lowers the effect of scar size in LV remodeling in this population. Therefore, our results that STS is the most relevant factor in LV remodeling might not be applied to those with severe impaired LV function and extensive infarction. A cohort of MI patients with different severity will be enrolled in the further study to examine the role of STS in LV remodeling of the whole MI populations. Finally, it is not clear whether STS can predict the progression of LV remodeling or its improvement after treatment in MI patients due to the lack of follow-up and prognosis evaluation, so further prospective studies with a large sample size and follow-up are needed to address this issue.
NEW KNOWLEDGE GAINED
This study to our knowledge firstly identified the influence of LV wall thickening abnormalities from gated MPI to LV remodeling in MI patients. STS and the proportion of segments with reduced wall thickening in segments with normal perfusion were identified as the independent factors of LV remodeling in MI patients. TPD, viable myocardium, scar, and the proportion of segments with reduced wall thickening in segments with decreased perfusion showed strong correlations with LV remodeling as well.
CONCLUSIONS
LV remodeling in old MI patients is more extensive and severe than those with subacute MI. LV wall thickening abnormalities as expressed by STS and the proportion of segments with reduced wall thickening in segments with normal perfusion are the independent factors of LV remodeling in MI patients.
Supplementary Material
Acknowledgements
This research was supported by grants from National Natural Science Foundation of China (Project Number: 81471690, PI: Yuetao Wang), Key Research Foundation of Jiangsu Province (Project Number: BE2015635, PI: Yuetao Wang), Major Project of Changzhou City Health Bureau (Project Number: ZD201409, PI: Xiaosong Wang), and Application and Basic Research Funds of Changzhou Science and Technology Bureau ((Project Number: J20160030, PI: Ling Yang). This research was also supported by a grant from the American Heart Association (Project Number: 17AIREA33700016, PI: Weihua Zhou) and a New Faculty startup grant from the University of Southern Mississippi (Project Number: DE01791, PI: Weihua Zhou).
Abbreviations
- LV
Left ventricular
- LVEF
Left ventricular ejection fraction
- CMR
Cardiac magnetic resonance
- MI
Myocardial infarction
- SPECT
Single photon emission computed tomography
- MPI
Myocardial perfusion imaging
- ECG
Electrocardiogram
- 18F-FDG
18F-fluorodeoxyglucose
- PET
Positron emission tomography
- STS
Summed thickening score
- TPD
Total perfusion deficit
- 99mTc-MIBI
99mTc-sestamibi
- LVEDV
Left ventricular end-diastolic volume
- LVESV
Left ventricular end-systolic volume
- CCS
Canadian class classification of angina pectoris
- NYHA
New York Heart Association classification of heart failure
- COPD
Chronic obstructive pulmonary disease
Footnotes
Disclosures
None of the authors have any relevant conflicts of interest.
Electronic supplementary material The online version of this article (https://doi.org/10.1007/s12350-018-1200-4) contains supplementary material, which is available to authorized users.
The authors of this article have provided a PowerPoint file, available for download at SpringerLink, which summarises the contents of the paper and is free for re-use at meetings and presentations. Search for the article DOI on SpringerLink.com
References
- 1.Verma A, Meris A, Skali H, Ghali JK, Arnold JM, Bourgoun M, et al. Prognostic implications of left ventricular mass and geometry following myocardial infarction: the VALIANT (VALsartan In Acute myocardial iNfarcTion) Echocardiographic Study. JACC Cardiovasc Imaging 2008;1:582–91. [DOI] [PubMed] [Google Scholar]
- 2.Bax JJ, Schinkel AF, Boersma E, Elhendy A, Rizzello V, Maat A, et al. Extensive left ventricular remodeling does not allow viable myocardium to improve in left ventricular ejection fraction after revascularization and is associated with worse long-term prognosis. Circulation 2004;110:18–22. [DOI] [PubMed] [Google Scholar]
- 3.Bonow RO, Castelvecchio S, Panza J, Berman D, Velazquez E, Michler R, et al. Does severity of left ventricular remodeling influence the relation between myocardial viability and survival with medical or surgical therapy in patients with coronary artery disease and left ventricular dysfunction? J Am Coll Cardiol 2014;63:A1625. [Google Scholar]
- 4.Anagnostopoulos CD, Cokkinos DV. Prediction of left ventricular remodelling by radionuclide imaging. Eur J Nucl Med Mol Imaging 2011;38:1120–3. [DOI] [PubMed] [Google Scholar]
- 5.Konstam MA, Kramer DG, Patel AR, Maron MS, Udelson JE. Left ventricular remodeling in heart failure: current concepts in clinical significance and assessment. JACC Cardiovasc Imaging 2011;4:98–108. [DOI] [PubMed] [Google Scholar]
- 6.Wei H, Tian C, Schindler TH, Qiu M, Lu M, Shen R, et al. The impacts of severe perfusion defects, akinetic/dyskinetic segments, and viable myocardium on the accuracy of volumes and LVEF measured by gated (99m)Tc-MIBI SPECT and gated (18)F-FDG PET in patients with left ventricular aneurysm: cardiac magnetic reson. J Nucl Cardiol 2015;22:785. [DOI] [PubMed] [Google Scholar]
- 7.Berti V, Sciagra R, Acampa W, Ricci F, Cerisano G, Gallicchio R, et al. Relationship between infarct size and severity measured by gated SPECT and long-term left ventricular remodelling after acute myocardial infarction. Eur J Nucl Med Mol Imaging 2011;38:1124–31. [DOI] [PubMed] [Google Scholar]
- 8.Nijland F, Kamp O, Verhorst PMJ, Voogt WGD, Bosch HG, Visser CA. Myocardial viability: impact on left ventricular dilatation after acute myocardial infarction. Heart (British Cardiac Society) 2002;87:17–22. [DOI] [PMC free article] [PubMed] [Google Scholar]
- 9.Götte MJW, van Rossum AC, Twisk JWR, Kuijer JPA, Marcus JT, Visser CA. Quantification of regional contractile function after infarction: strain analysis superior to wall thickening analysis in discriminating infarct from remote myocardium. J Am Coll Cardiol 2001;37:808–17. [DOI] [PubMed] [Google Scholar]
- 10.Uebleis C, Hoyer X, Van Kriekinge SD, Schuessler F, Laubender RP, Becker A, et al. Association between left ventricular mechanical dyssynchrony with myocardial perfusion and functional parameters in patients with left bundle branch block. J Nucl Cardiol 2013;20:253–61. [DOI] [PubMed] [Google Scholar]
- 11.Tilkemeier PL. ASNC imaging guidelines for nuclear cardiology procedures standardized reporting of myocardial perfusion images. J Nucl Cardiol 2009;16:651. [DOI] [PubMed] [Google Scholar]
- 12.Xu Y, Fish M, Gerlach J, Lemley M, Berman DS, Germano G, et al. Combined quantitative analysis of attenuation corrected and non-corrected myocardial perfusion SPECT: Method development and clinical validation. J Nucl Cardiol 2010;17:591. [DOI] [PMC free article] [PubMed] [Google Scholar]
- 13.Sharir T, Berman DS, Waechter PB, Areeda J, Kavanagh PB, Gerlach J, Sharir T, Berman DS, Waechter PB, et al. Quantitative analysis of regional motion and thickening by gated myocardial perfusion SPECT: Normal heterogeneity and criteria for abnormality. J Nucl Med 2001;42:1630–8. [PubMed] [Google Scholar]
- 14.Akincioglu C, Berman DS, Nishina H, Kavanagh PB, Slomka PJ, Abidov A, et al. Assessment of diastolic function using 16-frame 99mTc-sestamibi gated myocardial perfusion SPECT: normal values. J Nucl Med 2005;46:1102–8. [PubMed] [Google Scholar]
- 15.Zhang X, Liu XJ, Wu Q, Shi R, Gao R, Liu Y, et al. Clinical outcome of patients with previous myocardial infarction and left ventricular dysfunction assessed with myocardial (99m)Tc-MIBI SPECT and (18)F-FDG PET. J Nucl Med 2001;42:1166. [PubMed] [Google Scholar]
- 16.Beanlands RSB, Ruddy TD, Dekemp RA, Iwanochko RM, Coates G, Freeman M, et al. Positron emission tomography and recovery following revascularization (PARR-1): the importance of scar and the development of a prediction rule for the degree of recovery of left ventricular function. J Am Coll Cardiol 2002;40:1735–43. [DOI] [PubMed] [Google Scholar]
- 17.Gajarsa JJ, Kloner RA. Left ventricular remodeling in the post-infarction heart: a review of cellular, molecular mechanisms, and therapeutic modalities. Heart Fail Rev 2011;16:13–21. [DOI] [PubMed] [Google Scholar]
- 18.Westman PC, Lipinski MJ, Luger D, Waksman R, Bonow RO, Wu E, et al. Inflammation as a driver of adverse left ventricular remodeling after acute myocardial infarction. J Am Coll Cardiol 2016;67:2050. [DOI] [PubMed] [Google Scholar]
- 19.Bhatt AS, Ambrosy AP, Velazquez EJ. Adverse remodeling and reverse remodeling after myocardial infarction. Curr Cardiol Rep 2017;19:71. [DOI] [PubMed] [Google Scholar]
- 20.Lund GK, Stork A, Muellerleile K, Barmeyer AA, Bansmann MP, Knefel M, et al. Prediction of left ventricular remodeling and analysis of infarct resorption in patients with reperfused myocardial infarcts by using contrast-enhanced MR imaging. Radiology 2007;245:95–102. [DOI] [PubMed] [Google Scholar]
- 21.O’Regan DP, Shi W, Ariff B, Baksi AJ, Durighel G, Rueckert D, et al. Remodeling after acute myocardial infarction: mapping ventricular dilatation using three dimensional CMR image registration. J Cardiovasc Magn Reson 2012;14:1–9. [DOI] [PMC free article] [PubMed] [Google Scholar]
- 22.Vatner SF. Correlation between acute reductions in myocardial blood flow and function in conscious dogs. Circ Res 1980;47:201. [DOI] [PubMed] [Google Scholar]
- 23.Chan W, Duffy SJ, White DA, Gao XM, Du XJ, Ellims AH, et al. Acute Left ventricular remodeling following myocardial infarction: Coupling of regional healing with remote extracellular matrix expansion. Jacc Cardiovasc Imaging 2012;5:884–93. [DOI] [PubMed] [Google Scholar]
- 24.Ishizu T, Seo Y, Baba M, Machino T, Higuchi H, Shiotsuka J, et al. Impaired subendocardial wall thickening and post-systolic shortening are signs of critical myocardial ischemia in patients with flow-limiting coronary stenosis. Circ J 2011;75:1934–41. [DOI] [PubMed] [Google Scholar]
Associated Data
This section collects any data citations, data availability statements, or supplementary materials included in this article.