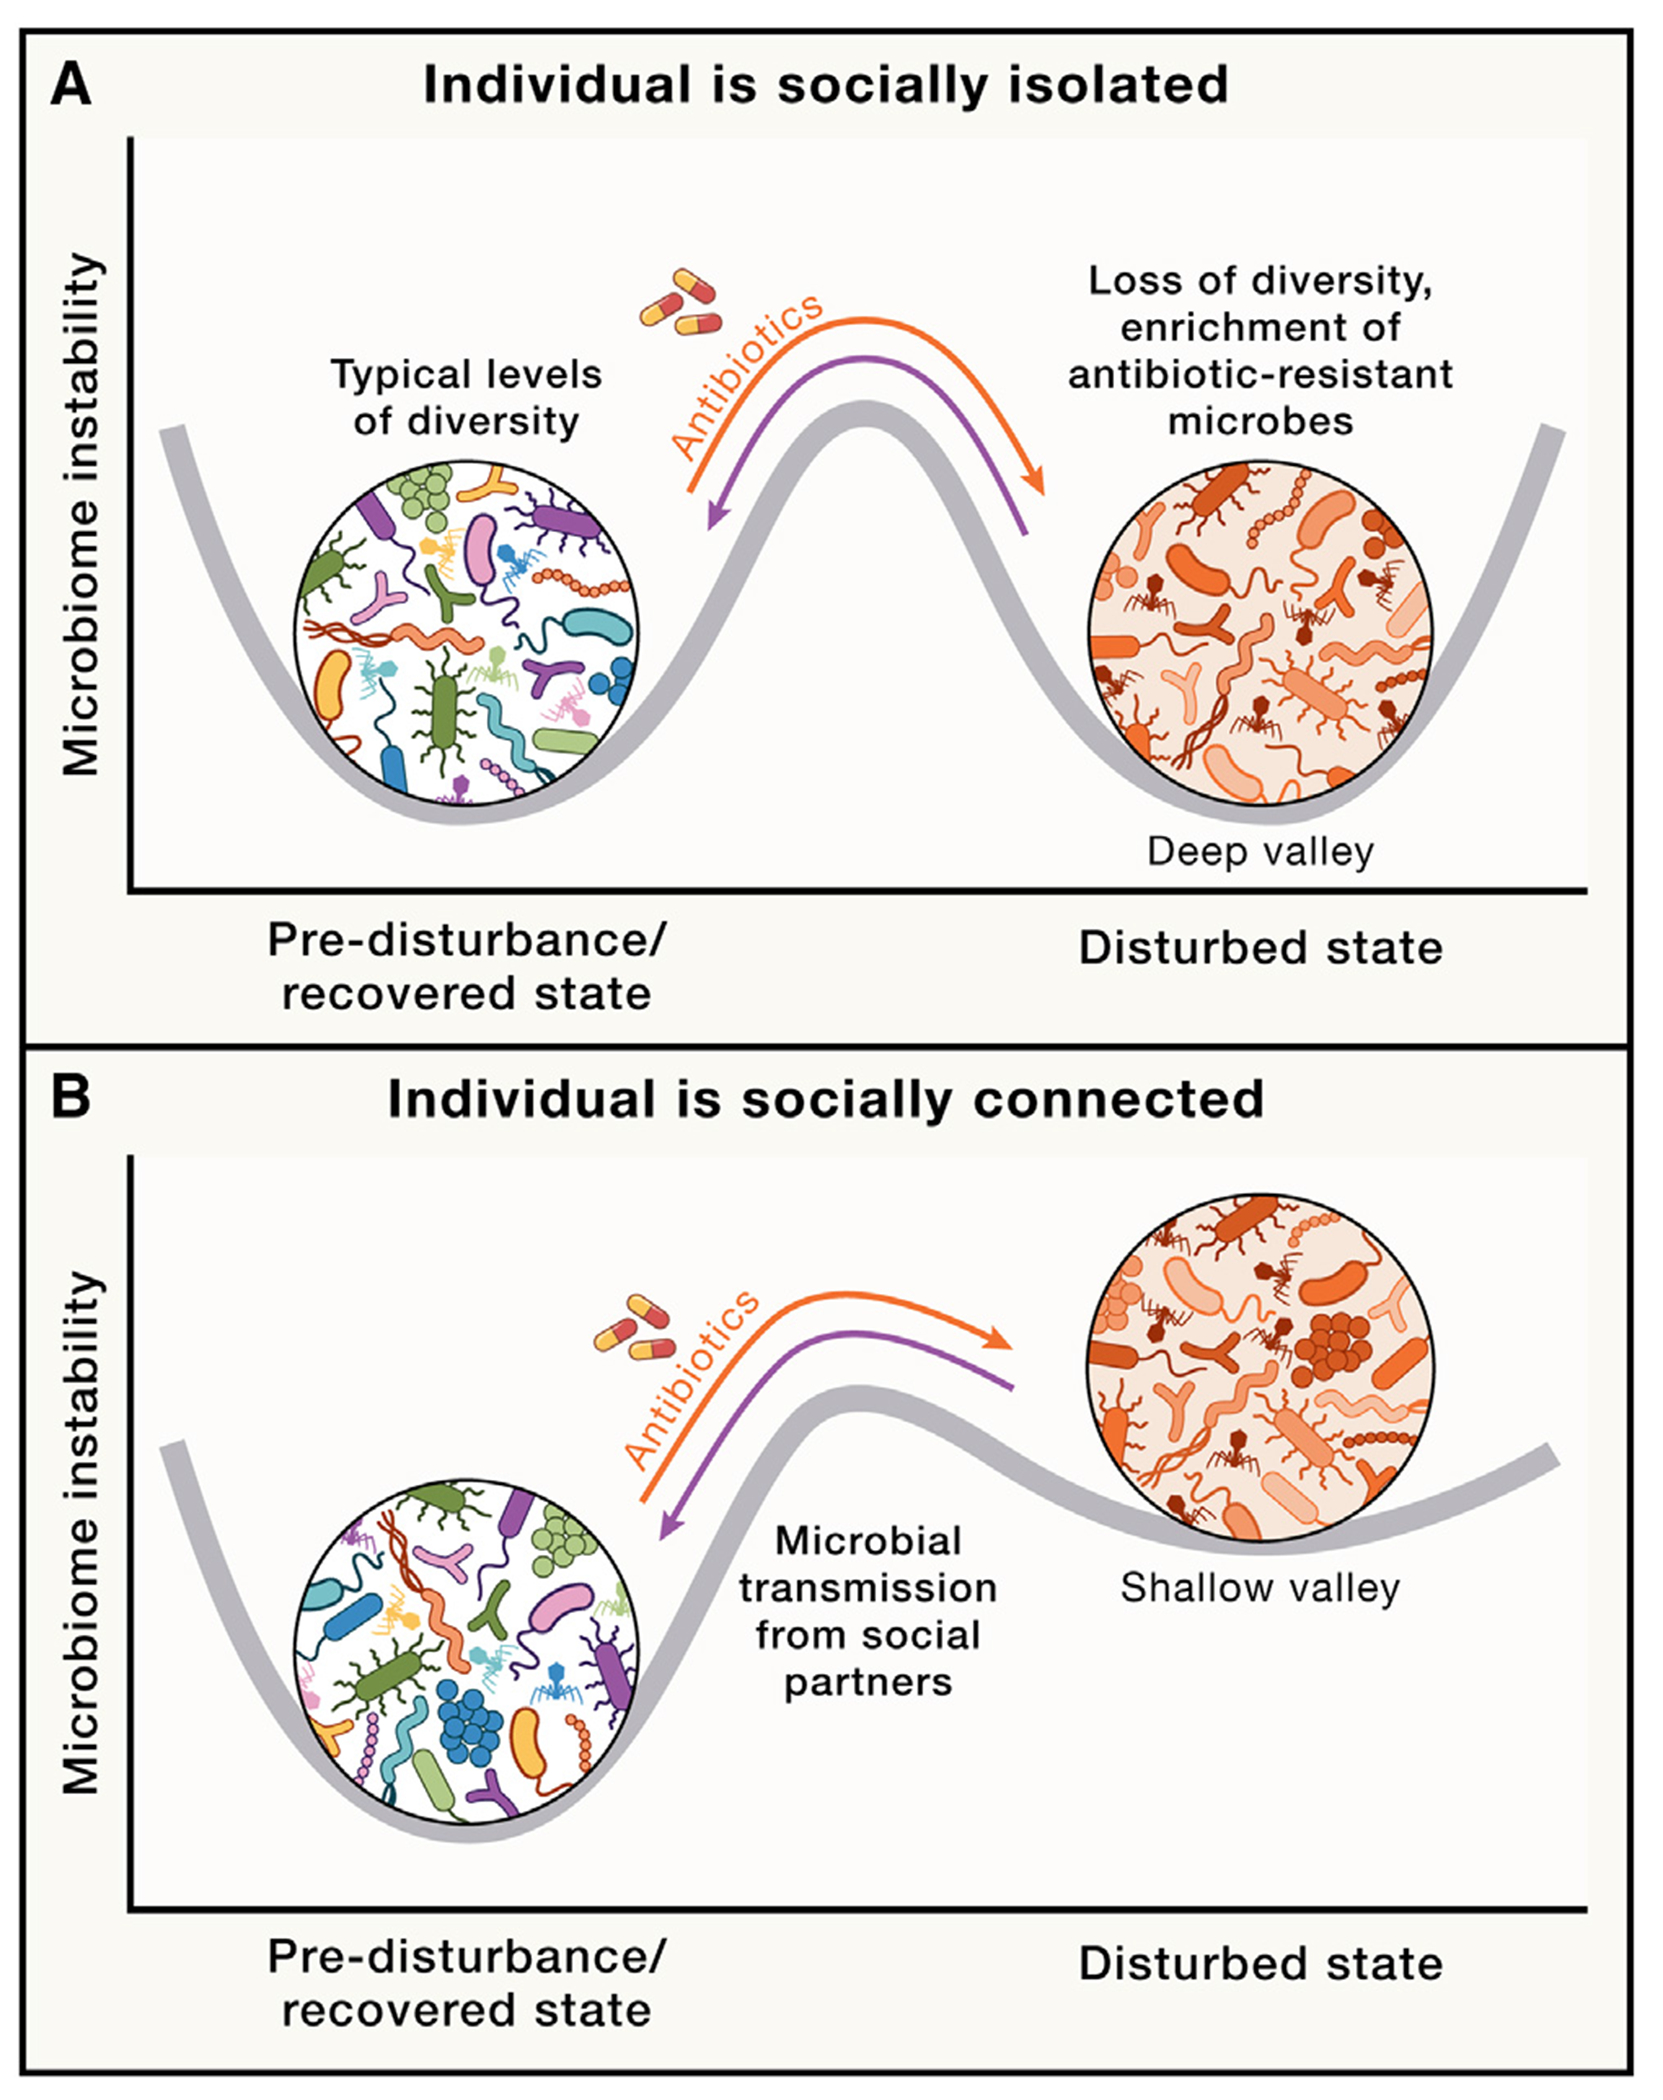
Figure 4. Stability landscape of the gut microbiome in the social microbiome.

Stability landscapes provide useful views of how microbiomes react to, and recover from, ecological disturbances such as antibiotic exposure.23 Curved gray lines indicate possible stability landscapes of an individual’s microbiome resulting from the combined effects of within-host dynamics and inter-host microbial transmission. Deeper valleys represent higher stability (i.e., lower instability). Undisturbed, recovered, and antibiotic-disturbed states are shown. Orange and purple arrows represent transitions between undisturbed (pre-disturbance) and antibiotic-disturbed states and between antibiotic-disturbed and recovered states, respectively. Fewer opportunities for social interaction may be hypothesized to result in higher transition peaks between disturbed and recovered states, corresponding to greater difficulty in moving from disturbed to recovered states. Conversely, increased social interactions may provide a greater number of opportunities for microbes from the social microbiome to recolonize the host, resulting in shallower valleys and transition peaks, indicating greater ease in moving from disturbed to recovered states. When hosts are socially isolated, disturbed microbiome states may be as stable as undisturbed states due to lack of transmission from individuals with undisturbed microbiomes, as shown in (A). If the host with a disturbed microbiome is socially connected to many healthy hosts, the undisturbed state is expected to be more stable than the disturbed state, as shown in (B), given the effects of social transmission of gut microbiota from healthy hosts.
