

Abstract

Novel visible-light-driven Ag (X)-doped Bi2Zr2O7 (BZO) nanocomposites in pudina (P) extract (Mentha spicata L.), X-1, 3, 5, 7, and 9 mol %, were synthesized by the one-pot greener solution combustion method. The as-synthesized nanocomposite materials were characterized by using various spectral [X-ray diffraction (XRD), Fourier transform infrared, UV–visible, UV– diffuse reflectance spectra, X-ray photoelectron spectroscopy], electrochemical (cyclic voltammetry, electrochemical impedance spectroscopy), and analytical (scanning electron microscopy–energy-dispersive X-ray spectroscopy, transmission electron microscopy, Brunauer–Emmett–Teller) techniques. The average particle size of the nanocomposite material was found to be between 14.8 and 39.2 nm by XRD. The well-characterized Ag-doped BZOP nanocomposite materials exhibited enhanced photocatalytic degradation activity toward hazardous dyes such as methylene blue (MB) and rose bengal (RB) under visible light irradiation ranges between 400 and 800 nm due to their low energy band gap. As a result, 7 mol % of Ag-doped BZOP nanocomposite material exhibited excellent photodegradation activity against MB (D.E. = 98.7%) and RB (D.E. = 99.3%) as compared to other Ag-doped BZOP nanocomposite materials and pure BZOP nanocomposite, respectively, due to enhanced semiconducting and optical behaviors, high binding energy, and mechanical and thermal stabilities. The Ag-doped BZOP nanocomposite material-based electrochemical sensor showed good sensing ability toward the determination of lead nitrate and dextrose with the lowest limit of detection (LOD) of 18 μM and 12 μM, respectively. Furthermore, as a result of the initial antibacterial screening study, the Ag-doped BZOP nanocomposite material was found to be more effective against Gram-negative bacteria (Escherichia coli) as compared to Gram-positive (Staphylococcus aureus) bacteria. The scavenger study reveals that radicals such as O2•– and •OH are responsible for MB and RB mineralization. TOC removal percentages were found to be 96.8 and 98.5% for MB and RB dyes, and experimental data reveal that the Ag-doped BZOP enhances the radical (O2•– and •OH) formation and MB and RB degradation under visible-light irradiation.
Keywords: green combustion synthesis, visible-light photocatalyst, electrochemical sensor, antibacterial activity, radical scavenger study, biocompatibility study
1. Introduction
Enormous utilization of organic dye molecules in paper, dying, textile, plastic, cosmetic, and pharmaceutical industries leads to the discharge of harmful nonbiodegradable wastes as industrial effluents without any purification to the environment.1 Consequently, the discharged organic dye-contaminated wastewater effluent raises numerous hazardous issues for ecosystems in the environment. Besides, the penetration of sunlight and the presence of oxygen levels are also problems for creating a sustainable environment inside aquatic systems due to the existence of colored organic matter.2 Hence, it is indispensable to remove the organic pollutants from industrial wastewater effluents to convert water into potable water and to create an ecofriendly environment.3 Today, nanocomposite-based catalytic degradation of harmful materials under light irradiation has received much interest among researchers due to the physiochemical properties of nanocomposite materials. Recently, heterojunction/structure-based photocatalysts have focused much on dye degradation and catalytic conversion of 4-nitrophenol, H2 generation, and energy harvesting techniques due to their excellent electron–hole separation performance, wide range of light absorption, enhanced photocatalytic activity, good semiconducting property, proper band structure, harmful substances, and better reduction/oxidation ability.4 Apart from heterojunction/structure materials, bismuth [Bi2O3, Bi2WO6, BiOX (X-halogens), BiVO4] and bismuth zirconate (Bi2Zr2O7) have also received excellent attention due to their admirable catalytic properties such as band gap, stability, visible light utilization, and so forth.3−5 Bismuth zirconate (BZO) is one type of pyrochlore photocatalyst with the chemical formula A2B2O7, where A and B represent the existence of two or many metals. On the other side, the band gap energy of BZO (between 1.6 and 2.8 eV), VB (valence band) energy, and CB (conduction band) energy of BZO (about 2.75 and 0.36 eV) and the copious oxygen vacancies on the surface of BZO are responsible for its enhanced redox properties and the formation of more active species.1,6−8 However, BZO has some shortcomings, such as facile recombination of electron–holes and moderate light response, which do not limit its wide spectrum of photocatalytic applications. Liu et al. (2018) prepared BZO material by various methods to increase the specific surface area and enhance the photocatalytic ability.6 Wu et al. (2015) have reported the specific surface area of BZO photocatalysts synthesized by the solution combustion technique, and the as-synthesized photocatalysts showed excellent selectivity and degradation toward pollutants.7 Sharma et al. (2013) prepared bismuth zirconate (Bi2Zr2O7) by the solution combustion technique and performed the photocatalytic degradation of dyes in wastewater and displayed comparable photocatalytic results.8 Generally, silver (Ag) nanoparticles have some unique properties (higher surface energy, agglomeration ability, distinct shape and size, and stability), and due to these characteristics, Ag has been used in many fields, including sensors, catalysts, solar energy, bioimaging, and so forth.9,10 Zr/Zr-oxide nanomaterial is the better choice for intercalating with Ag nanomaterials owing to its unique metal–metal interaction, chemical stability, and properties. When Ag is doped with other metals and metal nanocomposites, the reactivity of the Ag nanoparticle will enhance the catalytic activity because of the aforementioned characteristics.11,12 The charge carrier recombination, inhibition photocorrosion, and plasmonic effects arise due to the incorporated/doped metal nanoparticles, especially Ag, Au, Pt, and Cu over the surface of the photoactive semiconductor.13−16 These kinds of modifications provide enhanced recombination duration for the photochemically generated electron–hole pairs and a wide spectrum of absorption in the visible-light region (400–800 nm) owing to the surface plasmonic resonance consequence.13 For instance, Ag-doped sodium bismuth titanate exhibited enhanced photocatalysis, stability, as well as reusability against the degradation of methylene blue (MB) dye.14 In addition, Ag nanoparticles have a wide band gap energy which offers enhanced absorption in the visible region. The doping of Ag nanoparticles on ZnO enhanced the photocatalytic process by foiling the electron–hole pair recombination, and the process exhibited an excellent antibacterial potential even after the cutoff of the UV light.15,16 On the global market, pudina has played a remarkable role as a medicine, diaphoretic, antiseptic, stomachic, antispasmodic, food flavoring, and spicing agent.17,18 It is also used as medicine for cold, fever, flu, motion sickness, food poisoning, poor digestion, rheumatism, hiccups, stings, earaches, flatulence, sinusitis, and so forth.19,20 The synthesis of the BZO nanocomposite with pudina leaf extract has great potential in the field of photocatalysis and is also environmentally benign. The phytochemicals present in pudina leaf extract may act as reducing or stabilizing mediators during the synthesis of nanocomposites. Herein, a greener solution combustion technique was adopted for synthesizing different mole percentages of Ag-doped BZOP nanocomposites. Various methods have been adopted for synthesizing nanocomposite materials, including high-energy ball-milling, three-dimensional printing, electrospinning, melt intercalation, solution intercalation, grafting melt intercalation, and rapid solidification processes.21,22 However, these techniques take more time, are highly expensive, require harsh conditions (high temperature and pressure), and produce toxic chemicals as byproducts. However, the one-pot green combustion method is employed for synthesizing the photocatalytic materials due to its ease of synthesis, shorter time, and high yield. It is also able to tune the morphology of the materials as compared with other methods. Heavy metal ions, such as lead, are deadly poisonous to human health and environmental sustainability. Lead poisoning leads to neurotoxic effects in humans, resulting in damage to the central nervous system (CNS) and peripheral nervous system (PNS). Inhibited growth, behavior delinquency, and knowledge infirmities are observed in children due to the small amount of lead ions (10 μg/dL) in human blood. Catastrophic health complications such as coma, confiscation, and death are also observed with the consumption of higher amounts of lead ions (greater than 70 μg/dL). Water is an important exposure source for lead ions for human health, and the level of lead contamination must be determined quantitatively.21 In addition, hypoglycemia is a disorder caused by a very low dextrose level in the blood and creates many symptoms such as faintness, perspiration, pain, appetite, and so forth. Excess alcohol and drug intake, hormonal inequity, insulinoma, and diabetes are the various causes of hypoglycemia. Thus, sensing low dextrose levels in the blood has also become important recently. Many analytical techniques are available to determine lead ions, including atomic absorption spectrometry, atomic adsorption spectrometry, spectroscopy, potentiometry, surface-enhanced Raman scattering (SERS), surface plasmon resonance (SPR) spectroscopy, inductively coupled plasma mass spectrometry, plasma optical emission spectrometry, and so forth.22−24 However, the aforementioned techniques need expensive equipment, manpower, chemicals, and time. Thus, the cyclic voltammetry (CV) technique is a simple and efficient technique for the determination of lead ions and dextrose in blood samples. Investigations of the antibacterial potentials of Ag and Ag-doped nanomaterials are essential from a clinical study point of view. In ancient times, they used Ag nanoparticles as potential antibacterial agents and found that lower concentrations of Ag did not affect human cells. Many studies have been devoted to evaluating the antibacterial potential of Ag nanomaterials, and they found that the interaction between Ag ions and bacteria depends mainly on their shape and size.25−29 They reported that Ag nanomaterials have released Ag ions that interact with the –SH groups of bacterial proteins and damaged DNA replication.26,27 Even though many reports are available for Ag nanomaterials used as antibacterial potential candidates, an exact mechanism of bacterial degradation has not yet been established.
In this present study, we have synthesized a Ag-doped Bi2Zr2O7-P (BZOP) (pudina) nanocomposite and established it as a photocatalyst. The physicochemical parameters of the as-synthesized materials have been successfully characterized using several characterization techniques. The evaluation of the photocatalytic performance of the as-synthesized photocatalyst at different concentrations of Ag dopant has been studied by the degradation of MB and RB dyes under visible-light irradiation with time. The heavy metal ion (Pb2+) and dextrose were successfully determined electrochemically using an Ag-doped BZOP nanocomposite-modified electrochemical sensor in a 0.1 M KCl solution with varying concentrations of lead nitrate and dextrose from 1 to 5 mM. In addition, the antibacterial activity of the selected Gram-positive and -negative bacteria was analyzed using the Ag-doped BZOP nanocomposite.
2. Experimental Methods
2.1. Materials
Bismuth nitrate [Bi(NO3)3·6H2O], zirconyl (IV) nitrate [ZrO(NO3)2·H2O], isopropyl alcohol (IPA), ammonium oxalate monohydrate (AO), ascorbic acid (AA), MB, rose bengal (RB), lead nitrate, dextrose, and potassium chloride were purchased from Loba Chemical Company and Sigma-Alrich Chemicals, India. Silver nitrate (AgNO3) with 99.9% purity was procured from Merck Chemicals, India. All of the reagents were of analytical (AR) grade and used as such without purification. Pudina extract was prepared using acid distillation (Soxhlet apparatus) and filtered by a Whatman grade-1 filter paper. All of the solutions were prepared with deionized water whenever required.
2.2. Techniques
The phase, composition, and crystal structure of BZOP nanocomposite and Ag-BZOP nanocomposite materials were analyzed by the powder X-ray diffraction (XRD) analysis technique at a wide angle (20–80°) using a Bruker-AXS D8 Advanced X-ray diffractometer. Transmission electron microscope imaging was also used to analyze the surface morphology, size, and shape of the as-synthesized material using a JEOL model JEM-2100 system. UV–visible diffuse reflectance spectra (UV–DRS) were recorded on Varian’s Cary 5000 UV–vis–NIR spectrophotometer for calculating the optical energy band gap (Eg) of the materials. Photocatalytic performances of the samples were estimated by degrading 40 mg/L of MB and RB dye solutions with 20 mg/L of catalyst under visible-light irradiation by varying the time from 0 to 90 min using a Jasco-V560 UV–visible spectrophotometer, in the range between 200 and 800 nm. All the photodegradation studies for MB and RB were performed using 400 W halogen lamps with wavelengths more than 400 nm and a UV cut filter in aqueous solutions. The EXTECH instrument (model: 401027, λmax = 546 nm, and light source intensity = 150 W/m2) was used at a 15 cm distance between a halogen lamp and a glass tube containing the catalyst and dye solutions. The electrochemical studies were performed using an electrochemical workstation (CH-Instrument) at 0.1 M KCl solution with conventional three-electrode systems in an N2 atmosphere. The zone of inhibition method was adopted for evaluating the antibacterial potential of the as-synthesized Ag-BZOP nanocomposite materials against Gram-positive and Gram-negative bacteria.
2.3. Synthesis of Mentha spicata L.-Mediated Ag-Doped BZOP Nanomaterials
To synthesize nanocomposite materials, a simple, facile solution combustion method was employed due to its excellent advantages over the other synthesizing techniques, such as self-propagating, high temperature, single-step synthesis, ease of operation, short period, crystalline material that can be synthesized, and different morphologies that can be obtained. Dried powder of the leaves of M. spicata L. (30 g) was used for the preparation of the extract in 250 mL of double-distilled water, which was heated at 90 °C for 30 min. Then, the extract was filtered using a Whatman-grade filter paper, and the resultant extract solution was kept at room temperature. For the synthesis of Ag-doped BZOP nanocomposite material by the green combustion method, three precursor compounds were used, including Bi(NO3)3·6H2O and ZrO(NO3)2·H2O (dissolved in DD water), and 1, 3, 5, 7, and 9 M solutions of AgNO3 were dissolved in 40 mL of M. spicata L. leaf extracts. The reaction mixture mentioned above was kept inside the solution combustion chamber and heated at 450 ± 5 °C for 10 min. After the solution combustion process, the resultant composite was calcined at 550 °C for 4 h, and then a grayish-pale yellow color mixture was obtained, which was used for further characterization and experimental study of this present work.
2.4. Preparation of an Experimental Method and Evaluation of Degradation Parameters
An amount of 20 mg/L of Ag-doped BZOP nanocomposite was dispersed in a beaker containing 40 mg/L of MB and RB dye solutions, and the reaction mixture was continuously stirred in a dark condition before light irradiation for 15 min to attain the adsorption–desorption equilibrium. About 5 mL of the reaction mixture was withdrawn at fixed time intervals and centrifuged. The concentrations of the dyes were monitored by probing their absorbance (λmax) at 660 and 550 nm. The photocatalytic performance of different molar ratios of Ag-doped BZOP nanocomposites was analyzed following the same procedure as that discussed above. After the combustion process, the resultant composite was calcined at 550 °C for 4 h, and then a grayish-pale yellow color mixture was obtained, which was used for further characterization and the experimental study of this present work. The photodegradation efficiency of the as-synthesized nanocomposites was calculated using the following equation (eq 1).
| 1 |
where C0 is the initial concentration of dye and Ct is the concentration of dye after irradiation. The rate constants for the degradation of MB and RB dyes in the presence of nanocomposite photocatalysts were evaluated by fitting the degradation profiles in a first-order equation (eq 2).
| 2 |
where C is the concentration after degradation, C0 is the concentration of the dye after adsorption in the dark, k is rate constant, and t is time for light irradiation.
3. Results and Discussion
3.1. Characterization of Ag-Doped BZOP Nanomaterial
The functional group analysis of BZOP and Ag-doped BZOP nanomaterials (from 1 to 9 mol %) was done using Fourier transform infrared (FTIR) spectral technique in the wavenumber ranges between 500 and 4000 cm–1, and the obtained FTIR spectra are shown in Figure 1. The BZOP nanomaterial exhibited FTIR bands at 433, 916, 1123, 1562, and 3530 cm–1. The peak at 400–600 cm–1 corresponds to Bi–O and Zn–O vibrational bands, and the peaks at 916 and 1123 cm–1 revealed the C–H vinyl and bending vibrations, respectively.15,30 The FTIR peaks at 460 cm–1 indicated the Zr–O–Zr bond (deformation mode), with the peaks at 1002 and 1109 cm–1 corresponding to the stretching vibrations of the terminal Zr–O bond.29−31 The FTIR bands at 1562 and 3530 cm–1 matched the –OH stretching and bending present in the adsorbed water molecule (Figure 1a). The peaks at 3450, 1685, and 1505 cm–1 concern the hydroxyl, carbonyl, and double-bonded (C=C) carbons of aromatic compounds present in the pudina leaf extract. When Ag doped with BZOP, the peaks at 400–600 cm–1 disappeared, and the new peaks at 1154, 1398, and 1647 cm–1 revealed the existence of Ag in BZOP. In addition, the intensity of the peaks was increased by increasing the Ag concentration (from 1 to 9 mol % of Ag) (Figure 1b–f) due to agglomeration of Ag on the surface of the BZOP nanomaterial.15,31
Figure 1.

FTIR spectra of the as-synthesized BZOP and different mol % (1–9 mol %) of Ag-doped BZOP nanomaterials.
The pure BZOP and Ag-doped BZOP nanocomposite materials were analyzed by a high-resolution XRD technique, and the obtained XRD patterns are shown in Figure 2a–f. Figure 2a ascribes the XRD pattern of BZOP, which well matched with the standard δ-FCC structure of Bi2O3.32 In addition, small shifted peaks were also observed, owing to the replacement of Bi3+ ions with Zr4+ ions in the δ-FCC form of BZO material.33 The major XRD peaks were obtained at 29.3, 33.4, 48.1, 57.2, 59.9, 70.0, 77.2, and 79.2°, corresponding to the (222), (044), (404), (226), (444), (008), (517), and (408) lattice planes of the BZO nanocomposite material.29−36 The XRD peaks at 24.3, 28.2, 31.2, 34.0, 40.2, 49.8, and 59.7° correspond to the (110), (111), (002), (200), (102), (122), and (302) lattice planes of the FCC structure of Ag nanoparticles.37 Ag-doped BZOP exhibited additional XRD peaks, which correspond to the FCC structure of metallic Ag (JCPDS card no. 04-0783), and the XRD pattern vindicated the crystalline Ag-cluster nanoparticle formation. The increased XRD peak intensity while increasing the Ag concentration indicates Ag agglomerated with BZOP, and the obtained data are in good agreement with the reported data. The minimal peak position value difference arises due to Ag doping with BZOP, and the Ag+ ion has a higher ionic radius than Bi and Zn ions. The crystal planes marked by * indicated the peaks of Ag (JCPDS card no. 04-0783), and the decrement of crystallite size with increasing Ag concentration in BZOP suggested the slow agglomeration of Ag nanoparticles and excess Ag+ ions. The obtained results are corroborated with the reported data.38 The average crystalline size of the as-synthesized nanocomposite material was calculated by Debye–Scherer’s formula.
| 3 |
Figure 2.

XRD patterns of the as-synthesized BZOP (a) and different mol % (b–f) (1–9 mol %) of Ag-doped BZOP nanomaterials.
where D––average crystal size; k––constant value (0.89); λ––X-ray beam wavelength; β––full width at half-maximum of the diffraction peak; and Cosθ––Bragg’s angle, respectively. The calculated XRD parameters are presented in Table 1, and the calculated data are in good agreement with the reported values.31 The crystallite size is calculated from the Scherrer equation from the strongest peak of the Ag dopant. The crystallite size was found to be ranging from 24.8 to 39.2 nm; the mean value of the crystallite size was found to be 34.01 nm, and the calculated average size was in good agreement with the standard JCPDS 1-1164 of Ag nanoparticles.39 An increasing trend of peak intensity was observed, as the mole percentage of dopants such as Ag increased from 1 to 9 mol %.
Table 1. Calculated XRD Parameters of BZOP and Ag-Doped BZOP Nanomaterials.
| NPs | crystallite size (nm) | strain | SF | δ (1015 line m–2) |
|---|---|---|---|---|
| BZOP | 24.8 | 17.5 | 0.63 | 1.626 |
| 1 mol % Ag-doped BZOP | 33.0 | 16.7 | 0.57 | 0.918 |
| 3 mol % Ag-doped BZOP | 33.9 | 16.0 | 0.44 | 0.870 |
| 5 mol % Ag-doped BZOP | 34.8 | 15.6 | 0.36 | 0.825 |
| 7 mol % Ag doped BZOP | 38.4 | 14.8 | 0.28 | 0.678 |
| 9 mol % Ag-doped BZOP | 39.2 | 13.7 | 0.12 | 0.651 |
The morphology and microstructure of the as-prepared BZOP and Ag-doped BZOP nanomaterials were characterized by transmission electron microscopy (TEM) and HR-TEM analysis (Figure 3a–c). The TEM image analysis confirmed the existence of spherically shaped Ag nanoparticles that were well-deposited over the surface of BZOP. Figure 3d displays the HR-TEM image of Ag-doped BZOP with lattice fringes. The lattice fringe spacing of 0.31 nm corresponds to the 044 plane.40 The SAED pattern (Figure 3e) confirmed the polycrystalline nature of the nanomaterials. The d-spacing values for all of the spots depicted in the SAED pattern of Ag-doped BZO nanomaterials are presented in Table 2. The spot that exists in the SAED pattern corresponds to a specific set of lattice planes. From Figure 3f, it can be confirmed that the Ag particles are well-dispersed on the surface of BZOP with a narrow size distribution of 5–30 nm and an average particle size of around 18.4 nm. Thus, the TEM image confirmed the formation of Ag-doped BZOP nanomaterials, which are further established to facilitate electron transfer (ET) between Ag and BZOP nanomaterials.41
Figure 3.

TEM images (a–c) of BZOP and Ag-doped BZOP; HRTEM image (d); SAED pattern (e); and size distribution histogram plot (f) of Ag-doped BZOP.
Table 2. d-Spacing Values of Ag-Doped BZOP from SAED Patterns.
| spot | d-spacing (nm) | rec. pos. 1/(nm) | degrees to spot 1 | degrees to x-axis | amplitude |
|---|---|---|---|---|---|
| 1 | 0.3109 | 3.217 | 0.00 | 53.06 | 2128.80 |
| 2 | 0.2298 | 4.352 | 2.24 | 50.82 | 499.00 |
| 3 | 0.1966 | 5.087 | 23.17 | 76.23 | 170.48 |
| 4 | 0.1557 | 6.424 | 0.10 | 52.96 | 2124.92 |
| 5 | 0.1406 | 7.112 | 30.30 | 83.35 | 123.99 |
UV–visible diffuse reflectance spectroscopy was employed to study the optical properties of BZOP and Ag-doped BZOP nanomaterials at room temperature, and the obtained data are presented in Figure 4a. Figure 4a shows the UV–DRS spectra of BZOP and Ag-doped BZOP nanocomposites, which are presented in Figure 4b–f. The peaks observed at 323 and 395 nm for Ag-doped BZOP and bare BZOP nanocomposites are due to the electronic transitions from the VB to the CB.42 The absorption wavelength was shifted from the lower wavelength side to the higher wavelength side when increasing the Ag concentration from 1 to 9 mol % due to surface traps (transition of extrinsic states) and weak reflection at the near UV–visible area.35,36 This characteristic feature of the nanocomposite may be consigned to the host lattice absorption, and the optical band gap energy (Eg) was calculated by using the Kubelka–Munk equation (eq 4).
| 4 |
where α, h, ν, A, and Eg represent the absorption coefficient, Planck’s constant, photon frequency, proportionality constant, and band gap energy, respectively.
Figure 4.

(a) UV–visible DRS, (b) Tauc plot between photon energy [(hν), eV] and [αhν]1/2 of BZOP and different mol % (1–9 mol %) of Ag-doped BZOP nanomaterials.
The Tauc plot was drawn between the photon energy [(hν), eV] and [αhν]1/2, and the resultant plot is shown in Figure 4b. From Figure 4b, the optical band gap energy values were calculated. The band gap energy values were estimated to be 2.33, 2.18, 1.93, 1.89, and 1.98 eV, corresponding to BZOP, 1 mol % Ag-doped BZOP, 3 mol % Ag-doped BZOP, 5 mol % Ag-doped BZOP, 7 mol % Ag-doped BZOP, and 9 mol % Ag-doped BZOP, respectively. The Tauc plot slopes of the edges for all the Ag-doped BZOP nanocomposite materials are lower than that of the BZOP material due to the existence of vacancies and charge transfer (CT) between the energy levels of the VB of Ag and the CB of the BZOP nanomaterial.34−36 The oxygen vacancies prevented recombination via electron trapping and enhanced the photodegradation activity. The calculated band gap value of BZOP is higher than that of the Ag-doped BZOP nanocomposite materials, and a small shift in band gap energy values was observed owing to the increasing concentration of Ag over the BZOP nanocomposite material.33−36 The lower band gap value of 7 mol % of the as-synthesized Ag-doped BZOP nanocomposite material promoted the separation of charge carriers and enhanced the performance of the photocatalyst.43,44,50
The surface area as well as the porosity of bare BZOP and 7 mol % Ag-doped BZOP was analyzed through the N2 adsorption and desorption isotherm model by the Brunauer–Emmett–Teller (BET) analysis, and the obtained data are given in the Supporting Information Figure S1a. The Barrett–Joyner–Halenda (BJH) technique was used to calculate the pore volume distribution of the bare BZOP and 7 mol % Ag-doped BZOP (as shown in Figure S1b). The BET analysis result indicated that the adsorption isotherm was classified as type IV, accompanied by the H3 hysteresis loop category.39 The BJH plot revealed the mesoporous nature of the as-synthesized BZOP and Ag-doped BZOP nanomaterials.39 The overall pore volume of BZOP and 7 mol % Ag-doped BZOP was calculated to be 0.123 and 0.184 cm3/g, respectively, owing to an increase in the surface volume.40−42 The surface areas of BZOP and 7 mol % Ag-doped BZOP were found to be 26.58 and 20.86 m2/g, respectively. The hysteresis loop for the relative pressure P/Po was observed in between 0.0 and 1.0, and the pore diameter was studied in between 0 and 60 nm. The observed result explained that Ag doped on the surface of the BZOP material improves the surface area and pore volume distribution and enhances the photocatalytic degradation of MB and RB organic dyes.
The X-ray photoelectron spectral technique was used to determine the chemical states and bonding characteristics of Bi, Zr, C, and Ag elements in BZOP and Ag-doped BZOP nanomaterials, respectively. Figure 5a–f displays wide-scan and high-resolution scans of Ag 3d, Bi 4f, Zr 3d, O 1s, and C peaks. Figure 5b shows the spectrum of Bi 4f, which consists of two peaks at 156.9 and 162.5 eV, corresponding to Bi 4f7/2 and Bi 4f5/2, respectively, in BZOP. However, Ag-doped BZOP was shifted slightly in the binding energy of Bi. The absorption bands at 156.7 and 162.02 eV correspond to Bi 4f7/2 and Bi 4f5/2, respectively.42 The Bi ions in the samples existed in a trivalent state. From the Zr 3d spectra of BZOP, it was observed that the two distinct peaks at 181.9 and 179.6 eV correspond to Zr 3d3/2 and Zr 3d5/2, respectively, which are the characteristic peaks of the Zr4+ state. In Ag-doped BZOP, the peak appeared slightly lower at 181.6 and 179.4 eV (Figure 5c). The O 1s spectrum shown in Figure 5d could be deconvoluted into three peaks for BZOP, which are located at 527.3, 528.9, and 532.7 eV. The peaks might be due to oxygen vacancies in the interstitial sites and lattice oxygen and surface hydroxyl group (O–H).45,46 The peak at 530.42 eV is attributed to oxygen in the hydroxyl groups of Menthaspicata L. Figure 5e shows the C 1s spectra of BZOP and Ag-doped BZOP nanomaterials, and the peaks appear at 283.2, 287.4, and 291.2 eV, which might be due to carbon from the instrument and atmospheric C–C, C–O, and C=O bonds. The XPS spectrum of Ag showed two peaks located at 366.8 and 372.8 eV with a spin–orbit splitting of 5.6 eV (Figure 5f). Therefore, it is clear from the spectrum that Ag existed in a +1 state.37,45,46 As a result, the binding energy shifts in the XPS study further confirmed the successful accumulation of Ag over the BZOP nanomaterial.
Figure 5.

XPS spectra of Ag-doped BZOP nanomaterial. (a) XPS wide spectrum, (b) high-resolution Bi 4f spectrum, (c) high-resolution Zr 3d spectra, (d) high-resolution O 1s spectrum, (e) high-resolution C 1s spectrum, and (f) high-resolution Ag 3d spectrum.
The scanning electron microscopy (SEM) image of BZOP exhibited a nanoflake-like structure, as shown in Figure 6a. The SEM images of Ag-doped BZOP nanomaterials (Figure 6b–f) showed the spherical shape structure due to the presence of Ag on the surface of BZOP. As the Ag concentration increased from 1 to 9 mol %, spherical-shaped Ag agglomerated to form porous, rough crystalline material on the surface of BZOP.31,37 The presence of cracks and roughness on the Ag-doped BZOP nanomaterial surface supports the porous nature of the as-synthesized materials as compared to BZOP. The EDX spectra of BZOP and Ag-doped BZOP materials revealed the existence of characteristic peak percentages such as Bi, Zr, O, and Ag elements (Figure 7a1–f1). Figure 7a1 exhibited the peak percentages (Bi, O, and Zr peaks) present in BZOP nanomaterials, and Figure 7b1–f1 showed the Bi, Zr, and Ag peak percentages for Ag-doped BZOP nanomaterials. The EDX spectra of Ag-doped BZOP indicated that an increasing trend of % of Ag was observed due to an increase in Ag dopant concentrations from 1 to 9 mol %.46 Increasing the percentage of Ag accumulation or aggregation on the surface of the BZOP nanomaterial was confirmed by EDX. Furthermore, numerous sphere-shaped Ag nanoparticles with 18.5 nm diameter adsorbed on the BZOP surface by SEM analysis are in good agreement with the particle size of Ag, which is confirmed by TEM.
Figure 6.

SEM images of (a) BZOP, (b) 1 mol % Ag-doped BZOP, (c) 3 mol % Ag-doped BZOP, (d) 5 mol % Ag-doped BZOP, (e) 7 mol % Ag-doped BZOP, and (f) 9 mol % Ag-doped BZOP nanomaterials.
Figure 7.

EDX spectra of (a1) BZOP, (b1) 1 mol % Ag-doped BZOP, (c1) 3 mol % Ag-doped BZOP, (d1) 5 mol % Ag-doped BZOP, (e1) 7 mol % Ag-doped BZOP, and (f1) 9 mol % Ag-doped BZOP nanomaterials.
3.2. Electrochemical Characterization
Galvanostat charging and discharging (GCD), CV, and electrochemical impedance spectroscopy (EIS) techniques were utilized to study the electrochemical properties of the as-synthesized BZOP and Ag-doped BZOP nanomaterials. The CV measurements were performed using a conventional three-electrode pattern in aqueous 0.1 M KCl as a supporting electrolyte. Figure 8a displayed the CV curves in the potential range between +1.0 and −1.0 V for BZOP and Ag-doped BZOP graphite-modified electrodes at a scan rate of 0.02 V s–1. The presence of redox peaks confirmed the pseudocapacitance behavior of BZOP and Ag-doped BZOP graphite-modified electrodes. As can be seen from Figure 8a, the cyclic area of CV increased due to an increase in the Ag dopant concentration in the BZOP nanomaterial, and a small potential shift and an increase in the current intensity were also observed. The aforementioned observations support the hypothesis that the synthesized nanomaterials have excellent electrochemical properties.
Figure 8.

(a) CVs of BZOP and Ag-doped BZOP nanomaterial-modified electrodes at the scan rate of 0.02 V s–1, (b) CVs of 7 mol % of Ag-doped BZOP nanomaterial-modified electrode at different scan rates (0.01–0.05 mV/s), and (c) EIS spectra of BZOP and Ag-doped BZOP nanomaterial-modified electrodes. Potentials are measured to the calomel electrode as the reference electrode.
Figure 8c represents the EIS spectra of BZOP and Ag-doped BZOP nanomaterial-modified graphite electrodes in 0.1 M KCl. The high-frequency regions of the prepared electrodes comprise a semicircle, and the lower-frequency regions comprise a straight line. Using the diameter of the semicircle, the CT resistance (Rct) values of the electrode and electrolyte interface can be obtained.49 The calculated Rct values of BZOP, 1 mol % Ag, 3 mol % Ag, 5 mol % Ag, 7 mol % Ag, and 9 mol % Ag-doped BZOP nanomaterial-modified graphite electrodes were found to be 407, 579, 841, 378, 225, and 1382 Ω, respectively. The slopes from the straight lines at the low-frequency regions for 7 mol % Ag-doped BZOP were tending slightly toward 90° as compared to other modified electrodes. The 7 mol % Ag-doped BZOP-modified electrode exhibited a low Rct value, which revealed that the material can be utilized as a semiconducting material for enhancing photocatalytic applications.
The specific capacitance value (SPcv) was calculated from CV curves using the following equation, as depicted in Table 3.
| 5 |
Table 3. Calculated Specific Capacitance from CV (F/g) of BZOP and Ag-Doped BZOP Nanomaterials at Different Scan Rates.
| specific
capacitance from CV (F/g) |
specific
capacitance from CV (F/g) [7 mol % Ag-doped BZOP] |
||
|---|---|---|---|
| nanomaterials | scan rate at 0.02 (mV/s) | scan rate (mV/s) | specific capacitance (F/g) |
| BZOP | 8.34 | 0.01 | 61.0 |
| 1 mol % Ag-doped BZOP | 9.83 | 0.02 | 55.6 |
| 3 mol % Ag-doped BZOP | 10.34 | 0.03 | 31.8 |
| 5 mol % Ag-doped BZOP | 13.21 | 0.04 | 25.4 |
| 7 mol % Ag-doped BZOP | 55.66 | 0.05 | 22.9 |
| 9 mol % Ag-doped BZOP | 26.25 | ||
It is clear from the Table 3 that 7 mol % Ag-doped BZOP graphite-modified electrode exhibited a higher specific capacitance with a high exposure area as compared to BZOP and other Ag-doped BZOP graphite-modified electrodes. This observation revealed that the 7 mol % Ag-doped BZOP graphite-modified electrode showed an excellent electrochemical behavior. The stability of the nanomaterial was confirmed by CV technique at different scan rates (0.01–0.05 mV/s) for 7 mol % Ag-doped BZOP graphite modified, as depicted in Figure 9. It was predicted that the shift in cathodic peaks and anodic peaks in the area of CV curves when increasing the scan rates from 0.01 to 0.05 mV/s would be due to an internal resistance over the electrode surface.47 All the curves from CV retained their redox peaks at different scan rates, which confirm the pseudocapacitance behavior of the nanomaterial. The calculated SPcv values for a 7 mol % Ag-doped BZOP electrode at different scan rates are given in Table 3. As can be seen in Table 3, there is a decreasing trend in the SPcv value observed by increasing the scan rates due to a relatively inadequate faradaic redox process at high scan rates.47−49
Figure 9.

(a) Comparative GCD curves of BZOP and (b) 7 mol % Ag-doped BZOP nanomaterial-modified graphite electrodes at a current density of 1 A/g. (c) stability of 7 mol % Ag-doped BZOP nanomaterial-modified graphite electrode.
The comparative GCD curves of BZOP and a 7 mol % Ag-doped BZOP nanomaterial-modified graphite electrode at a current density of 1 A/g are shown in Figure 9a,b. Figure 9b clearly indicates that the 7 mol % Ag-doped BZOP nanomaterial-modified graphite electrode displayed a longer discharging time with linear charge–discharge performance as compared to BZOP. The SPGD values of BZOP and 7 mol % Ag-doped BZOP nanomaterial-modified graphite electrodes were calculated from the discharge curves of GCD using eq 6.
| 6 |
The 7 mol % Ag-doped BZOP nanomaterial-modified graphite electrode exhibited a higher SPCD (60.3 F/g) value as compared to BZOP (12.8 F/g) at 1 A/g of current density. The increased trend in the capacitance for a 7 mol % Ag-doped BZOP nanomaterial-modified graphite electrode compared to a BZOP-modified electrode was observed due to the presence of Ag ions. The stability of a 7 mol % Ag-doped BZOP nanomaterial-modified graphite electrode was investigated by a charging–discharging study. The cyclic curves (Figure 9c) were found to be linear and exhibited a typical triangular shape at charging and discharging for about 1500 s (7 mol % Ag-doped BZOP) as compared to BZOP (for 500 s), indicating satisfactory capacitive features of the as-prepared 7 mol % Ag-doped BZOP nanomaterial-modified electrode in this study.
3.3. Photocatalytic Degradation Study
The photocatalytic degradation of industrial organic dyes such as MB and RB (40 mg/L) was studied using five different mole percentages of Ag-doped BZOP nanomaterials (20 mg/L) at time intervals from 0 to 90 min under visible-light irradiation. The obtained photodegradation spectra for MB dye are depicted in Figure 10. The photodegradation spectra for RB dye are shown in Supporting Information, Figure S2. The obtained dye degradation data revealed that BZOP exhibits 62.5 and 84.5% photocatalytic degradation efficiency for MB and RB, respectively, owing to the large Eg values of ZrO2 in BZOP.11,17,27 However, the dye degradation efficiency was enormously enhanced by adding Ag with the BZOP nanomaterial, and this result indicates the better photocatalytic activity of Ag in this study. The obtained result vindicated that when increasing the concentration of Ag as a dopant from 1 to 9 mol %, the dye degradation also increased. As compared to all mole percentages of Ag dopant, 7 mol % of Ag concentration exhibited a better degradation efficiency of 98.7% than BZOP (62.5%), 1 mol % of Ag (68.2%), 3 mol % of Ag (75.0%), 5 mol % of Ag (89.6%), and 9 mol % of Ag (77.8%), for MB dye. The photocatalytic degradation of RB dye also exhibited better degradation efficiency of 5 mol % (99.1%) and 7 mol % (99.3%) of Ag concentration as compared to other mole percentages of Ag in BZOP nanomaterials. The UV–visible dye degradation kinetic results confirmed the production of larger numbers of Ag particles when increasing the Ag concentration. The large number of Ag species could act as recombination centers and species and mask the active sites of the BZOP nanomaterial.31,37 The covered active sites of the BZOP nanomaterial, due to excess concentrations of Ag, decreased the photocatalytic performances of the as-synthesized Ag-doped BZOP nanomaterial in this study. In addition, when increasing the Ag concentration above 7 mol %, it forms turbidity inside the solution, which also affects the penetration of visible light and reduces the photocatalytic performance.37
Figure 10.

Photocatalytic degradation of MB in the presence of BZOP nanomaterial and different mol % (1–9 mol %) of Ag-doped BZOP nanomaterial photocatalysts for different time intervals (0–90 min).
3.4. Kinetic Study of Photocatalytic Degradation of MB and RB Dyes
The UV–visible kinetic study was carried out for the photocatalytic degradation of MB and RB dyes under pseudo-first-order conditions with excess dye concentrations.48,49 The kinetic spectrum of MB dye degradation under pseudo-first-order conditions using Ag-doped BZOP nanomaterial photocatalysts at different time intervals (0–90 min) is depicted in Figure 11. The kinetic spectrum of RB dye degradation under pseudo-first-order conditions using Ag-doped BZOP nanomaterial photocatalysts at different time intervals (0–90 min) is depicted in Figure S2. The plots of C/C0 versus irradiation time (in min) were found to be linear with a correlation coefficient value (R2) of 0.99, as given in Figure 12. The linear plots of ln C/C0 versus time (in min) were also found to be linear, and the kinetic parameters such as rate constant k (min–1) and correlation coefficient (R2) values were evaluated from the equation: ln C/C0 = −kt, where k is the pseudo-first-order rate constant and C/C0 is the concentration change at time t and 0 min. The obtained kinetic data from the photocatalytic degradation of dyes are presented in Table 4. The highest rate constant (k) was evaluated to be 0.628 s–1 for 20 mg/L of 7 mol % Ag-doped BZOP nanomaterial photocatalyst and 40 mg/L of dye concentrations. The rate constant (k, s–1) values increased when increasing the dye concentration (5–40 mg/L) during the photocatalytic degradation of MB and RB dyes, as presented in Table 4. This kinetic result supported the excellent photocatalytic activities of 7 mol % Ag-doped BZOP nanomaterials as compared to other Ag-doped BZOP nanomaterials for the degradation of MB and RB dyes under visible-light irradiation.
Figure 11.

(a) Plots of C0/Ct vs irradiation time (in min), (b) plots of ln C0/Ct vs irradiation time (in min) for the photodegradation of MB in the presence of BZOP nanomaterial and different mol % (1–9 mol %) of Ag-doped BZOP nanomaterial photocatalysts for different time intervals (0–90 min) under visible-light irradiation.
Figure 12.

(a) Plots of C0/Ct vs irradiation time (in min), (b) plots of ln C0/Ct vs irradiation time (in min) for the photodegradation of RB in the presence of BZOP nanomaterial and different mol % (1–9 mol %) of Ag-doped BZOP nanomaterial photocatalysts for different time intervals (0–90 min) under visible-light irradiation.
Table 4. Pseudo-First-Order (k, min–1) Rate Constants and Correlation Coefficients (R2) for the Degradation of MB and RB Dyes with Various mol % of Ag-Doped BZOP Nanomaterials.
| catalyst | amount of photocatalyst, mg/L | dye concentration, mg/L | Pseudo-first-order
rate constant (k, min–1) |
R2 value | |
|---|---|---|---|---|---|
| MB | RB | ||||
| BZOP nanomaterial | 20 | 40 | 0.053 ± 0.01 | 0.107 ± 0.01 | 0.97 |
| 1 mol % Ag-doped BZOP nanomaterial | 20 | 40 | 0.067 ± 0.01 | 0.164 ± 0.01 | 0.98 |
| 3 mol % Ag-doped BZOP nanomaterial | 20 | 40 | 0.091 ± 0.01 | 0.190 ± 0.01 | 0.99 |
| 5 mol % Ag-doped BZOP nanomaterial | 20 | 40 | 0.105 ± 0.01 | 0.242 ± 0.01 | 0.99 |
| 7 mol % Ag-doped BZOP nanomaterial | 20 | 40 | 0.229 ± 0.01 | 0.291 ± 0.01 | 0.98 |
| 9 mol % Ag-doped BZOP nanomaterial | 20 | 40 | 0.156 ± 0.01 | 0.226 ± 0.01 | 0.98 |
3.5. Electrochemical Sensing of Lead Nitrate and Dextrose
Nanomaterial-based electrochemical sensors have received much attention for enhancing their electrochemical and biosensor activities. The fabricated (1–9 mol %) Ag-doped BZOP nanomaterials and modified graphite electrodes were utilized for the detection of Pb+ ions in lead nitrate and the sensing of dextrose molecules by the CV technique. Supporting Information Figure S3a,b shows the CV curves of the electrochemical sensing of lead nitrate and dextrose in 0.1 N KCl electrolyte at 1 mol % Ag-doped BZOP nanomaterial-modified graphite electrode. This CV exhibited two well-defined peaks (cathodic and anodic peaks) for lead nitrate at −0.28 and −0.84 V and for the dextrose biosensor at 0.11 and −0.71 V, respectively. The variations of peak positions of 3 mol % of Ag-doped BZOP-modified electrode were found to be at 0.23 and −0.36 V for lead nitrate and at 0.27, 0.10, and −0.39 V for dextrose molecules, as shown in Figure S4a,b. In addition, enhanced electrochemical and biosensor activities were also observed for 5 mol % of Ag-doped BZOP nanomaterial-modified electrode, and the peak potentials were found to be at 0.26, −0.32, and −1.05 V for lead nitrate and at 0.13, −0.30, and −0.4 V for dextrose molecules in 1–5 mM concentrations, as shown in Figure S5a,b. Furthermore, the excellent sensing activities and dynamic performance of lead nitrate and dextrose on a 7 mol % Ag-doped BZOP-modified electrode used as a sensor were analyzed at different concentrations ranging from 1 to 5 mM at a scan rate of 3 mV s–1 (Figure 13a,b). As can be seen in Figure 13a,b, an increasing peak current was observed with increasing concentrations of lead nitrate and dextrose, and it exhibits additional peaks at 0.05, −0.25, −0.37, and −0.65 V for lead nitrate and at 0.06, −0.18, and −0.71 V for dextrose molecules. The plot between Ipa and the concentrations of lead nitrate and dextrose (1–5 mM) was found to be linear with an R2 value of 0.9762. The limit of detection (LOD) was calculated using the following formula: LOD = 3.3 S/b, where S is the standard deviation, and b is the slope of the calibration plot. The modified electrochemical sensor exhibited the lowest detection limits of 18 and 12 μM (S/N = 5) for lead nitrate and dextrose, respectively. The obtained LOD data revealed that a 7 mol % Ag-doped BZOP-modified electrode showed a better detection limit toward lead nitrate and dextrose molecules. Additionally, we performed sensing activities on a 9 mol % Ag-doped BZOP-modified electrode for the determination of lead nitrate, with its peak positions at 0.22, −0.35, and −0.65 V, and lesser sensitivity was found for the dextrose molecule with a peak position at 0.13 V, as shown in Figure S6a,b. As a result of the electrochemical sensing study, it was revealed that the 7 mol % Ag-doped BZOP nanomaterial has great sensing ability toward the detection of lead nitrate and dextrose.47
Figure 13.

(a) CV curves of lead nitrate sensing activity, (b) CV curves of dextrose sensing activity for different concentrations of lead nitrate and dextrose (1–5 mM) in 0.1 N KCl electrolyte over 7 mol % Ag-doped BZOP-modified graphite electrode at a scan rate of 50 mV/s.
4. Antibacterial Activity
The antibacterial susceptibility of the synthesized BZOP and Ag-doped BZOP nanomaterials was examined by employing the paper disc diffusion method against Staphylococcus aureus (Gram-positive) and S. typhi (Gram-negative) by selecting tetracycline as a positive and BMSO as a negative control. The obtained diameter of the zone of inhibition (in millimeters) is presented in Table 5.
Table 5. Inhibition Zone (in mm) of BZOP and Ag-Doped BZOP Nanomaterials against S. typhi and S. aureus.
| concentrations (μg/mL) | BZOP |
Ag-doped
BZOP |
control
(tetracycline) |
|||
|---|---|---|---|---|---|---|
| S. typhi | S. aureus | S. typhi | S. aureus | S. typhi | S. aureus | |
| 100 | 14 | 15 | 14 | 23 | 27 | |
| 200 | 15 | 18 | 17 | 24 | 28 | |
| 300 | 16 | 21 | 19 | 26 | 29 | |
| 400 | 19 | 25 | 22 | 28 | 30 | |
The clear diameter of the bacterial inhibitory zone was connected to the antibiotic action of the synthesized samples, which demonstrates the fact that antibacterial activity increases with concentration.24−27,51−53 Due to the bactericidal action of Ag-doped BZOP samples, they exhibited higher antibacterial activity for both Gram-positive and Gram-negative bacteria compared to BZOP samples, where Gram-positive bacteria showed resistance toward BZOP samples in the absence of inhibition zones, as shown in Figure 14. The enhanced antibacterial activity of Ag-doped BZOP can be attributed to the presence of Ag in the BZOP lattice as a dopant.13 The bactericidal effect of Ag on the outer cell wall has been explained in four possible ways: Ag ions releasing from the lattice and interfering with the formation of the cell wall inhibit the synthesis of proteins, obstruct the synthesis of nucleic acids, and inhibit a metabolic pathway.51 Initially, the Ag-doped BZOP nanomaterial adheres to the surface of the cell membrane and impairs vital processes including permeability and respiration, leading to plasmolysis. It is worth mentioning that the interaction of the available surface area affects how tightly the particles are bound to the bacterial cell wall. Smaller particles can diffuse into the cell wall easily and will have a stronger bactericidal impact.27 Ag-doped BZOP nanomaterials with smaller Ag ions have the capacity to penetrate bacteria through the cell wall and inhibit the further growth of the bacteria.51−53 The antibacterial potential of the BZOP nanomaterial was increased by doping noble metals such as Ag due to its smaller size and the change in morphology and shape of the nanomaterials.
Figure 14.

Inhibition zones of (a) S. typhi and (b) S. aureus for the BZOP sample; (c) S. aureus and (d) S. typhi for Ag-doped BZOP nanomaterials; and (e) S. aureus and (f) S. typhi for control (tetracycline).
5. Radical Scavenger Study
To study the photocatalytic degradation of anionic dyes such as MB and RB, they are examined using isopropyl alcohol (IPA), ammonium oxalate (AO), and ascorbic acid (AA) for producing reactive species like •OH, •O2–, or h+, which will directly be involved in the process after the electron–hole pairs were generated by Ag-doped BZOP nanocomposite photocatalysts under visible-light irradiation.32,36 In the radical scavenging test, we have taken 1.0 mM/L of IPA, AO, and AA, which were dispersed into the reaction solution for examining the formation of •OH, •O2–, or h+ in visible-light irradiation. The photodegradation performances of MB and RB were monitored in the presence and absence of radical scavengers, as shown in Figure 15. As can be seen in Figure 15, adding IPA exhibits a slight effect on the photodegradation of MB and RB, which revealed that the •OH radical showed a frailer role. Moreover, the photodegradation performance was decreased substantially by adding AO to the reaction mixture, which shows that h+ (holes) are involved in the oxidation of MB and RB under visible-light irradiation. Furthermore, introducing AA to the reaction solution, the photocatalytic performances of MB and RB are decreased. The decreased photodegradation activity in the presence of radical scavengers indicate that O2 coverts into •O2– (superoxide anion radical) due to its better electron trapping ability and to avoid the electron–hole recombination in this reaction. The scavenger study result authenticated that •O2– or h+ reactive species preceded the photodegradation reaction of MB and RB dyes in this study.36,37,54
Figure 15.

Bar diagram of the influence of radical scavengers (IPA, AO, and AA) for the degradation of dyes.
6. Reusability and Stability Studies
To study the reusability and stability of Ag-doped BZOP nanomaterial photocatalysts that are significant in MB and RB degradation under visible-light irradiation, the Ag-doped BZOP nanomaterial photocatalyst reusability was analyzed for five cycles for the MB and RB degradation, and the reproduced photocatalyst after the degradation of dyes was washed with ethanol and deionized water. Then, the washed photocatalyst was dried at 60–80 °C, and then it was reused again for the degradation of dyes.54 To maintain the identical photocatalyst, we included the utilized nanomaterial photocatalyst in every cycle. The photocatalytic efficiencies for all five cycles were found to range from 98.6 to 86.9% (Figure 16). A decreasing trend of photocatalytic efficiency was observed from the first cycle to the fifth cycle, owing to the existence of Ag atoms on the surface of the BZOP nanomaterial. The obtained reusability performance of the Ag-doped BZOP nanomaterial photocatalyst for the degradation of MB and RB dyes supports the stability of the nanomaterials in this study.
Figure 16.

Cycle stability (five cycles) and reusability of the Ag-doped BZOP nanomaterial photocatalyst.
7. Total Organic Carbon Study
Total organic carbon was studied using teledyne-Tekmar-introduces-fusion total organic carbon (TTIF-TOC), USA Company, to remove the carbon (in %) in the course of photocatalytic degradation of MB and RB dyes under visible-light irradiation at different time (from 0 to 90 min) intervals. To determine the complete mineralization of MB and RB dyes under visible-light irradiation, the percentage of carbon content removal using Ag-doped BZOP nanomaterials is calculated. The carbon content removal percentages were found to be 96.8 and 98.5% for MB and RB dyes, respectively, under visible-light irradiation at 90 min time interval, as shown in Figure 17. The obtained results showed that the percentage of TOC removal of RB dye is higher than the TOC of MB dye under visible-light irradiation by a TOC analyzer. Thus, the 7 mol % Ag-doped BZOP nanomaterials exhibited higher photocatalytic degradation activity toward MB and RB dyes under visible light.31,55
Figure 17.

Percentage of TOC removal of (a) RB and (b) MB with 7 mol % Ag-doped BZOP under visible-light irradiation at different time intervals (0–90 min).
8. Mechanism
The Ag-doped BZOP nanocomposite was used as a photocatalyst for MB and RB dye photodegradation under visible-light irradiation. Based on the experimental data, a suitable mechanism was proposed for the Ag-doped BZOP photocatalyst-based degradation of MB and RB dyes under visible-light irradiation. Here, an electron and a positive hole in the VB of the nanocatalyst played leading roles during the photocatalytic degradation of the anionic dyes. The photoinduced electrons (in the CB) and holes (in the VB) are created as a pair and involved in the reaction under visible-light irradiation. The electrons in the CB of BZOP creates negative (•O2 and •OH) ions. At the same time, the holes in the VB of BZOP oxidize H2O into •OH radicals, whereas the electrons relocate from the CB of BZOP to the Ag dopant that behaves as an electron trap center. The electron trap centers decrease the electron–hole pairs’ rate of recombination and enhance the lifetime and interfacial CT.56 The scavenger study reveals that radicals such as O2•– and •OH are responsible for MB and RB mineralization under visible-light irradiation. Bhosale et al. reported that the intensity of PL spectrum was decreased due to the increase in the Ag dopant in BZOP.31 All the obtained data reveal that the Ag-doped BZOP enhances the radical (O2•– and •OH) formation and MB and RB degradation under visible-light irradiation, as shown in Figure 18.
Figure 18.

Mechanism of photocatalytic degradation of MB and RB dyes using Ag-doped BZOP nanomaterial photocatalyst under visible-light irradiation.
9. Biocompatibility Study
After MB and RB dye degradation, the resulting solution was used to study the biocompatibility of the green gram seeds’ growth in terms of days. Green gram seeds were cultured in tap water [control (C)], MB and RB dye-contaminated water [untreated (UT)], and Ag-doped BZOP photocatalyst-treated (PT) water. The green gram seeds’ growth was studied for different periods such as 3, 6, and 10 days, and the obtained growth of green gram seeds is depicted in Figure 19. The growth of green gram seeds in MB and RB dye-contaminated water was not good as compared to the control and photocatalyst-treated water.57,58 However, the growth of green gram seeds in the control is very close to the growth of seeds in Ag-doped BZOP photocatalyst treated water. The obtained result revealed that the Ag-doped BZOP photocatalyst has great potential for the cultivation process.
Figure 19.
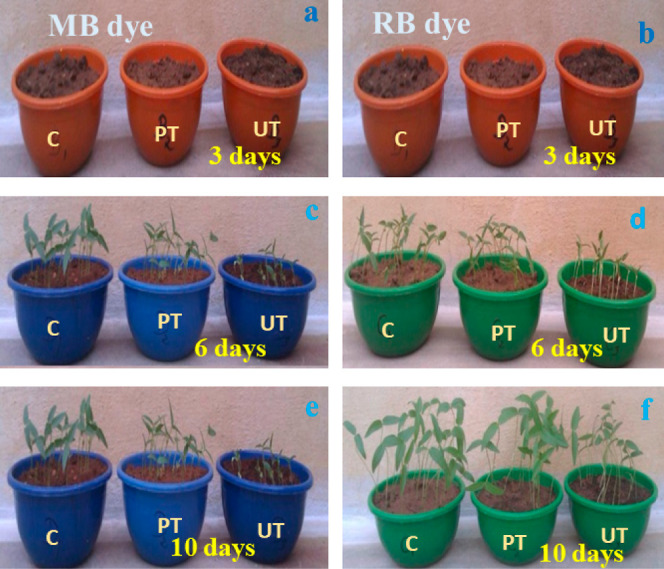
Growth of green gram seeds in tap water [control (C)], MB and RB dye-contaminated untreated (UT) water, and Ag-doped BZOP photocatalyst-treated (PT) water for the period of 3 (a,b), 6 (c,d), and 10 days (e,f) respectively.
10. Conclusions
BZOP and different mol % of Ag-doped BZOP nanomaterials were synthesized by the greener solution combustion method, and the synthesized materials were successfully characterized using various spectral, analytical, and electrochemical techniques. 7 mol % of Ag-doped BZOP nanomaterial displayed excellent photodegradation performance against MB (98.7%) and RB (99.3%) dyes due to its distinct properties like semiconducting property, higher binding energy, band gap, optical property, and stability. Using EIS spectral data, the lowest CT resistance (Rct-225 Ω) value was found for 7 mol % of Ag-doped BZOP nanomaterial photocatalyst as compared to BZOP and other mole percentages of Ag-doped nanomaterials. An Ag-doped BZOP-modified electrochemical sensor was used to determine the lead nitrate and dextrose molecules with low detection limit (LOD) values of 18 and 12 μM, respectively. Radical scavenging studies revealed that •O2– or h+ reactive species are involved in the photocatalytic degradation of MB and RB dyes under visible light. Enhanced antibacterial activity was observed for Ag-doped BZOP materials as compared to BZOP, which can be attributed to the presence of Ag on the surface of the BZOP lattice for both Gram-positive and Gram-negative bacteria. Moreover, the Ag-doped BZOP nanomaterial exhibited enhanced stability for the degradation of MB and RB dyes, and the photocatalyst retained its photodegradation efficiencies, even after the fifth cycle. The mechanism of photocatalytic degradation of dye reactions using Ag-doped BZOP nanomaterials as photocatalysts under visible-light irradiation has been discussed. The 7 mol % Ag-doped BZOP nanomaterials exhibited higher photocatalytic degradation activity toward MB and RB dyes under visible light. The obtained biocompatibility result revealed that the Ag-doped BZOP photocatalyst has great potential for the cultivation process.
Acknowledgments
The authors thank the Management and Principal, Dayananda Sagar College of Engineering, Bangalore, for providing the research facilities for this study.
Supporting Information Available
The Supporting Information is available free of charge at https://pubs.acs.org/doi/10.1021/acsenvironau.3c00057.
BET analysis data, photocatalytic degradation of RB dye in the presence of BZOP nanomaterial and different mol percentages (1–9 mol %) of Ag-doped BZOP nanomaterial photocatalysts for different time intervals (0–90 min), CV curves of lead nitrate sensing activity, CV curves of dextrose sensing activity for different concentrations of lead nitrate and dextrose (1–5 mM) in 0.1 N KCl electrolyte over 1 mol % Ag-doped BZOP-modified graphite electrode at a scan rate of 50 mV/s, CV curves of lead nitrate sensing activity, CV curves of dextrose sensing activity for different concentrations of lead nitrate and dextrose (1–5 mM) in 0.1 N KCl electrolyte over 3 mol % Ag-doped BZOP-modified graphite electrode at a scan rate of 50 mV/s, CV curves of lead nitrate sensing activity, CV curves of dextrose sensing activity for different concentrations of lead nitrate and dextrose (1–5 mM) in 0.1 N KCl electrolyte over 5 mol % Ag-doped BZOP-modified graphite electrode at a scan rate of 50 mV/s, CV curves of lead nitrate sensing activity, and CV curves of dextrose sensing activity for different concentrations of lead nitrate and dextrose (1–5 mM) in 0.1 N KCl electrolyte over 9 mol % Ag-doped BZOP-modified graphite electrode at a scan rate of 50 mV/s (PDF)
Author Contributions
All authors contributed to the study conception and design. The conception, design, and manuscript correction were done by K.S.A.; material synthesis and data collection were performed by K.P.; photocatalytic study was carried out by M.S.; antimicrobial effect was performed by B.U.; electrochemical data were analyzed by B.S.S.; and XPS study was done by A.P.C. The manuscript was written by P.K. Writing––reviewing and editing––was done by H.C.A.M. All the authors read and approved the final manuscript. CRediT: Kurlla Pompapathi data curation, resources; Kurupalya Shivram Anantharaju conceptualization, supervision, writing-original draft; Periyakaruppan Karuppasamy writing-original draft; Meena Subramaniam investigation; Bogegowda Uma formal analysis; Surendra Boppanahalli Siddegowda formal analysis, investigation; Arpita Paul Chowdhury investigation; H C Ananda Murthy writing-review & editing.
The authors declare no competing financial interest.
Supplementary Material
References
- a Liu X.; Huang L.; Wu X.; Wang Z.; Dong G.; Wang C.; Liu Y.; Wang L. Bi2Zr2O7 nanoparticles synthesized by soft-templated sol-gel methods for visible-light-driven catalytic degradation of tetracycline. Chemosphere 2018, 210, 424–432. 10.1016/j.chemosphere.2018.07.040. [DOI] [PubMed] [Google Scholar]; b Sabri M.; Habibi-Yangjeh A.; Rahim Pouran S.; Wang C. Titania-activated persulfate for environmental remediation: the-state-of-the-art. Catal. Rev. 2023, 65, 118–173. 10.1080/01614940.2021.1996776. [DOI] [Google Scholar]
- a Qu Z.; Jing Z.; Chen X.; Wang Z.; Ren H.; Huang L. Preparation and photocatalytic performance study of dual Z-scheme Bi2Zr2O7/g-C3N4/Ag3PO4 for removal of antibiotics by visible-light. J. Environ. Sci. 2023, 125, 349–361. 10.1016/j.jes.2022.01.010. [DOI] [PubMed] [Google Scholar]; b Feizpoor S.; Rahim Pouran S.; Habibi-Yangjeh A. Recent progress on photocatalytic evolution of hydrogen gas over TiO2-x-based emerging nanostructures. Mater. Sci. Semicond. Process. 2023, 162, 107444. 10.1016/j.mssp.2023.107444. [DOI] [Google Scholar]; c Habibi-Yangjeh A.; Pournemati K. A review on emerging homojunction photocatalysts with impressive performances for wastewater detoxification. Crit. Rev. Environ. Sci. Technol. 2023, 0, 1–31. 10.1080/10643389.2023.2239125. [DOI] [Google Scholar]
- Sun X.; Gu M.; Yang J.; Ye G.; Xiao X.; Chen M.; Liu M.; Chen Z.; Huang H. The photocatalytic performances of Bi2MTaO7 (M = Ga, In) photocatalysts for environmental cleaning under visible-light. Inorg. Chem. Commun. 2022, 139, 109390. 10.1016/j.inoche.2022.109390. [DOI] [Google Scholar]
- Huang D.; Li J.; Zeng G.; Xue W.; Chen S.; Li Z.; Deng R.; Yang Y.; Cheng M. Facile construction of hierarchical flower-like Z-scheme AgBr/Bi2WO6 photocatalysts for effective removal of tetracycline: Degradation pathways and mechanism. J. Chem. Eng. 2019, 375, 121991. 10.1016/j.cej.2019.121991. [DOI] [Google Scholar]
- Maham M.; Nasrollahzadeh M.; Mohammad Sajadi S. Facile synthesis of Ag/ZrO2 nanocomposite as a recyclable catalyst for the treatment of environmental pollutants. Composites, Part B 2020, 185, 107783. 10.1016/j.compositesb.2020.107783. [DOI] [Google Scholar]
- Kumar M.; Kulriya P. K.; Pivin J. C.; Avasthi D. K. Evolution and tailoring of plasmonic properties in Ag:ZrO2 nanocomposite films through swift heavy ions. J. Appl. Phys. 2011, 109, 044311–044311-6. 10.1063/1.3555593. [DOI] [Google Scholar]
- Wu D.; He T.; Xia J.; Tan Y. Preparation and photocatalytic properties of Bi2Zr2O7 photocatalyst. Mater. Lett. 2015, 156, 195–197. 10.1016/j.matlet.2015.05.107. [DOI] [Google Scholar]
- Sharma V. M.; Saha D.; Madras G.; Row T. N. G. Synthesis, structure, characterization and photocatalytic activity of Bi2Zr2O7 under solar radiation. RSC Adv. 2013, 3 (41), 18938–18943. 10.1039/c3ra43518k. [DOI] [Google Scholar]
- Kumar M.; Sandeep C. S. S.; Kumar G.; Mishra Y. K.; Philip R.; Reddy G. B. Plasmonic and Nonlinear Optical Absorption Properties of Ag:ZrO2 Nanocomposite Thin Films. Plasmonics 2014, 9, 129–136. 10.1007/s11468-013-9605-z. [DOI] [Google Scholar]
- Alhokbany N.; Ahama T.; Ruksana; Naushad M.; Alshehri S. M. AgNPs embedded N- doped highly porous carbon derived from chitosan based hydrogel as catalysts for the reduction of 4-nitrophenol. Composites, Part B 2019, 173, 106950. 10.1016/j.compositesb.2019.106950. [DOI] [Google Scholar]
- Mishra Y. K.; Adelung R.; Kumar G.; Elbahri M.; Mohapatra S.; Singhal R.; Tripathi A.; Avasthi D. K. Formation of self-organized silver nanocup-type structures and their plasmonic absorption. Plasmonics 2013, 8, 811–815. 10.1007/s11468-013-9477-2. [DOI] [Google Scholar]
- Kumar M.; Reddy G. B. Tailoring surface plasmon resonance in Ag:ZrO2 nanocomposite thin films. Phys. E 2010, 43, 470–474. 10.1016/j.physe.2010.08.031. [DOI] [Google Scholar]
- Zheng Z.; Huang B.; Qin X.; Zhang X.; Dai Y.; Whangbo M.-H. Facile in situ synthesis of visible-light plasmonic photocatalysts M@TiO2 (M = Au, Pt, Ag) and evaluation of their photocatalytic oxidation of benzene to phenol. J. Mater. Chem. 2011, 21, 9079–9087. 10.1039/c1jm10983a. [DOI] [Google Scholar]
- Kayani Z. N.; Manzoor F.; Zafar A.; Mahmood M.; Rasheed M.; Anwar M. Impact of Ag doping on structural, optical, morphological, optical and photoluminescent properties of ZnO nanoparticles. Opt. Quantum Electron. 2020, 52, 344. 10.1007/s11082-020-02460-z. [DOI] [Google Scholar]
- Wagh S. S.; Kadam V. S.; Jagtap C. V.; Salunkhe D. B.; Patil R. S.; Pathan H. M.; Patole S. P. Comparative Studies on Synthesis, Characterization and Photocatalytic Activity of Ag Doped ZnO Nanoparticles. ACS Omega 2023, 8, 7779–7790. 10.1021/acsomega.2c07499. [DOI] [PMC free article] [PubMed] [Google Scholar]
- Kurra S.; Venkataswamy P.; Ravi G.; Sudhakar Reddy C.; Jaganmohan Reddy B.; Vithal M. Enhancement of Photocatalytic Activity of Sodium Bismuth Titanate by Doping with Copper, Silver, and Tin Ions. J. Biol. Inorg. Chem. 2019, 645, 529–536. 10.1002/zaac.201800337. [DOI] [Google Scholar]
- Karthik R.; Hou Y. S.; Chen S. M.; Elangovan A.; Ganesan M.; Muthukrishnan P. Eco-friendly synthesis of Ag-NPs using Cerasus serrulata plant extract - Its catalytic, electrochemical reduction of 4-NPh and antibacterial activity. J. Ind. Eng. Chem. Res. 2016, 37, 330–339. 10.1016/j.jiec.2016.03.044. [DOI] [Google Scholar]
- Dwivedi S.; Khan M.; Srivastava S. K.; Syamasunnder K. V.; Srivastava A. Essential oil composition of different accessions of Mentha x piperita L. grown on the northern plains of India. Flavour Fragrance J. 2004, 19, 437–440. 10.1002/ffj.1333. [DOI] [Google Scholar]
- Akpinar E. K. Drying of Mint Leaves in a Solar Dryer and under open Sun: Modelling, performance analyses. Energy Convers. Manage. 2010, 51, 2407–2418. 10.1016/j.enconman.2010.05.005. [DOI] [Google Scholar]
- Kiani S.; Minaei S.; Ghasemi-Varnamkhasti M. Real-time aroma monitoring of mint (Mentha spicata L.) leaves during the drying process using electronic nose system. Measurement 2018, 124, 447–452. 10.1016/j.measurement.2018.03.033. [DOI] [Google Scholar]
- He T.; Wu D. Synthesis and characterization of Ag/AgCl/Bi2Zr2O7 photocatalyst with enhanced visible-light-driven photocatalytic performance. J. Mater. Sci.: Mater. Electron. 2017, 28, 7320–7325. 10.1007/s10854-017-6418-4. [DOI] [Google Scholar]
- Li S.; Bian X.; Gao J.; Zhu G.; Hojamberdiev M.; Wang C.; Wei X. Effect of oxygen vacancy and surface plasmon resonance: a photocatalytic activity study on Ag/Bi4Ti3O12 nanocomposites. J. Mater. Sci.: Mater. Electron. 2017, 28, 17896–17907. 10.1007/s10854-017-7731-7. [DOI] [Google Scholar]
- Luo Y.; Cao L.; Feng L.; Huang J.; Yang L.; Yao C.; Cheng Y. Synthesis, characterization and photocatalytic properties of nanoscale pyrochlore type Bi2Zr2O7. Mater. Sci. Eng., B 2019, 240, 133–139. 10.1016/j.mseb.2019.01.017. [DOI] [Google Scholar]
- Usha S. P.; Shrivastav A. M.; Gupta B. D. FO-SPR based dextrose sensor using Ag/ZnO nanorods/GOx for insulinoma detection. Biosens. Bioelectron. 2016, 85, 986–995. 10.1016/j.bios.2016.05.082. [DOI] [PubMed] [Google Scholar]
- Bhattacharya D.; Gupta R. K. Nanotechnology and potential of microorganisms. Crit. Rev. Biotechnol. 2005, 25, 199–204. 10.1080/07388550500361994. [DOI] [PubMed] [Google Scholar]
- Feng Q. L.; Wu J.; Chen G. Q.; Cui F. Z.; Kim T. N.; Kim J. O. A mechanistic study of the antibacterial effect of silver ions on Escherichia coli and Staphylococcus aureus. J. Biomed. Mater. Res. 2000, 52, 662–668. 10.1002/1097-4636(20001215)52:4<662::AID-JBM10>3.0.CO;2-3. [DOI] [PubMed] [Google Scholar]
- Le Ouay B.; Stellacci F. Antibacterial activity of silver nanoparticles: A surface science insight. Nano Today 2015, 10, 339–354. 10.1016/j.nantod.2015.04.002. [DOI] [Google Scholar]
- Hoseini-Alfatemi S. M.; Karimi A.; Armin S.; Fakharzadeh S.; Fallah F.; Kalanaky S. Antibacterial and antibiofilm activity of nanochelating based silver nanoparticles against several nosocomial pathogens. Appl. Organomet. Chem. 2018, 32, 4327. 10.1002/aoc.4327. [DOI] [Google Scholar]
- Rai M. K.; Deshmukh S. D.; Ingle A. P.; Gade A. K. Silver nanoparticles: the powerful nanoweapon against multidrug-resistant bacteria. J. Appl. Microbiol. 2012, 112, 841–852. 10.1111/j.1365-2672.2012.05253.x. [DOI] [PubMed] [Google Scholar]
- Pandey J.; Shrivastava V.; Nagarajan R. Metastable Bi2Zr2O7 with Pyrochlore-like Structure: Stabilization, Oxygen Ion Conductivity, and Catalytic Properties. Inorg. Chem. 2018, 57, 13667–13678. 10.1021/acs.inorgchem.8b02258. [DOI] [PubMed] [Google Scholar]
- Bhosale A.; Kadam J..; Gade T..; Sonawane K..; Garadkar K. M. Efficient photodegradation of methyl orange and bactericidal activity of Ag doped ZnO nanoparticles. J. Indian Chem. Soc. 2023, 100, 100920. 10.1016/j.jics.2023.100920. [DOI] [Google Scholar]
- Vijay Kumar P.; Pammi S. V. N.; Kollu P.; Satyanarayana K. V. V.; Shameem U. Green synthesis and characterization of silver nanoparticles using Boerhaavia diffusa plant extract and their anti-bacterial activity. Ind. Crops Prod. 2014, 52, 562–566. 10.1016/j.indcrop.2013.10.050. [DOI] [Google Scholar]
- Dawoud T. M. S.; Pavitra V.; Ahmad P.; Syed A.; Nagaraju G. Photocatalytic degradation of an organic dye using Ag doped ZrO2 nanoparticles: Milk powder facilitated eco-friendly synthesis. J. King Saud Univ., Sci. 2020, 32, 1872–1878. 10.1016/j.jksus.2020.01.040. [DOI] [Google Scholar]
- Jayaraman V.; Ayappan C.; Palanivel B.; Mani A. Bridging and synergistic effect of the pyrochlore like Bi2Zr2O7 structure with robust CdCuS solid solution for durable photocatalytic removal of the organic pollutants. RSC Adv. 2020, 10, 8880–8894. 10.1039/D0RA00644K. [DOI] [PMC free article] [PubMed] [Google Scholar]
- a Luo Y.; Cao L.; Huang J.; Feng L.; Yao C. A new approach to preparing Bi2Zr2O7 photocatalysts for dye degradation. Mater. Res. Express 2018, 5 (1), 015039. 10.1088/2053-1591/aaa584. [DOI] [Google Scholar]; b Luo Y.; Cao L.; Feng L.; Huang J.; Yang L.; Yao C.; Cheng Y. Synthesis, characterization and photocatalytic properties of nanoscale pyrochlore type Bi2Zr2O7. Mater. Sci. Eng., B 2019, 240, 133–139. 10.1016/j.mseb.2019.01.017. [DOI] [Google Scholar]
- He T.; Wu D. Synthesis and characterization of Ag/AgCl/Bi2Zr2O7 photocatalyst with enhanced visible-light-driven photocatalytic performance. J. Mater. Sci.: Mater. Electron. 2017, 28 (10), 7320–7325. 10.1007/s10854-017-6418-4. [DOI] [Google Scholar]
- Rajashekharaiah A. S.; Vidya Y. S.; Anantharaju K. S.; Darshan G. P.; Lalitha P.; Sharma S. C.; Nagabhushana H. Photoluminescence, thermoluminescence and photocatalytic studies of sonochemical synthesis of Bi2Zr2O7:Sm3+ nanomaterials. J. Mater. Sci.: Mater. Electron. 2020, 31, 15627–15643. 10.1007/s10854-020-04126-8. [DOI] [Google Scholar]
- Palencia M.; Córdoba A.; Rivas B. L. Concentration-polarization effect of poly(sodium styrenesulfonate) on size distribution of colloidal silver nanoparticles during diafiltration experiments. Colloid Polym. Sci. 2014, 292, 619–626. 10.1007/s00396-013-3096-5. [DOI] [Google Scholar]
- Sabarinathan C.; Karuppasamy P.; Vijayakumar C. T.; Arumuganathan T. Development of methylene blue removal methodology by adsorption using molecular polyoxometalate: Kinetics, Thermodynamics and Mechanistic Study. Microchem. J. 2019, 146, 315–326. 10.1016/j.microc.2019.01.015. [DOI] [Google Scholar]
- Bechambi O.; Chalbi M.; Najjar W.; Sayadi S. Photocatalytic activity of ZnO doped with Ag on the degradation of endocrine disrupting under UV irradiation and the investigation of its antibacterial activity. Appl. Surf. Sci. 2015, 347, 414–420. 10.1016/j.apsusc.2015.03.049. [DOI] [Google Scholar]
- Begam J. N. Biosynthesis and characterization of silver nanoparticles (AgNPs) using marine bacteria against certain human pathogens. J. Adv. Therm. Sci. Res. 2016, 2, 152–156. 10.7439/ijasr.v2i7.3514. [DOI] [Google Scholar]
- Molla A. I.; Furukawa M.; Tateishi I.; Katsumata H.; Kaneco S. Fabrication of Ag-doped ZnO by mechanochemical combustion method and their application into photocatalytic Famotidine degradation. J. Environ. Sci. Health, Part A: Toxic/Hazard. Subst. Environ. Eng. 2019, 54, 914–923. 10.1080/10934529.2019.1608793. [DOI] [PubMed] [Google Scholar]
- Assadi A. A.; Karoui S.; Trabelsi K.; Hajjaji A.; Elfalleh W.; Ghorbal A.; Maghzaoui M.; Assadi A. A. Synthesis and Characterization of TiO2 Nanotubes (TiO2-NTs) with Ag Silver Nanoparticles (Ag-NPs): Photocatalytic Performance for Wastewater Treatment under Visible Light. Materials 2022, 15, 1463. 10.3390/ma15041463. [DOI] [PMC free article] [PubMed] [Google Scholar]
- Ahmed F.; Kanoun M. B.; Awada C.; Jonin C.; Brevet P.-F. An Experimental and Theoretical Study on the Effect of Silver Nanoparticles Concentration on the Structural, Morphological, Optical, and Electronic Properties of TiO2 Nanocrystals. Crystals 2021, 11, 1488. 10.3390/cryst11121488. [DOI] [Google Scholar]
- a Chowdhury A. P.; Shambharkar B. H. Fabrication and characterization of BiOBr-SnWO4 heterojunction nanocomposites with boosted photodegradation capability. Chem. Eng. J. Adv. 2020, 4, 100040. 10.1016/j.ceja.2020.100040. [DOI] [Google Scholar]; b Sharma R.; Dhillon A.; Kumar D. Mentha-Stabilized Silver Nanoparticles for High-Performance Colorimetric Detection of Al(III) in Aqueous Systems. Sci. Rep. 2018, 8, 5189. 10.1038/s41598-018-23469-1. [DOI] [PMC free article] [PubMed] [Google Scholar]
- Rajabi M.; Ghorbani M.; Ali A.; Bhatti A. S. Ag-doped ZnO nanorods for multifunctional applications: UV and ethanol gas sensing. J. Mater. Sci.: Mater. Electron. 2021, 32, 18108–18122. 10.1007/s10854-021-06355-x. [DOI] [Google Scholar]
- Meena S.; Anantharaju K. S.; Malini S.; Dey A.; Renuka L.; Prashantha S. C.; Vidya Y. S. Impact of Temperature-Induced Oxygen Vacancies in polyhedron MnFe2O4 nanoparticles: As excellent electrochemical sensor, supercapacitor and active photocatalyst. Ceram. Int. 2021, 47, 14723–14740. 10.1016/j.ceramint.2020.12.217. [DOI] [Google Scholar]
- Karuppasamy P.; Senthilkumar S.; Ganeshbabu O.; Pitchaimuthu S.; Sennappan M.; Rajapandian V. Sonochemical Synthesis and Characterization of Visible Light Driven CuO@g-C3N4 Nano-Photocatalyst for Eriochrome Black T Dye Degradation in Industrial Dye Effluent. Russ. J. Inorg. Chem. 2022, 67, 2153–2165. 10.1134/S0036023622100631. [DOI] [Google Scholar]
- An C.; Peng S.; Sun Y. Facile Synthesis of Sunlight-Driven AgCl: Ag Plasmonic Nanophotocatalyst. Adv. Mater. 2010, 22, 2570–2574. 10.1002/adma.200904116. [DOI] [PubMed] [Google Scholar]
- Guzman M.; Dille J.; Godet S. Synthesis and antibacterial activity of silver nanoparticles against gram-positive and gram-negative bacteria. Nanomedicine 2012, 8 (1), 37–45. 10.1016/j.nano.2011.05.007. [DOI] [PubMed] [Google Scholar]
- Mao K.; Zhu Y.; Rong J.; Qiu F.; Chen H.; Xu J.; Yang D.; Zhang T.; Zhong L. Rugby-ball like Ag modified zirconium porphyrin metal-organic frameworks nanohybrid for antimicrobial activity: Synergistic effect for significantly enhancing photoactivation capacity. Colloids Surf., A 2021, 611, 125888. 10.1016/j.colsurfa.2020.125888. [DOI] [Google Scholar]
- Karuppasamy P.; Ramzan Nilofar Nisha N.; Pugazhendhi A.; Kandasamy S.; Pitchaimuthu S. An investigation of transition metal doped TiO2 photocatalysts for the enhanced photocatalytic decoloration of methylene blue dye under visible light irradiation. J. Environ. Chem. Eng. 2021, 9 (4), 105254. 10.1016/j.jece.2021.105254. [DOI] [Google Scholar]
- Jaffari Z. H.; Lam S. M.; Sin J. C.; Zeng H. Boosting visible light photocatalytic and antibacterial performance by decoration of silver on magnetic spindle-like bismuth ferrite. Mater. Sci. Semicond. Process. 2019, 101, 103–115. 10.1016/j.mssp.2019.05.036. [DOI] [Google Scholar]
- Chen C.; Bi W.; Xia Z.; Yuan W.; Li L. Hydrothermal synthesis of the CuWO4/ZnO composites with enhanced photocatalytic performance. ACS Omega 2020, 5, 13185–13195. 10.1021/acsomega.0c01220. [DOI] [PMC free article] [PubMed] [Google Scholar]
- Prabakaran E.; Pillay K. Synthesis of N-doped ZnO nanoparticles with cabbage morphology as a catalyst for the efficient photocatalytic degradation of methylene blue under UV and visible light. RSC Adv. 2019, 9, 7509–7535. 10.1039/C8RA09962F. [DOI] [PMC free article] [PubMed] [Google Scholar]
- a Salmanzadeh-Jamadi Z.; Habibi-Yangjeh A.; Xu C.; Wang C. Anchoring Bi4O5I2 and CDs on brown TiO2-x: S-scheme heterojunction mechanism for impressive degradation of several antibiotics under visible light. J. Alloys Compd. 2023, 948, 169711. 10.1016/j.jallcom.2023.169711. [DOI] [Google Scholar]; b Porwal C.; Sharma M.; Vaish R.; Chauhan V. S.; Ahmed S. b.; Hwang W.; Benno Park H. K.; Sung T. H.; Kumar A. Piezocatalytic dye degradation using Bi2O3-ZnO-B2O3 glass-nanocomposites. J. Mater. Res. Technol. 2022, 21, 2028–2037. 10.1016/j.jmrt.2022.10.041. [DOI] [Google Scholar]
- Ramanathan S.; Radhika N.; Padmanabhan D.; Durairaj A.; Paul Selvin S.; Lydia S.; Kavitha S.; Vasanthkumar S. Eco-friendly Synthesis of CRGO and CRGO/SnO2 Nanocomposite for Photocatalytic Degradation of Methylene Green Dye. ACS Omega 2020, 5, 158–169. 10.1021/acsomega.9b02281. [DOI] [PMC free article] [PubMed] [Google Scholar]
- Zahra M.; Yasmeen G.; Aftab F. . l.; Athar H.; Saleem A.; Ambreen S.; Malana M. A. ZnSe-rGO nanocomposites as photocatalysts for purification of textile dye contaminated water: A green approach to use wastewater for maize cultivation. Heliyon 2023, 9, e22687 10.1016/j.heliyon.2023.e22687. [DOI] [PMC free article] [PubMed] [Google Scholar]
Associated Data
This section collects any data citations, data availability statements, or supplementary materials included in this article.