

Abstract
Immune checkpoint inhibitors (ICIs) have yielded remarkable responses but often lead to immune-related adverse events (irAEs). Although germline causes for irAEs have been hypothesized, no individual variant associated with developing irAEs has been identified. We carried out a genome-wide association study of 1,751 patients on ICIs across 12 cancer types. We investigated two irAE phenotypes: (1) high-grade (3–5) and (2) all-grade events. We identified 3 genome-wide significant associations (P < 5 × 10⁻⁸) in the discovery cohort associated with all-grade irAEs: rs16906115 near IL7 (combined P = 3.6 × 10⁻¹¹; hazard ratio (HR) = 2.1); rs75824728 near IL22RA1 (combined P = 3.5 × 10⁻⁸; HR = 1.8); and rs113861051 on 4p15 (combined P = 1.2 × 10⁻⁸, HR = 2.0); rs16906115 was replicated in 3 independent studies. The association near IL7 colocalized with the gain of a new cryptic exon for IL7, a critical regulator of lymphocyte homeostasis. Patients carrying the IL7 germline variant exhibited significantly increased lymphocyte stability after ICI initiation, which was itself predictive of downstream irAEs and improved survival.
Cancer immunotherapy has revolutionized cancer care by harnessing the patient’s own immune system against tumors1. However, because immune checkpoint inhibitors (ICIs) block the body’s natural safeguards that prevent immune overactivation, treatment can also affect nonmalignant tissues and cause autoimmune-like side effects2–5. Thus, patients on ICIs commonly experience immune-related adverse events (irAEs)4,6,7. High-grade irAEs can lead to hospitalization and treatment cessation in 15–30% of patients7, emphasizing the urgent need to understand the mechanisms and predictors of irAEs. Recent studies have also shown that irAEs correlate with positive anticancer responses8, highlighting their relevance to broader therapy outcomes.
One hypothesis for the heterogeneity in irAE onset and severity is the impact of germline genetic determinants of immune activity6. Recent work has shown that polygenic germline risk for autoimmune conditions is correlated with the onset of cutaneous and thyroid irAEs9,10. Previous studies of response to ICIs have also highlighted both individual germline human leukocyte antigen alleles11 and major histocompatibility complex diversity12 as predictors of overall survival. However, to our knowledge no individual genetic variants associated with irAEs or response have so far been established. In this work, we hypothesized that individual germline variants may influence the broad spectrum of irAEs by modulating the general excitability of the immune system, as recently observed for somatic alterations13,14. We carried out a genome-wide association study (GWAS) of irAEs for patients on ICIs at a single institution, followed by replication in patients treated at an independent institution and on clinical trials.
Results
GWAS of irAEs
We carried out a GWAS for two irAE phenotypes in 1,751 patients of European ancestry across 12 cancer types treated with ICIs at a single tertiary institution (Dana-Farber Cancer Institute (DFCI) cohort; Table 1 and Supplementary Fig. 1). Two irAE outcomes were defined for each patient after treatment initiation: (1) ‘high-grade’ irAEs (259 cases, 1,375 controls) determined by manual curation of records according to the National Cancer Institute (NCI) Common Terminology Criteria for Adverse Events v.5 guidelines for grade 3–5 events, with attribution of AEs as being immune-related determined based on the clinical consensus of the patient’s care team; (2) ‘all-grade’ irAEs (339 cases, 1,412 controls) algorithmically identified based on autoimmune-like electronic health record (EHR) diagnosis codes (Supplementary Table 1) and including any high-grade irAEs, followed by manual review to exclude any events that were definitively linked to other causes. Detailed chart review in a subset of 44 random patients found 85% of all-grade irAEs to be consistent with grade 2 or higher events (Methods and Supplementary Table 2). We saw no effect of sex (P = 0.84; Supplementary Fig. 2) and a significant effect of age (hazard ratio (HR) = 1.8 (1.3–2.6), P = 4 × 10⁻⁴; Supplementary Fig. 2) on all-grade irAEs. Patients on CTLA4 or a combination of programmed cell death protein 1 (PD-1)/programmed death-ligand 1 (PD-L1) and CTLA4 monoclonal antibodies experienced a significantly higher rate of irAEs, as previously found15 (Extended Data Fig. 1). Power analyses (Supplementary Fig. 3) showed that this sample was sufficient to identify large effect variants, which we hypothesized to exist for treatment response outcomes given previous pharmacogenetic studies16.
Table 1 |.
Cohort description of the discovery and validation cohort at the MGH
| Profile cohort (discovery) | MGH cohort (replication) | ||
|---|---|---|---|
| Overall (n = 1,751) | Overall (n = 265) | ||
| All-grade irAEs | |||
| Yes | 339 (19.4%) | ||
| No | 1,412 (80.6%) | ||
| High-grade irAEs | High-grade irAEs | ||
| Yes | 259 (14.8%) | Yes | 51 (19.2%) |
| No | 1,375 (78.5%) | No | 214 (80.8%) |
| Not curated | 117 (6.7%) | ||
| Cancer type | Cancer type | ||
| Non-small-cell lung cancer | 539 (30.8%) | Gastrointestinal cancer | 34 (12.8%) |
| Melanoma | 241 (13.8%) | Genitourinary cancer | 30 (11.3%) |
| Other | 236 (13.5%) | Lung cancer | 62 (23.4%) |
| Glioma | 112 (6.4%) | Other | 66 (24.9%) |
| Breast carcinoma | 111 (6.3%) | Skin cancer | 73 (27.5%) |
| Esophagogastric carcinoma | 111 (6.3%) | ||
| Renal cell carcinoma | 109 (6.2%) | ||
| Bladder cancer | 94 (5.4%) | ||
| Head and neck carcinoma | 90 (5.1%) | ||
| Ovarian cancer | 40 (2.3%) | ||
| Cancer of unknown primary origin | 34 (1.9%) | ||
| Colorectal cancer | 34 (1.9%) | ||
| Sex | Sex | ||
| Female | 814 (46.5%) | Female | 119 (44.9%) |
| Male | 937 (53.5%) | Male | 146 (55.1%) |
| Age | Age | ||
| Mean (SD) | 63.0 (12.4) | Mean (SD) | 62.3 (13.8) |
| Median (min–max) | 63.9 (19.6–102.00) | Median (min–max) | 64.0 (22.3–90.2) |
| Type of treatment | Type of treatment | ||
| CTLA4 | 49 (2.8%) | CTLA4 | 24 (9.1%) |
| Combination therapy | 154 (8.8%) | Combination therapy | 27 (10.2%) |
| PD-1/PD-L1 | 1,548 (88.4%) | PD-1/PD-L1 | 214 (80.8%) |
| Sequencing | |||
| Before ICI initiation | 1,363 (77.8%) | ||
| After ICI initiation | 388 (22.2%) | ||
| Start year | |||
| Before 2016 | 357 (20.4%) | ||
| 2016 | 416 (23.8%) | ||
| 2017 | 557 (31.8%) | ||
| 2018 | 305 (17.4%) | ||
| After 2018 | 116 (6.6%) | ||
We identified three genome-wide significant loci (P < 5 × 10⁻⁸) associated with all-grade irAEs: 1 near interleukin 7 (IL7) at chr8q21, 1 near the interleukin 22 receptor subunit alpha 1 (IL22RA1) at chr1p36 and the third association at chr4p15 (Fig. 1 and Supplementary Fig. 4). No genome-wide significant associations were identified for high-grade irAEs. We tested each single-nucleotide polymorphism (SNP) for association with individual irAE subtypes and found that all three SNPs were nominally significant across multiple irAE subtypes with no clear outliers (Supplementary Fig. 5a and Supplementary Table 3) and were significant in the 80% of patients on PD-1 ICIs (with insufficient power to test differences by drug class such as CTLA-4 versus PD-1 ICIs; Supplementary Fig. 6a). Neither variant was associated with overall survival nor with death without irAEs, even though all all-grade irAEs were associated with longer overall survival in a time-dependent analysis (HR = 0.78 (0.65–0.94), P = 8.6×10⁻³; Supplementary Table 4), which is consistent with previous findings.
Fig. 1 |. Manhattan plot of irAE GWAS associations.
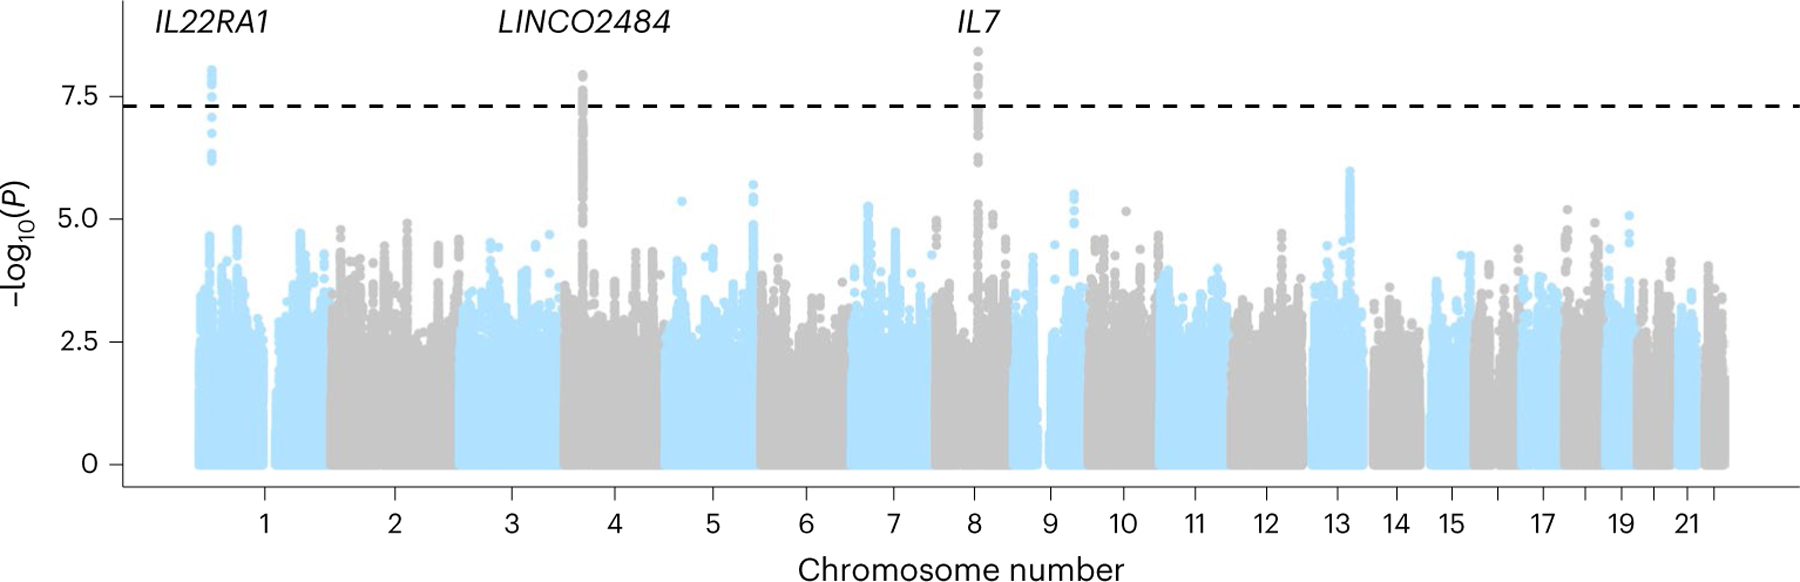
Associations in the DFCI discovery cohort for all-grade irAEs. Each dot represents an associated SNP, with position of the SNP (x axis) and P value of the association (y axis, −log10 scale). We found three genome-wide significant associations, indicated by associations exceeding the dashed line at P = 5 × 10⁻⁸.
The lead 8q21 SNP was rs16906115, a common variant in an intron of IL7, with an HR = 2.0 (1.6–2.5) (P = 3.8 × 10⁻⁹, HR corrected for imputation error; Methods, Fig. 2a,d and Supplementary Fig. 7). Within individual cancer types, a consistent sign was observed in 9 out of 11 cancer types (P = 2.7 × 10⁻² by a one-sided binomial test) with nominal significance (P < 0.05) in non-small-cell lung cancer, melanoma, renal cell cancer, bladder cancer, cancer of unknown primary, as well as the collection of ‘other’ less common cancer types (Fig. 2a). The lead 1p36 SNP was rs75824728, a common variant in an intron of IL22RA1, with an HR = 1.9 (1.5–2.4) (P = 8.4 × 10⁻⁹; Extended Data Fig. 2a). This SNP was also nominally significantly associated with high-grade irAEs with a comparable effect size (HR = 1.5 (1.1–2.0), P = 1.5 × 10⁻²; Supplementary Fig. 8a). Motivated by this nominal effect on high-grade irAEs, we incorporated an additional 734 patients with germline and irAE data, which further increased the significance of this association (HR = 1.4 (1.1–1.8), P = 4.1 × 10⁻³; Supplementary Fig. 8b). Within individual cancer types, the association was nominally significant in non-small-cell lung cancer, melanoma, breast cancer, as well as the collection of ‘other’ less common cancer types (Extended Data Fig. 2a). The lead 4p15 SNP was rs113861051 with an HR = 2.0 (1.6–2.6) (P = 1.1 × 10⁻⁸) (Extended Data Fig. 2b).
Fig. 2 |. Discovery associations and replication in MGH and CT cohorts.
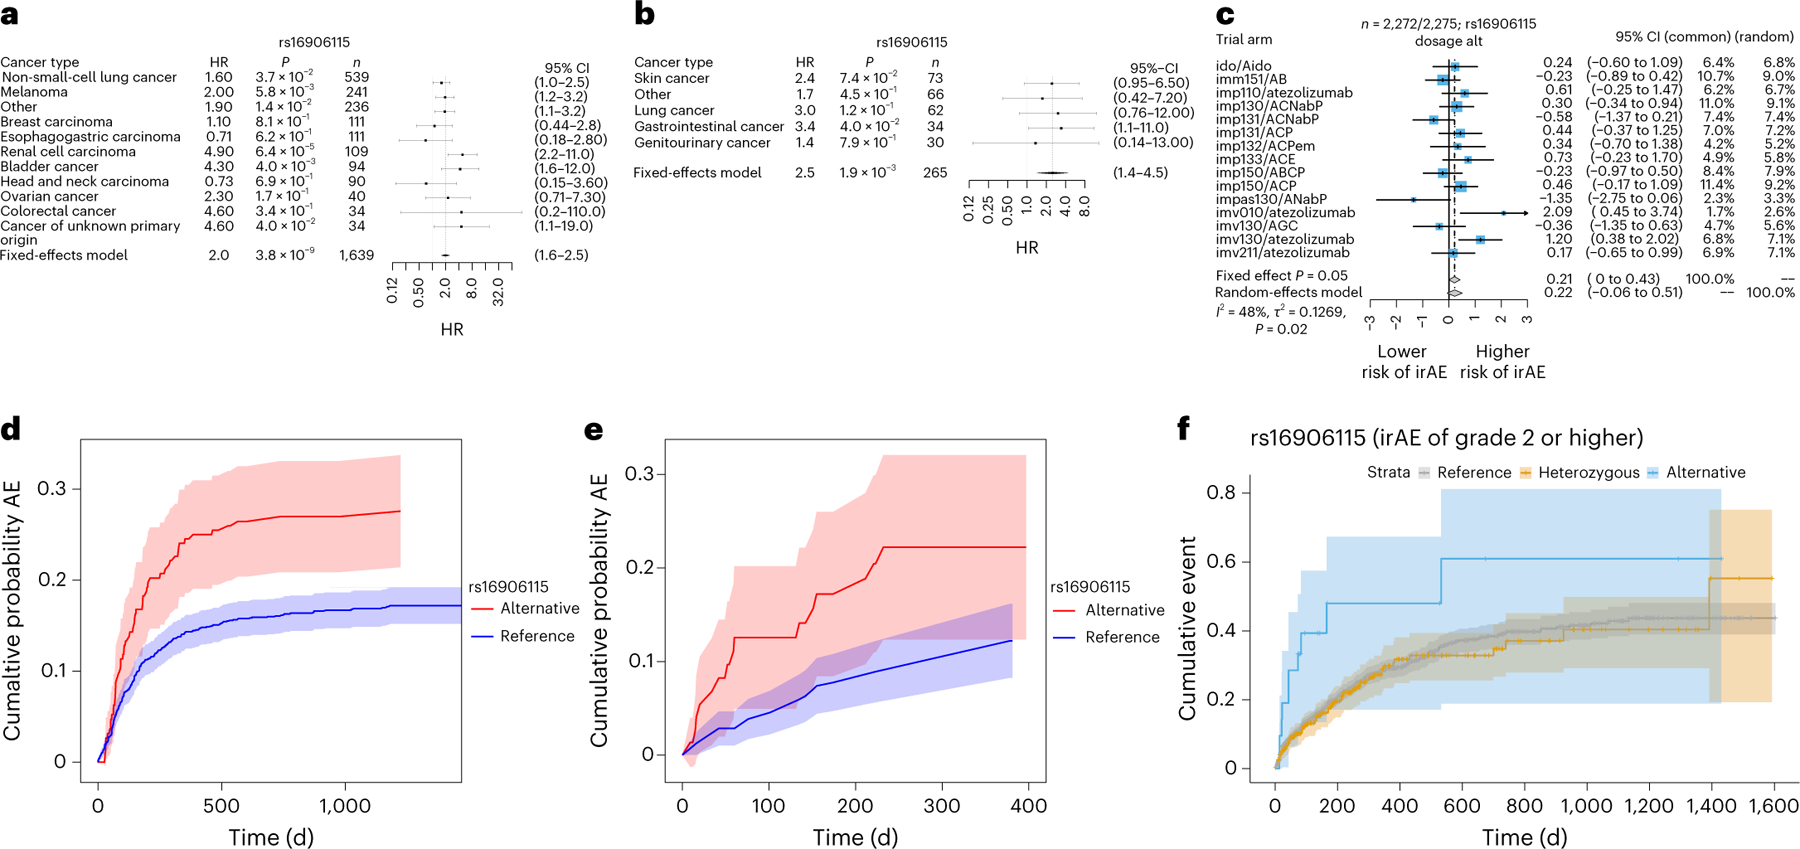
a–c, Forrest plot of genome-wide significant association (reference dosage for allele G) with all-grade irAEs at 8q21 in the Profile cohort (glioma did not converge due to the low number of events and was therefore excluded) (a), MGH cohort (b) and CT cohort (c). The error bars correspond to the 95% confidence interval (CI) around the mean effect size. Significance was obtained from a two-sided Wald test. d–f, Nonparametric Aalen–Johansen estimator (Methods) for the cumulative incidence of adverse events after ICI initiation stratified on SNP dosage in the DFCI discovery cohort (d), MGH replication cohort (e) and using a Kaplan–Meier estimator in the CT cohort (f). The shaded areas correspond to the 95% CIs.
We evaluated potential modifiers or interactions of the discovered associations. First, sex and age did not significantly interact with any of the genome-wide significant associations with all-grade irAEs (Supplementary Table 5). Second, using a normative cohort of >23,000 pan-cancer patients not on ICIs at DFCI, no significant association between any of the three SNPs and the time from sequencing to the first toxicity (using the same International Classification of Diseases (ICD) codes as for all-grade irAEs) was observed (Supplementary Fig. 10), indicating that the SNP effects were specific to the ICI setting. Likewise, none of the three lead SNPs were significantly associated with previous autoimmune disease defined based on ICD codes, nor with a polygenic risk score (PRS) for autoimmune disease17 either in the cohort on ICIs or in patients not on ICIs (Methods and Supplementary Fig. 9), suggesting that these were not generic autoimmune disease variants. Fourth, we carried out a broad scan for germline, clinical and somatic features (including tumor mutational burden) associated with irAEs or interacting with the identified SNPs but observed no significant associations after multiple test correction (Supplementary Table 6), underscoring the contribution of our germline findings to irAEs. Finally, we investigated various adjustments for the competing risk of death, immortal time bias and inclusion/exclusion of individuals with immune-related diagnoses at the start of treatment and observed no significant impact on these associations (Methods and Supplementary Fig. 11).
Independent replication of the IL7 variant
We evaluated the three discovery SNPs in two independent cohorts for replication (see Methods for cohort details). The rs16906115 variant near IL7 replicated significantly (HR = 2.5 (1.4–4.5), P = 1.9 × 10⁻³) in an independent cohort of 265 patients on ICIs treated at Massachusetts General Hospital (MGH cohort; Methods) with severe irAEs requiring hospitalization and confirmed by chart review (Fig. 2b,e and Extended Data Fig. 3). rs16906115 also replicated nominally (HR = 1.2 (1.0–1.5), P = 0.05) in a second cohort of 2,275 patients on clinical trials (CT cohort) for ICIs with grade 2–5 irAEs recorded as part of the trial (Fig. 2c,f). Although no significant outliers were observed, a test for heterogeneity of effect sizes across trials was nominally significant (P = 0.02), primarily driven by the IMpassion130 triple-negative breast cancer study. Further stratifying by responders and nonresponders (Supplementary Table 7), the IL7 SNP association became more significant in responders (HR = 1.38, P = 0.033) and less significant in nonresponders (HR = 1.21, P = 0.30), although the difference was not statistically significant. Subanalyses did not show significant associations with any other event grade (Supplementary Figs. 12–14) or irAE subtype (Supplementary Figs. 12 and 15). The other two associations, rs75824728 near IL22RA1 and rs113861051 at 4p15, did not replicate in either independent cohorts, although all three associations were significant in a meta-analysis with the MGH cohort. (Due to data constraints, we could not perform a genome-wide meta-analysis with the CT cohort.) Since the CT cohort had detailed response data, we tested for a direct association between each of the three irAE SNPs and progression-free survival or overall survival, and none were significant. Lastly, while this manuscript was in preparation, the variant near IL7 was independently replicated in a third cohort of 214 melanoma patients on ICIs in the UK with severe (grade 3 or above) irAEs requiring corticosteroids, which was further molecularly characterized in parallel work18. Thus, the IL7-associated variant replicated in a total of three independent cohorts (Supplementary Table 8).
Colocalization of IL7 GWAS variant with a new IL7 cryptic exon
We sought to identify a putative mechanism for the IL7 locus by integrating our GWAS with molecular data. In tissue-specific expression quantitative trait loci (QTLs) mapped by the GTEx consortium19, the lead irAE SNP was significantly associated with IL7 exon junction usage in the testis for the chr8:78,740,082–78,749,524 (hg38, Supplementary Fig. 16) junction (which we called IL7junc) and had an R2 of 0.98 to the lead IL7junc QTL (rs7816685), which was also in the irAE GWAS credible set (Supplementary Table 9 and Supplementary Fig. 17). By inspection of the raw RNA sequencing (RNA-seq) coverage and junction plots, we observed that carriers of the risk allele exhibited splicing and activation of a new 70-base pair (bp) cryptic exon (spanning chr8:78,746,601–78,746,671, which we called IL7ce for ‘cryptic exon’), whereas new junction reads were entirely absent from all homozygous noncarriers (Fig. 3a). The SNP had a stronger effect on IL7ce and explained the association with IL7junc in a conditional analysis, consistent with IL7ce being the causal mediator (Fig. 3b and Supplementary Fig. 16). rs7816685 was the most significant QTL and the only variant located in the splice region of IL7ce and was predicted to be −1bp from an acceptor gain region for IL7 by both SpliceAI20 and Pangolin21. Using a method for de novo iso-form reconstruction (Methods) identified a new transcript spanning chr8:78,732,772–78,746,671, which initiated at rs7816685 and was significantly associated with the SNP: detected in 20 out of 54 carriers and 0 out of 54 noncarriers (odds ratio = 10, P = 1.5 × 10⁻⁴; Supplementary Table 10 and Extended Data Fig. 4). rs7816685 was thus consistent with initiating a new IL7 transcript, although other correlated SNPs cannot be fully ruled out without experimental validation.
Fig. 3 |. IL7 SNP effect cryptic exon activity in GTEx data.
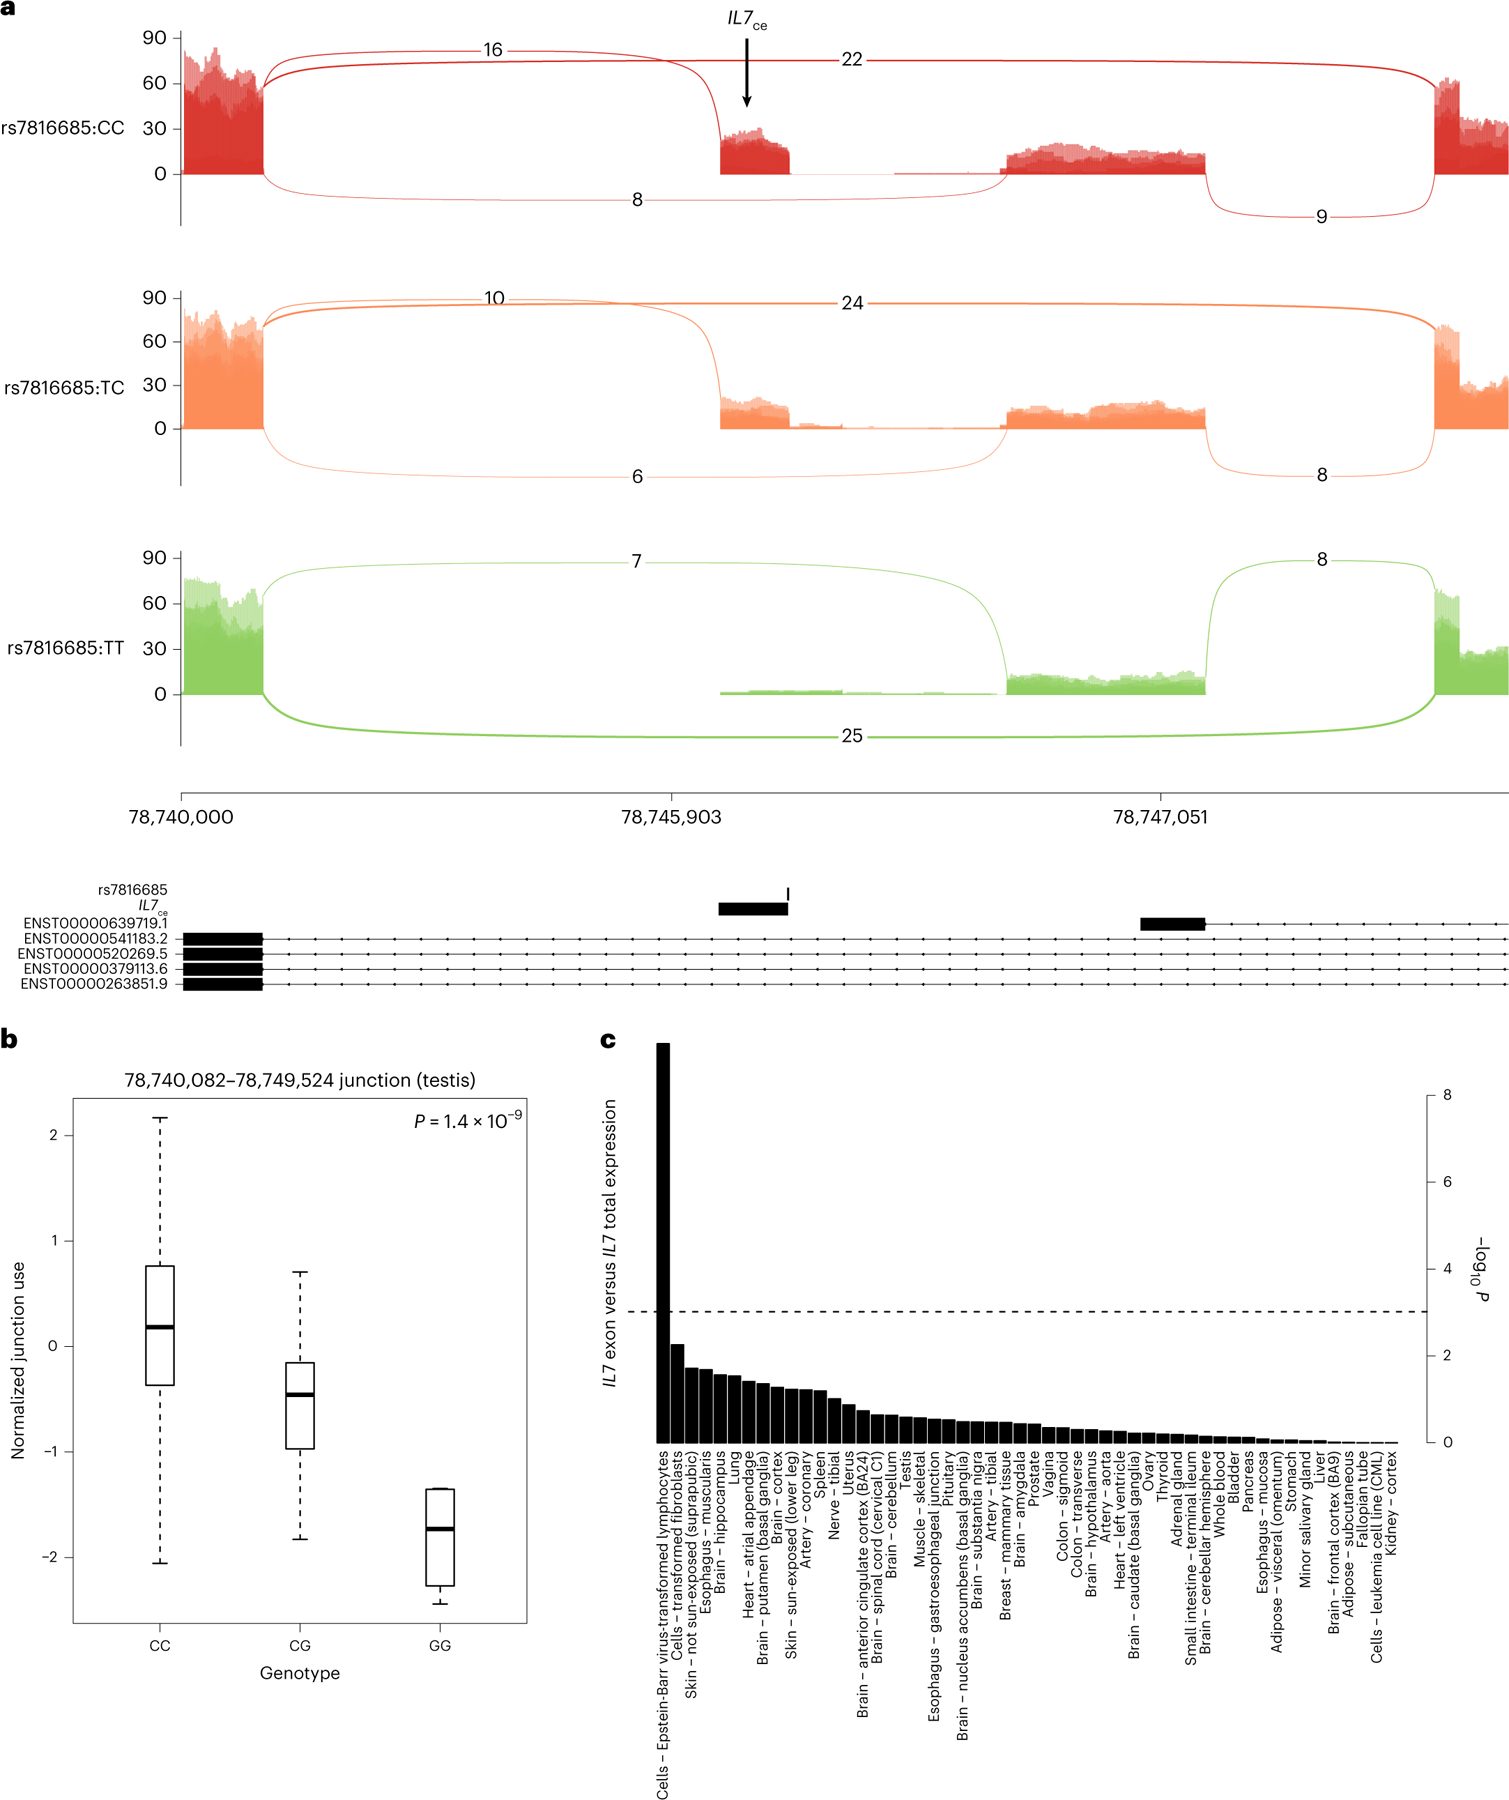
a, Sashimi plot of alternative splicing of IL7 stratified on the lead splice QTL, with the putative causal variant shown below and the cryptic exon highlighted (IL7ce). b, Cryptic exon activity stratified by lead splice QTL genotype (n = 322). c, Significance of coexpression of IL7 and IL7ce across GTEx tissues (Pearson correlation). Significance was obtained from linear regression (two-sided t-test). For the box plot, the bounds of the boxes are the 25th and 75th percentiles around the median; the minima and maxima of the whiskers correspond to 1.5× the interquartile range (IQR), additional points further from the median are shown as outliers.
Considering IL7ce as the putative functional mechanism, we next quantified its activity in a broader set of tissues and cell types. Across the GTEx tissues, IL7ce expression was low for most tissues except for testis and lymphoblastoid cell lines (LCLs) exhibiting high outlier expression (Supplementary Fig. 18a), the latter consistent with the role of IL7 in lymphoid cell development. LCLs uniquely exhibited significant correlation between IL7ce and total IL7 expression (Fig. 3c) as well as significantly higher IL7:IL7R coexpression in the presence of IL7ce (P = 3.4 × 10⁻³; Supplementary Fig. 18b), suggesting that IL7ce may stabilize IL7 expression or increase IL7R binding in lymphocytes. To better understand the precise cell type of action, we mapped IL7ce in publicly available RNA-seq from sorted immune-related cells from patients with autoimmune diseases: IL7ce was highly expressed in B cells and moderately expressed in CD4 T cells, with no observable expression in the other immune cell types (Supplementary Fig. 19). In parallel work, the B cell-specific effect of rs16906115 on IL7 was confirmed in patients with melanoma receiving ICIs and its influence on T cell development was further functionally characterized18.
Association of IL7 variant with response in patients not on ICIs from The Cancer Genome Atlas
As noted above, the IL7 SNP was not associated with overall survival in any of our cohorts on ICIs and we further investigated this effect in treated patients from the The Cancer Genome Atlas (TCGA). We focused on 433 patients with cutaneous melanoma (SKCM), which included both primary and metastatic patients, in contrast to other TCGA cancers. Strikingly, we observed a significant association between the IL7 germline SNP and favorable progression-free survival (HR = 0.47 per irAE-increasing allele after adjusting for age and stage, P = 1.7 × 10⁻⁵, Supplementary Table 11), with consistent and significant effects for overall survival and other end points (Extended Data Figure 5), indicating that the irAE-increasing allele can also exhibit an antitumor influence outside of the ICI setting. We attempted to quantify IL7ce activity in the RNA-seq data but, in contrast to the newer GTEx data which used longer reads and higher mean depth, coverage of this region in the TCGA was low; therefore, no junction-spanning reads were observed. The IL7 SNP was nominally associated with raw IL7ce coverage (P = 4.5 × 10⁻³) and became more significant as an interaction with deconvoluted B cell proportions22 (P = 1.5 × 10⁻⁷; Methods), consistent with B cell specificity (Supplementary Fig. 20), although we caution that both IL7ce coverage and cell type deconvolution are probabilistic estimates with uncertainty. Overall, we found clear evidence of a germline effect on antitumor response in this independent and conventionally treated population.
Association of IL7 variant with lymphocyte homeostasis
Due to the known role of IL7 in lymphocyte homeostasis23, we explored whether the influence of rs16906115 on irAEs was reflected in the peripheral blood lymphocyte count from clinical laboratory data. As a surrogate for lymphocyte expansion/homeostasis, we defined the change in relative lymphocyte count (percentage of circulating white blood cell count) using measurements 30 d before/after ICI initiation for patients in the DFCI and MGH cohorts (we refer to this as ). In the DFCI cohort, carriers of the risk allele exhibited no significant change in lymphocytes (median (−0.80 to 1.2], P = 0.69) whereas noncarriers had significantly reduced (median (−1.3 to 0.50), P = 2.3 × 10⁻⁶ by paired Wilcoxon test), which was replicated in the MGH cohort (median (−6.4 to 3.5), P = 3.8 × 10⁻¹¹ for non-carriers and median (−3.4 to 3.35), P = 0.95 for carriers). The difference in between carriers and noncarriers was significant in both the DFCI (difference in mean (−2 to 0), P = 0.040) and MGH cohorts ( (−8.5 to −1.3), P = 0.0080; Fig. 4), as well as an independent cohort of patients with melanoma18. Similarly, defined 30 d before versus after irAEs was stable for carriers (P = 0.49) but not for noncarriers (P = 2.2 × 10⁻³), although this association may be complicated by steroid use (Supplementary Fig. 21, Supplementary Table 13). Thus, the IL7 variant had a consistent stabilizing effect on lymphocyte counts at the initiation of ICI therapy and at the onset of irAE. Results were similar when using absolute lymphocyte count. Lastly, we investigated whether this phenomenon pointed to broader lymphocyte dynamics irrespective of genotype status. Indeed, higher was nominally associated with increased irAE incidence (HR = 1.2 per s.d., P = 0.018) and a concomitant increase in overall survival for those patients not experiencing any irAE (HR = 0.87, P = 1.6 × 10⁻³) in the DFCI cohort (Supplementary Table 12), although we note that is likely a noisy surrogate for the underlying dynamic immune process and not a direct biomarker itself.
Fig. 4 |. IL7 SNP effect on lymphocyte homeostasis in patients on ICIs.
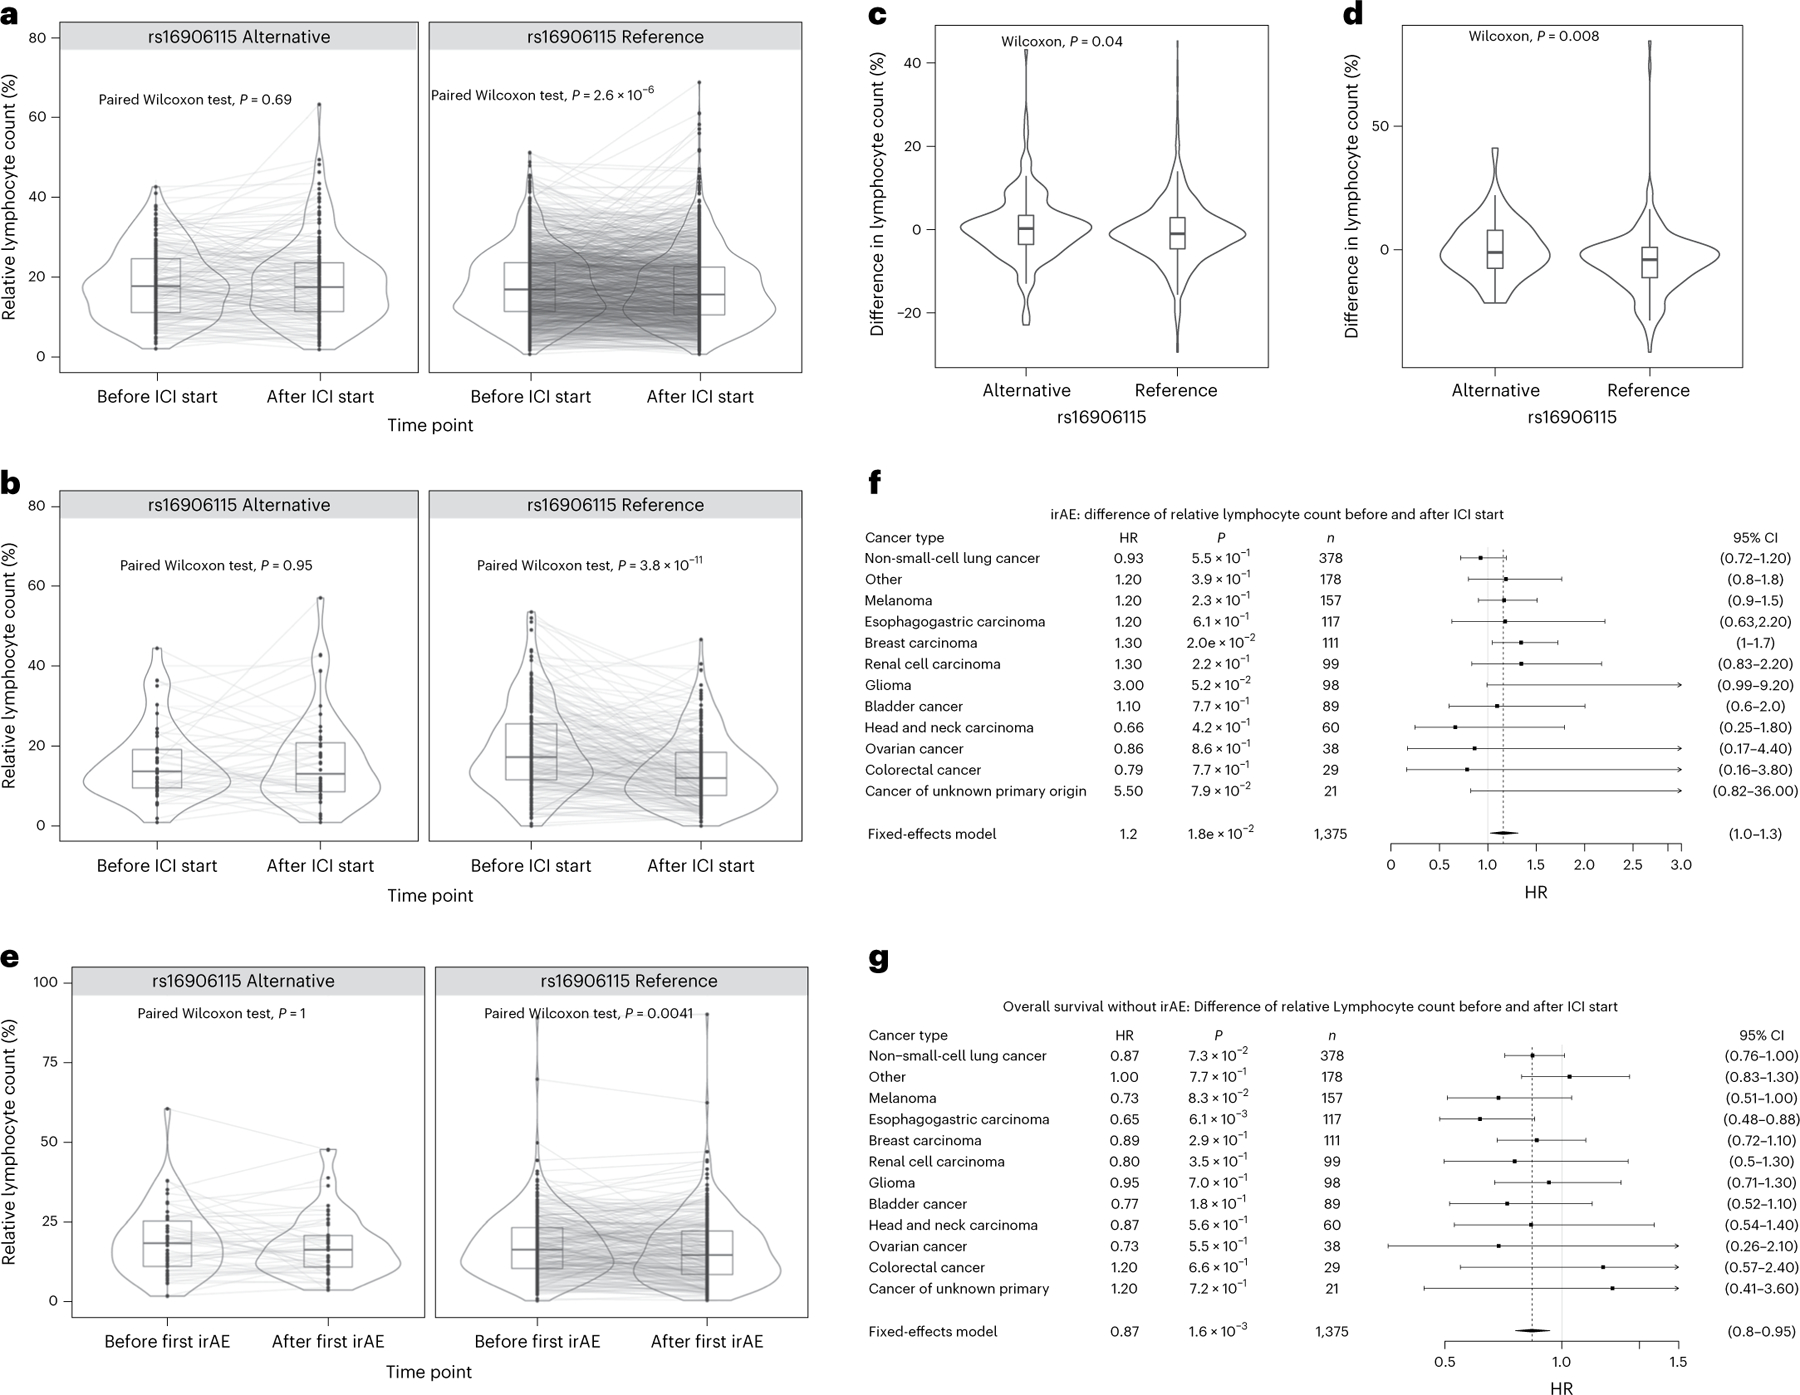
a–e, Lymphocyte counts (percentage of total number of circulating leukocytes) up to 30 d before and after ICI initiation for cases and controls. Two-sided paired Wilcoxon test between time points in carriers and noncarriers in the DFCI (n = 1,375) (a) and MGH (n = 251) (b) cohort. Two-sided Wilcoxon test of the difference in lymphocyte counts before versus after ICI initiation between carriers and noncarriers in the Profile (n = 1,375) (c) and MGH cohort (n = 251) (d). Two-sided paired Wilcoxon test between before and after first irAE in carriers and noncarriers in the DFCI cohort (n = 337) (e). For the box plots, the bounds of the boxes are the 25th and 75th percentiles around the median; the minima and maxima of the whiskers correspond to 1.5× the IQR; additional points further from the median are shown as outliers. f,g, Association between difference in lymphocyte counts before and after ICI initiation and developing irAE (f) as well as death without an irAE (g). The error bars correspond to the 95% CI around the mean effect size. Significance was obtained with a two-sided Wald test.
Discussion
We conducted a GWAS of irAEs in an observational pancancer setting, identifying three new genome-wide significant associations, with replication of a variant near IL7 in three independent cohorts. This variant appeared to initiate a new cryptic isoform of IL7, was predictive of lymphocyte stability in patients on ICIs and improved prognosis in TCGA melanoma, which is predominantly a cohort not on ICIs. Although we focused this work on the mechanistic follow-up of IL7 due to its consistent replication, the independent associations near IL22RA1 and 4p15 may pinpoint additional mechanisms.
Although the putative IL7 mechanism identified in this work has not previously been linked to irAEs, IL7 has been extensively studied for its involvement in immune response and autoimmune disease. IL7 has a critical role in the development and maturation of T cells, limits organ toxicity during antiviral immune response and supports aberrant immune activity in autoimmune disease24. There is evidence that IL7 expression blocks PD-1, leading to type 1 diabetes25, as well as involvement in the development of chronic colitis26, functioning like a natural checkpoint inhibitor27. The administration of IL7 in patients with cancer results in increased lymphocyte counts (particularly CD4+ and CD8+ T cell counts) and reduced regulatory T cell counts23. Therefore, it is plausible that the IL7 risk variant results in a more facilitatory milieu for autoimmune/autoreactive immune responses in patients on ICIs, explaining its association with irAEs. Several studies have shown that IL7 receptor blockade can reverse the autoimmune response25,28, offering a potential therapeutic avenue for managing IL7-mediated irAEs.
Our work highlights a complex relationship between irAEs and clinical response. In the cohorts on ICIs, the IL7 SNP was associated with increased irAEs but was not associated with clinical responses or survival. In the TCGA cohort with melanoma, largely not treated with ICIs, the IL7 SNP was associated with improved survival. Taken together, the IL7 SNP may thus inform treatment, with carriers exhibiting better clinical outcomes off ICIs but more irAEs on ICIs. We additionally observed IL7 SNP carriers to exhibit increased lymphocyte stability, whereas lymphocyte stability itself, as a pharmacodynamic biomarker, was associated with both increased irAEs and improved overall survival. Thus, we hypothesize that lymphocyte stability may capture multiple immunological processes: in carriers of the germline SNP, a host autoimmune response to ICIs that leads to irAEs; in noncarriers, a broader antitumor response that can lead to improved survival and irAEs (Extended Data Fig. 6). While our study has uncovered a genetic instrument, detailed response and treatment history data in a large, genotyped cohort will enable further dissection of these processes.
Our study has several limitations. First, the heterogeneity of irAE presentation and severity led us to define two partially overlapping outcomes. In the discovery GWAS, irAEs were manually abstracted from clinical notes and algorithmically inferred using EHR data (followed by manual quality control) and may have thus included some events with ambiguous causes, especially for irAEs that were observed well after the treatment was administered29. Second, while our study was sufficiently large to discover replicating associations, the power to identify moderate effect sizes was still low and additional associations with irAEs may yet be discovered (particularly within individual cancer types). The substantial differences in power between the all-grade and high-grade outcomes also made characterization of grade-specific effects challenging. Third, the observational nature30 of the DFCI/MGH cohorts likely resulted in a heterogeneous patient population. Although we attempted to control for common covariates, most patients had a complex treatment history that could not be modeled. We expect this heterogeneity to primarily influence power and generalizability since germline genetic variation cannot be caused by unmodeled confounders. Fourth, we restricted our study to individuals of European ancestry to mitigate possible population stratification31 but further studies in individuals of non-European ancestry are warranted to understand the generalizability of these associations. In particular, the associated variant rs7816685 near IL7 has an allele frequency of 31% in East Asian populations (compared to 6.5% in Europeans) and may thus explain more variance in irAEs in Asian patients. Fifth, the use of imputation from tumor-only panel sequencing for the discovery GWAS produced imputed variants with more noise than direct genotyping and likely excluded some difficult-to-impute or rare polymorphisms. This limitation also offers an opportunity for further analysis of this variant in existing panel sequencing datasets32.
The identification of genetic variants associated with irAEs is consistent with a hypothesized patient-specific immunological set point and opens avenues for future analysis to inform the genetic architecture of irAEs including: genetic correlation with other complex traits33; PRS for patient stratification34; and Mendelian randomization to estimate the causal influence of irAEs on other cancer outcomes35. Larger studies will enable polygenic analyses to uncover the cell types, gene sets and pathways that drive these outcomes. Ultimately, the utility of these associations to identify high-risk patients for monitoring or treatment modifications must be evaluated in prospective, randomized trials in conjunction with their influence on antitumor response.
Methods
Cohort definition, consent and genotyping
This research complies with all relevant ethical regulations. Analyses were carried out across three cohorts with genotyping and clinical information.
DFCI cohort.
A total of 1,751 patients of European ancestry (to avoid any confounding from population stratification) were treated with ICIs at the DFCI from 2013 to 2020 (Table 1), across 12 cancer types. Approximately 90% of patients were treated with PD-1/PD-L1 inhibitors and approximately 10% with combination immunotherapy, defined as both CTLA4 and PD-1/PD-L1 (Supplementary Table 14). Patients were biopsied and sequenced on the OncoPanel tumor sequencing platform36 targeting 275–447 cancer genes and germline SNPs were imputed using ultra-low-coverage off-target reads37 with imputation accuracy evaluated using a partially overlapping set of directly genotyped individuals (Supplementary Fig. 1). For normative comparisons, a pancancer control cohort of 23,763 individuals treated with non-ICI therapies at the DFCI was similarly sequenced and imputed through the same pipeline. DFCI samples were selected and sequenced from patients who were consented under institutional review board (IRB)-approved protocol 11–104 and 17–000 from the Dana-Farber/Partners Cancer Care Office for the Protection of Research Subjects. Written informed consent was obtained from participants before inclusion in this study. Secondary analyses of previously collected data were performed with approval from the Dana-Farber IRB: DFCI IRB protocol 19–033 and 19–025. Waiver of Health Insurance Portability and Accountability Act authorization was approved for both protocols.
MGH cohort.
This was an independent pancancer cohort of 265 patients on ICIs at the MGH with direct germline genotyping on the Illumina Multi-Ethnic Genotyping Array (MEGA) (Table 1). Occurrence of high-grade irAEs (33 cases, 163 controls) was obtained through the Severe Immunotherapy Complications Program at MGH for inpatient management of high-grade irAEs. Each high-grade irAE was clinically confirmed by an oncology team with expertise in diagnosing and managing irAEs and secondarily verified by organ-specific clinical irAE experts at the corresponding disease center. Cancer types with fewer than 30 patients were combined into ‘other’ cancers (Supplementary Table 15). This study was approved by the Massachusetts General Brigham IRB (protocol no. 2020P002307), which waived the informed consent requirement because only deidentified data were used. The authors acknowledge that data reporting was consistent with the IRB-approved protocol for deidentified reporting of patient data.
CT replication cohort.
A second replication analysis of individual associations was carried out in 2,275 patients who were treated with atezolizumab (anti-PD-L1) and were of European ancestry and met sample and genetic data quality control from 12 previously published clinical trials sponsored by F. Hoffmann–La Roche/Genentech (Supplementary Table 16). Studies included trials of atezolizumab in renal cell carcinoma (IMmotion), lung cancer (IMpower), triple-negative breast cancer (IMpassion), urothelial cancer (IMvigor) and advanced cancers (indoleamine 2,3-dioxygenase; majority lung, breast or ovarian). All patients provided informed consent for the respective main study. A subset of patients signed an optional Research Biosample Repository (RBR) Informed Consent Form (ICF) to provide whole-blood samples for future research, including study of inherited and noninherited genetic variation from these whole-blood samples. Ethics committees and IRBs at each study site for each clinical trial approved the clinical trial protocol, the main study ICF and the RBR ICF (Supplementary Table 20). Whole-genome sequencing data were collected from whole blood (as described previously38) and used to compute individual variant association statistics.
TCGA SKCM cohort.
Data from 433 patients with melanoma (SKCM) in the TCGA were accessed through the Genomic Data Commons Data Portal. Germline data were called from normal/blood on an Affymetrix SNP 6.0 SNP array using Birdsuite v1.5.5 and then imputed using the Michigan Imputation Server. Outcomes and clinical covariates for the TCGA data were accessed from the Clinical Data Resource39.
Statistical analysis
The GWAS was carried out across all variants in the DFCI and MGH cohorts for association with time to irAE separately for each irAE definition. In all cohorts, individuals were restricted to European ancestry. Due to the competing risk of death while on treatment, a cause-specific HR was computed for every SNP using a mixed-effects model40, equivalent to censoring on death or loss to follow-up. In each cohort, covariates were included for ancestry, age, sex and line/type of treatment (see below). Statistical fine-mapping ofgenome-wide significant loci was carried out using the SuSIE software v.0.9.57 (ref. 41). irAE probabilities and cumulative incidence were quantified using the Aalen–Johansen estimator, a nonparametric estimator that accounts for competing risks42. Associations between irAEs and overall survival were evaluated using a time-dependent covariate coded as 0 for controls and as 1 starting from the time of the first irAE. For the TCGA SKCM survival analyses, tests were performed using Cox proportional-hazards regression (with age, sex and stage as covariates) and visualized using Kaplan–Meier curves.
Analysis of molecular data
Associations were functionally characterized using publicly available gene expression and splicing data from multiple resources. Variants were connected to putative target genes using gene expression and splicing QTLs across 44 tissues from the GTEx consortium43. RNA-seq BAM files were downloaded from the GTEx repository, splice junction usage was analyzed using ggsashimi v1.1.5 (ref. 44), de novo transcript reconstruction was conducted using Cufflinks v.2.2.1 (ref. 45) and candidate coding regions were inferred using TransDecoder v5.5.0. Cell sorted data across six immune cell subsets from individuals with autoimmune diseases and healthy controls were accessed from Collado-Torres et al.46 and the Gene Expression Omnibus (SRP045500). Pancancer RNA-seq BAM files from the TCGA were used to quantify expression across tumor sites47 and correlated against previously defined immune populations and signals48. Analyses of read-level activity and cryptic splicing were carried out using the recount2 framework49. Clinical laboratory measurements were extracted from EHR data via the Oncology Data Retrieval System50 framework for the DFCI cohort and the Research Patient Data Registry51 for the MGH cohort.
Sample collection, genotype imputation and quality control
DFCI cohort.
The DFCI cohort was sequenced as part of the Profile project, a prospective clinical sequencing effort for consented patients undergoing routine treatment at the DFCI and affiliated hospitals. A custom targeted hybrid capture sequencing platform (OncoPanel) was used to assay genomic variation from tumor biopsies. Each sample was sequenced on 1 of 3 panel versions targeting the exons of 275,300 and 447 genes, respectively. Samples meet a minimum of 30X coverage for 80% of targets for analysis. Somatic variation (including single-nucleotide variants, insertions/deletions and copy number variation) was called by the Profile clinical bioinformatics pipeline and signed out by a pathologist at Brigham & Women’s Hospital after technical review, as described previously36. Off-target and on-target reads from the sequenced BAMs were imputed using the STITCH imputation software v1.6.6 (ref. 37,52). Imputed variants were restricted to a minor allele frequency (MAF) > 1% and imputation INFO score >0.4. Genetic ancestry was inferred using principal component projection with the SNPWEIGHTS software v2.1. Continental components were used to exclude individuals of non-European ancestry; within-Europe components were included as covariates.
A partly overlapping cohort of 833 individuals (126 overlapping patients on ICIs) with both OncoPanel tumor sequencing and direct germline SNP array genotyping (on the Illumina MEGA) was used to benchmark imputation accuracy. Pearson correlation for each SNP was computed between the tumor-imputed and germline-genotyped individuals. Mean imputed SNP correlation was 0.86 after variant quality control and highly uniform across the genome (Supplementary Fig. 1). Any remaining noise was only expected to make the HRs of associations in the GWAS using imputed SNPs more conservative. Detailed analysis of variant imputation accuracy have been described separately and the imputation workflow is publicly available37. For visualizations where imputed patients were stratified by variant carrier/noncarrier status, the decision boundary was determined using logistic regression of carrier status on imputed dosage in the samples with both tumor sequencing and SNP array data.
MGH cohort.
Blood samples were collected from MGH patients and genotyped on the Illumina MEGA array. Data were imputed to the 1000 Genomes reference panel using the Haplotype Reference Consortium imputation server, followed by quality control removing variants with an MAF < 1% and INFO score < 0.9. Genetic ancestry was inferred using in-sample principal components and restricted to individuals with European ancestry.
CT cohort.
A subset of patients signed an optional RBR ICF to provide whole-blood samples for future research, including study of inherited and noninherited genetic variation from these whole-blood samples. Whole-genome sequencing data were collected from whole blood as described previously. Genetic ancestry was inferred using ADMIXTURE and restricted to individuals with European ancestry (ancestry > 0.7). In-sample principal components were also computed to account for any remaining population structure.
Outcome definitions in the DFCI cohort
Mortality was collected using linkage to the National Death Index through 2019. For patients who died after 2019, a clinical death index from the EHR was used, which captured 86% of occurred deaths when evaluated for patients before 31 December 2019.
The all-grade event definition was obtained by algorithmic abstraction using EHR diagnosis codes. A list of predefined relevant diagnosis codes was used to filter all available codes for potential AEs after the start of treatment and up to 60 d after receiving the last ICI dose. Diagnosis codes present in the EHR of the respective patient before the start of treatment were excluded. Evident false positives were excluded by inspection of the diagnosis code and manual review of the patient chart at the event date to exclude events that did not occur or were clearly linked to non-ICI causes. The search terms used and manual exclusion list of search terms are shown in Supplementary Table 1.
Previous autoimmune disease and PRS
We investigated the relationships between the identified risk variants and previous autoimmune disease and autoimmune disease risk. We defined patients with previous autoimmune disease based on the occurrence of an autoimmune-related ICD 10th revision codes before the start of ICI treatment. Each irAE lead SNP was then tested for association with previous autoimmune disease, while adjusting for age, sex, treatment year, panel version of the sequencing panel, treatment type, line of treatment and cancer type. As an alternative measure of autoimmune disease risk, we also inferred a PRS for any autoimmune disease from a recent UK Biobank GWAS study (see Data availability section). We confirmed that the PRS was significantly associated with the previous ICD-based autoimmune disease definition in the cohort on ICIs (P = 8.8 × 10⁻⁴). Each irAE lead SNP was again tested for association with the PRS, adjusting for cancer type, age, sex, panel version and the first two principal components to control for ancestry.
Termination of treatment and steroid administration
For a subset of 44 patients, who were selected based on the highest dosage of the lead IL7 SNP, information on continuation of treatment after irAE and steroid administration was manually annotated through manual chart review.
Survival analysis
GWAS discovery.
In the DFCI discovery and MGH cohorts, discovery of GWAS variants associated with the risk of irAEs was performed using a multivariate, multistate survival framework modeling with irAE as the primary outcome and death as a competing risk. Direct modeling of competing risks is important for incidence computation to account for potential survivor bias51, where individuals who live longer may develop more irAEs by chance. Due to computational constraints, the mixed-effects survival GWAS methodology did not allow for stratified covariates and flexible truncation. Thus, we reestimated the top associations (P < 5 × 10⁻⁶) by fixed-effect meta-analysis over the cancer types with stratification of any covariates that exhibited a proportional-hazards violation. Lastly, to account for error in the imputation, we rescaled the HR based on the imputed/genotyped relationship, although we note this is a linear rescaling that does not impact the significance of the association.
Additionally, to account for immortal time bias, 422 patients who were sequenced after the start of ICI treatment were left truncated until sequencing. Left truncation and excluding patients with allograft surgery or immunosuppressants at the start of treatment did not influence any of the genome-wide significant associations (Supplementary Fig. 11).
In the replication cohort (CT cohort), cause-specific HRs and P values were estimated by conventional survival analysis with censoring on death or loss to follow-up. This cause-specific hazard computation (our primary measure of effect size) is equivalent to that estimated from the multistate model, which effectively censors on death and loss to follow-up but gains a bit of statistical power modeling with similar HRs for death and irAE outcome when estimating the technical covariates.
Multistate modeling of competing risks.
We employed a time-to-event analysis with irAEs as the event of interest. However, since death precludes from experiencing an irAE, death events were addressed through an illness–death model, a special case of the class of multistate survival models. In this model, patients in the ‘treatment’ state can either experience a transition to ‘irAE’ or ‘death’ without having experienced an irAE. Furthermore, patients who have experienced an irAE can also transition to the death state. For any transition in the multistate survival model, censoring due to loss to follow-up and left truncation due to delayed sequencing were employed.
In the setting of multistate survival models, there are two possible HRs one might be interested in: the cause-specific hazard and the subdistribution hazard. While the subdistribution hazard quantifies the risk for the incidence of the event in the population, the cause-specific hazard quantifies the inherent risk of a patient experiencing an event conditioned on that patient being event-free. Therefore, the cause-specific HR corresponds to the infinitesimal generator of transitions in a Markov jump process with added censoring. Since we are interested in the biological mechanism of experiencing an irAE, the primary quantity of interest is the cause-specific HR (see further discussion in Austin & Fine52). The subdistribution hazard, which takes into account the risk of the competing death event given from the same covariate, is of secondary interest primarily from an epidemiological perspective.
To address the challenge of estimating the cumulative population-level incidence/probability of an irAE in the multistate setting, we employed the Aalen–Johansen estimator41. We treated irAEs as a transient state to obtain the probability over time to have experienced an irAE but be alive and irAEs as an absorbing state to obtain the cumulative incidence of irAEs over time.
Computational constraints.
When running a time-to-event GWAS, we sought to use methods that satisfied multiple requirements: (1) a mixed-model survival model to adjust for latent relatedness structure in the genetic data; (2) left truncation at sequencing time to alleviate immortal time bias; (3) proper adjustment for meaningful covariates, in the sense that we did not just want the best fit but to adjust such that the HR of the tested SNP is unbiased. This necessitates stratifying over covariates that do not satisfy the proportional-hazards assumption. Tools that can do all three things in finite time are, to the best of our knowledge, not available. Therefore, we ran a GWAS with coxmeg v.1.0.11, a fast tool that does not incorporate left truncation and adjustments for proportional-hazards violations, and then reran the top associations using the full multistate approach (manually implemented in R using the mstate v.0.2.11 package), in total needing 2–3 d on a cluster.
Power analysis
We conducted a power analysis using the sample size calculator of the San Francisco Clinical and Statistical Science Institute. Using the HRs in the DFCI discovery cohort, we quantified how many events would be needed to discover the association at 80% power (Supplementary Table 17). Using the number of events we observed for all-grade and high-grade irAEs, we quantified the relationship between the underlying HR and statistical power to discover an association at genome-wide significance (P < 5 × 10⁻⁸) (Supplementary Fig. 3).
Covariate adjustment
In the DFCI discovery cohort, covariates were included for: two within-Europe ancestry components (after restricting to individuals with European ancestry; see above); age at the start of treatment; self-identified sex; line of treatment as determined from the EHR medication records; start year of treatment; type of treatment (PD-1/PD-L1 or CTLA4 monotherapy or combination); concurrent alternate treatment (chemotherapy, targeted therapy); and two technical covariates adjusting for the version of the targeted panel and an indicator for sequencing after the start of treatment. Patients were grouped into cancer types with >30 individuals and the analyses were stratified or meta-analyzed over cancer types (as indicated). In the MGH cohort, covariates were included for cancer type, type of ICI, age at the start of treatment, sex and genetic ancestry. Cancer type was included as a covariate rather than a stratifying variable due to the relatively small sample size of each type and the assumption that common covariate effects could be better learned across all samples. In the CT cohort, covariates were included for five genetic ancestry components and stratified on treatment arms (which also capture cancer types).
Reporting summary
Further information on research design is available in the Nature Portfolio Reporting Summary linked to this article.
Extended Data
Extended Data Fig. 1 |. Probability of irAE by treatment class.
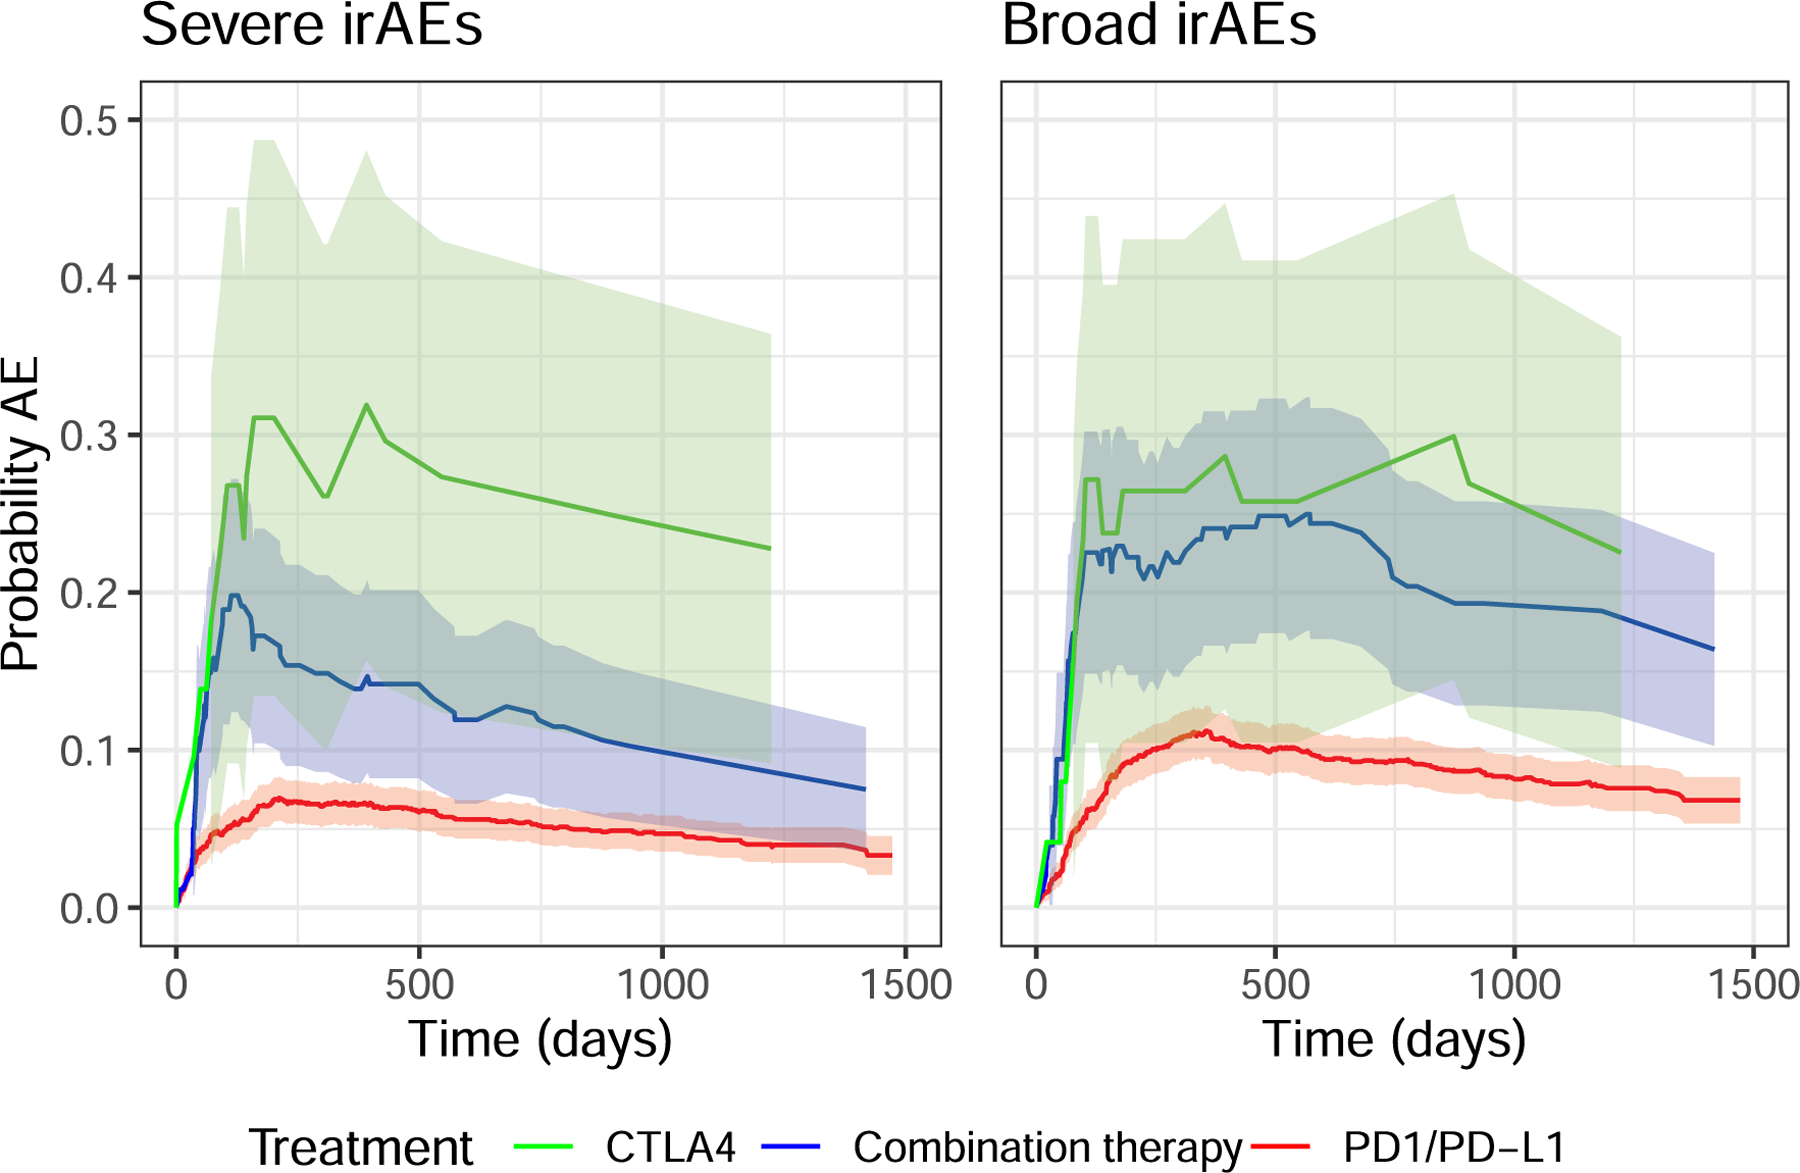
Probability of patients experiencing high-grade irAEs (a) or all-grade irAEs (b) stratified by therapy class. The difference between CTLA4 and combination therapy was not statistically significant in a log-rank test of the equivalent Kaplan-Meier estimator (p = 0.39 all-grade, p = 0.68 high-grade). The shaded areas correspond to 95% confidence intervals.
Extended Data Fig. 2 |. Discovery associations of locus near IL22RA1 and 4p15.
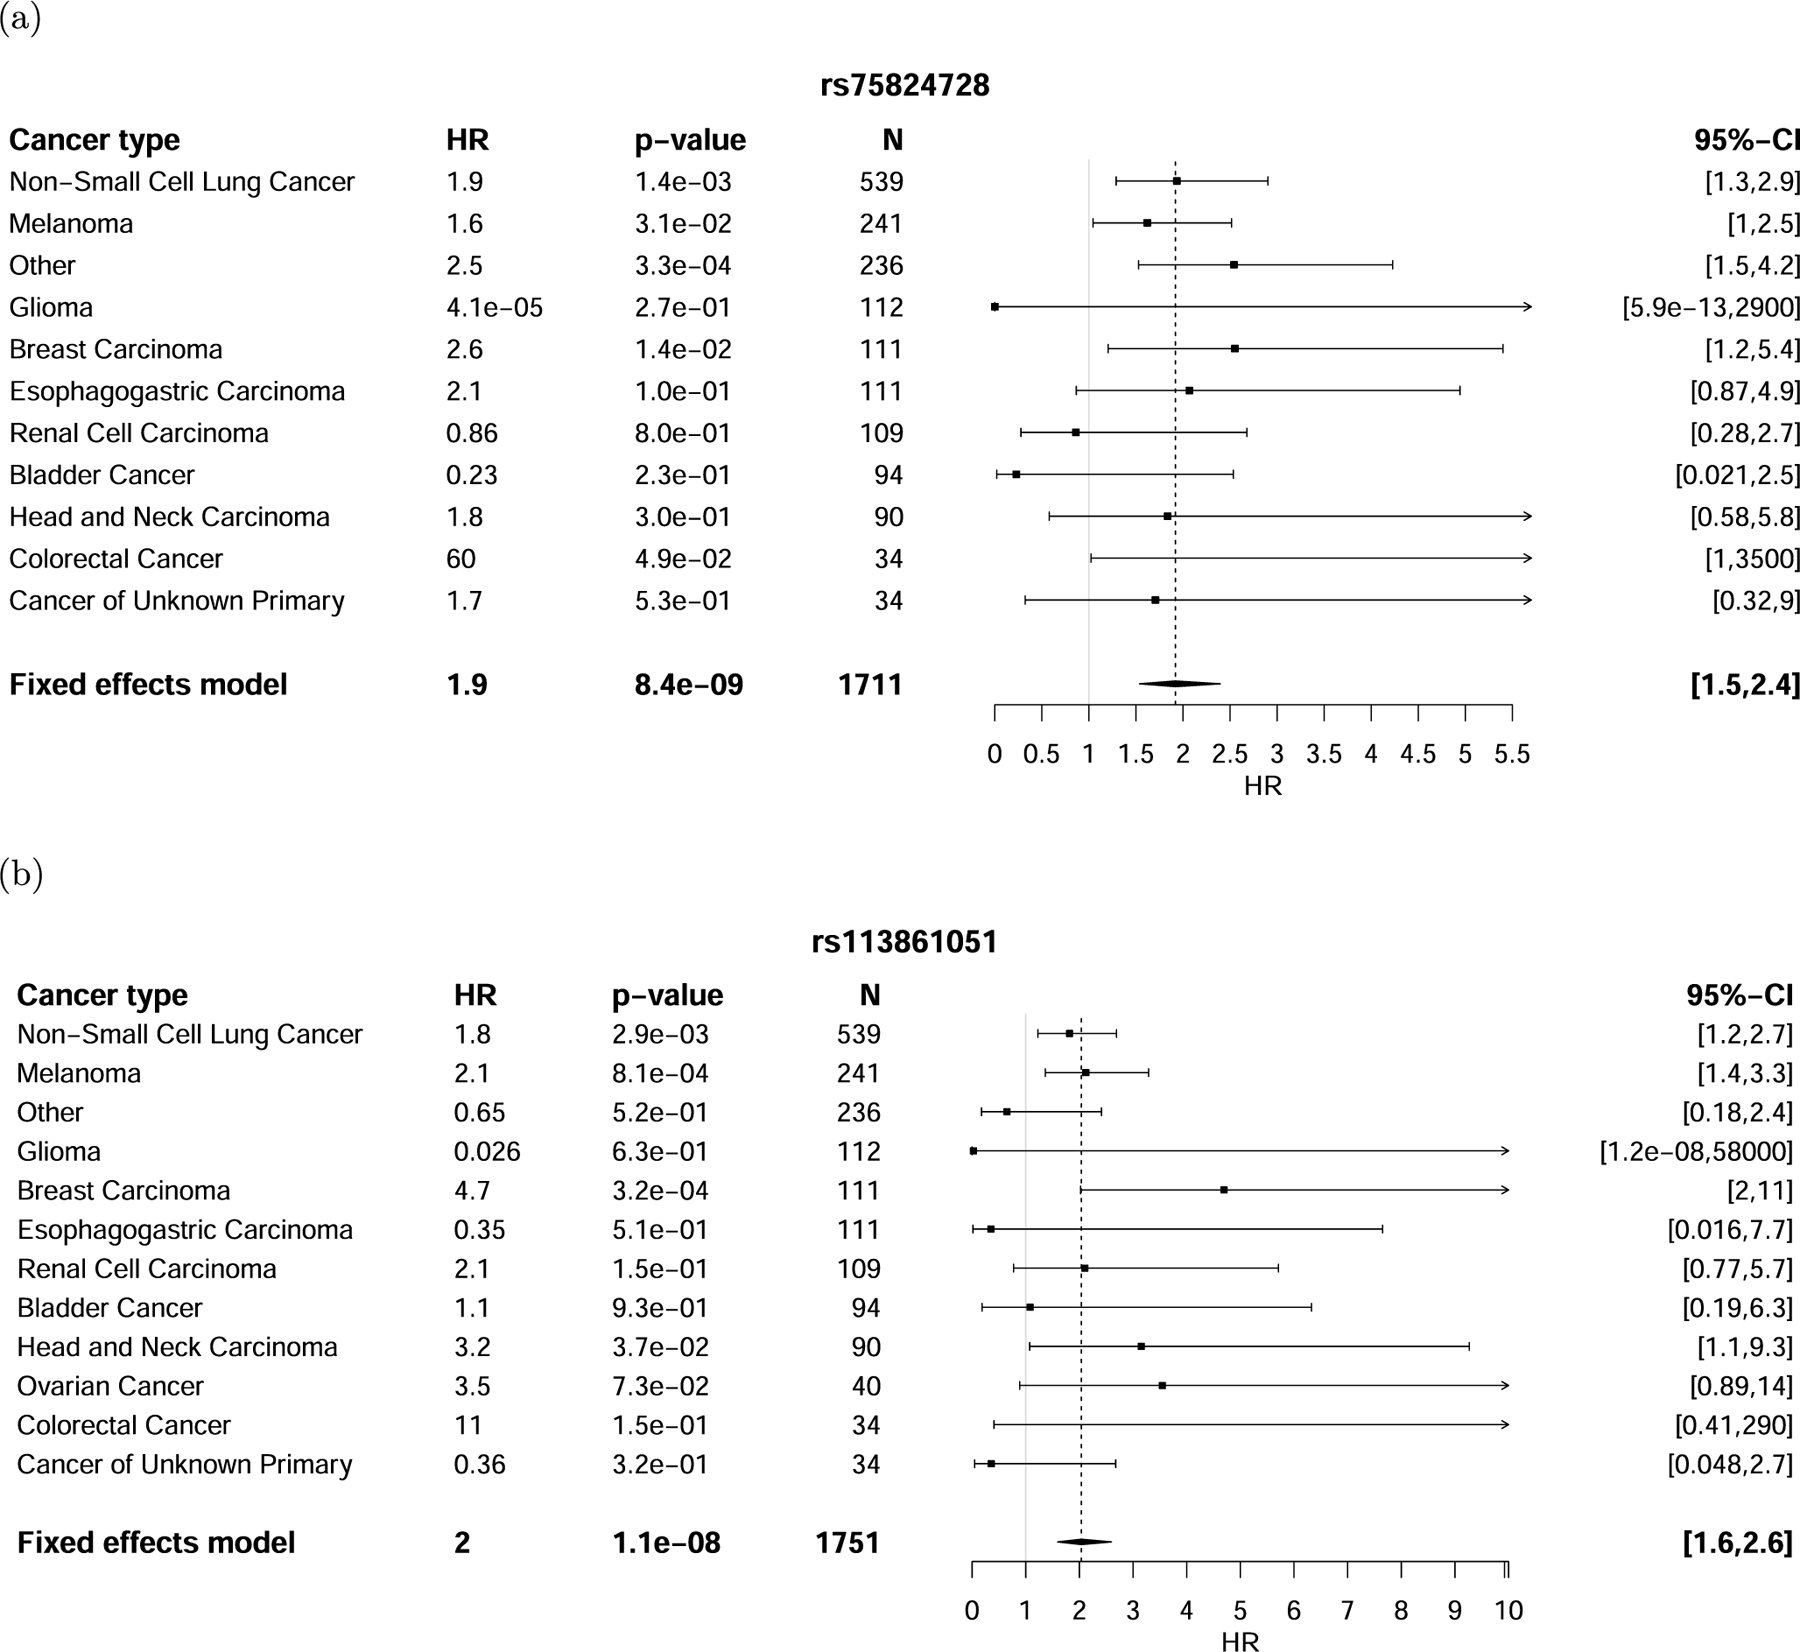
Discovery associations with rs75824728 (a) and rs113861051 (b) stratified by cancer type. The error bars correspond to the 95% confidence interval around the mean effect size. Significance was obtained from a two-sided Wald test.
Extended Data Fig. 3 |. Agreement between discovery cohort and MGH cohort at IL7 locus.
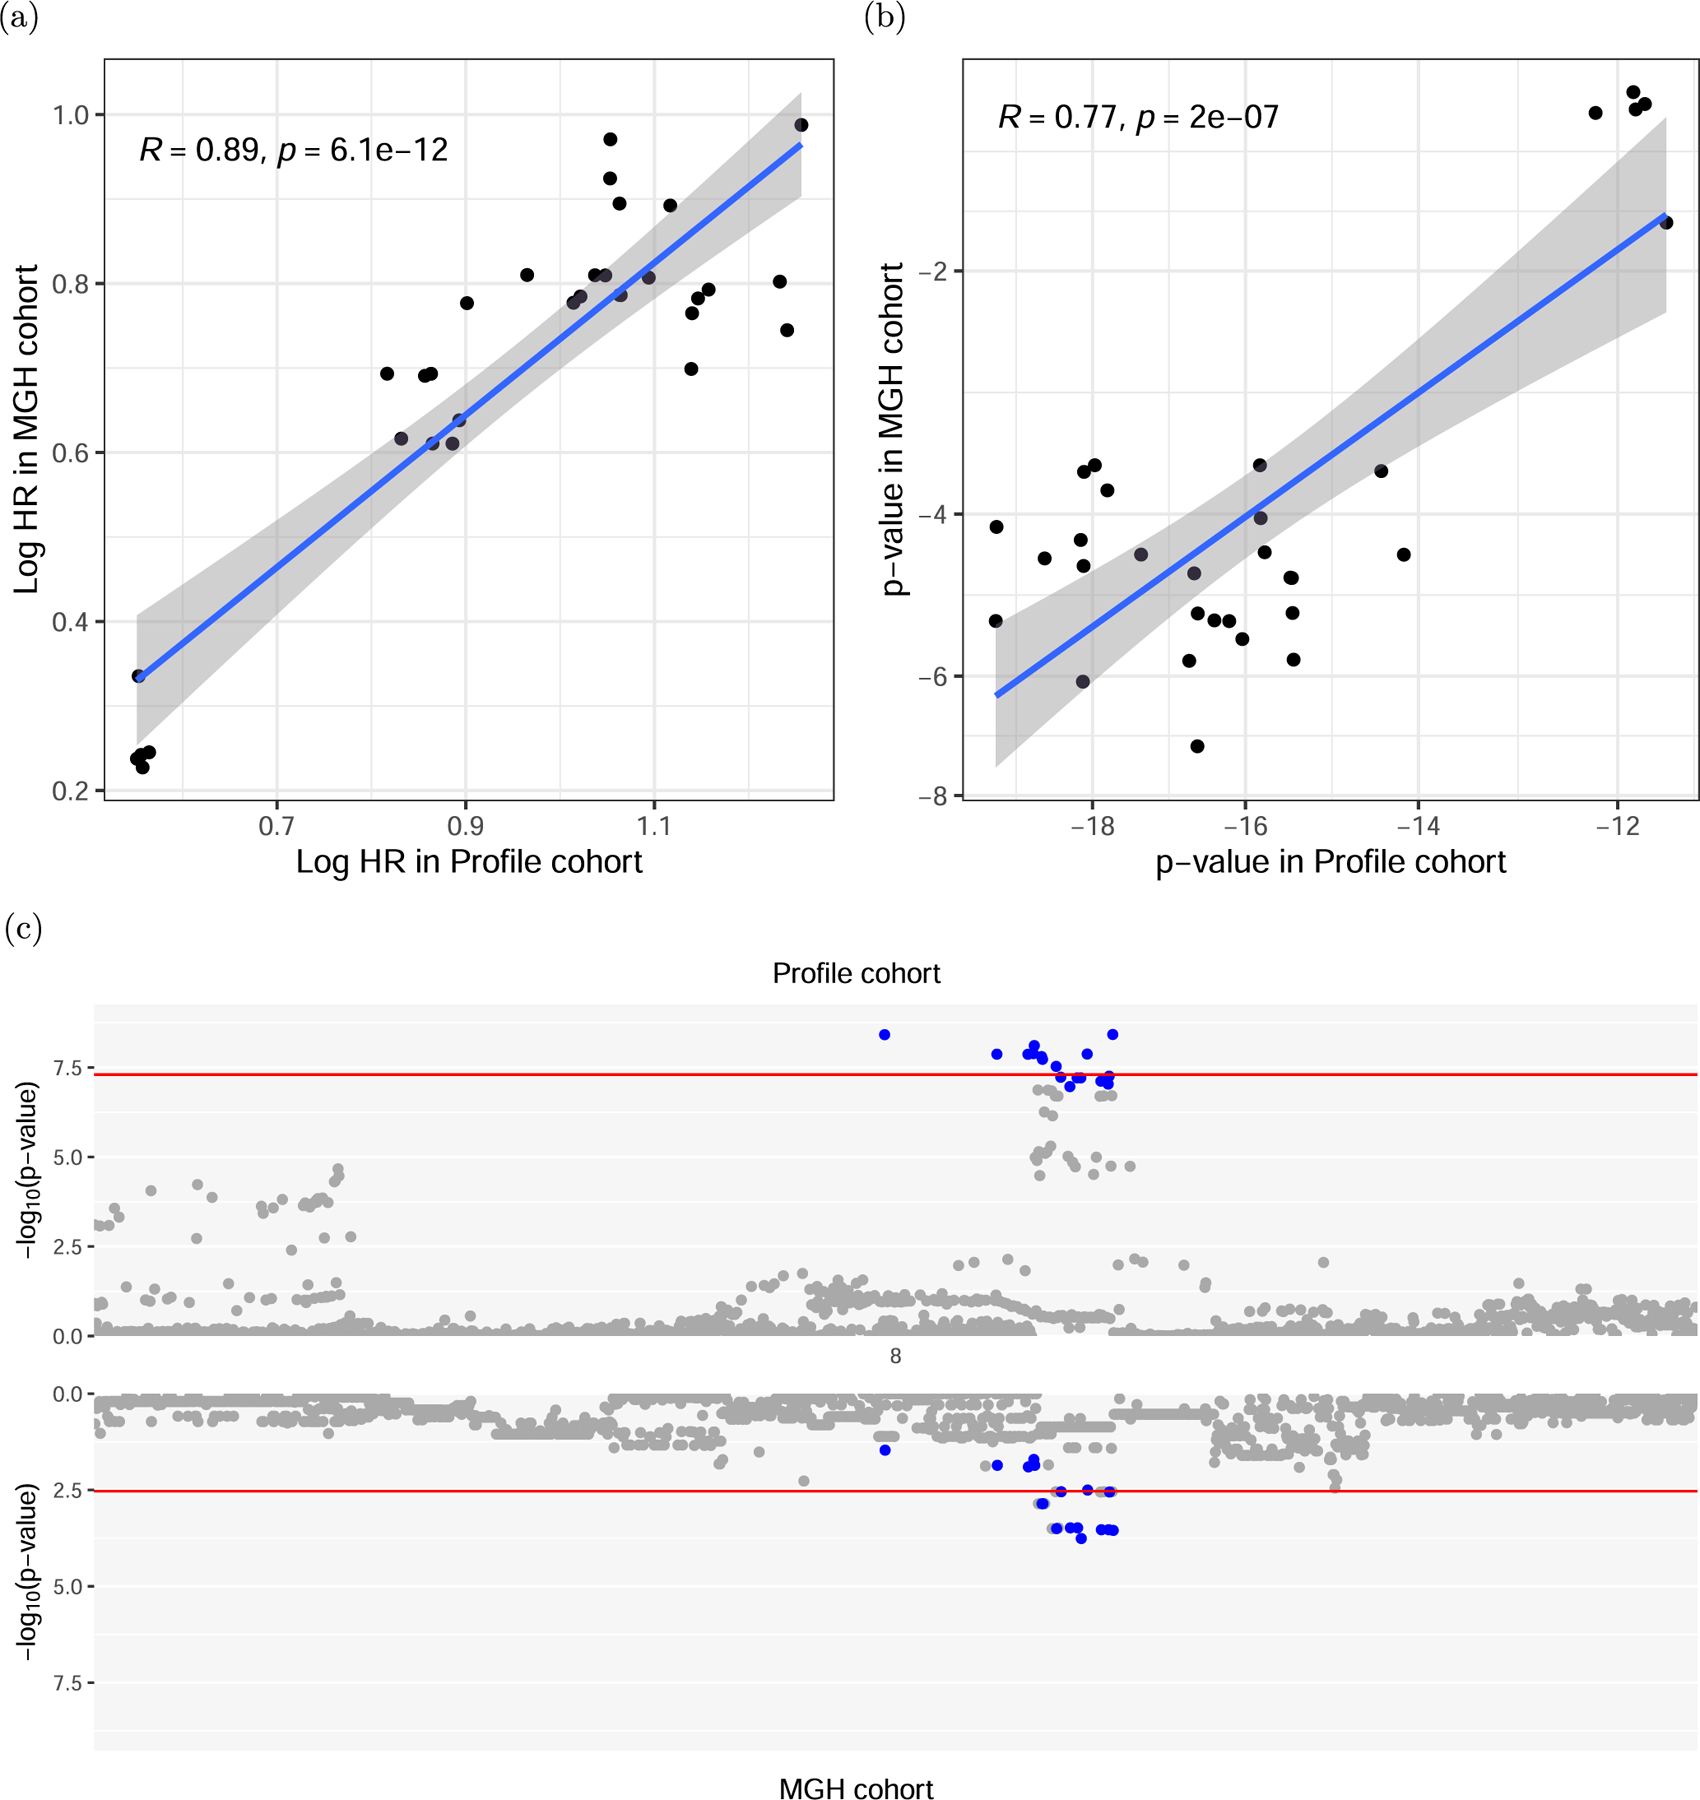
(a) Logarithmic hazard rates (effect sizes) and (b) p-values for association in the discovery DFCI cohort and the MGH cohort for the 8q21 locus, restricted to suggestive significant associations in the discovery cohort (p < 1.0 × 10⁻⁵). The shaded area of the linear fit corresponds to the 95% confidence interval. Significance was tested using a two-sided t-test on the Pearson correlations. (c) Comparison of the association strengths of variants around the top association locus in DFCI and MGH. The 95% credible set in the DFCI cohort is colored in blue. The upper red line signifies genome wide significance, the lower red line bonferroni corrected significance for SNPs tested in the MGH cohort.
Extended Data Fig. 4 |. De novo isoform reconstruction using Cufflinks.
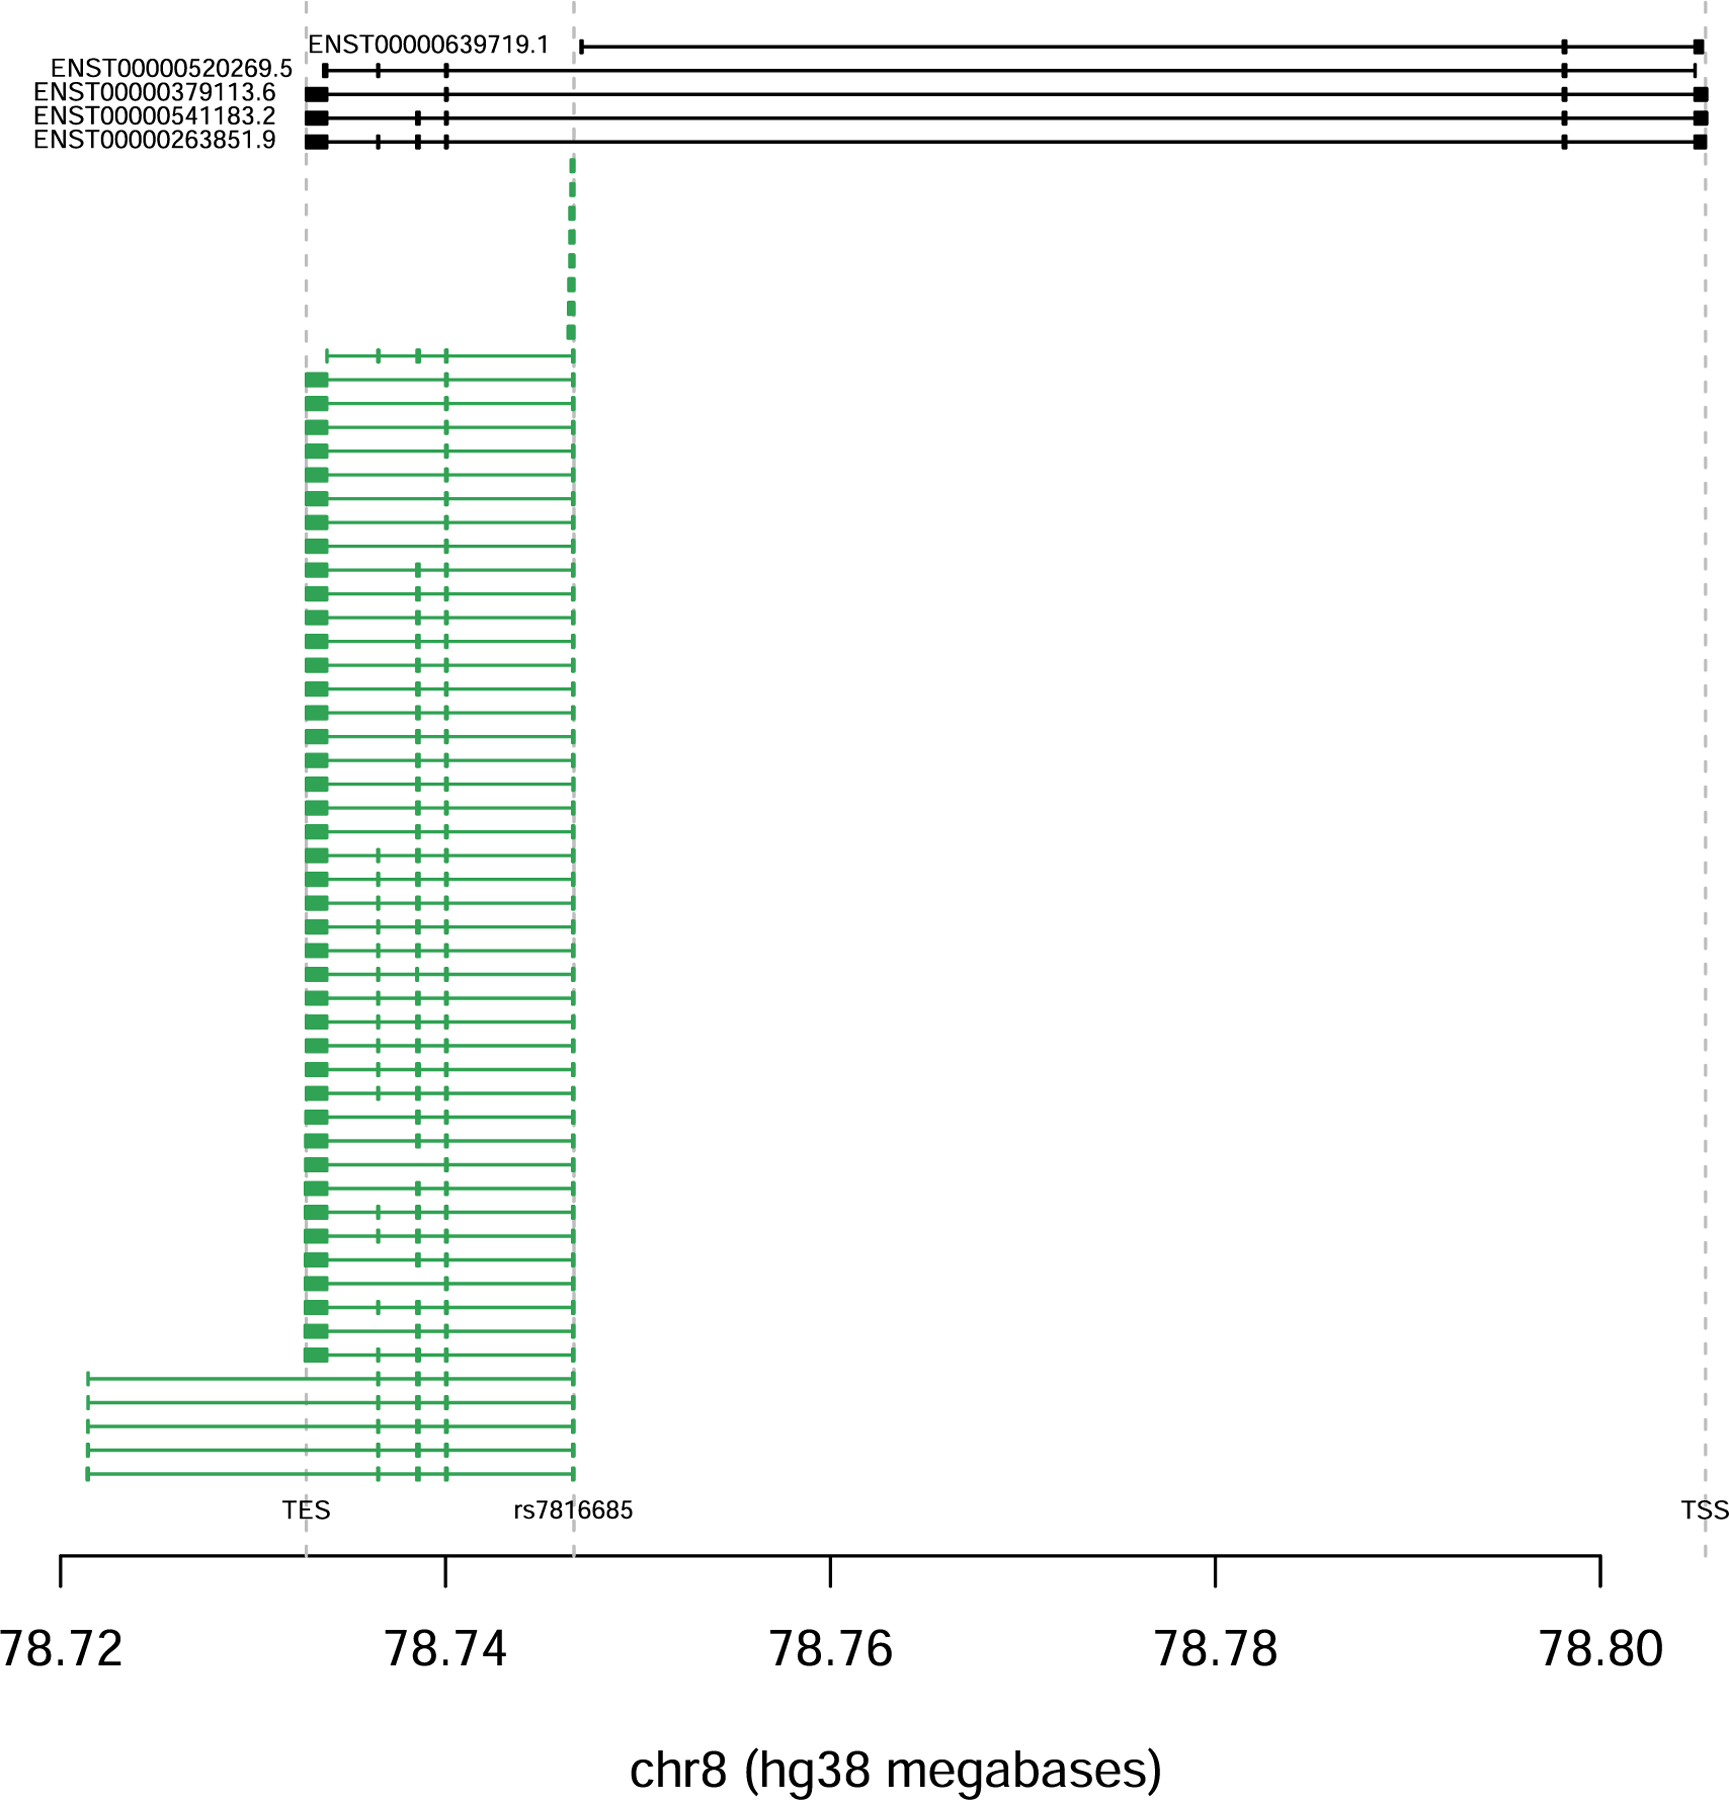
De novo isoform reconstruction using Cufflinks. There is a novel transcript spanning chr8:78732772–78746671, which initiates at rs7816685 and is highly specific to carriers.
Extended Data Fig. 5 |. Response and overall survival in TCGA Melanoma for carriers and non-carriers of rs16906115.
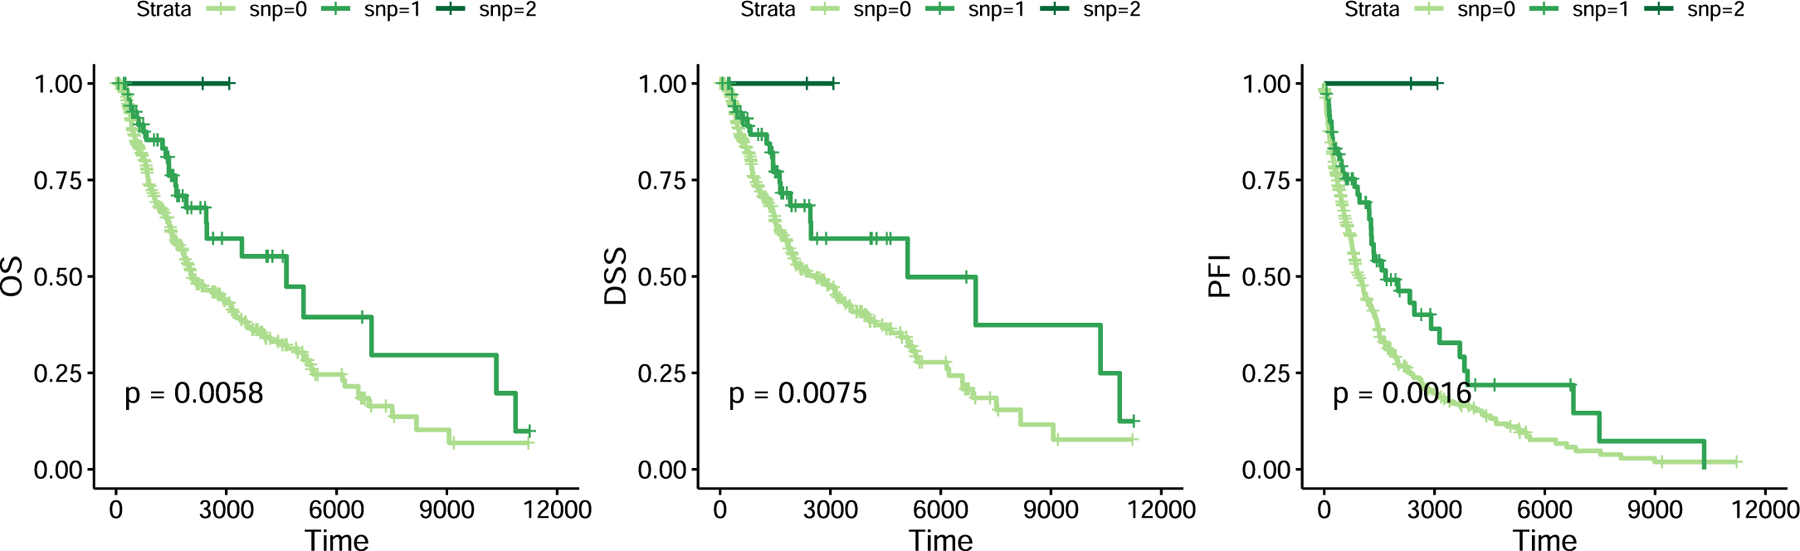
Response and overall survival in TCGA Melanoma for carriers and non-carriers of rs16906115. Significance was obtained using a log-rank test.
Extended Data Fig. 6 |. Hypothesized mechanistic schematic.
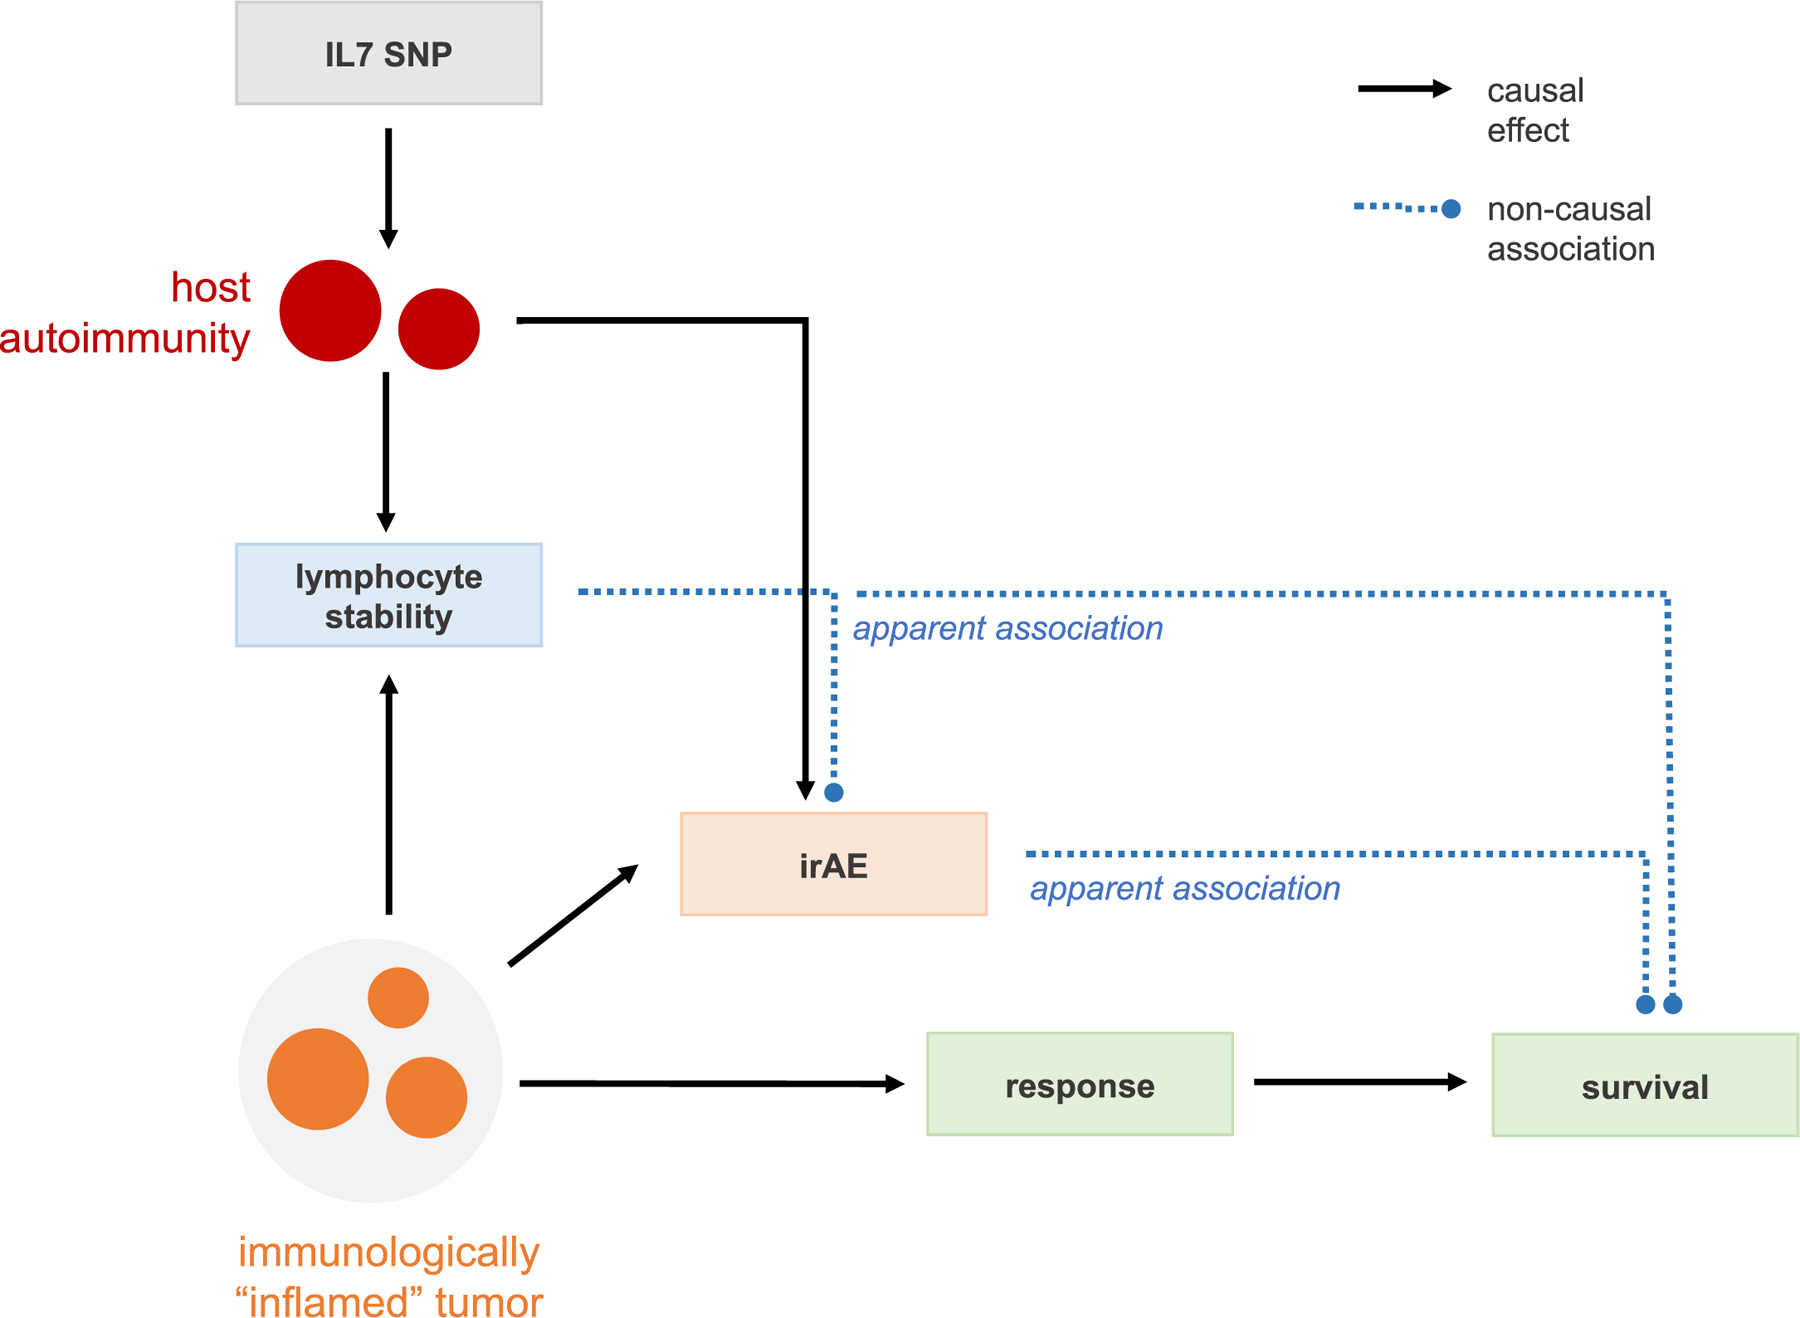
Hypothesized schematic of how lymphocyte stability is a marker of an active host immunity with down-stream effects on both overall survival through better anti-tumor response, as well as higher rate of irAE due to increased auto-immunity.
Supplementary Material
Acknowledgements
We thank all the patients who consented to participate in this study and the institutional data collection efforts that made this study possible. We thank M. Hassett, N. Lindeman, D. Liu, P. Lukasse, L. MacConnaill, P. Polak, S. Rodig, N. Zaitlen and E. Ziv for helpful discussions; the DFCI Oncology Data Retrieval System for the aggregation, management and delivery of the clinical and operational research data used in this project; and the DFCI/Brigham and Women’s Hospital Data Sharing Group for the aggregation, management and delivery of the clinical and genomics data used in this project. A.G. is supported by National Institutes of Health (NIH) grant nos. R01CA227237, R01CA244569 and R21HG010748, and awards from the Claudia Adams Barr Foundation, Louis B. Mayer Foundation, Doris Duke Charitable Foundation, Emerson Collective and Phi Beta Psi Sorority. S.A.S. acknowledges support from the National Cancer Institute (no. R50RCA211482). S.G. was supported by NIH grant no. R01CA227237 and a DFCI Trustee Fellowship. T.K.C. is supported in part by the Dana-Farber/Harvard Cancer Center Kidney SPORE (no. 2P50CA101942–16) and Program no. 5P30CA006516–56, the Kohlberg Chair at Harvard Medical School and the Trust Family, Michael Brigham, Pan-Mass Challenge and Loker Pinard Funds for Kidney Cancer Research at the DFCI. T.E.K. acknowledges grant support from the NIH (no. T32CA009172).
Footnotes
Online content
Any methods, additional references, Nature Research Portfolio summaries, source data, extended data, supplementary information, acknowledgements, peer review information; details of author contributions and competing interests; and statements of data and code availability are available at https://doi.org/10.1038/s41591-022-02094-6.
Code availability
We used the R programming language v.3.5.1 and the survival v.2.44–1.1, mstate v.0.2.11 and coxmeg for GWAS v.1.0.11 packages. SuSIE v.0.9.57 was used for fine-mapping. Analysis scripts can be found at https://github.com/stefangroha/GWAS_IL7.
Competing interests
D.A.B. reports nonfinancial support from Bristol Myers Squibb, honoraria from LM Education/Exchange Services and personal fees from MDedge, Exelixis, Octane Global, Defined Health, Dedham Group, Adept Field Solutions, Slingshot Insights, Blueprint Partnerships, Charles River Associates, Trinity Group and Insight Strategy, outside of the submitted work. K.K. reports receiving honoraria from IBM and Roche. M.M.A. reports grants and personal fees from Genentech, grants and personal fees from Bristol Myers Squibb, personal fees from Merck, grants and personal fees from AstraZeneca, grants from Lilly and personal fees from Maverick, Blueprint Medicine, Syndax, Ariad, Nektar, Gritstone, ArcherDX, Mirati, NextCure, Novartis, EMD Serono and Panvaxal/NovaRx, outside the submitted work. O.R. reports research support from Merck. He is speaker for activities supported by educational grants from Bristol Myers Squibb and Merck; consultant for Merck, Celgene, Five Prime, GSK, Bayer, Roche/Genentech, Puretech, Imvax, Sobi and Boehringer Ingelheim; and has a patent pending for ‘Methods of using pembrolizumab and trebananib’. S.A.S. reports nonfinancial support from Bristol Myers Squibb and equity in Agenus, Agios Pharmaceuticals, Breakbio Corp., Bristol Myers Squibb and Lumos Pharma. T.K.C. reports research/advisory board/consultancy/honoraria (institutional and personal, paid and unpaid) from AstraZeneca, Aveo, Bayer, Bristol Myers Squibb, Eisai, EMD Serono, Exelixis, GSK, IQVA, Ipsen, Kanaph, Lilly, Merck, Nikang, Novartis, Pfizer, Roche, Sanofi/Aventis and Takeda, Tempest; travel, accommodation, expenses and medical writing in relation to consulting, advisory roles or honoraria; stock options in Pionyr, Tempest, Osel and Recede Bio; UpToDate royalties for CME-related events (for example, OncLive, PVI, MJH Life Sciences) honoraria; National Cancer Institute Genitourinary Steering Committee, American Society of Clinical Oncology and European Society of Medical Oncology; patents filed, royalties or other intellectual property (no income as of current date) related to biomarkers of immune checkpoint blockers and circulating tumor DNA. Z.B. reports research support from the imCORE Network on behalf of Genentech and Bristol Myers Squibb and honoraria from UpToDate. A.G., T.K.C. and M.L.F. are inventors on a patent related to germline predictors of irAEs. The other authors declare no competing interests.
Additional information
Extended data is available for this paper at https://doi.org/10.1038/s41591-022-02094-6.
Supplementary information The online version contains supplementary material available at https://doi.org/10.1038/s41591-022-02094-6.
Data availability
Full summary association statistics for the discovery cohort are available at Zenodo https://zenodo.org/record/6800429. The deidentified clinical outcomes and three main associations are available in Supplementary Table 18 for all-grade and Supplementary Table 19 for high-grade irAEs. The UK Biobank association statistics for autoimmune disease were previously computed by BOLT-LMM v.2.3 and used to estimate the autoimmune disease PRS (https://data.broadin-stitute.org/alkesgroup/UKBB/UKBB_409K/). The RNA-seq data from the GTEx and TCGA was accessed through the ReCount2 interface and API (https://jhubiostatistics.shinyapps.io/recount/). Cell-sorted data across six immune cell subsets from individuals with autoimmune diseases and healthy controls were accessed from Chowell et al.11 and the GEO (SRP045500).
References
- 1.Ribas A & Wolchok JD Cancer immunotherapy using checkpoint blockade. Science 359, 1350–1355 (2018). [DOI] [PMC free article] [PubMed] [Google Scholar]
- 2.June CH, Warshauer JT & Bluestone JA Corrigendum: Is autoimmunity the Achilles’ heel of cancer immunotherapy? Nat. Med 23, 1004 (2017). [DOI] [PubMed] [Google Scholar]
- 3.Esfahani K et al. Moving towards personalized treatments of immune-related adverse events. Nat. Rev. Clin. Oncol 17, 504–515 (2020). [DOI] [PubMed] [Google Scholar]
- 4.Boutros C et al. Safety profiles of anti-CTLA-4 and anti-PD-1 antibodies alone and in combination. Nat. Rev. Clin. Oncol 13, 473–486 (2016). [DOI] [PubMed] [Google Scholar]
- 5.Koon H & Atkins M Autoimmunity and immunotherapy for cancer. N. Engl. J. Med 354, 758–760 (2006). [DOI] [PubMed] [Google Scholar]
- 6.Postow MA, Sidlow R & Hellmann MD Immune-related adverse events associated with immune checkpoint blockade. N. Engl. J. Med 378, 158–168 (2018). [DOI] [PubMed] [Google Scholar]
- 7.Wang DY et al. Fatal toxic effects associated with immune checkpoint inhibitors: a systematic review and meta-analysis. JAMA Oncol 4, 1721–1728 (2018). [DOI] [PMC free article] [PubMed] [Google Scholar]
- 8.Eggermont AMM et al. Association between immune-related adverse events and recurrence-free survival among patients with stage III melanoma randomized to receive pembrolizumab or placebo: a secondary analysis of a randomized clinical trial. JAMA Oncol 6, 519–527 (2020). [DOI] [PMC free article] [PubMed] [Google Scholar]
- 9.Khan Z et al. Genetic variation associated with thyroid autoimmunity shapes the systemic immune response to PD-1 checkpoint blockade. Nat. Commun 12, 3355 (2021). [DOI] [PMC free article] [PubMed] [Google Scholar]
- 10.Khan Z et al. Polygenic risk for skin autoimmunity impacts immune checkpoint blockade in bladder cancer. Proc. Natl Acad. Sci. USA 117, 12288–12294 (2020). [DOI] [PMC free article] [PubMed] [Google Scholar]
- 11.Chowell D et al. Patient HLA class I genotype influences cancer response to checkpoint blockade immunotherapy. Science 359, 582–587 (2018). [DOI] [PMC free article] [PubMed] [Google Scholar]
- 12.Chowell D et al. Evolutionary divergence of HLA class I genotype impacts efficacy of cancer immunotherapy. Nat. Med 25, 1715–1720 (2019). [DOI] [PMC free article] [PubMed] [Google Scholar]
- 13.Cubas R et al. Autoimmunity linked protein phosphatase PTPN22 as a target for cancer immunotherapy. J. Immunother. Cancer 8, e001439 (2020). [DOI] [PMC free article] [PubMed] [Google Scholar]
- 14.Thorsson V et al. The immune landscape of cancer. Immunity 48, 812–830.e14 (2018). [DOI] [PMC free article] [PubMed] [Google Scholar]
- 15.Martins F et al. Adverse effects of immune-checkpoint inhibitors: epidemiology, management and surveillance. Nat. Rev. Clin. Oncol 16, 563–580 (2019). [DOI] [PubMed] [Google Scholar]
- 16.Barrett JH Genome-wide association studies of therapeutic response: addressing the complexities. Pharmacogenomics 20, 213–216 (2019). [DOI] [PubMed] [Google Scholar]
- 17.Loh P-R, Kichaev G, Gazal S, Schoech AP & Price AL Mixed-model association for biobank-scale datasets. Nat. Genet 50, 906–908 (2018). [DOI] [PMC free article] [PubMed] [Google Scholar]
- 18.Taylor C et al. Genetic variation at IL7 provides mechanistic insights into toxicity to immune checkpoint blockade. Preprint at Research Square 10.21203/rs.3.rs-1531341/v1 (2022). [DOI]
- 19.Aguet F et al. The GTEx Consortium atlas of genetic regulatory effects across human tissues. Science 369, 1318–1330 (2020). [DOI] [PMC free article] [PubMed] [Google Scholar]
- 20.Jaganathan K et al. Predicting splicing from primary sequence with deep learning. Cell 176, 535–548.e24 (2019). [DOI] [PubMed] [Google Scholar]
- 21.Zeng T & Li YI Predicting RNA splicing from DNA sequence using Pangolin. Genome Biol 23, 103 (2022). [DOI] [PMC free article] [PubMed] [Google Scholar]
- 22.Li T et al. TIMER2.0 for analysis of tumor-infiltrating immune cells. Nucleic Acids Res 48, W509–W514 (2020). [DOI] [PMC free article] [PubMed] [Google Scholar]
- 23.Rosenberg SA et al. IL-7 administration to humans leads to expansion of CD8+ and CD4+ cells but a relative decrease of CD4+ T-regulatory cells. J. Immunother 29, 313–319 (2006). [DOI] [PMC free article] [PubMed] [Google Scholar]
- 24.Barata JT, Durum SK & Seddon B Flip the coin: IL-7 and IL-7R in health and disease. Nat. Immunol 20, 1584–1593 (2019). [DOI] [PubMed] [Google Scholar]
- 25.Penaranda C et al. IL-7 receptor blockade reverses autoimmune diabetes by promoting inhibition of effector/memory T cells. Proc. Natl Acad. Sci. USA 109, 12668–12673 (2012). [DOI] [PMC free article] [PubMed] [Google Scholar]
- 26.Totsuka T et al. IL-7 is essential for the development and the persistence of chronic colitis. J. Immunol 178, 4737–4748 (2007). [DOI] [PubMed] [Google Scholar]
- 27.Dooms H Interleukin-7: fuel for the autoimmune attack. J. Autoimmun 45, 40–48 (2013). [DOI] [PubMed] [Google Scholar]
- 28.Belarif L et al. IL-7 receptor blockade blunts antigen-specific memory T cell responses and chronic inflammation in primates. Nat. Commun 9, 4483 (2018). [DOI] [PMC free article] [PubMed] [Google Scholar]
- 29.Johnson DB, Nebhan CA, Moslehi JJ & Balko JM Immune-checkpoint inhibitors: long-term implications of toxicity. Nat. Rev. Clin. Oncol 19, 254–267 (2022). [DOI] [PMC free article] [PubMed] [Google Scholar]
- 30.Booth CM, Karim S & Mackillop WJ Real-world data: towards achieving the achievable in cancer care. Nat. Rev. Clin. Oncol 16, 312–325 (2019). [DOI] [PubMed] [Google Scholar]
- 31.Price AL, Zaitlen NA, Reich D & Patterson N New approaches to population stratification in genome-wide association studies. Nat. Rev. Genet 11, 459–463 (2010). [DOI] [PMC free article] [PubMed] [Google Scholar]
- 32.André F et al. AACR Project GENIE: powering precision medicine through an international consortium. Cancer Discov 7, 818–831 (2017). [DOI] [PMC free article] [PubMed] [Google Scholar]
- 33.van Rheenen W, Peyrot WJ, Schork AJ, Lee SH & Wray NR Genetic correlations of polygenic disease traits: from theory to practice. Nat. Rev. Genet 20, 567–581 (2019). [DOI] [PubMed] [Google Scholar]
- 34.Torkamani A, Wineinger NE & Topol EJ The personal and clinical utility of polygenic risk scores. Nat. Rev. Genet 19, 581–590 (2018). [DOI] [PubMed] [Google Scholar]
- 35.Emdin CA, Khera AV & Kathiresan S Mendelian randomization. JAMA 318, 1925–1926 (2017). [DOI] [PubMed] [Google Scholar]
- 36.Garcia EP et al. Validation of OncoPanel: a targeted next-generation sequencing assay for the detection of somatic variants in cancer. Arch. Pathol. Lab. Med 141, 751–758 (2017). [DOI] [PubMed] [Google Scholar]
- 37.Gusev A, Groha S, Taraszka K, Semenov YR & Zaitlen N Constructing germline research cohorts from the discarded reads of clinical tumor sequences. Genome Med 13, 179 (2021). [DOI] [PMC free article] [PubMed] [Google Scholar]
- 38.Liu J et al. An integrated TCGA Pan-Cancer clinical data resource to drive high-quality survival outcome analytics. Cell 173, 400–416.e11 (2018). [DOI] [PMC free article] [PubMed] [Google Scholar]
- 39.Fast algorithms for conducting large-scale GWAS of age-at-onset traits using Cox mixed-effects models. Genetics 215, 1191 (2020). [DOI] [PMC free article] [PubMed] [Google Scholar]
- 40.Wang G, Sarkar A, Carbonetto P & Stephens M A simple new approach to variable selection in regression, with application to genetic fine mapping. J. R. Stat. Soc. Series B Stat. Methodol 82, 1273–1300 (2020). [DOI] [PMC free article] [PubMed] [Google Scholar]
- 41.Aalen OO & Johansen S An empirical transition matrix for non-homogeneous Markov chains based on censored observations. Scand. Stat. Theory Appl 5, 141–150 (1978). [Google Scholar]
- 42.Garrido-Martín D, Palumbo E, Guigó R & Breschi A ggsashimi: sashimi plot revised for browser- and annotation-independent splicing visualization. PLoS Comput. Biol 14, e1006360 (2018). [DOI] [PMC free article] [PubMed] [Google Scholar]
- 43.Trapnell C et al. Differential gene and transcript expression analysis of RNA-seq experiments with TopHat and Cufflinks. Nat. Protoc 7, 562–578 (2012). [DOI] [PMC free article] [PubMed] [Google Scholar]
- 44.Linsley PS, Speake C, Whalen E & Chaussabel D Copy number loss of the interferon gene cluster in melanomas is linked to reduced T cell infiltrate and poor patient prognosis. PLoS ONE 9, e109760 (2014). [DOI] [PMC free article] [PubMed] [Google Scholar]
- 45.Hoadley KA et al. Multiplatform analysis of 12 cancer types reveals molecular classification within and across tissues of origin. Cell 158, 929–944 (2014). [DOI] [PMC free article] [PubMed] [Google Scholar]
- 46.Collado-Torres L et al. Reproducible RNA-seq analysis using recount2. Nat. Biotechnol 35, 319–321 (2017). [DOI] [PMC free article] [PubMed] [Google Scholar]
- 47.Orechia J et al. OncDRS: an integrative clinical and genomic data platform for enabling translational research and precision medicine. Appl. Transl. Genom 6, 18–25 (2015). [DOI] [PMC free article] [PubMed] [Google Scholar]
- 48.Nalichowski R, Keogh D, Chueh HC & Murphy SN Calculating the benefits of a Research Patient Data Repository. AMIA Annu. Symp. Proc 2006, 1044 (2006). [PMC free article] [PubMed] [Google Scholar]
- 49.Davies RW, Flint J, Myers S & Mott R Rapid genotype imputation from sequence without reference panels. Nat. Genet 48, 965–969 (2016). [DOI] [PMC free article] [PubMed] [Google Scholar]
- 50.Chen C-Y et al. Improved ancestry inference using weights from external reference panels. Bioinformatics 29, 1399–1406 (2013). [DOI] [PMC free article] [PubMed] [Google Scholar]
- 51.Anderson JR, Cain KC & Gelber RD Analysis of survival by tumor response and other comparisons of time-to-event by outcome variables. J. Clin. Oncol 26, 3913–3915 (2008). [DOI] [PubMed] [Google Scholar]
- 52.Austin PC & Fine JP Practical recommendations for reporting Fine-Gray model analyses for competing risk data. Stat. Med 36, 4391–4400 (2017). [DOI] [PMC free article] [PubMed] [Google Scholar]
Associated Data
This section collects any data citations, data availability statements, or supplementary materials included in this article.
Supplementary Materials
Data Availability Statement
Full summary association statistics for the discovery cohort are available at Zenodo https://zenodo.org/record/6800429. The deidentified clinical outcomes and three main associations are available in Supplementary Table 18 for all-grade and Supplementary Table 19 for high-grade irAEs. The UK Biobank association statistics for autoimmune disease were previously computed by BOLT-LMM v.2.3 and used to estimate the autoimmune disease PRS (https://data.broadin-stitute.org/alkesgroup/UKBB/UKBB_409K/). The RNA-seq data from the GTEx and TCGA was accessed through the ReCount2 interface and API (https://jhubiostatistics.shinyapps.io/recount/). Cell-sorted data across six immune cell subsets from individuals with autoimmune diseases and healthy controls were accessed from Chowell et al.11 and the GEO (SRP045500).