

SUMMARY
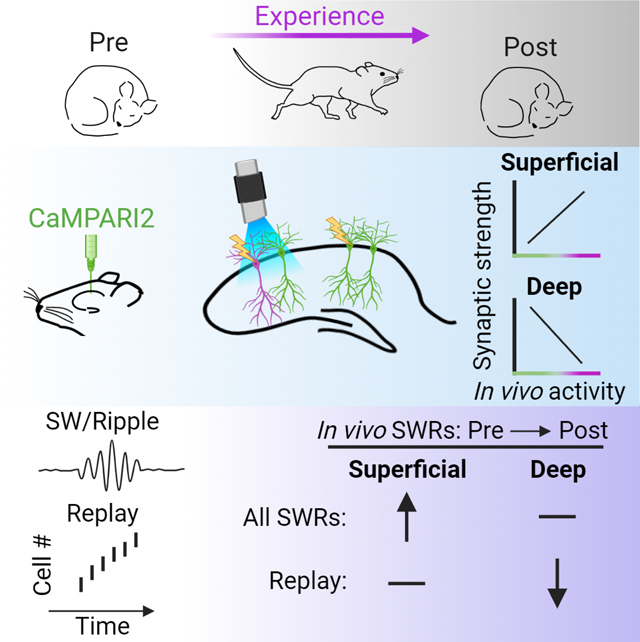
Neuronal activity during experience is thought to induce plastic changes within the hippocampal network which underlie memory formation, although the extent and details of such changes in vivo remain unclear. Here, we employed a temporally precise marker of neuronal activity, CaMPARI2, to label active CA1 hippocampal neurons in vivo, followed by immediate acute slice preparation and electrophysiological quantification of synaptic properties. Recently active neurons in the superficial sublayer of stratum pyramidale displayed larger post-synaptic responses at excitatory synapses from area CA3, with no change in pre-synaptic release probability. In contrast, in vivo activity correlated with weaker pre- and post-synaptic excitatory weights onto pyramidal cells in the deep sublayer. In vivo activity of deep and superficial neurons within sharp-wave/ripples was bidirectionally changed across experience, consistent with the observed changes in synaptic weights. These findings reveal novel, fundamental mechanisms through which the hippocampal network is modified by experience to store information.
Keywords: Place cells, hippocampus, CaMPARI, activity labeling, synaptic plasticity, sharp-wave/ripples
eTOC Blurb
Berndt, Trusel et al. report that activity during experience strengthens synaptic weights onto superficial hippocampal CA1 neurons but weakens inputs onto deep CA1 neurons. These changes in synaptic strength are reflected in experience-driven changes in firing during ripples, revealing putative mechanisms of cell recruitment in ripple-based replay.
Graphical Abstract
INTRODUCTION
Considerable evidence indicates that storage of information in the brain requires synaptic plasticity1–4, but the precise synaptic changes induced by experience are not well understood. Previous strategies to quantify experience-driven changes in in vivo synaptic function have been limited in their ability to quantify cell-type or input specific synaptic changes5–8 or require hours-long timescales to label active populations in vivo9,10. CaMPARI2 (calcium-modulated photo-activatable ratiometric integrator, 2nd generation)11,12 is an engineered green fluorescent protein with native excitation/emission of 502/516 nm. When bound to calcium, near-UV light stimulation produces a covalent break, permanently converting CaMPARI2 to 562/577 nm excitation/emission11,12. CaMPARI2 photoconversion is therefore dependent upon intracellular calcium levels11 and linearly correlated to neural activity12, making it a powerful experimental method to identify active vs. inactive neurons on a sub-second timescale to query the synaptic consequences of in vivo activity patterns.
Experience-dependent plasticity across the hippocampal formation is critical for the formation of episodic and spatial memories13–15. During navigation, excitatory neurons in the hippocampus, termed “place cells,” are selectively active in restricted spatial regions, forming a spatially and temporally organized representation of experience across the hippocampal network16,17. Establishment and maintenance of this cognitive map is heavily dependent upon synaptic plasticity at individual hippocampal neurons5–10,18–20, but it is unclear how such changes might impact subsequent memory retrieval. In a well-established example of network-level memory expression, patterns of hippocampal population activity that occur during behavior can be reactivated during off-line periods such as quiet rest or slow-wave sleep21–23. Off-line reactivation, often referred to as “replay,” is temporally compressed and occurs within local field potential (LFP) events termed sharp-wave/ripples (SWRs)24,25. While pre-existing network connectivity patterns may influence the content of hippocampal SWRs26–29, high-fidelity expression of post-experience replay events is dependent on NMDA receptor function during exploration30–32, arguing that synaptic plasticity occurring during behavior modifies the hippocampal network to support subsequent reactivation, although the nature of these changes is unknown.
It is increasingly evident that the excitatory neurons of the hippocampal network do not form a homogenous population, but rather can be differentiated into at least two distinct categories based on development29,33, gene expression34,35, and synaptic properties36–38. These two populations are largely segregated along the radial axis of stratum pyramidale and are canonically termed the deep layer (nearest stratum oriens) and the superficial layer (nearest stratum radiatum)39. Deep and superficial neurons have divergent local and interregional synaptic organization29,37,40–42, which may underlie differences in place cell properties and the stability of spatial representations between these two populations29,36,38,43–48. However, while recent reports demonstrate sublayer-specific assembly dynamics in SWRs38,40, it is unknown whether synapses onto deep and superficial neurons are differentially impacted by in vivo activity or how such changes may impact the ability of the hippocampal network to store and retrieve information.
RESULTS
CaMPARI2 Labels Active Hippocampal Populations In Vivo
To study the synaptic consequences of in vivo activity within the hippocampal network, we expressed CaMPARI2 in hippocampal dorsal area CA1 of adult rats. CaMPARI2 has native green fluorescence but is permanently converted to red fluorescence in the combined presence of high intracellular calcium and near-UV light (Figure 1A)11,12. Following viral expression of CaMPARI2 in excitatory hippocampal neurons, we implanted optic fibers above dorsal area CA1 to label active CA1 pyramidal neurons with sub-second temporal precision via CaMPARI2 photoconversion (Figure 1B). We allowed rats to freely explore a novel, rewarded linear track and provided 405 nm light stimulation during periods of active movement, permanently photoconverting CaMPARI2 from green to red in highly active neurons (i.e., place cells with place fields in this novel environment). In a control cohort, we provided equivalent duration and intensity of photostimulation while rats quietly rested in their familiar home cage. As firing rates are lower during quiet rest than active exploration9, the home cage cohort served as a control to establish the activity-dependence of CaMPARI2 conversion. For both cohorts, rats were sacrificed immediately following photostimulation and acute hippocampal slices were rapidly prepared for live tissue imaging and electrophysiological analysis. Photoconversion was restricted to a cone beneath the optic fiber (Figure 1C), confirming that photoconversion was governed by light presentation.
Figure 1. Experiment design and CaMPARI2 expression and conversion.

A. Schema of CaMPARI2 experiment design. SO, stratum oriens; SP, stratum pyramidale; SR, stratum radiatum; SLM, stratum lacunosum/moleculare. B. Timeline of experiment. C. Left, widefield CaMPARI2 fluorescence in acute dorsal hippocampal slice following photostimulation. Top, fluorescence of native (unconverted), green CaMPARI2. Middle, fluorescence of permanently photoconverted, red CaMPARI2. Bottom, merged of top and middle. Optic fiber tract denoted by dashed line. Scale bar, 400 μm; excitation wavelength indicated. Right, as left, for mean projection two-photon z-stack image of CA1 pyramidal layer showing both native and photoconverted CaMPARI2-expressing neurons. Arrowhead denotes a strongly photoconverted neuron; double-arrowhead denotes unconverted neuron. Scalebar, 40 μm.
Via two-photon imaging of live acute slices, we quantified the ratio of red-to-green fluorescence in each CaMPARI2-expressing pyramidal neuron within the optic cone as a measure of activity level during photostimulation (Figure 2A–B, Supplemental Figure 1A). In the experimental cohort, in which neurons were photostimulated during active exploration, we observed a bimodal distribution (Hartigan’s dip test, p < 0.001) of photoconversion ratios (Figure 2A), consistent with a population of highly active (photoconverted) place cells and a population of silent (unconverted) cells49. We conservatively defined neurons with a red/green ratio lower than 0.4 as unconverted and neurons with a ratio of 0.6 or higher as photoconverted (Figure 2A). With these criteria, 55 of 147 (37.4%) CaMPARI2-expressing neurons beneath the optic fiber were photoconverted during active exploration, consistent with reports of the relative ratios of active place cells and silent cells49,50. In contrast, we observed a much smaller percentage of photoconverted neurons (10 of 132, 7.6%) in rats which received photostimulation in their home cage (Figure 2B), consistent with reduced overall levels of activity during immobility in familiar environments9. The percentage of neurons that were converted during active exploration was significantly higher than the percentage converted in the home cage (binomial cumulative distribution, p < 10−10). To assess the degree of photoconversion within individual neurons, we directly compared red/green ratios for converted and unconverted neurons in both cohorts, as well as for neurons outside of the photoconversion cone (Figure 2C). Photoconverted neurons did not significantly differ in their red/green ratio between the active exploration and home cage cohorts (Figure 2C), consistent with a small population of neurons with high basal activity rates in the home cage51. Furthermore, the red/green ratios of neurons that were classified as unconverted were not significantly different from the red/green ratios of CaMPARI2-expressing neurons located outside of the optic light cone (Figure 2C), supporting our classification of this population as “unconverted.”
Figure 2. Distribution of CaMPARI2 photoconversion during novel exploration vs. home cage rest.

A. Histogram of photoconversion ratios across all CaMPARI2-expressing pyramidal cells (n = 147 cells, 3 rats) within the optic cone photostimulated during active exploration of a novel linear track. B. As (A), for photostimulation during quiet rest in familiar home cage (n = 132 cells, 3 rats). C. Mean ± S.E.M. photoconversion ratio for neurons outside of the light cone (far left), and neurons classified as Unconverted or Photoconverted for both novel exploration and home cage cohorts. D. Plot of photoconversion ratio and distance from the stratum pyramidale/stratum radiatum border for neurons optically stimulated during novel exploration and imaged on two-photon microscope. E. Mean ± S.E.M. and individual data points of photoconversion ratio for neurons in (D) classified as deep vs. superficial and photoconverted vs. unconverted. F. Histogram of photoconversion ratios on electrophysiology microscope across CaMPARI2-expressing pyramidal cells used in whole cell electrophysiology experiments (n = 72 cells, 14 rats) within the optic cone photostimulated during active exploration of a novel linear track. Statistical tests and results: (C) One-way ANOVA (4,321)=138.2; p < 10−4. Post hoc multiple comparisons (Tukey HSD): Outside vs. Either Unconverted, p > 0.25; Exploration Photoconverted vs. Home Cage Photoconverted, p > 0.6; Outside/Either Unconverted vs. Either Photoconverted p < 10−4. (E) Two-way ANOVA Deep vs. Superficial F(1,116)=0.0257, p = 0.8730; Unconverted vs. Photoconverted F(1,116)=163.2, p < 10−4; Interaction F(1,116)=0.113, p = 0.7375. Multiple comparisons (Tukey HSD): Either-Unconverted vs. Either-Photoconverted p < 10−4; Deep-Unconverted vs. Superficial Unconverted p = 0.9992; Deep-Photoconverted vs. Superficial Photoconverted p = 0.987.
Given established differences in spatial encoding between deep and superficial pyramidal neurons29,36,38,43–48, we quantified the photoconversion ratio of each neuron as a function of somatic distance from the border between stratum pyramidale and stratum radiatum. There was no correlation between radial location and photoconversion ratio (Figure 2D). We categorized superficial and deep neurons, respectively, as cells within or greater than 40 μm from the stratum pyramidale/stratum radiatum border40 and found no difference in photoconversion rates or red/green ratios between deep and superficial neurons (Figure 2E, deep cells: 33 of 85 cells (38.8%) classified as photoconverted; superficial cells: 22 of 62 cells (35.5%) classified as photoconverted; binomial cumulative distribution, p = 0.22).
Recent Activity Differentially Impacts Synaptic Strength onto Deep and Superficial Neurons
We next quantified the synaptic consequences of in vivo activity by performing whole cell electrophysiology on converted and unconverted neurons within the optic light cone from a second novel exploration cohort that received identical photostimulation during exploration of the same novel linear track. While overall red/green ratios were slightly higher on the electrophysiology rig microscope than on the two-photon microscope, the distribution of conversion ratios remained bimodal (Hartigan’s dip test, p < 0.001), with 38.9% (28 of 72) of CaMPARI2-expressing neurons displaying strong photoconversion (Figure 2F), statistically similar to the rate of conversion identified under the twophoton microscope (Figure 2A, binomial cumulative distribution, p = 0.35).
We directly stimulated Schaffer collaterals to measure excitatory CA3 input to unconverted or photoconverted CA1 neurons and used paired-pulse ratio (PPR, Figure 3A) and the ratio of AMPA/NMDA responses (Figure 3B) to measure pre-synaptic release probability and post-synaptic strength, respectively. Responses at +40 mV were attenuated by application of the NMDA receptor antagonist AP5 and blocked by co-application of AP5 and the AMPA receptor antagonist DNQX (Supplemental Figure 1B), demonstrating that the measured responses were synaptic in origin. We observed no difference in capacitance or input resistance between photoconverted and unconverted neurons (Supplemental Figure 1C).
Figure 3. Deep and superficial cells display distinct synaptic differences between unconverted and photoconverted neurons.

A. Left, representative paired-pulse traces from unconverted (green) and photoconverted (magenta) deep pyramidal neurons. Scale bar 100 pA, 25 ms. Right, PPR vs. photoconversion ratio for all deep neurons. B. Left, representative AMPA/NMDA traces from unconverted (green) and photoconverted (magenta) deep pyramidal neurons held at −40 mV. Thin trace is ACSF-only, thick trace is ACSF with 100 mM AP5. Scale bar 50 pA, 50 ms. Right, AMPA/NMDA ratio vs. photoconversion ratio for all deep neurons. C-D. As (A-B), for superficial pyramidal neurons. E. Mean ± S.E.M. and individual data points of PPR for neurons in (A) and (C) classified as photoconverted vs. unconverted. F. Mean ± S.E.M. and individual data points of AMPA/NMDA ratio for neurons in (B) and (D) classified as photoconverted vs. unconverted. Statistical tests and results: (E) Two-way ANOVA Deep vs. Superficial F(1,32)=2.453, p = 0.1271; Unconverted vs. Photoconverted F(1,32)=3.257, p = 0.0805; Interaction F(1,32)=3.942, p = 0.0557. Multiple comparisons (Tukey HSD): Unconverted-Deep vs. Photoconverted-Deep p = 0.0365. (F) Two-way ANOVA Deep vs. Superficial F(1,26)=3.986, p = 0.0565; Unconverted vs. Photoconverted F(1,26)=3.974, p = 0.0568; Interaction F(1,26)=50.13, p < 10−4. Multiple comparisons (Tukey HSD): Unconverted-Deep vs. Photoconverted-Deep p = 0.003; Unconverted-Superficial vs. Photoconverted-Superficial p < 10−4.
Deep pyramidal cells displayed a positive relationship between the CaMPARI2 red/green conversion ratio and the PPR of Schaffer collateral synapses (Figure 3A). As higher PPR values are consistent with reduced pre-synaptic release probability, these data indicate that in vivo activity of deep pyramidal neurons weakens pre-synaptic excitatory inputs to these cells from area CA3. In addition, the ratio of AMPA/NMDA responses onto deep pyramidal neurons were negatively correlated with photoconversion ratios (Figure 3B). These results collectively provide evidence that recent neural activity during novel exploration may decrease both pre- and post-synaptic weights between excitatory CA3 neurons and deep CA1 pyramidal neurons. In contrast to what was observed for deep pyramidal neurons, PPR values onto superficial pyramidal neurons were not affected by in vivo activity (Figure 3C). However, the post-synaptic weights of superficial neurons showed a positive correlation with the CaMPARI2 conversion ratio (Figure 3D). These data suggest that in vivo activity during active exploration is associated with stronger post-synaptic transmission from Schaffer collaterals onto superficial neurons. Photoconverted deep pyramidal neurons had a significantly lower AMPA/NMDA ratio than unconverted deep neurons, while photoconverted superficial neurons had a significantly higher AMPA/NMDA ratio than unconverted superficial neurons (Figure 3E–F, Supplemental Figure 1D). Importantly, it is unclear from these data alone whether activity during exploration strengthened synapses onto superficial neurons or whether superficial neurons with pre-existing stronger synapses were more active during exploration. To disentangle these possibilities, we examined the post-synaptic weights of superficial neurons in a separate cohort of rats in which cells were photoconverted during home cage rest in the absence of novel salient experience. Because acetylcholine, which is required for synaptic potentiation in response to physiological activity patterns52, is greatly diminished during rest53, we hypothesized that neural activity during home cage rest would be less effective at inducing synaptic potentiation. Therefore, any observed differences in synaptic strength between photoconverted and unconverted neurons would be more reflective of pre-existing weights rather than activity-dependent plasticity. In contrast to the results from the active exploration cohort, the photoconversion ratio of superficial pyramidal neurons from the home cage cohort was not correlated to post-synaptic weight (Supplemental Figure 1E), indicating that activity rates are not strictly a result of pre-existing synaptic strength.
Exploration Induces Distinct Effects on Deep and Superficial Activity in Off-Line Reactivation
Together, the above findings provide evidence that network activity during exploration appears to potentiate excitatory CA3 input to superficial place cells but weaken input to deep place cells. During SWRs, the dominant excitatory input onto CA1 neurons originates from CA354–56, and the strength of CA3-to-CA1 synapses is positively correlated with recruitment of CA1 neurons in SWR events57. While several recent studies demonstrate differential activity of deep and superficial neurons in SWRs36,38,40,56, it is unknown how awake experience may specifically impact incorporation of these two subpopulations into SWR-based replay. Based on our in vitro electrophysiological data, we hypothesized that in vivo activity during exploration should differentially impact the activity of deep and superficial neurons during SWRs following the experience, increasing the activity of superficial neurons while decreasing activity of deep neurons. To test this hypothesis, we examined large-scale in vivo electrophysiological recordings from dorsal area CA1 in a separate cohort of freely behaving rats (Supplemental Table 1) and analyzed neural activity within SWRs before and after exploration of a linear track (Figure 4A). The sharp-wave component of the SWR reverses across the pyramidal layer58, allowing us to assess the radial depth of each tetrode via the sharp-wave deflection (Figure 4B–C). In each recording session, we observed a large distribution of sharp-wave amplitudes (Figure 4D). To strengthen our interpretation of the sharp-wave deflection as a measure of radial recording depth, we examined additional features known to change across the pyramidal layer, including the phase offset of the 25–50 Hz slow gamma oscillation59 (Supplemental Figure 2A), the preferred ripple phase of neural activity60 (Supplemental Figure 2B), and basal firing rates, burstiness, and preferred REM theta phases of neurons recorded on putative deep and superficial tetrodes36,38 (Supplemental Figure 2C). To ensure our analysis was limited to deep vs. superficial sublayers, we eliminated any tetrode with a sharp-wave deflection between 50 and −50 μV (Figure 4D). To add further confidence to our assessment of deep and superficial neurons, we restricted our analyses to a subset of neurons with large-amplitude spikes (mean spike amplitude > 200 μV on any electrode) to ensure that the cells producing those action potentials were located near the recording site and were therefore more likely to be in the deep or superficial sublayers.
Figure 4. Deep and superficial pyramidal cell activity in SWRs is differentially affected by experience.

A. Timeline of in vivo electrophysiology recording. B. Representative pre-experience (left) and post-experience (right) SWRs simultaneously recorded on electrodes in the deep and superficial portion of the pyramidal layer (raw LFP top trace, ripple-filtered LFP bottom trace, ripple boundaries identified across all electrodes in red). Scale bar = 0.2 s, 0.2 mV. C. Ripple-triggered average raw LFP trace (across 1,062 SWRs) for each tetrode from one representative experimental session demonstrating range of recording depths. Tetrodes ordered by amplitude of sharp-wave deflection. Each tetrode baseline offset by 50 μV for visualization. Only tetrodes with recorded putative pyramidal neurons shown. Scale bar: 100 ms, 250 μV. D. For all SWRs recorded across each experimental session, distribution of average sharp-wave deflection amplitudes on each tetrode. Only tetrodes with recorded putative pyramidal neurons plotted. Tetrodes above or below the shaded region (±50 μV) were classified as targeting deep or superficial layers, respectively. E. Left, across all deep (n = 118) and superficial (super., n = 83) neurons with place fields and spike amplitudes > 200 μV, distribution of firing rate experience modulation ratios (EMR) for all SWRs. Box indicates median and inter-quartile range, bars indicate non-outlier extremes, dots indicate outlier values, notch indicates 95% confidence interval about the median. One-sample Wilcoxon sign rank deviation from zero with Bonferroni correction. Right, for each session, mean firing rate across all place cells for all SWRs during pre- or post-experience periods is plotted. Rat and Session legend as in Supplemental Figure 2 A. Mean ± SEM across sessions (n = 10) in thick black. Two-way repeated measures ANOVA with post-hoc Šídák’s multiple comparisons test for pre vs. post. F. As (E), for only replay-encoding SWRs. G. Participation EMR for deep and superficial cells in all SWRs, replay-encoding SWRs, or fragmented SWRs. One-sample Wilcoxon sign rank deviation from zero with Bonferroni correction. H. Left, for each cell and mean ± SEM for each bin (bin size 0.2), on-task activity index vs. firing rate EMR for replay-encoding SWRs. Right, box plot as (E) for deep and superficial cells subdivided by low on-task activity (on-task activity index < 0, Lo) or high on-task activity (> 0, Hi). One-sample Wilcoxon sign rank deviation from zero with Bonferroni correction. I. On-task activity index vs. firing selectivity EMR in replay for neurons with high on-task firing. For all analyses, * p < 0.05, ** p < 0.01, *** p < 0.001, n.s. p > 0.05.
At baseline during pre-experience rest, superficial cells had significantly higher firing rates than deep cells within SWRs (Wilcoxon rank-sum p = 0.016, deep 8.02 ± 0.24 Hz, superficial 9.56 ± 0.53 Hz), in agreement with the previously described impact of local inhibitory circuitry biasing activity in SWRs toward superficial populations40,60 (although increased deep cell activity in SWRs has been reported in other studies using distinct experimental paradigms 29,36,38). Because firing rates of individual hippocampal neurons are largely preserved across environments and brain states51,61, we quantified an experience modulation ratio (EMR) for each neuron which measured the relative increase (positive EMR values) or decrease (negative EMR values) in activity from pre-experience SWRs to post-experience SWRs. Superficial neurons increased their SWR firing rates from pre- to post-experience rest periods (Figure 4E), consistent with experience-dependent strengthening of CA3 synaptic inputs during exploration (Figure 3D). This effect was not observed when spiking activity outside of SWRs was examined (Supplemental Figure 3A). Surprisingly, we did not observe an experience-dependent change in the firing rate of deep cells when all SWRs were analyzed together (Figure 4E). Similar results were observed on a per-session basis (Figure 4E).
We reasoned that experience-driven changes in activity within SWRs may be distinct in SWRs that encode replay of recent experience than in those which encode fragmented, spatially incoherent information62. Using a memoryless Bayesian decoding algorithm, we identified the subset of SWRs which encoded coherent spatial information (i.e., “replay”63, Supplemental Figure 3B, Supplemental Table 1). Interestingly, although deep neurons did not significantly change their firing rates when all SWRs were analyzed together (Figure 4E), when analysis was restricted to SWRs encoding coherent replay, the firing rate of deep cells significantly decreased in SWRs following experience (Figure 4F), consistent with our observation of weaker synaptic transmission at CA3-CA1 deep neurons that were active during exploration (Figure 3B). Superficial neurons did not display experience-dependent changes in firing rates within replay-encoding SWRs (Figure 4F).
We next analyzed participation rates for deep and superficial neurons, measured as the percentage of SWRs in which each cell fired at least one action potential. There was no baseline difference between deep and superficial participation rates in pre-experience SWRs (Wilcoxon rank sum p = 0.87, deep 16.6 ± 0.9%, superficial 19.7 ± 2.1%). When all SWRs were analyzed together or when only replay-encoding SWRs were analyzed, participation rates increased significantly for both deep and superficial neurons (Figure4 G, Supplemental Figure 3C), consistent with experience-driven elevation of overall hippocampal network activity64–66. However, deep cells displayed reduced participation rates for SWRs encoding fragmented spatial information (Figure 4G), suggestive of a refinement in their activity as a result of experience-dependent synaptic weakening (Figure 3A–B).
The relationship between photoconversion ratios and synaptic strength (Figure 3) predicts that changes in deep or superficial cell activity in SWRs should be correlated to activity during the on-task, exploration period. On a per-cell basis for both deep and superficial neurons, we observe a positive correlation between activity during active exploration and firing rate EMR values in all SWRs (Supplemental Figure 3D) and in replay-encoding SWRs (Figure 4H left). This finding is consistent with the apparent synaptic strengthening of superficial cell inputs as a function of on-task activity (Figure 3D), but contrary to the observation of weakened inputs to highly active deep cells (Figure 3A–B). Indeed, the decreased firing rate of deep neurons in post-experience replay (Figure 4F) is largely driven by cells with low activity rates during exploration (Figure 4H right). No such correlation was observed for burstiness of neurons (Supplemental Figure 3E).
Given the positive relationship between activity rates during exploration and SWR-based firing (Figure 4H), the reduction in synaptic strength associated with increased on-task deep cell activity (Figure 3 A–B) may represent synaptic refinement rather than global weakening of all synaptic inputs, as indicated by lower deep cell participation in fragmented SWRs (Figure 4G). This hypothesis predicts that following experience, deep cells that were highly active during navigation should display improved selectivity in the timing of their activity during replay events rather than overall decreased activity. To test this hypothesis, across replay events we quantified the distance between the place field peak of each participating cell and the population-level spatial representation within each decoding window; lower values indicate that the neuron fired when the rest of the hippocampal population encoded the same spatial information as the current cell. In agreement with our hypothesis, deep cells, but not superficial cells, show a significant negative correlation between spike-timing selectivity in replay and on-task activity rates (Figure 4I), indicating an improvement in firing precision within replay associated with increased activity during exploration.
DISCUSSION
We investigated the synaptic consequences of in vivo activity on hippocampal place cells and the effects of these changes on network reactivation in SWRs, using CaMPARI211,12 to permanently label active hippocampal neurons with sub-second temporal precision as animals traverse a novel linear track, followed by detailed synaptic analyses of active and inactive populations. We observe opposite synaptic changes following in vivo activity depending on whether the neurons reside in the deep or superficial sublayer of stratum pyramidale. Recently active deep pyramidal neurons display weaker CA3 inputs, while recently active superficial neurons are more potentiated at CA3 synapses than their inactive counterparts. These changes are reflected in the relative activity of these two groups during CA3-driven SWRs following a salient experience. Together with prior work38,40,67, our findings suggest a network model in which activity during exploration drives synaptic potentiation at CA3-to-superficial-CA1 synapses, resulting in elevated rates of superficial cell participation and firing rates in post-experience SWRs, while in vivo activity depresses CA3 input to deep pyramidal neurons, refining deep cell activity in SWRs. The refinement in deep cell activity is observed through both reduced recruitment into SWRs containing fragmented, incoherent information as well as improved timing specificity in replay-encoding SWRs, effects not observed for superficial neurons.
A critical consideration for the interpretation of our findings is whether the differences observed in synaptic strength between photoconverted and unconverted neurons existed prior to the experience28,29,68 or whether they were produced as a consequence of in vivo activity during exploration6,8,28,31,32,69. Because we are unable to perform whole cell electrophysiology on the same neurons before and after exploration, we acknowledge that the experiments described here cannot definitively establish a causal link between in vivo activity and synaptic plasticity. However, several arguments support our interpretation that the synaptic differences we observe do not represent pre-existing structure, but are instead generated dynamically by in vivo activity. If the weaker synapses observed on photoconverted deep pyramidal neurons (Figure 3 A–B) reflected a pre-experience basal state, that neural population would be expected to have reduced overall activity during the experience due to their weaker synaptic inputs, and thus would be less likely to be active at the time of photostimulation and consequently less likely to be photoconverted. Therefore, the strong correlation between photoconversion rates and weaker synapses onto deep neurons (Figure 3 A–B) indicates that the observed changes onto deep neurons represent a consequence of in vivo activity rather than a pre-existing phenotype. In contrast, the observation of stronger synapses onto photoconverted superficial neurons may be explained by stronger pre-existing synaptic weights driving higher levels of activity. To explore this possibility, we examined the impact of synaptic weight on activity rates of superficial neurons during home cage rest and found no correlation (Supplemental Figure 1E), providing evidence that observed differences in synaptic strength between photoconverted and unconverted neurons do not reflect baseline differences, but rather plastic changes. In addition, we tracked superficial and deep pyramidal neurons from pre-experience to post-experience rest periods via extracellular in vivo electrophysiological tetrode recordings. In these recordings, both superficial and deep neurons show changes in SWR participation and firing rate from pre- to post-experience states which are consistent with the differences we observe in synaptic strength between photoconverted and unconverted neurons: superficial cells show increased firing rates in post-experience SWRs and deep cells show reduced firing rates in post-experience replay events (Figure 4). While we leave open the possibility that the synaptic differences we observe between photoconverted and unconverted neurons reflect pre-existing phenotypes, we interpret these findings as plasticity-induced changes driven by in vivo activity during experience.
Decades of work support the hypothesis that synaptic plasticity across the hippocampal network during exploration strongly influences the content of post-experience SWR-based replay, although the specific changes induced during experience to support off-line reactivation were previously unknown. Place cell ensemble activity during exploration is more strongly correlated with post- than pre-experience SWR content32,64,70,71, and this change can be abolished by inhibiting NMDAR function during behavior30,31. In addition, artificial stimulation of ex vivo hippocampal slices using physiological activity patterns recorded from freely behaving rats induces synaptic plasticity at CA3-to-CA1 connections, an effect which requires high levels of acetylcholine consistent with the strong cholinergic tone observed during active exploration52. Our results provide novel insight into the location and direction of in vivo synaptic plasticity which arises within the intact hippocampal network during experience, and further establish a link between these synaptic changes and the content of SWRs. Our work also clarifies the findings of prior reports. Population-level quantification of synaptic weights before and after a novel experience via in vivo local field potential recordings reported a mixture of potentiation and depression69. As we observe a combination of potentiation and depression on superficial and deep pyramidal neurons, respectively, our findings help explain this variability. While CA3 input is a dominant factor driving CA1 population activity during SWRs55, activity in other brain regions can also influence SWRs72,73, and plasticity across these networks is likely to impact information storage and expression in replay.
It is unclear what underlies the differences we observe in plasticity between deep and superficial neurons. It is known that superficial and deep neurons have unique gene expression patterns which may underlie differential function of metabotropic pathways35,74. Given the critical importance of metabotropic acetylcholine receptors for both long-term potentiation and depression52,75, we hypothesize that neuromodulatory cascades are likely different in deep vs. superficial neurons, possibly resulting in bidirectional plastic changes76. In addition, the synaptic changes we observe are measured via stimulation of a large population of Schaffer collateral axons, and may mask distinct, synapse-specific plasticity.
Superficial and deep cells receive differential input from the lateral and medial entorhinal cortex, two extra-hippocampal regions that convey distinct information content37,38. Accordingly, deep and superficial place cells encode experience differently depending on the presence or absence of reward43 or the complexity of the environment47. In our experimental paradigm, we utilized a relatively simple linear track paradigm with minimal memory requirements and labeled neurons active only during periods of active movement across the track, which largely excluded labeling of neurons which encoded the reward areas at the ends of the track. Thus, given recent work demonstrating that deep and superficial neurons form segregated subcircuits that differentially route information to distinct cortical regions38, it is likely that under different behavioral paradigms or labeling strategies that a distinct population of deep and superficial cells would be labeled and a different population of synapses would be activated which may engage in unique forms of plasticity77. In addition, although we performed our photolabeling during exploration of a novel linear track, our in vivo electrophysiological recordings were performed during exploration of a relatively familiar track. While the established impact of novelty on neuromodulator release and subsequent plasticity78,79 may predict distinct synaptic changes in novel versus familiar environments, we observe consistent experience-dependent changes in both sets of data.
STAR METHODS
Resource Availability
Lead Contact:
Further information and requests for resources should be directed to and will be fulfilled by the lead contact, Brad Pfeiffer (Brad.Pfeiffer@UTSouthwestern.edu).
Materials Availability:
Plasmids generated by this study are available upon request.
Data and Code Availability:
Raw data used in this study are available upon request. All original code used for analyses in this study are publicly available at https://github.com/Brad-E-Pfeiffer/DeepSuperficialSWRs.
Experimental Model and Subject Participant Details
All experiments were performed according to procedures approved by the UT Southwestern Institutional Animal Care and Use Committee or Johns Hopkins University Animal Care and Use Committee and followed US National Institutes of Health animal use guidelines. Male and female Long-Evans rats (350–500 g) aged 3–6 months were used.
Method Details
Generation of AAV vector and virus
The pAAV-DJ plasmid was a gift from Dr. Wei Xu’s lab (UTSW). The CaMPARI2 gene was removed from pAAV-Syn-CaMPARI2 (Addgene #101060) and ligated into AAVdj-CaMKII-GFP backbone (Addgene #64545), replacing GFP, resulting in CaMPARI2 expression via the CaMKII promoter. The plasmid products were sequence verified before use in viral preparations using the following primers: CaMPARI2 forward 5′-TAGTTCTGGGGGCAGCGGGGGCCACCATGCTGCAGAAC-3′ and reverse 5′-CCAGAGGTTGATTATCGATATTACGTACGCAGGTCCTC-3′. Viral stock was produced via the Baylor University viral core facility.
Viral injection, fiber implantation, and behavior
Animals were handled daily and food-restricted to 85–90% of their free-feeding weight and then trained to traverse a 1.8 m linear track to receive a sweetened milk reward (100 μl) at either end. Rats were trained for 20 minutes once per day for a total of 6 training days. Linear track training occurred in a room separate and visually distinct from the photolabeling room. After training, rats received bilateral viral injections, followed by a 14-day recovery period to allow for viral expression, followed by surgical implantation of optic fibers. Viral injections were performed following isoflurane anesthesia. Craniotomies were produced and three 600 nL injections of virus were made bilaterally at coordinates (relative to bregma): AP 3.9, 4.0, 4.1, ML ± 2.6, 2.8, 3.0, DV 2.5, 2.6, 2.7. Optic fiber pairs (400 μm diameter) housed in a lightweight plastic sheath were implanted bilaterally following isoflurane anesthesia at coordinates AP 4.0, ML ± 2.8, DV 2.6 and secured to skull screws via dental cement.
On the experimental day, animals in the novel exploration cohort were placed on a 1.8-meter-long linear track in a room distinct from the training room, where they performed the trained task (running back and forth for liquid reward). 405 nm light (Thorlabs) was delivered through the implanted optic fibers only during periods of active movement across the track at 100% power, 3.7 mW, at 0.5 s pulses until 300 s of total labeling time was achieved, typically requiring 30–40 minutes of total exploration. Animals in the home cage cohort used for live slice imaging (Figure 2) received 300 total seconds of identical light stimulation, without regard for movement or sleep/wake state, although rats were largely immobile throughout the stimulation period based on visual observation. For the home cage cohort used for slice electrophysiology (Supplemental Figure 1E), photostimulation (identical pattern, duration, and intensity as other cohorts) was restricted to periods of visually identified immobility. For both two-photon images and slice electrophysiology experiments, rats were deeply anesthetized with isoflurane immediately after photolabeling and rapidly decapitated within minutes of the final light stimulation pulse. Following surgical hippocampal isolation, acute sagittal 230–250 μm brain slices were cut in 4°C dissection buffer. Slicing was typically completed less than 30 minutes following the final light stimulation pulse. Individual slices were incubated in a recovery chamber saturated with 95% O2/5% CO2 at 34°C for 20 min and then kept at 24°C for a minimum of 45 min in artificial cerebrospinal fluid (ACSF) prior to imaging or electrophysiology.
Imaging
Images were acquired on an Olympus Ultima IV Bruker with a 20X Olympus immersion objective, exciting at 920 nm or 1020 nm for native or photoconverted CaMPARI2, respectively. Each slice was imaged multiple times across the CA1 proximal-distal axis, obtaining images both inside and outside the fiber optic light cone and establishing a per-slice normalization value, as the baseline expression and signal strength was variable. Images were obtained from 18 slices across six animals, three in the novel exploration and three in the home cage cohort. The pyramidal cell location data was obtained by drawing a line perpendicular to the estimated border between stratum radiatum and stratum pyramidale and the center of the soma. Deep and superficial cells were identified as neurons with the center of their soma farther or nearer, respectively, 40 μm from the stratum radiatum/stratum pyramidale border. Cells were excluded from image analysis if cell somas were located 100 μm or more below the stratum radiatum/stratum pyramidale border (within stratum radiatum) or if observed to have a round or horizontally elongated somatic morphology. Cells were considered to be in the optic cone if they were within 150 μm of the vertical edge of the optic fiber.
Slice electrophysiology
Cells were visualized by epifluorescence imaging using a water immersion objective (40X, 0.8 numerical aperture) on an upright Olympus BX51 WI microscope, with video-assisted infrared charge-coupled device camera (QImaging Rolera). During recordings, single slices were constantly perfused in a submersion chamber with 30°C oxygenated ACSF with the addition of 50 μM picrotoxin. Patch pipettes were pulled to a final resistance of 3 to 5 MΩ from filamented borosilicate glass on a Sutter P-1000 horizontal puller. Superficial CA1 pyramidal cell somata were defined as cell bodies approximately 0–40 μm inside the pyramidal layer from the border of stratum pyramidale and stratum radiatum. Deep CA1 pyramidal cell somata were identified as approximately 50 μm or more from the stratum pyramidale/stratum radiatum border. Data were low-pass–filtered at 10 kHz and acquired at 2 kHz with an Axon MultiClamp 700B amplifier and an Axon Digidata 1550B data acquisition system under the control of Clampex 10.6 (Molecular Devices). Synaptic currents were evoked by electrical stimulation with an isolation unit through a glass stimulation monopolar electrode filled with ACSF and placed in the stratum radiatum (1 ms, 0.2–0.7 mA, 0.1 Hz). Synaptic responses were monitored at different stimulation intensities before establishing baseline recording at approximately 50% of the maximal response. For paired-pulse ratio measurements, synaptic responses were obtained while holding the cell at −70 mV and delivering paired stimulations at 20 Hz. The paired-pulse ratio is calculated as the amplitude of the second response divided by the amplitude of the first. To measure the AMPA/NMDA ratio, the membrane voltage was held at +40 mV. Responses to stratum radiatum stimulation included both AMPAR- and NMDAR-driven currents. AP5 (d,l-2-amino-5-phosphonovaleric acid, 100 mM) was bath applied and AMPAR-isolated currents were obtained using identical stimulation. The NMDA component was obtained by digital subtraction of the ACSF-only current at +40 mV and the residual current after AP5 application. Access resistance (10 to 30 MΩ) was monitored throughout the experiment and cells where it changed more than 20% were discarded from further analysis. For some experiments, AP5 and DNQX (6,7-Dinitroquinoxaline-2,3-dione, 10 μM) were simultaneously bath applied to block all synaptic transmission to confirm that responses were synaptic. A total of 17 rats (7 female, 10 male) were used for slice electrophysiology. The in vitro electrophysiology cohort (Figure 2F, Figure 3, Supplemental Figure 1B–E) was separate from the cohort used for imaging (Figure 2A–E, Supplemental Figure 1A), but underwent identical training, virus injection, and photostimulation protocols.
In vivo electrophysiology
The dataset used in this study has been previously analyzed (Supplemental Table 1)80. A detailed description of the behavioral training and electrophysiological recording has been described previously23 and is summarized here. Following training, adult male Long-Evans rats were implanted with a microdrive array (25–30 g) containing 40 independently adjustable, gold-plated tetrodes aimed at CA1 of dorsal hippocampus. Recordings of spike data (32 kHz, 600–6000 Hz bandpass) and local field potentials (LFP, 3.2 kHz, 0.1–500 Hz bandpass) were obtained during free exploration of a familiar linear track for reward at either end and during one hour rest periods immediately before and after linear track exploration in which the rat was confined to a paper-lined, 30-cm-diameter ceramic plate atop an inverted vase within a 60-cm x 60-cm room with opaque walls (the rest box). Only tetrodes in which single units were identified were included in subsequent analyses. Post-experiment lesion histology80 confirmed recording locations in the CA1 pyramidal area but were incapable of determining precise deep vs. superficial targeting due to the size of the lesions. To identify sharp-wave/ripples (SWRs), the LFP was bandpass filtered between 150 and 250 Hz, and the absolute value of the Hilbert transform of this filtered signal was smoothed (Gaussian kernel, SD 12.5 ms). This processed signal was averaged across all tetrodes and SWRs were identified as local peaks with an amplitude >3 SD above the mean.
The start and end boundaries of each SWR were defined as the point when the signal crossed the mean. For each tetrode, the sharp-wave deflection was quantified as the mean amplitude across all SWRs of the 5–15 Hz bandpass filtered signal at maximum ripple power. Tetrodes with a sharp-wave deflection greater than 50 μV were classified as targeting the deep sublayer; tetrodes with a sharp-wave deflection less than −50 μV were classified as targeting the superficial sublayer. Only units classified as putative excitatory neurons (based on spike waveform and mean firing rate23) with mean spike amplitude of 200 μV or greater on at least one electrode of the tetrode were included in analyses. Putative sleep was identified as periods of complete immobility lasting at least 60 seconds, excluding the first 20 seconds of such periods. REM was identified as periods of putative sleep in which the ratio of mean theta power (6–12 Hz) and mean delta power (1.5–4 Hz) across all tetrodes was > 1; all other periods of putative sleep were classified as SWS.
Place Field and Activity Quantification
Place fields were calculated during linear track exploration periods as previously described80 using 2 cm bins and Gaussian smoothing kernel SD of 4 cm. Units were considered to have a place field if any spatial bin had > 1 Hz firing rate. On-Task Activity Index was quantified as
where OnTask was the mean firing rate of a neuron outside of SWRs across the entire linear track exploration period and PreTask was the mean firing rate of the neuron outside of SWRs across the entire pre-task rest box session. On-Task Activity Index values range from −1 to 1, with a value of 0 indicating no change in mean firing rate from rest to active exploration. Cell participation in SWRs was quantified as the percent of SWRs in which a given cell fired at least one action potential. Firing rate in SWRs was quantified as the mean firing rate for a given cell across all SWRs, excluding SWRs for which the cell did not fire any action potentials. Experience Modulation Ratio (EMR) was quantified as
where Pre is the value (firing rate, cell participation, or timing selectivity) across the pre-task rest box session and Post is the value across the post-task rest box session. Burstiness was quantified as fraction of spikes with inter-spike latency < 6 ms81.
Coherent vs. Fragmented SWR Criteria
The information content in each SWR was estimated using a Bayesian decoding approach as previously described23, with a time window of 20 ms advanced in 10 ms steps. Coherent spatial representation was defined as five or more consecutive decoding windows in which the decoding was coherent (maximum posterior probability > 0.05) and virtual movement was behaviorally plausible (maximum distance between the peak posterior probability bin of consecutive frames ≤ 40 cm). Coherent SWRs were defined as SWRs in which > 60% of decoding frames had coherent spatial representation. Fragmented SWRs were defined as SWRs in which < 20% of the decoding frames had coherent spatial representation.
Firing Selectivity in Replay
For each replay event, each decoding window was separately analyzed to quantify the location of maximal posterior probability. For each cell that fired in that window, the Euclidean distance between that location and the peak of the cell’s place field was quantified as the firing selectivity value.
Data and statistical analysis
ImageJ software was used to quantify the conversation ratios and radial location of CA1 pyramidal cells. Clampfit (Molecular Device) was used for the analysis of slice electrophysiological data and trace extraction. All data were analyzed in Prism 9.0 (GraphPad) or MATLAB 2022a (MathWorks). Statistics for each test are included in figure legends. All data are freely available upon request. Analysis code is available at https://github.com/Brad-E-Pfeiffer/DeepSuperficialSWRs.
Solutions
Dissection buffer for imaging: NaHCO3 (25 mM), KCl (2.5 mM), NaH2PO4 (1.25 mM), MgCl2 (7 mM), CaCl2 (0.75 mM), sucrose (211 mM), D-glucose (11 mM), and Na-pyruvate (3 mM). ACSF for imaging: NaCl (125 mM), NaHCO3 (26 mM), KCl (2.5 mM), NaH2PO4 (1.25 mM), MgCl2 (1 mM), CaCl2 (2 mM), D-glucose (11 mM). ACSF pH was approximately 7.3 after oxygenation with 95%/5% O2/CO2. Dissection buffer for electrophysiology: 225 mM sucrose, 3 mM KCl, 1.25 mM NaH2PO4, 26 mM NaHCO3, 10 mM d-(+)-glucose, 7 mM MgSO4, 0.5 mM CaCl2, and 2 mM kynurenic acid. ACSF for electrophysiology: 126 mM NaCl, 3 mM KCl, 1.25 mM NaH2PO4, 26 mM NaHCO3, 10 mM d-(+)-glucose, 1.3 mM MgSO4, and 2.5 mM CaCl2. Internal solution: 120 CsMeSO3, 10 CsCl, 10 HEPES, 10 EGTA, 5 Na-phosphocreatine, 4 ATP (Mg2+ salt), 0.4 GTP (Na+ salt), pH adjusted to 7.3 with CsOH, osmolarity adjusted to 300 ± 10 mOsm.
Supplementary Material
KEY RESOURCES TABLE
| REAGENT or RESOURCE | SOURCE | IDENTIFIER |
|---|---|---|
| Bacterial and virus strains | ||
| AAV-CaMKII-CaMPARI2, DJ8 | This paper; Baylor College of Medicine Gene Vector Core | N/A |
| Experimental models: Organisms/strains | ||
| Long Evans rats | Charles River | https://www.criver.com; Strain 006 |
| Oligonucleotides | ||
| CaMPARI2 forward sequence primer 5’- TAGTTCTGGGGGCAGCGGGGGCCACCATGCTGCAGAAC-3’ | This paper | N/A |
| CaMPARI2 reverse sequence primer 5’- CCAGAGGTTGATTATCGATATTACGTACGCAGGTCCTC-3’ | This paper | N/A |
| Recombinant DNA | ||
| pAAV_hsyn_NES-his-CaMPARI2-WPRE-SV40 | Addgene | RRID: Addgene_101060 |
| pAAV_CaMKII-GFP | Addgene | RRID: Addgene_64545 |
| Software and algorithms | ||
| ImageJ | NIH | https://imagej.nih.gov/ij/ |
| Matlab | MathWorks | https://www.mathworks.com |
| ClampFit | Molecular Devices | https://moleculardevices.com |
| Prism | GraphPad | https://www.graphpad.com |
| Analysis Code | This paper | https://github.com/Brad-E-Pfeiffer/DeepSuperficialSWRs |
Highlights.
Recent in vivo activity of CA1 neurons identified via CaMPARI2 photoconversion
Active deep cells show weaker CA3 inputs than inactive deep cells
Recently active superficial cells display increased synaptic strength
Bidirectional changes in synaptic strength match changes in ripple firing
Acknowledgements:
We thank Dr. Wei Xu, Dr. Xin Shao, and Harshida Pancholi for sharing reagents and technical expertise. This work was supported by National Institutes of Health: R01MH117149 (LJV), R01NS104829 (BEP), and R01NS108424 (TFR).
Footnotes
Conflicts of Interest: Authors declare no conflicts of interest.
Publisher's Disclaimer: This is a PDF file of an unedited manuscript that has been accepted for publication. As a service to our customers we are providing this early version of the manuscript. The manuscript will undergo copyediting, typesetting, and review of the resulting proof before it is published in its final form. Please note that during the production process errors may be discovered which could affect the content, and all legal disclaimers that apply to the journal pertain.
REFERENCES
- 1.Morris RGM (1989). Synaptic plasticity and learning: Selective impairment of learning in rats and blockade of long-term potentiation in vivo by the N-methyl-D-aspartate receptor antagonist AP5. J. Neurosci 9, 3040–3057. 10.1523/jneurosci.09-09-03040.1989. [DOI] [PMC free article] [PubMed] [Google Scholar]
- 2.Buzsáki G. (1989). Two-stage model of memory trace formation: A role for “noisy” brain states. Neuroscience 31, 551–570. [DOI] [PubMed] [Google Scholar]
- 3.Malenka RC, and Bear MF (2004). LTP and LTD: An embarrassment of riches. Neuron 44, 5–21. 10.1016/j.neuron.2004.09.012. [DOI] [PubMed] [Google Scholar]
- 4.Citri A, and Malenka RC (2008). Synaptic plasticity: Multiple forms, functions, and mechanisms. Neuropsychopharmacology 33, 18–41. 10.1038/sj.npp.1301559. [DOI] [PubMed] [Google Scholar]
- 5.Epsztein J, Brecht M, and Lee AK (2011). Intracellular determinants of hippocampal CA1 place and silent cell activity in a novel environment. Neuron 70, 109–120. 10.1016/j.neuron.2011.03.006. [DOI] [PMC free article] [PubMed] [Google Scholar]
- 6.Lee D, Lin B-J, and Lee AK (2012). Hippocampal place fields emerge upon single-cell manipulation of excitability during behavior. Science. 337, 849–853. [DOI] [PubMed] [Google Scholar]
- 7.Cohen JD, Bolstad M, and Lee AK (2017). Experience-dependent shaping of hippocampal CA1 intracellular activity in novel and familiar environments. Elife 6, 1–27. 10.7554/eLife.23040. [DOI] [PMC free article] [PubMed] [Google Scholar]
- 8.Bittner KC, Milstein AD, Grienberger C, Romani S, and Magee JC (2017). Behavioral time scale synaptic plasticity underlies CA1 place fields. Science. 357, 1–4. 10.1126/science.aan3846. [DOI] [PMC free article] [PubMed] [Google Scholar]
- 9.Castello-Waldow TP, Weston G, Ulivi AF, Chenani A, Loewenstein Y, Chen A, and Attardo A. (2020). Hippocampal neurons with stable excitatory connectivity become part of neuronal representations. PLoS Biol. 18, 1–23. 10.1371/journal.pbio.3000928. [DOI] [PMC free article] [PubMed] [Google Scholar]
- 10.Pettit NL, Yap E-L, Greenberg ME, and Harvey CD (2022). Fos ensembles encode and shape stable spatial maps in the hippocampus. Nature. 10.1038/s41586-022-05113-1. [DOI] [PMC free article] [PubMed] [Google Scholar]
- 11.Fosque BF, Sun Y, Dana H, Yang C, Ohyama T, Tadross MR, Patel R, Zlatic M, Kim DS, Ahrens MB, et al. (2015). Labeling of active neural circuits in vivo with designed calcium integrators. Science. 347, 755–760. [DOI] [PubMed] [Google Scholar]
- 12.Moeyaert B, Holt G, Madangopal R, Perez-Alvarez A, Fearey BC, Trojanowski NF, Ledderose J, Zolnik TA, Das A, Patel D, et al. (2018). Improved methods for marking active neuron populations. Nat. Commun 9, 1–12. 10.1038/s41467-018-06935-2. [DOI] [PMC free article] [PubMed] [Google Scholar]
- 13.Scoville WB, and Milner B. (1957). Loss of recent memory after bilateral hippocampal lesions. J. Neurol. Neurosurg. Psychiatry 20, 11–21. [DOI] [PMC free article] [PubMed] [Google Scholar]
- 14.Steele RJ, and Morris RGM (1999). Delay-dependent impairment of a matching-to-place task with chronic and intrahippocampal infusion of the NMDA-antagonist D-AP5. Hippocampus 9, 118–136. 10.1002/(SICI)1098-1063(1999)9:2<118::AID-HIPO4>3.0.CO;2-8. [DOI] [PubMed] [Google Scholar]
- 15.Eichenbaum H. (2017). The role of the hippocampus in navigation is memory. J. Neurophysiol 117, 1785–1796. 10.1152/jn.00005.2017. [DOI] [PMC free article] [PubMed] [Google Scholar]
- 16.O’Keefe J, and Nadel L. (1978). The Hippocampus as a Cognitive Map (Oxford University Press; ). [Google Scholar]
- 17.Moser M-B, Rowland DC, and Moser EI (2015). Place cells, grid cells, and memory. Cold Spring Harb. Perspect. Biol 7, 1–16. [DOI] [PMC free article] [PubMed] [Google Scholar]
- 18.McHugh TJ, Blum KI, Tsien JZ, Tonegawa S, and Wilson MA (1996). Impaired hippocampal representation of space in CA1-specific NMDAR1 knockout mice. Cell 87, 1339–1349. 10.1016/S0092-8674(00)81828-0. [DOI] [PubMed] [Google Scholar]
- 19.Kentros C, Hargreaves E, Hawkins RD, Kandel ER, Shapiro M, and Muller RV (1998). Abolition of long-term stability of new hippocampal place cell maps by NMDA receptor blockade. Science. 280, 2121–2126. 10.1126/science.280.5372.2121. [DOI] [PubMed] [Google Scholar]
- 20.Ekstrom AD, Meltzer J, McNaughton BL, and Barnes CA (2001). NMDA receptor antagonism blocks experience-dependent expansion of hippocampal “place fields.” Neuron 31, 631–638. [DOI] [PubMed] [Google Scholar]
- 21.Wilson MA, and McNaughton BL (1994). Reactivation of hippocampal ensemble memories during sleep. Science. 265, 676–679. [DOI] [PubMed] [Google Scholar]
- 22.Foster DJ, and Wilson MA (2006). Reverse replay of behavioural sequences in hippocampal place cells during the awake state. Nature 440, 680–683. 10.1038/nature04587. [DOI] [PubMed] [Google Scholar]
- 23.Pfeiffer BE, and Foster DJ (2013). Hippocampal place-cell sequences depict future paths to remembered goals. Nature 497, 74–79. 10.1038/nature12112. [DOI] [PMC free article] [PubMed] [Google Scholar]
- 24.Buzsáki G. (2015). Hippocampal sharp wave-ripple: A cognitive biomarker for episodic memory and planning. Hippocampus 25, 1073–1188. 10.1002/hipo.22488. [DOI] [PMC free article] [PubMed] [Google Scholar]
- 25.Carr MF, Jadhav SP, and Frank LM (2011). Hippocampal replay in the awake state: A potential physiological substrate of memory consolidation and retrieval. Nat. Neurosci 14, 147–153. 10.1038/nn.2732.Hippocampal. [DOI] [PMC free article] [PubMed] [Google Scholar]
- 26.Dragoi G, and Tonegawa S. (2011). Preplay of future place cell sequences by hippocampal cellular assemblies. Nature 469, 397–401. 10.1038/nature09633. [DOI] [PMC free article] [PubMed] [Google Scholar]
- 27.Liu K, Sibille J, and Dragoi G. (2019). Preconfigured patterns are the primary driver of offline multi-neuronal sequence replay. Hippocampus 29, 275–283. 10.1002/hipo.23034. [DOI] [PMC free article] [PubMed] [Google Scholar]
- 28.Grosmark AD, and Buzsáki G. (2016). Diversity in neural firing dynamics supports both rigid and learned hippocampal sequences. Science. 351, 1440–1443. 10.1126/science.aad1935. [DOI] [PMC free article] [PubMed] [Google Scholar]
- 29.Huszár R, Zhang Y, Blockus H, and Buzsáki G. (2022). Preconfigured dynamics in the hippocampus are guided by embryonic birthdate and rate of neurogenesis. Nat. Neurosci 25, 1201–1212. 10.1038/s41593-022-01138-x. [DOI] [PMC free article] [PubMed] [Google Scholar]
- 30.Dupret D, O’Neill J, Pleydell-Bouverie B, and Csicsvari J. (2010). The reorganization and reactivation of hippocampal maps predict spatial memory performance. Nat. Neurosci 13, 995–1002. 10.1038/nn.2599. [DOI] [PMC free article] [PubMed] [Google Scholar]
- 31.Silva D, Feng T, and Foster DJ (2015). Trajectory events across hippocampal place cells require previous experience. Nat. Neurosci 18, 1772–1779. 10.1038/nn.4151. [DOI] [PMC free article] [PubMed] [Google Scholar]
- 32.Dragoi G, and Tonegawa S. (2013). Development of schemas revealed by prior experience and NMDA receptor knock-out. Elife 2, 1–24. 10.7554/eLife.01326.001. [DOI] [PMC free article] [PubMed] [Google Scholar]
- 33.Bayer SA (1980). Development of the hippocampal region in the rat I. Neurogenesis examined with 3H-thymidine autoradiography. J. Comp. Neurol 190, 87–114. 10.1002/cne.901900107. [DOI] [PubMed] [Google Scholar]
- 34.Cembrowski MS, Bachman JL, Wang L, Sugino K, Shields BC, and Spruston N. (2016). Spatial gene-expression gradients underlie prominent heterogeneity of CA1 pyramidal neurons. Neuron 89, 1–18. 10.1016/j.neuron.2015.12.013. [DOI] [PubMed] [Google Scholar]
- 35.Maroso M, Szabo GG, Kim HK, Alexander A, Bui AD, Lee SH, Lutz B, and Soltesz I. (2016). Cannabinoid control of learning and memory through HCN channels. Neuron 89, 1059–1073. 10.1016/j.neuron.2016.01.023. [DOI] [PMC free article] [PubMed] [Google Scholar]
- 36.Mizuseki K, Diba K, Pastalkova E, and Buzsáki G. (2011). Hippocampal CA1 pyramidal cells form functionally distinct sublayers. Nat. Neurosci 14, 1174–1181. 10.1038/nn.2894. [DOI] [PMC free article] [PubMed] [Google Scholar]
- 37.Masurkar AV, Srinivas KV, Brann DH, Warren R, Lowes DC, and Siegelbaum SA (2017). Medial and lateral entorhinal cortex differentially excite deep versus superficial CA1 pyramidal neurons. Cell Rep. 18, 148–160. 10.1016/j.celrep.2016.12.012. [DOI] [PMC free article] [PubMed] [Google Scholar]
- 38.Harvey RE, Robinson HL, Liu C, Oliva A, and Fernandez-Ruiz A. (2023). Hippocampo-cortical circuits for selective memory encoding, routing, and replay. Neuron 111, 1–15. 10.1016/j.neuron.2023.04.015. [DOI] [PMC free article] [PubMed] [Google Scholar]
- 39.Soltesz I, and Losonczy A. (2018). CA1 pyramidal cell diversity enabling parallel information processing in the hippocampus. Nat. Neurosci 21, 484–493. 10.1038/s41593-018-0118-0. [DOI] [PMC free article] [PubMed] [Google Scholar]
- 40.Valero M, Cid E, Averkin RG, Aguilar J, Sanchez-Aguilera A, Viney TJ, Gomez-Dominguez D, Bellistri E, and de la Prida LM (2015). Determinants of different deep and superficial CA1 pyramidal cell dynamics during sharp-wave ripples. Nat. Neurosci 18, 1281–1290. 10.1038/nn.4074. [DOI] [PMC free article] [PubMed] [Google Scholar]
- 41.Kohara K, Pignatelli M, Rivest AJ, Jung HY, Kitamura T, Suh J, Frank D, Kajikawa K, Mise N, Obata Y, et al. (2014). Cell type-specific genetic and optogenetic tools reveal hippocampal CA2 circuits. Nat. Neurosci 17, 269–279. 10.1038/nn.3614. [DOI] [PMC free article] [PubMed] [Google Scholar]
- 42.Lee SH, Marchionni I, Bezaire M, Varga C, Danielson N, Lovett-Barron M, Losonczy A, and Soltesz I. (2014). Parvalbumin-positive basket cells differentiate among hippocampal pyramidal cells. Neuron 82, 1129–1144. 10.1016/j.neuron.2014.03.034. [DOI] [PMC free article] [PubMed] [Google Scholar]
- 43.Danielson NB, Zaremba JD, Kaifosh P, Bowler J, Ladow M, and Losonczy A. (2016). Sublayer-specific coding dynamics during spatial navigation and learning in hippocampal area CA1. Neuron 91, 652–665. 10.1016/j.neuron.2016.06.020. [DOI] [PMC free article] [PubMed] [Google Scholar]
- 44.Oliva A, Fernandez-Ruiz A, Buzsaki G, and Bernyi A. (2016). Spatial coding and physiological properties of hippocampal neurons in the Cornu Ammonis subregions. Hippocampus 26, 1593–1607. 10.1002/hipo.22659. [DOI] [PubMed] [Google Scholar]
- 45.Geiller T, Fattahi M, Choi JS, and Royer S. (2017). Place cells are more strongly tied to landmarks in deep than in superficial CA1. Nat. Commun 8, 1–11. 10.1038/ncomms14531. [DOI] [PMC free article] [PubMed] [Google Scholar]
- 46.Fattahi M, Sharif F, Geiller T, and Royer S. (2018). Differential representation of landmark and self-motion information along the CA1 radial axis: Self-motion generated place fields shift toward landmarks during septal inactivation. J. Neurosci 38, 6766–6778. 10.1523/JNEUROSCI.3211-17.2018. [DOI] [PMC free article] [PubMed] [Google Scholar]
- 47.Sharif F, Tayebi B, Buzsáki G, Royer S, and Fernandez-Ruiz A. (2021). Subcircuits of deep and superficial CA1 place cells support efficient spatial coding across heterogeneous environments. Neuron 109, 363–376.e6. 10.1016/j.neuron.2020.10.034. [DOI] [PMC free article] [PubMed] [Google Scholar]
- 48.Wang M, Foster DJ, and Pfeiffer BE (2020). Alternating sequences of future and past behavior encoded within hippocampal theta oscillations. Science. 370, 247–250. 10.1126/science.abb4151. [DOI] [PMC free article] [PubMed] [Google Scholar]
- 49.Ziv Y, Burns LD, Cocker ED, Hamel EO, Ghosh KK, Kitch LJ, Gamal A. El, Schnitzer MJ, El Gamal A, and Schnitzer MJ (2013). Long-term dynamics of CA1 hippocampal place codes. Nat. Neurosci 16, 264–266. 10.1038/nn.3329. [DOI] [PMC free article] [PubMed] [Google Scholar]
- 50.Thompson LT, and Best PJ (1989). Place cells and silent cells in the hippocampus of freelybehaving rats. J. Neurosci 9, 2382–2390. [DOI] [PMC free article] [PubMed] [Google Scholar]
- 51.Mizuseki K, and Buzsáki G. (2013). Preconfigured, skewed distribution of firing rates in the hippocampus and entorhinal cortex. Cell Rep. 4, 1010–1021. 10.1016/j.celrep.2013.07.039. [DOI] [PMC free article] [PubMed] [Google Scholar]
- 52.Isaac JTR, Buchanan KA, Muller RU, and Mellor JR (2009). Hippocampal place cell firing patterns can induce long-term synaptic plasticity in vitro. J. Neurosci 29, 6840–6850. 10.1523/JNEUROSCI.0731-09.2009. [DOI] [PMC free article] [PubMed] [Google Scholar]
- 53.Dudar JD, Whishaw IQ, and Szerb JC (1979). Release of acetylcholine from the hippocampus of freely moving rats during sensory stimulation and running. Neuropharmacology 18, 673–678. 10.1016/0028-3908(79)90034-0. [DOI] [PubMed] [Google Scholar]
- 54.Nakashiba T, Buhl DL, McHugh TJ, and Tonegawa S. (2009). Hippocampal CA3 output is crucial for ripple-associated reactivation and consolidation of memory. Neuron 62, 781–787. 10.1016/j.neuron.2009.05.013. [DOI] [PMC free article] [PubMed] [Google Scholar]
- 55.Davoudi H, and Foster DJ (2019). Acute silencing of hippocampal CA3 reveals a dominant role in place field responses. Nat. Neurosci 22, 337–342. 10.1038/s41593-018-0321-z. [DOI] [PMC free article] [PubMed] [Google Scholar]
- 56.Valero M, Averkin RG, Fernandez-Lamo I, Aguilar J, Lopez-Pigozzi D, Brotons-Mas JR, Cid E, Tamas G, and Menendez de la Prida L. (2017). Mechanisms for selective single-cell reactivation during offline sharp-wave ripples and their distortion by fast ripples. Neuron 94, 1234–1247. 10.1016/j.neuron.2017.05.032. [DOI] [PubMed] [Google Scholar]
- 57.King C, Henze DA, Leinekugel X, and Buzsáki G. (1999). Hebbian modification of a hippocampal population pattern in the rat. J. Physiol 521, 159–167. 10.1111/j.14697793.1999.00159.x. [DOI] [PMC free article] [PubMed] [Google Scholar]
- 58.Ylinen A, Bragin A, Nádasdy Z, Jandó G, Szabó I, Sik A, and Buzsáki G. (1995). Sharp wave-associated high-frequency oscillation (200 Hz) in the intact hippocampus: Network and intracellular mechanisms. J. Neurosci 15, 30–46. [DOI] [PMC free article] [PubMed] [Google Scholar]
- 59.Csicsvari J, Jamieson B, Wise KD, and Buzsáki G. (2003). Mechanisms of gamma oscillations in the hippocampus of the behaving rat. Neuron 37, 311–322. 10.1016/S0896-6273(02)01169-8. [DOI] [PubMed] [Google Scholar]
- 60.Stark E, Roux L, Eichler R, Senzai Y, Royer S, and Buzsáki G. (2014). Pyramidal cell-interneuron interactions underlie hippocampal ripple oscillations. Neuron 83, 467–480. 10.1016/j.neuron.2014.06.023. [DOI] [PMC free article] [PubMed] [Google Scholar]
- 61.Buzsáki G, and Mizuseki K. (2014). The log-dynamic brain: How skewed distributions affect network operations. Nat. Rev. Neurosci 15, 264–278. 10.1038/nrn3687. [DOI] [PMC free article] [PubMed] [Google Scholar]
- 62.Denovellis EL, Gillespie AK, Coulter ME, Sosa M, Chung JE, Eden UT, and Frank LM (2021). Hippocampal replay of experience at real-world speeds. Elife 10, 1–33. 10.7554/eLife.64505. [DOI] [PMC free article] [PubMed] [Google Scholar]
- 63.Pfeiffer BE (2020). The content of hippocampal “replay.” Hippocampus 30, 6–18. 10.1002/hipo.22824. [DOI] [PMC free article] [PubMed] [Google Scholar]
- 64.Pavlides C, and Winson J. (1989). Influences of hippocampal place cell firing in the awake state on the activity of these cells during subsequent sleep episodes. J. Neurosci 9, 2907–2918. [DOI] [PMC free article] [PubMed] [Google Scholar]
- 65.Girardeau G, Cei A, and Zugaro M. (2014). Learning-induced plasticity regulates hippocampal sharp wave-ripple drive. J. Neurosci 34, 5176–5183. 10.1523/JNEUROSCI.4288-13.2014. [DOI] [PMC free article] [PubMed] [Google Scholar]
- 66.Pfeiffer BE (2022). Spatial learning drives rapid goal representation in hippocampal ripples without place field accumulation or goal-oriented theta sequences. J. Neurosci 42, 3975–3988. 10.1523/JNEUROSCI.2479-21.2022. [DOI] [PMC free article] [PubMed] [Google Scholar]
- 67.Szabo GG, Farrell JS, Dudok B, Hou WH, Ortiz AL, Varga C, Moolchand P, Gulsever CI, Gschwind T, Dimidschstein J, et al. (2022). Ripple-selective GABAergic projection cells in the hippocampus. Neuron 110, 1959–1977.e9. 10.1016/j.neuron.2022.04.002. [DOI] [PMC free article] [PubMed] [Google Scholar]
- 68.Dragoi G, and Tonegawa S. (2013). Distinct preplay of multiple novel spatial experiences in the rat. Proc. Natl. Acad. Sci 110, 9100–9105. 10.1073/pnas.1306031110. [DOI] [PMC free article] [PubMed] [Google Scholar]
- 69.Whitlock JR, Heynen AJ, Shuler MG, and Bear MF (2006). Learning induces long-term potentiation in the hippocampus. Science. 313, 1093–1098. [DOI] [PubMed] [Google Scholar]
- 70.O’Neill J, Senior TJ, Allen K, Huxter JR, and Csicsvari J. (2008). Reactivation of experience-dependent cell assembly patterns in the hippocampus. Nat. Neurosci 11, 209–215. 10.1038/nn2037. [DOI] [PubMed] [Google Scholar]
- 71.Drieu C, Todorova R, and Zugaro M. (2018). Nested sequences of hippocampal assemblies during behavior support subsequent sleep replay. Science. 362, 675–679. 10.1126/science.aat2952. [DOI] [PubMed] [Google Scholar]
- 72.Sasaki T, Piatti VC, Hwaun E, Ahmadi S, Lisman JE, Leutgeb S, and Leutgeb JK (2018). Dentate network activity is necessary for spatial working memory by supporting CA3 sharp-wave ripple generation and prospective firing of CA3 neurons. Nat. Neurosci 21, 258–269. 10.1038/s41593-017-0061-5. [DOI] [PMC free article] [PubMed] [Google Scholar]
- 73.Oliva A, Fernandez-Ruiz A, Buzsáki G, and Berenyi A. (2016). Role of hippocampal CA2 region in triggering sharp-wave ripples. Neuron 91, 1342–1355. 10.1016/j.neuron.2016.08.008. [DOI] [PMC free article] [PubMed] [Google Scholar]
- 74.Graves AR, Moore SJ, Bloss EB, Mensh BD, Kath WL, and Spruston N. (2012). Hippocampal pyramidal neurons comprise two distinct cell types that are countermodulated by metabotropic receptors. Neuron 76, 776–789. 10.1016/j.neuron.2012.09.036. [DOI] [PMC free article] [PubMed] [Google Scholar]
- 75.Volk LJ, Pfeiffer BE, Gibson JR, and Huber KM (2007). Multiple Gq-coupled receptors converge on a common protein synthesis-dependent long-term depression that is affected in fragile X syndrome mental retardation. J. Neurosci 27, 11624–11634. 10.1523/JNEUROSCI.2266-07.2007. [DOI] [PMC free article] [PubMed] [Google Scholar]
- 76.He K, Huertas M, Hong SZ, Tie XX, Hell JW, Shouval H, and Kirkwood A. (2015). Distinct eligibility traces for LTP and LTD in cortical synapses. Neuron 88, 528–538. 10.1016/j.neuron.2015.09.037. [DOI] [PMC free article] [PubMed] [Google Scholar]
- 77.Arrigoni E, and Greene RW (2004). Schaffer collateral and perforant path inputs activate different subtypes of NMDA receptors on the same CA1 pyramidal cell. Br. J. Pharmacol 142, 317–322. 10.1038/sj.bjp.0705744. [DOI] [PMC free article] [PubMed] [Google Scholar]
- 78.Duszkiewicz AJ, McNamara CG, Takeuchi T, and Genzel L. (2019). Novelty and dopaminergic modulation of memory persistence: A tale of two systems. Trends Neurosci. 42, 102–114. 10.1016/j.tins.2018.10.002. [DOI] [PMC free article] [PubMed] [Google Scholar]
- 79.Seol GH, Ziburkus J, Huang S, Song L, Kim IT, Takamiya K, Huganir RL, Lee H-K, and Kirkwood A. (2007). Neuromodulators control the polarity of spike-timing-dependent synaptic plasticity. Neuron 55, 919–929. 10.1016/j.neuron.2007.08.013. [DOI] [PMC free article] [PubMed] [Google Scholar]
- 80.Pfeiffer BE, and Foster DJ (2015). Auto-associative dynamics in the generation of sequences of hippocampal place cells. Science. 349, 180–183. [DOI] [PubMed] [Google Scholar]
- 81.Royer S, Zemelman BV, Losonczy A, Kim J, Chance F, Magee JC, and Buzsáki G. (2012). Control of timing, rate and bursts of hippocampal place cells by dendritic and somatic inhibition. Nat. Neurosci 15, 769–775. 10.1038/nn.3077. [DOI] [PMC free article] [PubMed] [Google Scholar]
Associated Data
This section collects any data citations, data availability statements, or supplementary materials included in this article.
Supplementary Materials
Data Availability Statement
Raw data used in this study are available upon request. All original code used for analyses in this study are publicly available at https://github.com/Brad-E-Pfeiffer/DeepSuperficialSWRs.