Abstract
Background
In network biology researchers generate biomolecular networks with candidate genes or proteins experimentally-derived from high-throughput data and known biomolecular associations. Current bioinformatics research focuses on characterizing candidate genes/proteins, or nodes, with network characteristics, e.g., betweenness centrality. However, there have been few research reports to characterize and prioritize biomolecular associations (“edges”), which can represent gene regulatory events essential to biological processes.
Method
We developed Weighted In-Path Edge Ranking (WIPER), a new computational algorithm which can help evaluate all biomolecular interactions/associations (“edges”) in a network model and generate a rank order of every edge based on their in-path traversal scores and statistical significance test result. To validate whether WIPER worked as we designed, we tested the algorithm on synthetic network models.
Results
Our results showed WIPER can reliably discover both critical “well traversed in-path edges”, which are statistically more traversed than normal edges, and “peripheral in-path edges”, which are less traversed than normal edges. Compared with other simple measures such as betweenness centrality, WIPER provides better biological interpretations. In the case study of analyzing postanal pig hearts gene expression, WIPER highlighted new signaling pathways suggestive of cardiomyocyte regeneration and proliferation. In the case study of Alzheimer’s disease genetic disorder association, WIPER reports SRC:APP, AR:APP, APP:FYN, and APP:NES edges (gene-gene associations) both statistically and biologically important from PubMed co-citation.
Conclusion
We believe that WIPER will become an essential software tool to help biologists discover and validate essential signaling/regulatory events from high-throughput biology data in the context of biological networks.
Availability
The free WIPER API is described at discovery.informatics.uab.edu/wiper/
Author summary
In network analysis, the node centrality algorithms are widely used in node prioritization such as PageRank algorithm, HITS algorithm, K-kernel algorithm, etc. Although numeric successful stories were reported in discovering disease-specific markers assisted by node centrality algorithms, the limited topological features of edges in network analysis hinder the development of diagnostic and therapeutic techniques to target the interactions. We present WIPER (Weighted In-Path Edge Ranking) statistically and biologically significant biomolecular associations in biomolecular association networks derived from high-throughput biology studies. WIPER can also suggest the novel edges that may not have been well covered by previously conducted experiments.
INTRODUCTION
In network biology, characterizing biologically significant associations between different biomolecular entities, e.g., gene-gene associations or protein-protein interactions, has been an essential yet less well-researched topic than that of characterizing biological entities [1] such as genes or proteins. Intuitively, all understanding of biological mechanisms of action and gene or protein function will be improved with the characterization of a biomolecule’s associated partner genes/proteins [2]. There is no lack of biological problems which require the identification of significant biomolecular associations, including characterizing specific functional context of genes, proteins, or RNAs in relationship to each other [3,4], correlating structure of complex biomolecular systems to corresponding phenotypic functions [5,6], understanding how a system changes over time as network structures and dynamics change [7,8], identifying biological network control mechanisms [9], and developing diagnostic or therapeutic techniques to target biomolecules or biomolecular interactions of high interest [10,11]. Particularly in drug discovery, there is reported success in blocking RAS-ERK with DEL-22379 [12] in proliferating tumor cells, targeting AKT–BAD interactions [13], or blocking MDM2–p53 and/or CDK4–pRB [14] interactions to suppress tumor growth. However, current software tools developed towards finding network topological features typically focus on finding “node centrality” — suitable for ranking genes instead of gene-gene association relationships. There are limited choices for characterizing network topological features of edges, which include finding “betweenness centrality” of edges [15,16], calculating edge clustering coefficient [17], or aggregating edge weights from multiple data sources, e.g., gene ontology and gene co-expression [12,18]. Novel subunit knock-out transgenic techniques [19] have made it feasible to validate functional interactions in vitro without disturbing the interacting genes.
Most currently available software tools for edge prioritization involve direct application or minor extensions from classical network topology-based characterization techniques, such as edge betweenness centrality [15, 16], and edge clustering coefficient [17]. For these tools to accurately characterize biological networks, they must deal with challenges such as inherently noisy network data, missing edges or misconnected edges [20], e.g., while pragmatic computational approaches such as link prediction [21–25], can tackle network data noise, they do not provide insights on the relative significance of existing edges, or estimate to what extent new links can be safely discovered based on existing network information [15–18]. Due to the lack of clear statistical model guidance, ranking biological edges reliably remains an open research topic today.
In this work, we report the development of WIPER (Weighted In-Path Edge Ranking), a new computational algorithm to help researchers prioritize both statistically and biologically significant biomolecular associations in biomolecular association networks derived from high-throughput biology studies. We developed WIPER with the following practical characteristics:
-
1
WIPER can take the input of weighted edges and rank them in a probabilistic network.
In contrast, a conventional “edge betweenness” measurement that simply counts the number of shortest paths for any given edge would not be useful in practice. This makes WIPER a more pragmatic tool to solve biomedical problems such as finding a therapeutic strategy by “targeting the right interactions in the interactome” [11].
-
2
WIPER is compatible with network-based “node ranking” techniques and comes with a statistical model for significance filtering of results.
We achieve this by performing a three-step process which includes transforming the edge ranking problem to a node ranking problem and evaluating the statistical significance of scored edges using a statistical model using a best-fit probability distribution. The built-in statistical model enables WIPER users to quickly focus on top-ranked edges for subsequent biological interpretations [15–17].
-
3
WIPER can predict novel edges in the network.
The newly discovered interactions may represent novel biological mechanisms subject to hypothesis development.
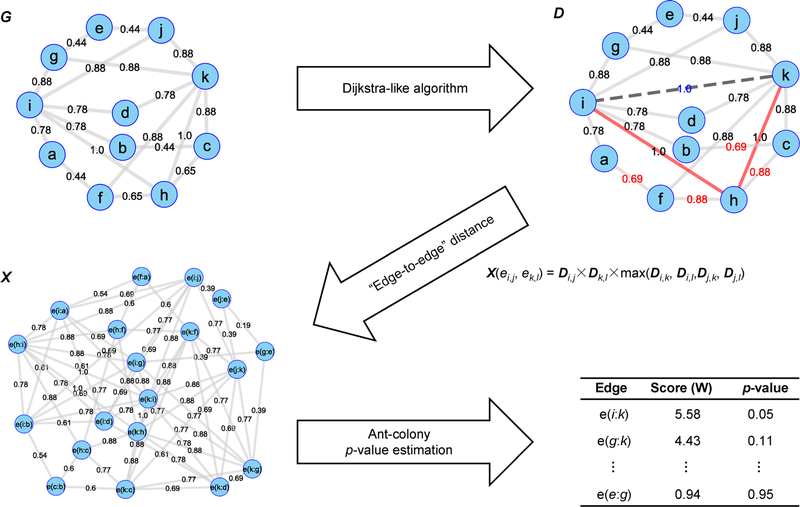
In the remainder of this article, we will describe how WIPER works (Figure 1), what parameters may affect WIPER performance, WIPER edge scores, and their statistical and biological significance. We will apply WIPER to two real-world biomedical case studies to show its potential applications in future network biology research.
Figure 1. The WIPER algorithm—an illustration of how it works.
Here, we use graph visualization to represent the content of each matrix. In the D-matrix, the red number representing edges whose optimal path (with the maximum length of 2) value is different from the original edge weight, and the edge e(i,k), with path value = 1, is considered the novel edge. We also highlight two edges e(i,h) and e(h,k), which are the major reasons for the highlights. The edge scores in red are the updated edge weights using Dijkstra-like algorithm.
RESULTS
The WIPER rank in simple synthetic models illustrate the edge topological importance
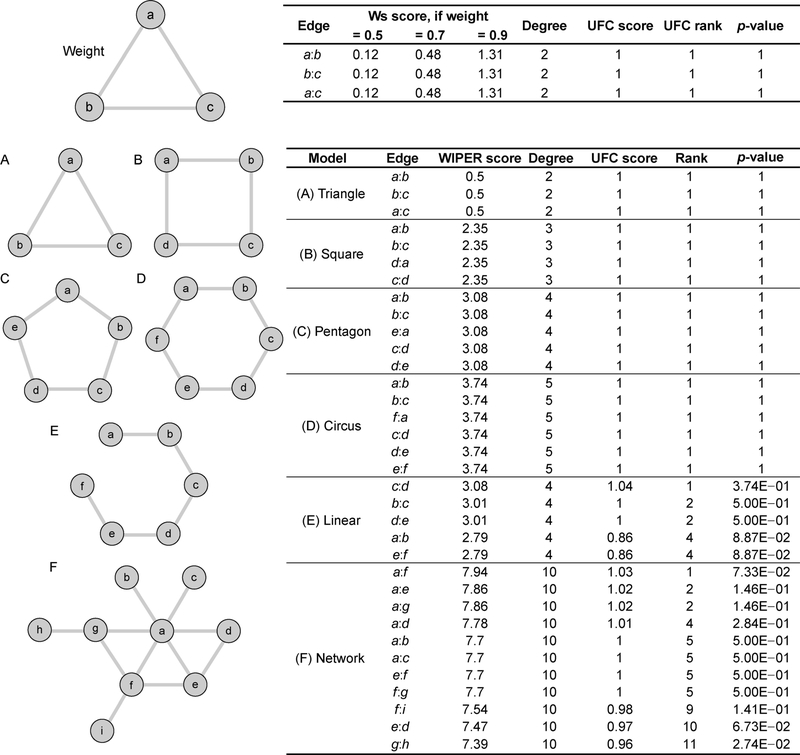
In the synthetic models of the triangle, square, pentagon, hexagon, linear and a small scale-free network, WIPER provides the edge ranks according to the traversal paths. In close graphs (triangle, square, pentagon and hexagon models in Figure 2), WIPER equally weights the edges. In open graphs (the linear model in Figure 2), WIPER put the symmetric center edge to the first, and decrease the ranking of the edge towards each terminal of the symmetric graphs. In the small scale-free network, WIPER retrieves the highest-ranked edge highly traversed in the paths of the fully connected edge-to-edge (network in Figure 2). The peripheral edge would be ranked to the lowest due to the edge are less traversed than normal edges.
Figure 2. The synthetic models’ networks and the list of WIPER scores in each synthetic model.
In the triangle model (A), the square model (B), the pentagon model (C)and the hexagon model (D), all edges are equally weighted using the WIPER scores. In the linear model (E) and the network model, WIPER ranks the edges according to the contribution of the full connected edges through the traversal paths.
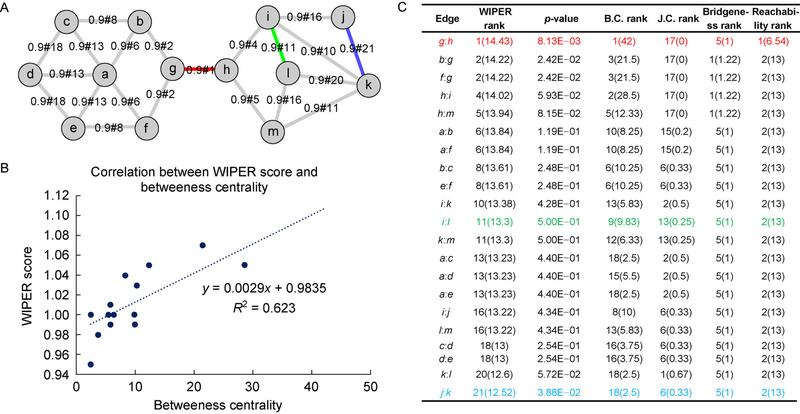
Synthetic network shows a moderate correlation between WIPER and edge betweenness centrality and WIPER outperforms the four edge indexes
In this synthetic network case study, WIPER discovers topological important edges with statistical significance different from the betweenness centrality (B.C.) ranked edges. The linear regression of the WIPER score and B.C. shows a moderate positive correlation with R-square equal to 0.623 (Figure 3B). The WIPER score distribution of the synthetic network follows the normal distribution in the scenario described in Section “Infer novel edges of Method”, both top-tier edges and bottom-tier edges are statistically evaluated (Figure 3C). We compared the WIPER and B.C. ranked edges in three ranking tiers, top-tier (top 25%), mid-tier (mid 50%) and bottom tiers (bottom 25%). In the WIPER top-tier edges, WIPER ranks the “bridge edge” g:h (marked red in Figure 2A,C) the first with p-value = 0.008. Although both WIPER and B.C. reports the same edges in the top-tier, the orders are different. WIPER ranks both b:g (2nd in WIPER) and f:g (2nd in WIPER) edges higher than h:i (4th in WIPER) and h:m (5th in WIPER) due to a larger number of edges (11 edges) in the left subnetwork than the number of edges (9 edges) in the right subnetwork. Therefore, the edges b:g and f:g in left subnetwork are ranked higher since more accumulatively traversal paths weights in the left subnetwork than the right subnetwork. B.C. ranks the edge h:i (2nd in B.C.) higher than the other edges simply because of the higher counts of shortest paths passing by. In other words, the edge contains a higher number of degrees of the two endpoints. In the mid-tier edges e.g., edge i:l (marked green), WIPER reports non-significance due to the many local interchangeable traversal paths. In other words, the edges traversed paths are normal as the baseline. WIPER reports the edges a:b and a:f (tied 6th in WIPER) better than edge b:c and e:f (tied 8th in WIPER) because the edges linking to the hub node a tend to receive a higher traversal path weight from other nodes. In the bottom-tier edges e.g., edge j:k, WIPER reports high significance indicating that the impact of removing the peripheral edges will probably isolate a node in the network. Due to the ranking’s difference existing in such small synthetic network between WIPER and B.C., we expect that WIPER will outperform B.C. cascade in the real-world complex network models. Additionally, Jaccard coefficient of edges, Bridgeness index of edges and reachability index of edges are inferior to WIPER and B. C. Both Jaccard coefficient of edges and Bridgeness index of edges are not well-performed in finding the critical edges due to the local manner ranking. (Jaccard coefficient measures the shared neighborhoods and Bridgeness index of edges is built on the cliques finding). The reachability index of edges is not as sensitive as other indexes of edges when dealing with undirected graphs.
Figure 3. A synthetic network case-study shows moderated correlation between WIPER and edge betweenness centrality.
Color edges are the highest-ranked ones from WIPER. (A) The network layout. (B) Correlation between WIPER and edge betweenness centrality. (C) Comparisons between WIPER and four other indexes of edges.
The parameters effect on the WIPER ranking illustrated in the synthetic network
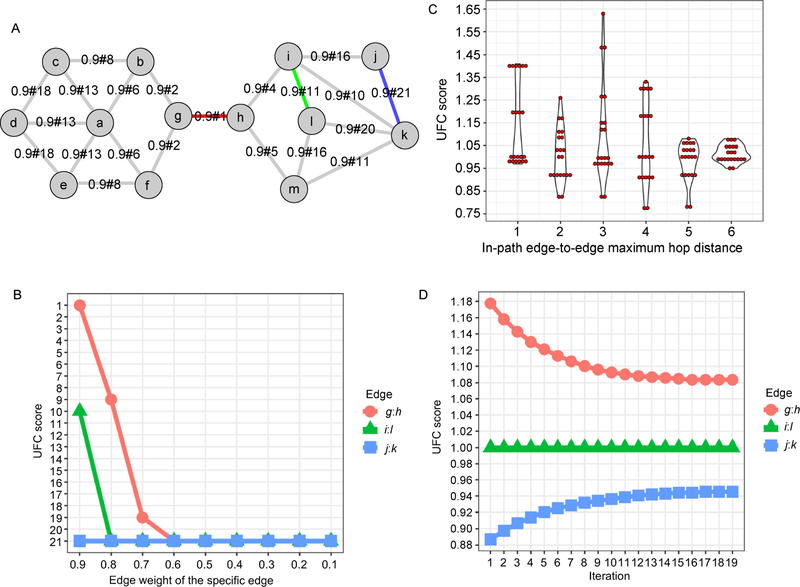
We illustrate the parameters influence the WIPER ranking using the synthetic network in Figure 4. First, we intend to detect addition dimension of heterogeneity (the original input weight) influence on the UFC score and to what extent. We remain all the original input weight of the edge on 0.9, and solely independently decrease the original input weight of the specific edges, g:h edge (ranked the first in the original ranking list), i:l edge (ranked the eleventh in the original ranking list), and j:k edge (ranked the last in the original ranking list) in Figure 4B. Once a decrease of g:h original weight from 0.9 to 0.8 can tremendously lower the g:h WIPER rank from the first position to the 9th position. And the same original weight decrease of a WIPER ranked mid-tier edge i:l will lower the edge ranking to the bottom. Hence, the original weight of the edge can influence the edge ranks other than the network topology. The cutoff of in-path edge-to-edge maximum hop distance in traversal paths can yield a different range of the UFC score in Figure 4C. When the maximum hop distance is set equals to half of the network longest hopping distance, the UFC score range reaches the highest value. The increased iteration of ant colony smooths the UFC score range until to a balanced state that UFC score ceases changing regardless of the increasing iteration in Figure 4D.
Figure 4. A synthetic network case-study shows the parameter effect on the WIPER rank.
Color edges are the highest-ranked ones from WIPER. (A) The network layout. (B) The UFC rank changes according to the solely independently decreasing the original edge weight of the specific edge (g:h, i:l and j:k edges). (C) The violin plot of the UFC score distribution influenced by the in-path edge-to-edge maximum hop distance cutoff. (D)The UFC score range is influenced by the iteration of the “ant-colony” algorithm.
Time complexity estimatimi using the Barabási-Albert models
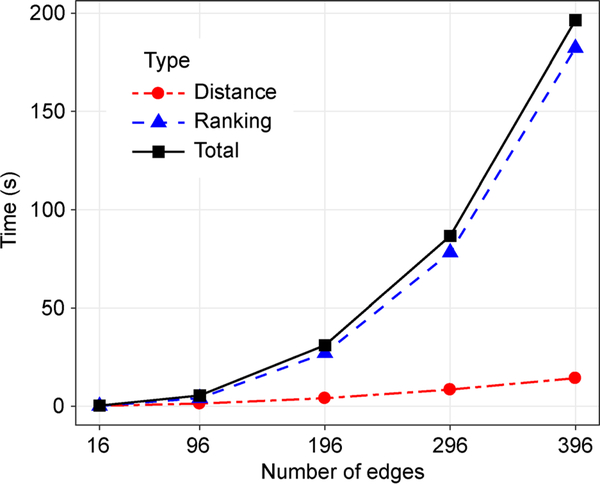
Using the Barabási–Albert models, we find that the increasing time of distance calculation is slow compared to the ranking calculation due to the parallel processing of the distance calculation shown in Figure 5. In the fitted model of the ranking algorithm, the adjusted R-square of the fitted second-degree polynomial is 0.98.
Figure 5. Time complexity evaluation using the Barabási–Albert model.
The x-axis is the input network’s number of edges. The y-axis is the time consumption using the unit of second.
The WIPER top-ranked edges remain in the robustness test
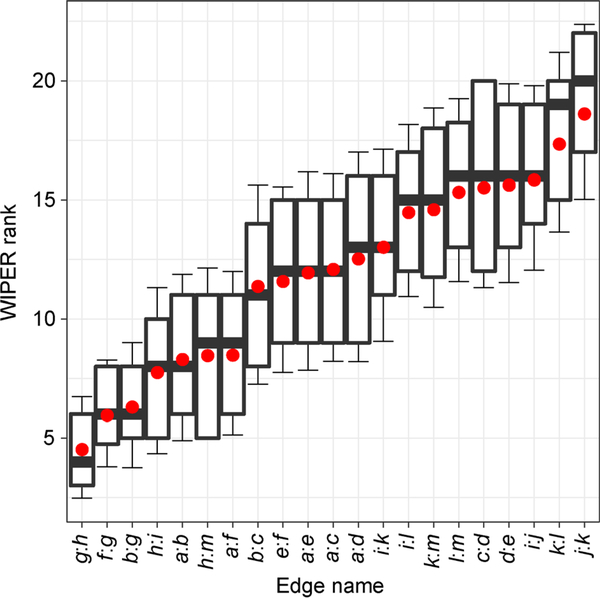
In the re-rank of the chosen edge under the other edges’ initial weight randomization for 100 times, we can evaluate the chosen edge’s WIPER ranking robustness. Since the chosen edge initial weight is equal to the mean of the other edges’ initial weights, the chosen edge initial weight ranking is in the middle. WIPER helps to reveal the topological importance of the chosen edge by boosting the chosen edge’s WIPER ranking in Figure 6. The previously top WIPER ranked edge g:h remains in the first place in the robustness re-rank test with the mean of ranking = 4.
Figure 6. The re-rank of the edge under the initial weight randomization for 100 times.
The x-axis is the assigned edge with remained initial weight as 0.7. The y-axis is the WIPER rank. The box plot middle line is the medium, the upper line is 75%, the bottom line is 25%. The bar is the standard deviation. The red spot is the mean.
WIPER suggests novel signaling paths potential significant for cardiomyocyte regeneration and proliferation
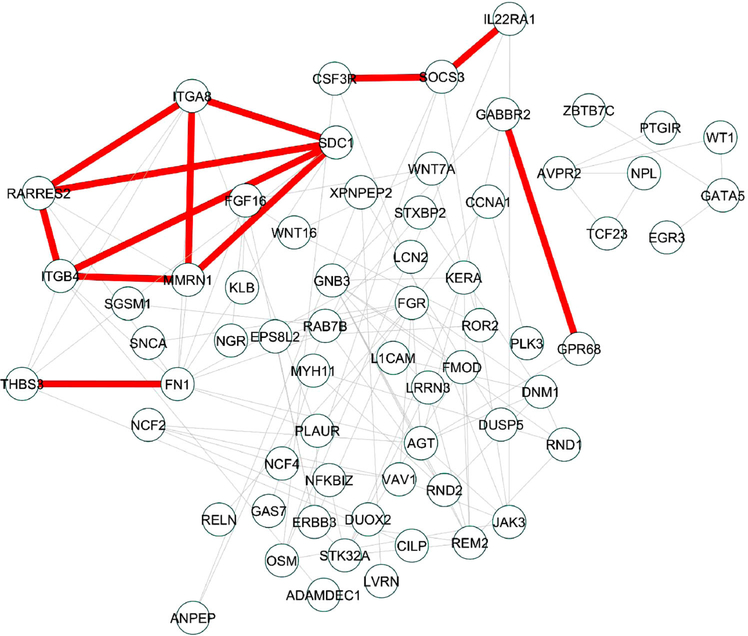
In Figure 7, we show the result by applying WIPER to an experimental dataset of differentially expressed genes generated from the cardiac transcriptome profiles of age-matched (28 days old) postnatal pigs which underwent myocardial infarction at postnatal day 1 and 14 [26].
Figure 7.
WIPER can help discover novel paths (highlighted in red) among genes differentially expressed among postanal pig hearts. The nodes represent the differentially expressed genes (DEGs) generated from the cardiac transcriptome profiles of age-matched (28 days old) postnatal pigs which underwent myocardial infarction at postnatal day 1 and 14. The edges represent the protein-protein interactions of the DEGs using STRING database with quality no less than 0.75.
Using WIPER, we identified the network of syndecan-1 (SDC1) as an important regulator of regenerative capability. Syndecan-1 is one of the main components of the glycocalyx, a glycoprotein that covers the lumenal surface of endothelial cells. Levels of SDC1 serves as a clinical marker for heart failure, highlighting the significance of vascular integrity in maintaining the extra-cellular matrix microenvironment following cardiac injury [27]. Looking at the edges directly connecting to SDC1, we see direct connections to the genes ITGA8 and MMRN1, encoding for integrin subunit alpha 8 and multimerin-1, respectively. Both proteins play critical roles in vascular cell membranes [28]. RARRES2, encoding for the secreted chemokine chemerin (also known as retinoic acid responder protein 2), also shows a direct edge to SDC1 as well as ITGA8 and MMRN1. Taken together, WIPER is able to accurately form relationships and highlight the importance of membrane signaling in the maintenance of microenvironment integrity at the vascular-ECM interface, following myocardial infarction. Further refinement of WIPER and analysis of more timepoints will be required to identify the critical factors which allow for cardiac regeneration.
Alzheimer disease WIPER ranked edge validation using co-citations in PMED
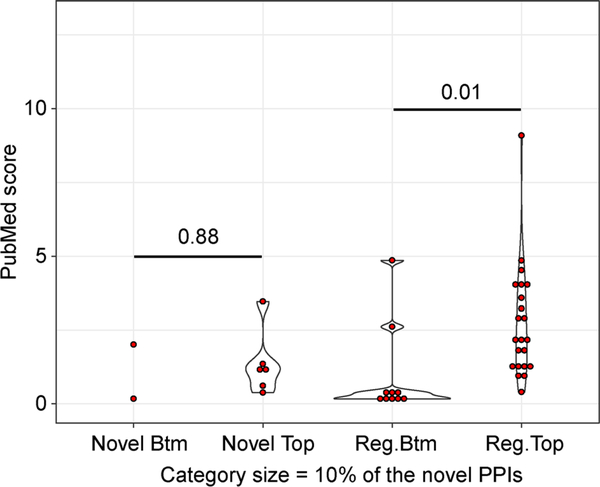
In Alzheimer disease genetics candidate networks, WIPER highlights the valuable novel PPIs partially reported in indirectly regulatory mechanisms. WIPER reports 337 regular PPIs and 62 novel PPIs with p-value ⩽0.05. In the PubMed co-citation enrichment analysis, 22 out of 73 regular top-ranked regular PPIs are over-representative which is one time larger than the amount of 10 bottom-ranked regular PPIs. 6 out of 73 regular top-ranked novel PPIs are over-representative which is two times larger than the amount of bottom-ranked novel PPIs in Figure 8. The PubMed score distribution indicates that the difference between the bottom-ranked novel and the top-ranked novel PPIs is not significant with p-value = 0.88 using the t-test. The difference between bottom-ranked regular and top-ranked regular PPIs is significant with p-value = 0.01. Further, four novel PPIs SRC:APP, AR:APP, APP:FYN, and APP: NES are reported both statistically and biologically important shown in Table 1. The Src-mediated phosphorylation of Mint2 regulating the APP endocytic sorting pathway has been validated in transgenic mouse models of AD [29]. Therefore, the SRC and APP association WIPER found could help to understand a novel mechanism for regulating Ap secretion. The report of Fyn increasing the nonpathological cleavage of amyloid precursor protein (APP) in Alzheimer’s disease (AD), explains the relationship between APP and FYN [30].
Figure 8. The PubMed score distribution of regular and novel significant PPIs reported by WIPER.
The x-axis is the categories of WIPER bottom-ranked novel edges, WIPER top-ranked novel edges, WIPER bottom-ranked regular edges, and the WIPER top-ranked regular edges. The y-axis is the PubMed score. The red dot represents the edge’s PubMed score in each category. The violin plot represents the distribution of the edge’s PubMed scores. The number across the two categories is the p-value of PubMed score t-test between the two categories.
Table 1.
Significant novel PPIs with co-citation PubMed scores
| Edge | Degree | We | UFC | Rank | p-value | PubMed score |
|---|---|---|---|---|---|---|
| SRC:APP | 262 | 252.11 | 2.96 | 8 | 1.00E–03 | 3.65 |
| AR:APP | 222 | 248 | 2.91 | 11 | 1.38E–03 | 1.35 |
| APP:FYN | 226 | 223.18 | 2.62 | 37 | 4.75E–03 | 1.47 |
| APP:NES | 178 | 179.01 | 2.1 | 260 | 3.28E–02 | 0.54 |
| PARK2:AR | 110 | 176.5 | 2.07 | 291 | 3.68E–02 | 0.47 |
| ESR1:PSEN1 | 134 | 168.6 | 1.98 | 408 | 5.15E–02 | 1.25 |
| AR:CDK5 | 119 | 166.31 | 1.95 | 446 | 5.58E–02 | 0.61 |
DISCUSSION
In this work, we developed the WIPER algorithm to prioritize statistically and biologically significant biomolecular associations in any network model, which may be developed downstream of a high-throughput biological experiment such as RNA-sequencing analysis of case vs. control conditions or whole-genome sequencing analysis of single-nucleotide variations (SNVs) of a particular cohort. Distinct from yet compatible with node-ranking algorithms, WIPER examines the global connectivity of the condition-specific networks constructed by connecting significant genes/proteins from the genomic or functional genomic analysis to assign new scores to each edge, based on conceptually how well each edge may be traversed “in-path” by computational simulation experiments. WIPER does not attempt to solve this problem with a new method incompatible with well-established node-ranking techniques; instead, it converts the edge-ranking problem and solves it with best known node-ranking techniques. The current WIPER algorithm is more sensitive than edge betweenness centrality in finding edges that are in critical usage paths. Our pragmatic statistical models work in both synthetic examples real-world case studies to extract known/unknown biomolecular associations essential to specific biological conditions.
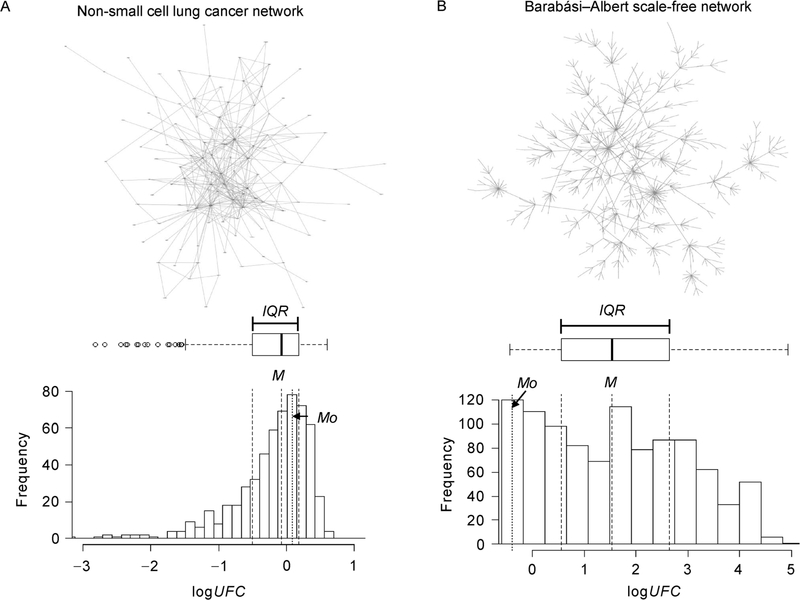
For future work, we expect to remove two limitations of WIPER. One is to remove the lack of edge directionality constraint of the current algorithm. This is relatively trivial to achieve, given that our technique may work with traversing both the bi-directional paths and uni-directional paths. Second is the automated recommendation of statistical models. In the Supplementary Materials, we simulated more than 17 network construction scenarios in real-world network biology situations. We discovered that the logUFC follows the first model (Figure 9A) significantly more frequently than the second model (Figure 9B). However, more robust solutions to automatically select the best-fit statistical model will improve the accuracy of reported results. We expect WIPER as a major tool of mining important associations in biomedical network modeling.
Figure 9. An illustration of two scenarios about logUFC distribution in two typical network models.
(A) The non-small celi lung cancer model PPIs’ logUFC distribution tends to be a normal distribution given the |M−Mo|⩽0.5 × IQR. (B) The Barabási–Albert model edges’ logUFC distribution tends to be a non-normal distribution given the |M−Mo| > 0.5 × IQR.
METHODS
An overview of the WIPER algorithm
In this study, we refer to the terms “gene” and “node” interchangeably, so do we to the terms “interaction”, “association”, and “edge”. In addition, we use the following symbols to denote the mathematical entities:
G: denotes the input graph in general. V denotes the node set, E denotes the edge set.
ei,j: the original (and novel) edge between two nodes i and j. We would use single lower-case italic characters to denote nodes.
G: the (original) matrix storing the node-to-node adjacency. The primary assumption is that all entries in G are between 0 and 1, and higher values imply stronger associations. We denote Gi,j the (i,j) entry (or the original edge weight) between two nodes i and j. We use upper-case bold characters to denote matrices, and the upper-case bold-italic character to denote one entry in matrices
D: the node-to-node optimal path matrix computed using a Dijkstra [31]-like algorithm. Both rows and columns in D and G correspond to nodes. Similar to G, we denote Di,j the optimal path score between two nodes i and j.
X: the edge-to-edge traversal path distance matrix, which is among the proposed novel ideas. Rows and columns in X correspond to an original (and novel) edge. We denote X(ei,j, ek,l) the distance between two edges ei,j and ek,l.
W(ei,j): the ranking score of the edge between two nodes i and j, which is computed iteratively. Ws(ei,j) is the ranking score computed at iteration s.
In this study, the networks are all undirected graphs and G, D and X are all symmetric matrixes.
WIPER ranks edges based on the construction of the edge-to-edge network and accumulated weights from every connected edge through traversal paths. WIPER calculation is a three-step process, computing the node-to-node optimal path, transforming the node-to-node path to edge-to-edge traversal network, and ranking edge based on the edge-to-edge network. In the edge-to-edge network, we define the maximum hop distance and the traversal path confident score cutoff to limit the number of edge-to-edge connection in X. In the network example in Figure 1, we set the maximum hop distance equal to 0 and the traversal path confident score cutoff equal to 0. There will be no connection between ei,j and eg,i since there at least one hop between the two edges. All the connections in the edge-to-edge network are passed the traversal path confident score cutoff, therefore no connection will be removed from X. We demonstrate the overall WIPER workflow by using a simple 11-node network example in Figure 1. First, from G, we calculate the D. Second, we use D to compute X. X allows ranking edges similarly to ranking nodes in the network. Third, we calculate WIPER edge score, p-value and rank edges. Among many available node ranking algorithms using the network, we choose [32] (ant-colony). In summary, the novelty in this work is how to “transform” the edge-ranking problem such that we can apply a node ranking method to solve for (from G to X). The following sections describe each step.
Compute the node-to-node optimal paths in D
We compute the node-to-node path weight using the product of the original independent edge weights (e.g., the confidence of protein-protein interaction in [20]). We score the path i ->k1 ->k2 ->· · ·->kt ->j, traveling from node i to j through nodes k1, k2, …, kt as
| (1) |
Since all original edge weights are between 0 and 1, trivially we have the path scores for all paths are less than or equal to 1. This allows defining the optimal path Di,j as the maximum path score of every path from i to j.
| (2) |
Equations (1–3) allows applying Dijkstra’s algorithm [33] to compute the highest weighted paths within the path length if the user provides. For a brief mathematical proof, if we construct another network G’ having the same node and edge to G, but with edge weight
| (3) |
Then G’ edge weights are always positive. Therefore, the negative logarithm path score in G
| (4) |
Becomes the path length in G’. Since the Dijkstra’s algorithm would find the pairwise shortest paths in G’, it would also find the optimal path in G.
Compute the edge-to-edge distance in X
We transform the node-to-node path weight to edge-to-edge traversal path weight though joining the edge endpoints that maximizing the probabilities. For any pair of edges ei,j, ek,l, the edge-to-edge distance between them is defined by the maximum value of the four optimal paths bridging the edges’ endpoints, as follows
| (5) |
Rank edges from X
We adopt the node ranking algorithm to the edge ranking using the constructed edge-to-edge network represented Here, the damping parameter σ in Equations (8 and 11) is adjustable for the user. In the synthetic network models, we set σ = 0.2. In the chronic myeloid leukemia pathway and adult pig heart case studies, we use σ = 0.i5. In addition, we continue updating Equation (10) until s = 200. To make multiple models comparable, WS scores are normalized by dividing the medium of the WS distribution (named as Usage of Fold Change score (UFC)).
Estimate the p-value for each edge ranked
For each edge, we estimate the ranking p-values from the distribution of UFC scores. Since the UFC score are driven by the accumulation of many small percentage in X. In WIPER, we apply the “ant-colony” ranking paradigm [32], which is primarily designed for discovering the optimal path. To assign the initial score W0 to each edge through the edge-to-edge network, we utilize the formula described in Ref. [34]:
| (6) |
In which Γi,j denotes the set of ei,j’s neighbors (non-zero entry to ei,j in X), and N(Γi,j denotes the total number of ei,j’s neighbors.
We treat the updated weights (ranking score) in each iteration by adding the “information flow”. Δ represents the “outflow” information and ΔT represents the ‘inflow’ information in the ant-colony paradigm
| (7) |
where σ is a damping factor (0 < σ⩽ 1) representing the probability of a node continuing the “information flow”, similar to Random Walk. W′ s−1 is the WS connected neighborhood WIPER score at iteration s−1. The matrix “outflow” information Δ and the ‘inflow’ information ΔT are computed as
| (8) |
| (9) |
In the Equation (8), Γi,j represents the set of edge ei,j’s neighbor edges. In the Equation (9), Γk,l represents the set of edge ek,l’s neighbor edges.
For each edge, we can rewrite Equation (7) as
| (10) |
changes e.g., sub-network groups, which become additive on a log scale, we take a log2-based transformation of UFC and denoted as logUFC. We denote Mo, M and IQR as the mode of the logUFC histogram, the median and the interquartile range [31] of logUFC distribution. The bin size of the logUFC histogram is determined by 0.2×IQR. We anticipate two scenarios as follows:
The difference between Mo and M is within 0.5×IQR (Figure 9A). Here, we expect that the distribution of logUFC would have a bell-shape, similar to a normal distribution in a biological network (non-small cell lung cancer network using HAPPI-2 4-stars and above [20] described in [35]). The mean of the normal distribution is estimated using M, and the standard deviation σ of the normal distribution is estimated using IQR/1.34 due to the fact that a normal distribution can be trivially perturbed to maintain its Q1 and Q2 σ scores at 0.67 and −0.67. Then, the p-value for edge ei,j would be computed as [36]
| (11) |
If logUFC (ei,j)>M, we calculate using right tail model. Otherwise, we calculate using the left tail model.
We expect that most of the case studies would be computed in the fitted normal distribution, as shown in the Supplementary Materials all KEGG cancer pathways’ edge ranking.
The difference between Mo and M greater than 0.5×IQR occurs when a scale-free network has been given (Barabási–Albert network of 1,000 nodes generated using Randomizer v1.3) [37] (Figure 9B). In this case, since it is difficult to expect the distribution shape of logUFC(ei,j), we compute the p-value empirically as
| (12) |
Here, |logUFC > logUFC(ei,j)| denotes the number of edges (including novel edges) having higher ranking a score than ei,j. |logUFC| denotes the size of X matrix (the total number of edges, including the novel ones).
Infer novel edges
The novel edges are inferred by using the node-to-node global optimal distance score in D-matrix and ranking of the Ws. The original novel edge candidate list consists of the edges for those node-to-node global optimal distance score no less than the mean of the input edge weights. To avoid false positives, we consider the empirical significant regular edges are the top 5% ranked in each tail of the distribution. We set the same criteria to extract the novel edge candidates which are the top 10% node-to-node global optimal distance ranked edges in the initial regular edge list. After merging the regular edges and novel edges into the X-matrix, we perform the same steps as regular edge calculation, thus generating the novel edge candidate list ordered by WS. Then we estimate the p-value of novel edges using the step described in Section “Estimate the p-value for each edge ranked of Method”.
Prepare dataset for case-studies
In this work, we illustrate the usage of WIPER in synthetic models and two real-world case studies. In the simple synthetic model case studies, we show the WIPER ranked edges from different synthetic models in Figure 2. To mimic a biological signaling pathway, we also created a jointed sub-network model containing a “bridge” edge g:h (factor-receptor in the membrane) linking two complex signaling sub-networks together. The two subnetworks represent the signaling pathways in extra-cellular and intracellular shown in Figure 3A. Generally, the edge prioritization performance between WIPER and four other edge indexes, edge betweenness centrality [15,16], indexes of the edges [38], Jaccard coefficient [39], Bridgeness index [40], and Reachability index [41] are evaluated based on their topological properties. The original edge weight is set to be 0.9. The network layers are generated by “breadth-first search algorithm” [42]. In the postnatal pig heart case study, we show the potential of using WIPER for discovering novel edges in solving a largely unknown phenomena of mammalian cardiac repair. We download the significant differentially-expressed genes from RNA sequencing data in [26]. These genes are results from comparing among the postnatal pig heart (day 28) tissues receiving cardiac injury at postnatal day 1, 3 and 14. We query STRING database v.10 [43], under the sus scrofa portion, to construct the network among these genes. This network contains 95 nodes and 120 edges. In the Alzheimer disease case study, we apply WIPER for disordered genetic associations discovery using the genetic candidates downloaded from AlzGene [44]. We generate an AD genetic disorder’s network consisting of 680 nodes and 7,273 PPIs retrieved from HAPPI-2 database [20] with the quality no less than 3-star. Then, we apply WIPER to generate a rank-ordered regular edges list and novel edge lists.
Evaluate time complexity
We estimate the time complexity of WIPER separated into two parts, the optional traversal-path distance calculation, and edge ranking. In the first part, the Dijkstra’s algorithm and maximum likelihood are applied, and the time complexity is O((v + e) log v + v2), the v is the number of the vertexes in the network, the e is the number of the edges in the network. In the second part, the ant-colony algorithm and statistical analysis are applied. Since the default edge-to-edge network is fully connected, the time complexity is O(e2), the e is the set of edges.
To evaluate the time consumption, we use the Barabási–Albert model provided by Randomizer v1.3 [37]. We construct five networks (10 nodes and 16 edges, 50 nodes and 96 edges, 100 nodes and 196 edges, 150 nodes and 296 edges, and 200 nodes and 396 edges) and set the parameters as “ant colony” algorithm, 200 iteration, traversal path confident score cutoff equal to 0, and unlimited maximum hop distance in WIPER. The running time test is performed by the server with GNU/Linux 4.4.0–139-generic, 8 Intel(R) Xeon(R) E5–2630 v4 CPUs.
Ranking robustness evaluation
To evaluate the robustness of the WIPER ranking, we perform a four-step procedure to generate the chosen edge’s WIPER ranking under randomization. Firstly, we choose an edge from the edge list and assign the edge with the initial weight of 0.7. We preserve chosen edge initial weight and randomize the other edges’ initial weights by using a normal distribution of mean = 0.7 and standard deviation = 1 for 100 times. Secondly, we run the WIPER algorithm to generate the WIPER ranking and extract the chosen edge’s WIPER ranking. Thirdly, we independently perform all the edges in the edge list and repeat the first and second steps. Fourthly, we generate the distribution of the extracted chosen edge WIPER rankings and re-rank the chosen edges based on the mean.
Validate the rank-order edges by co-citations in PMED
To demonstrate the rank-order edges with biological significance, we have applied a co-citation enrichment analysis using the hypergeometric test. We built Equation (13) using a similar principle to the pathway co-membership association in [45]. Briefly, the significant edge PubMed score implies that the likelihood of observing articles containing both of the edge nodes is statistically higher than random. In a specific disease study, assuming that an edge consists of gene a and gene b is statistically significant, we estimate the biological significance using the disease, gene a, gene b as keywords in searching the PMED citations. In the Equation (13), we calculated the Co-citation PubMed score using the background citations for the disease denoted as N, the jointed citations of disease and gene a represented as K, the jointed citations of disease and gene b represented as n, the jointed citations of disease, gene a and gene b as k. In the Alzheimer disease case study, we take both regular and novel edges for an amount equal to 10% of the novel PPIs (73 PPIs), and perform the cocitation enrichment analysis.
| (13) |
Supplementary Material
ACKNOWLEDGEMENTS
We thank Jelai Wang and BioITX services at the University of Alabama at Birmingham (UAB) Informatics Institute for computing infrastructure support. The work is partly supported by the National Institute of Health funded Center for Clinical and Translational Science grant award (U54TR002731) to the University of Alabama at Birmingham (UAB), research start-up fund provided by the UAB Informatics Institute to Dr. Chen, the American Heart Association institutional data science fellowship award to the Informatics Institute of UAB, and the National Cancer Institute grant award (U01CA223976).
Footnotes
COMPLIANCE WITH ETHICS GUIDELINES
The authors Zongliang Yue, Thanh Nguyen, Eric Zhang, Jianyi Zhang and Jake Y. Chen declare that they have no conflict of interests.
This article does not contain any studies with human or animal subjects performed by any of the authors.
SUPPLEMENTARY MATERIALS
The supplementary materials can be found online with this article at https://doi.org/10.1007/s40484-019-0180-y.
REFERENCES
- 1.De Las Rivas J and Fontanillo C (2010) Protein-protein interactions essentials: key concepts to building and analyzing interactome networks. PLOS Comput. Biol, 6, e1000807. [DOI] [PMC free article] [PubMed] [Google Scholar]
- 2.Qian Y, Li Y, Zhang M, Ma G and Lu F (2017) Quanfifying edge significance on maintaining global connectivity. Sci. Rep, 7, 45380. [DOI] [PMC free article] [PubMed] [Google Scholar]
- 3.Werner T, Dombrowski SM, Zgheib C, Zouein FA, Keen HL, Kurdi M and Booz GW (2013) Elucidating functional context within microarray data by integrated transcription factor-focused gene-interaction and regulatory network analysis. Eur. Cytokine Netw, 24, 75–90 [DOI] [PMC free article] [PubMed] [Google Scholar]
- 4.Jiang P, Wang H, Li W, Zang C, Li B, Wong YJ, Meyer C, Liu JS, Aster JC and Liu XS (2015) Network analysis of gene essentiality in functional genomics experiments. Genome Biol, 16, 239. [DOI] [PMC free article] [PubMed] [Google Scholar]
- 5.Dezsö Z, Nikolsky Y, Nikolskaya T, Miller J, Cherba D, Webb C and Bugrim A (2009) Identifying disease-specific genes based on their topological significance in protein networks. BMC Syst. Biol, 3, 36. [DOI] [PMC free article] [PubMed] [Google Scholar]
- 6.Ni J, Koyuturk M, Tong H, Haines J, Xu R and Zhang X (2016) Disease gene prioritization by integrating tissue-specific molecular networks using a robust multi-network model. BMC Bioinformatics, 17, 453. [DOI] [PMC free article] [PubMed] [Google Scholar]
- 7.Bar-Joseph Z, Gitter A and Simon I (2012) Studying and modelling dynamic biological processes using time-series gene expression data. Nat. Rev. Genet, 13, 552–564 [DOI] [PubMed] [Google Scholar]
- 8.Klein C, Marino A, Sagot MF, Vieira Milreu P and Brilli M (2012) Structural and dynamical analysis of biological networks. Brief. Funct. Genomics, 11, 420–433 [DOI] [PubMed] [Google Scholar]
- 9.Popik OV, Saik OV, Petrovskiy ED, Sommer B, Hofestädt R, Lavrik IN and Ivanisenko VA (2014) Analysis of signaling networks distributed over intracellular compartments based on protein-protein interactions. BMC Genomics, 15, S7. [DOI] [PMC free article] [PubMed] [Google Scholar]
- 10.Chaudhuri A and Chant J (2005) Protein-interaction mapping in search of effective drug targets. BioEssays, 27, 958–969 [DOI] [PubMed] [Google Scholar]
- 11.Ivanov AA, Khuri FR and Fu H (2013) Targeting protein-protein interactions as an anticancer strategy. Trends Pharmacol. Sci, 34, 393–400 [DOI] [PMC free article] [PubMed] [Google Scholar]
- 12.Herrero A, Pinto A, Colón-Bolea P, Casar B, Jones M, Agudo-Ibáñez L, Vidal R, Tenbaum SP, Nuciforo P, Valdizán EM, et al. (2015) Small molecule inhibition of erk dimerization prevents tumorigenesis by RAS-ERK pathway oncogenes. Cancer Cell, 28, 170–182 [DOI] [PubMed] [Google Scholar]
- 13.Hennessy BT, Smith DL, Ram PT, Lu Y and Mills GB (2005) Exploiting the PI3K/AKT pathway for cancer drug discovery. Nat. Rev. Drug Discov, 4, 988–1004 [DOI] [PubMed] [Google Scholar]
- 14.Hanahan D and Weinberg RA (2011) Hallmarks of cancer: the next generation. Cell, 144, 646–674 [DOI] [PubMed] [Google Scholar]
- 15.Theodosiou T, Efstathiou G, Papanikolaou N, Kyrpides NC, Bagos PG, Iliopoulos I and Pavlopoulos GA (2017) NAP: The Network Analysis Profiler, a web tool for easier topological analysis and comparison of medium-scale biological networks. BMC Res. Notes, 10, 278. [DOI] [PMC free article] [PubMed] [Google Scholar]
- 16.Wang Z, Dueñas-Osorio L and Padgett JE (2015) A new mutually reinforcing network node and link ranking algorithm. Sci. Rep, 5, 15141. [DOI] [PMC free article] [PubMed] [Google Scholar]
- 17.Wang J, Li M, Wang H, and Pan Y (2012) Identification of essential proteins based on edge clustering coefficient. IEEE/ACM Trans. Comput. Biol. Bioinform. 9, 1070–1080 [DOI] [PubMed] [Google Scholar]
- 18.Wang Y, Sun H, Du W, Blanzieri E, Viero G, Xu Y and Liang Y (2014) Identification of essential proteins based on ranking edge-weights in protein-protein interaction networks. PLoS One, 9, e108716. [DOI] [PMC free article] [PubMed] [Google Scholar]
- 19.Krüger M, Moser M, Ussar S, Thievessen I, Luber CA, Forner F, Schmidt S, Zanivan S, Fässler R and Mann M (2008) SILAC mouse for quantitative proteomics uncovers kindlin-3 as an essential factor for red blood cell function. Cell, 134, 353–364 [DOI] [PubMed] [Google Scholar]
- 20.Chen J, Pandey R, and Nguyen TM (2017) Happi-2: A comprehensive and high-quality map of human annotated and predicted protein interactions. BMC genomics [DOI] [PMC free article] [PubMed] [Google Scholar]
- 21.Hulovatyy Y, Solava RW and Milenkovic T (2014) Revealing missing parts of the interactome via link prediction. PLoS One, 9, e90073. [DOI] [PMC free article] [PubMed] [Google Scholar]
- 22.Chowdhury GG (2010) Introduction to Modern Information Retrieval. Facet publishing [Google Scholar]
- 23.Lei C and Ruan J (2013) A novel link prediction algorithm for reconstructing protein-protein interaction networks by topological similarity. Bioinformatics, 29, 355–364 [DOI] [PMC free article] [PubMed] [Google Scholar]
- 24.Solava RW, Michaels RP and Milenkovic T (2012) Graphlet-based edge clustering reveals pathogen-interacting proteins. Bioinformatics, 28, i480–i486 [DOI] [PMC free article] [PubMed] [Google Scholar]
- 25.Kuchaiev O, Rasajski M, Higham DJ and Przulj N (2009) Geometric de-noising of protein-protein interaction networks. PLOS Comput. Biol, 5, e1000454. [DOI] [PMC free article] [PubMed] [Google Scholar]
- 26.Zhu W, Zhang E, Zhao M, Chong Z, Fan C, Tang Y, Hunter JD, Borovjagin AV, Walcott GP, Chen JY, et al. (2018) Regenerative potential of neonatal porcine hearts. Circulation, 138, 2809–2816 [DOI] [PMC free article] [PubMed] [Google Scholar]
- 27.Tromp J, van der Pol A, Klip IT, de Boer RA, Jaarsma T, van Gilst WH, Voors AA, van Veldhuisen DJ and van der Meer P (2014) Fibrosis marker syndecan-1 and outcome in patients with heart failure with reduced and preserved ejection fraction. Circ Heart Fail, 7, 457–462 [DOI] [PubMed] [Google Scholar]
- 28.Hescheler J and Fleischmann BK (2000) Integrins and cell structure: powerful determinants of heart development and heart function. Cardiovasc. Res, 47, 645–647 [DOI] [PubMed] [Google Scholar]
- 29.Chaufty J, Sullivan SE and Ho A (2012) Intracellular amyloid precursor protein sorting and amyloid-p secretion are regulated by Src-mediated phosphorylation of Mint2. J. Neurosci, 32, 9613–9625 [DOI] [PMC free article] [PubMed] [Google Scholar]
- 30.Minami SS, Clifford TG, Hoe HS, Matsuoka Y, and Rebeck GW (2012) Fyn knock-down increases Aβ, decreases phospho-tau, and worsens spatial learning in 3×Tg-AD mice. Neurobiol. Aging,33, e815–824 [DOI] [PMC free article] [PubMed] [Google Scholar]
- 31.Wan X, Wang W, Liu J and Tong T (2014) Estimating the sample mean and standard deviation from the sample size, median, range and/or interquartile range. BMC Med. Res. Methodol, 14, 135. [DOI] [PMC free article] [PubMed] [Google Scholar]
- 32.Dorigo M and Birattari M (2011) Ant Colony Optimization. In: Encyclopedia of Machine Learning, pp. 36–39. Springer [Google Scholar]
- 33.Dijkstra EW (1959) A note on two problems in connexion with graphs. Numer. Math, 1, 269–271 [Google Scholar]
- 34.Hale PJ, López-Yunez AM and Chen JY (2012) Genome-wide meta-analysis of genetic susceptible genes for Type 2 Diabetes. BMC Syst. Biol, 6, S16. [DOI] [PMC free article] [PubMed] [Google Scholar]
- 35.Yue Z, Zheng Q, Neylon MT, Yoo M, Shin J, Zhao Z, Tan AC and Chen JY (2018) PAGER 2.0: an update to the pathway, annotated-list and gene-signature electronic repository for Human Network Biology. Nucleic Acids Res, 46, D668–D676 [DOI] [PMC free article] [PubMed] [Google Scholar]
- 36.Rice J (2006) Mathematical Statistics and Data Analysis. Duxbury Press [Google Scholar]
- 37.Tosadori G, Bestvina I, Spoto F, Laudanna C and Scardoni G (2016) Creating, generating and comparing random network models with NetworkRandomizer. F1000 Res, 5, 2524. [DOI] [PMC free article] [PubMed] [Google Scholar]
- 38.Yu EY, Chen DB and Zhao JY (2018) Identifying critical edges in complex networks. Sci. Rep, 8, 14469. [DOI] [PMC free article] [PubMed] [Google Scholar]
- 39.Bass JIF, Diallo A, Nelson J, Soto JM, Myers CL and Walhout AJM (2013) Using networks to measure similarity between genes: association index selection. Nat. Methods, 10, 1169–1176 [DOI] [PMC free article] [PubMed] [Google Scholar]
- 40.Cheng X-Q, Ren F-X, Shen H-W, Zhang Z-K and Zhou T (2010) Bridgeness: A local index on edge significance in maintaining global connectivity. J. Stat. Mech, 2010, P10011 [Google Scholar]
- 41.Saito K, Kimura M, Ohara K and Motoda H (2016) Detecting critical links in complex network to maintain information flow/reachability. In: PR1CAI 2016: Trends in Artificial Intelligence, pp. 419–432. Springer [Google Scholar]
- 42.Wang SL, Li XL and Fang J (2012) Finding minimum gene subsets with heuristic breadth-first search algorithm for robust tumor classification. BMC Bioinformatics, 13, 178. [DOI] [PMC free article] [PubMed] [Google Scholar]
- 43.Szklarczyk D, Morris JH, Cook H, Kuhn M, Wyder S, Simonovic M, Santos A, Doncheva NT, Roth A, Bork P, et al. (2017) The STRING database in 2017: quality-controlled protein-protein association networks, made broadly accessible. Nucleic Acids Res, 45, D362–D368 [DOI] [PMC free article] [PubMed] [Google Scholar]
- 44.Bertram L, McQueen MB, Mullin K, Blacker D and Tanzi RE (2007) Systematic meta-analyses of Alzheimer disease genetic association studies: the AlzGene database. Nat. Genet, 39, 17–23 [DOI] [PubMed] [Google Scholar]
- 45.Yue Z, Kshirsagar MM, Nguyen T, Suphavilai C, Neylon MT, Zhu L, Ratliff T and Chen JY (2015) PAGER: constructing PAGs and new PAG-PAG relationships for network biology. Bioinformatics, 31, i250–i257 [DOI] [PMC free article] [PubMed] [Google Scholar]
Associated Data
This section collects any data citations, data availability statements, or supplementary materials included in this article.


