

Abstract
Background.
Left-ventricular systolic dyssynchrony (LVSD) has been an important prognostic factor in the patients with dilated cardiomyopathy (DCM). However, the association between the LV diastolic dyssynchrony (LVDD) and clinical outcome is not well established. This study aims to evaluate the prognostic values of both systolic and diastolic dyssynchrony in patients with DCM.
Methods.
Fifty-two patients with DCM were enrolled and divided into two groups according to cardiac deaths from the follow-up data. The phase-analysis technique was applied on resting gated short-axis SPECT MPI images to measure LV systolic and diastolic dyssynchrony, including phase standard deviation (PSD), phase histogram bandwidth (PBW), and phase entropy (PE). Variables with P < 0.10 in the univariate analysis were included in the multivariate cox analysis.
Results.
During the follow-up period (2.9 ± 1.7 years), 18 (34.6%) cardiac deaths were observed. Compared with survivors, patients with cardiac death had lower LVEF (P = 0.011), and more severe LV systolic and diastolic dyssynchrony. The univariate cox regression analysis showed that hypertension, NT-proBNP, LVEF, systolic PSD, systolic PE, and diastolic PBW were statistically significantly associated with cardiac death. The multivariate cox regression analysis showed that systolic PE and diastolic PE were independent predictive factors for cardiac death. Furthermore, the receiver operating characteristic (ROC) analysis, when applied into the combination of systolic PE and diastolic PE for predicting cardiac death, had an area under curve (AUC) of 0.766, a sensitivity of 0.765, and a specificity of 0.722.
Conclusions.
Both the LVSD and LVDD parameters from SPECT MPI have important prognostic values for DCM patients. Both systolic PE and diastolic PE are independent prognostic factors for cardiac death.
Keywords: Dilated cardiomyopathy, Single photon emission computed tomography, Phase analysis, Left-ventricular mechanical dyssynchrony
INTRODUCTION
Dilated cardiomyopathy (DCM) is associated with marked morbidity, mortality and frequent hospitalizations.1 However, treatment of DCM remains a major challenge in health care practice.2 It is essential to find more efficient factors for risk stratification and early effective interventions to improve the outcome.3 Previous studies have demonstrated that a number of variables relate to the outcome, such as age, sex, N-terminal pro brain natriuretic peptide(NT-proBNP),left-ventricular ejection fraction (LVEF), New York Heart Association (NYHA) class, body mass index (BMI), and QRS duration (QRSd) on electrocardiogram (ECG).4,5 Yet, the mechanisms underlying the DCM have not been precisely identified, which comprises left-ventricular (LV) remodeling, progressive LV dilation, deterioration in ventricular contractile function, and LV mechanical dyssynchrony. In recent years, LV dyssynchrony in heart failure has been increasingly discussed, and its prognostic value for cardiac events has been frequently demonstrated.6,7
The phase-analysis technique has been well established to measure LV mechanical systolic dyssynchrony from gated myocardial perfusion single photon emission computed tomography (SPECT) with high reproducibility and reliability.8 Several parameters have been reported to characterize the global LV dyssynchrony, such as phase standard deviation (PSD), phase histogram bandwidth (PBW), and phase entropy (PE). Nevertheless, the previous studies were mainly focused on the parameters of LV systolic dyssynchrony (LVSD). Few studies have been reported concerning diastolic dyssynchrony with long-term follow-up. In fact, the LV diastolic dyssynchrony (LVDD) also plays an important role in patients with heart failure,9 which is more common than LVSD in both diastolic and systolic heart failure patients. Echocardiography has been commonly used to assess LVDD in the majority of DCM studies; however, it is operator-dependent.9,10 On the other hand, it was found that there was much difference between LVSD and LVDD.11 LVDD parameters may have unique prognostic values in DCM patients. Accordingly, the aim of this study is to investigate the prognostic value of both the LV systolic and diastolic dyssynchrony parameters in patients with DCM.
METHODS
Patient Population
Fifty-two patients with DCM were retrospectively enrolled in this study at the First Affiliated Nanjing Medical University Hospital from September 2009 to August 2016. DCM was diagnosed with the patient’s history and an exclusion of other etiological factors that might cause LV dysfunction, with LV ejection fraction (LVEF) ≤ 45% by echocardiography according to the recent criteria.12 Patients were excluded if they had the following conditions: coronary artery disease, valvular heart disease, alcoholism, inflammatory myocardial disease, or specific myocardial disease secondary to any known systemic disease. Patients with atrial fibrillation were excluded because of their high heart rate variability that might cause the gating error during gated SPECT image acquisition. Patients who underwent pacemaker implantation were also excluded. All patients underwent coronary angiography or dual-source computed tomography, and none of them had epicardial coronary artery stenosis greater than 50%. Functional capacity of the patients was assessed according to the NYHA functional classification. This study was approved by the Institutional Ethical Committee of the First Affiliated Hospital of Nanjing Medical University and informed consent was obtained from all individual participants.
Electrocardiography
A 12-lead surface continuous electrocardiogram (ECG) was recorded at rest after hospitalization. The QRS duration was measured on ECG using the widest QRS complex among the 12 leads. Premature ventricular contractions (PVC) were detected in 24-hour Holter monitoring data. Nonsustained ventricular tachycardia (NSVT) was defined as runs of beats arising from the ventricles lasting for at least three beats and persisting less than 30 seconds with cycle length of less than 600 milliseconds in 24-hour Holter monitoring data.13
Gated Myocardial Perfusion SPECT
The resting gated SPECT MPI scan was performed approximately 60 minutes after injection of 20–30 mCi of Tc-99m sestamibi. The MPI images were acquired on a dual-headed camera (CardioMD, Philips Medical Systems) using a standard protocol. The imaging parameters were 20% energy window around 140KeV, 180° orbit, 32 steps with 25 seconds per step, 8-bin gating and 64 projections per gate. Image reconstruction and reorientation were done using the Emory Reconstruction Toolbox (ERToolbox; Syntermed, Atlanta, GA). SPECT images were reconstructed by ordered subset expectation maximization (OSEM) with three iterations and 10 subsets, and then filtered by a Butterworth low-pass filter with a cutoff frequency of 0.3 cycles/cm and an order of 10.
The resulting gated short-axis SPECT MPI images were input into an interactive tool to identify the LV parameters. These parameters were then submitted to an automatic myocardial sampling algorithm which searched in 3D for maximal count circumferential profiles in each cardiac frame. Subsequently, the samples were used by a multiharmonic phase-analysis tool based on the Fourier approximation to assess LVSD and LVDD. The 1-harmonic and 3-harmonic Fourier approximations were employed for each sample to calculate the onset of mechanical contraction and relaxation, respectively.11
Phase histogram and polar map were generated to visualize the dyssynchrony of systole and diastole, as illustrated in Figure 1. Based on the phase histogram, the PSD, PBW, and PE were computed as global indices8,14,15 to quantify the mechanical dyssynchrony. PSD represents the standard deviation of the phase distribution, PBW represents the width of the phase band including 95% of the samples over the LV, and PE taking advantage of information theory was computed based on the following equation:
where is the total number of samples in the phase histogram, and is the proportion of the samples with the phase angle over the total number of samples in the phase histogram,16 as illustrated in Figure 1B and 1D.
Figure 1.
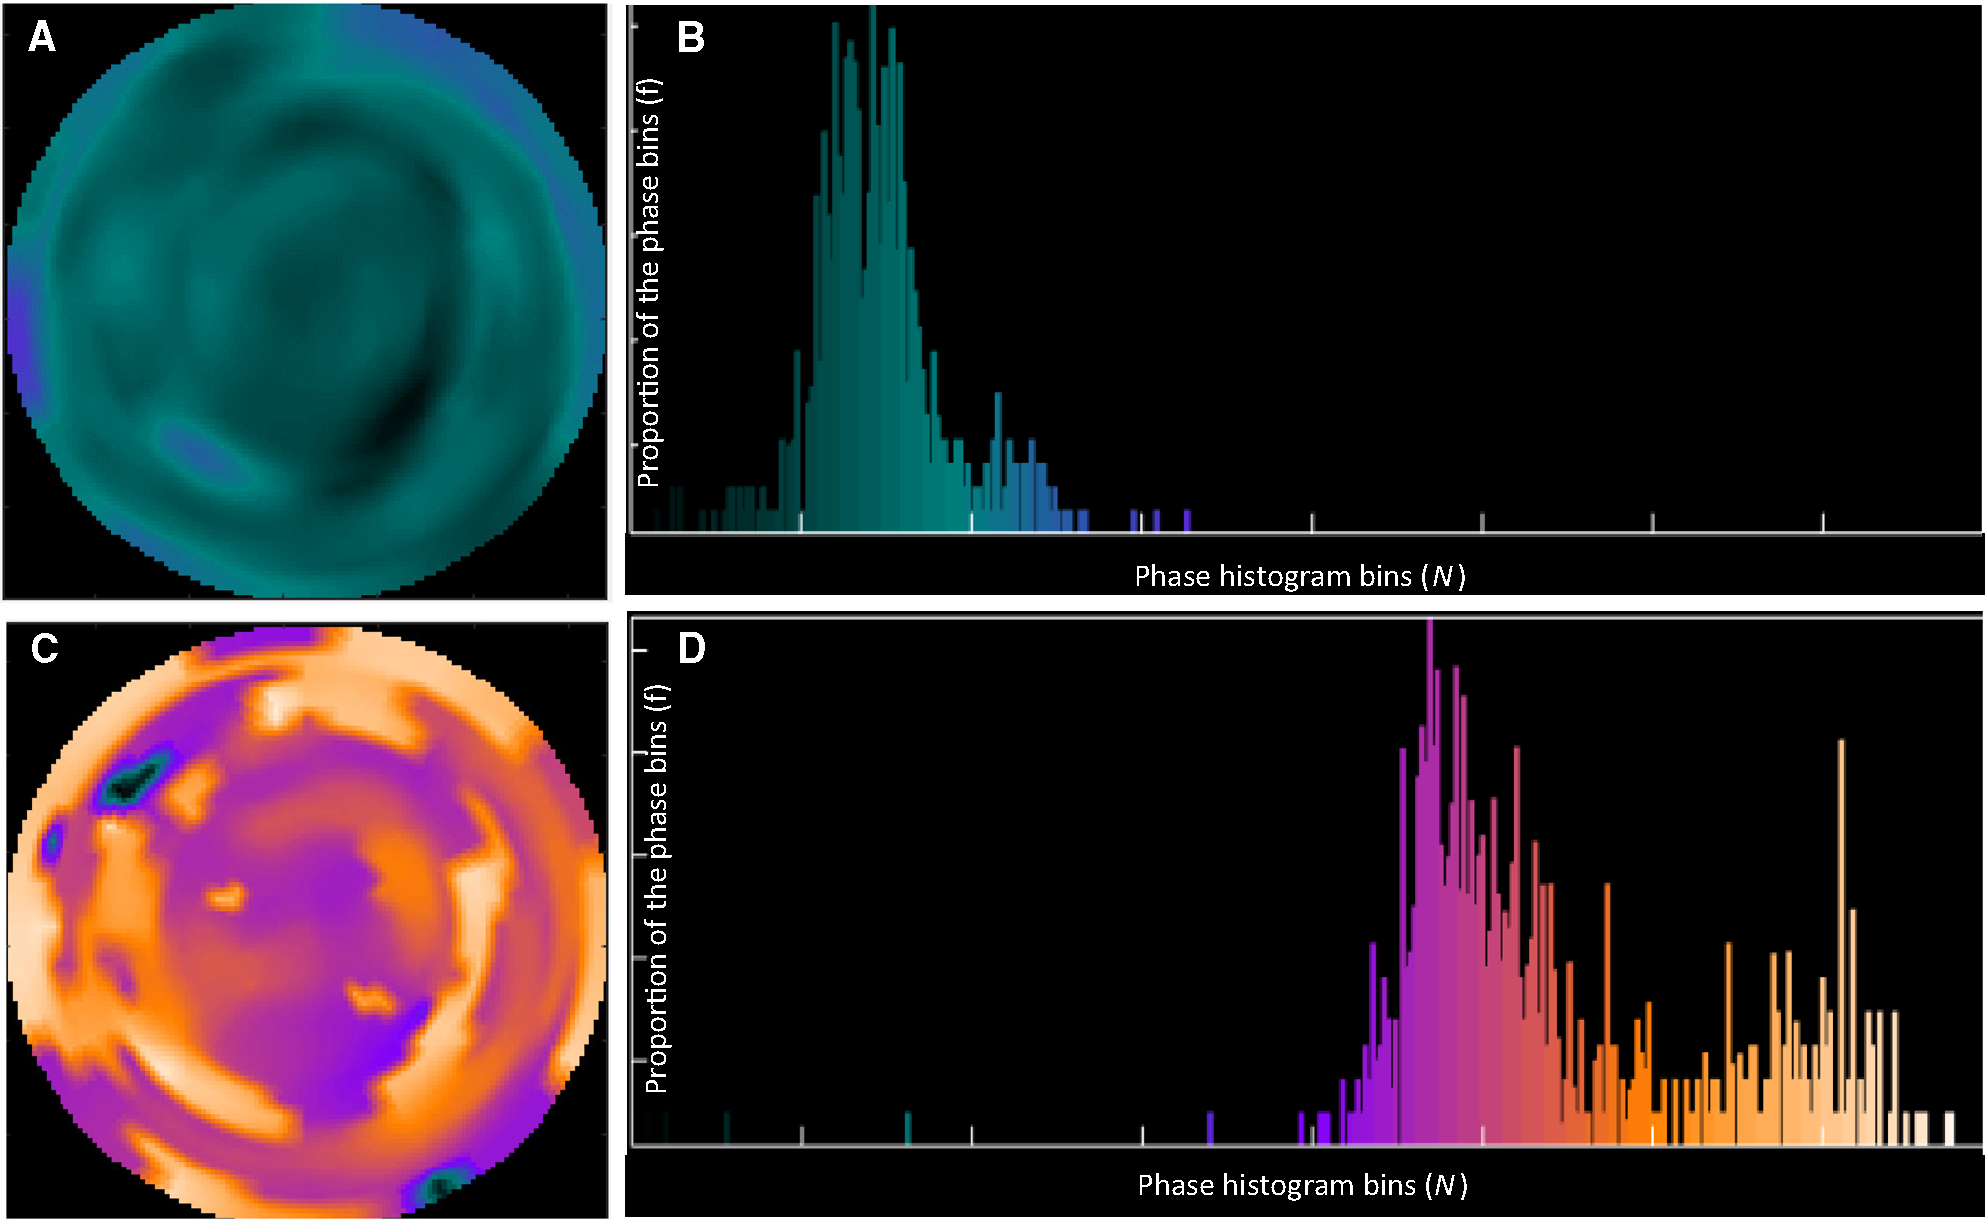
An example of a patient showing the systolic and diastolic phase polar maps and histograms. A and B are the systolic phase polar map and histogram, respectively. C and D are the diastolic phase polar map and histogram, respectively. The brighter regions mean greater phase values (phase bins).
The systolic PSD, PBW, and PE as derived from the contraction onsets of all the myocardial samples were used as the global indices of LVSD, whereas the diastolic PSD, PBW, and PE from the relaxation onsets of all the myocardial samples were used as the global indices of LVDD.
Follow-Up After SPECT MPI
The follow-up was performed through phone contact with patients or their relatives, as well as checking patient hospital records and government records of death. The endpoint was cardiac death, including cardiac arrest or death from circulatory failure occurring within the first hour or refractory chronic heart failure. Patients were divided into two groups according to the follow-up data (the cardiac death group and the survivor group).
Statistical Analysis
Statistical analysis was performed with SPSS 20.0 software (SPSS Inc., Chicago, IL, USA). Normality of continuous variables was tested and expressed as mean ± SD and the categorical variables was expressed by percentages or numbers. Comparisons between the cardiac death group and survivor group were performed using Student t-test for normally distributed continuous variables, Wilcoxon comparison test for nonnormally distributed continuous variables, and Chi-square test for categorical variables. The hazard ratio (HR) and 95% confidence interval (CI) for each variable were calculated by the cox univariate analysis. Continuous variables of dyssynchrony parameters were converted to binary variables according to their median. The cox regression analysis was applied to determine independent predictors of major adverse cardiac events. Variables with a value of P < 0.10 in the univariate analysis and variables with clinical significance were included in the multivariate cox analysis including LVEF, Hypertension, NT-proBNP, and dyssynchrony parameters. Furthermore, the dyssynchrony variables with P < 0.05 in the cox multivariate regression analysis were combined by the binary logistic regression to predict the probability value (PV) of cardiac death for the receiver operating characteristic (ROC) curve analysis.17,18 And then, the normal distribution of normal diastolic PE was set to 2.5 standard deviations. The patients with normal diastolic PE vs those with abnormal PE were performed by K-M curve. A P-value < 0.05 was considered to be statistically significant.
RESULTS
Patient Characteristics
Table 1 lists the patient baseline characteristics. For all the patients, the age was 50.8 ± 15.6 years, and 42 (80.1%) patients were male. 35 (67.3%) patients were classified as having NYHA functional class III, 15 (28.8%) as NYHA class II, and only 2 (3.8%) as NYHA class I. All patients were treated with guideline-directed medical therapy for heart failure. Medication consisted of diuretics (90.4% of patients), angiotensin-converting enzyme inhibitors (ACEI) or angiotensin (AT) II antagonists (92.3% of patients), beta-blockers (96.2% of patients), and digoxin (28.8% of patients). Moreover, during the follow-up period (2.9 ± 1.7 years), 18 (34.6%) had cardiac deaths and were categorized as the cardiac death group, and the rest of patients were categorized as the survivor group. No significant differences were noted in age, gender, hypertension, diabetes, QRS duration or NT-proBNP (all P > 0.05) between the two groups. Meanwhile, arrhythmias including NSVT, PVC, and complete left bundle branch block (CLBBB) had no significant difference (all P > 0.05).
Table 1.
Baseline characteristics and LV function parameters of the enrolled patients
| Variables | All (n = 52) | Cardiac deaths (n = 18) | Survivors (n = 34) | P-value |
|---|---|---|---|---|
|
| ||||
| Age (year) | 50.8 ± 15.6 | 52.8 ± 15.4 | 50.0 ± 15.2 | 0.513 |
| Male (n, %) | 42 (80.1%) | 15 (83.3%) | 27 (79.4%) | 0.735 |
| Hypertension | 16 (30.8%) | 1 (5.6%) | 15 (44.1%) | 0.005 |
| Diabetes | 10 (19.2%) | 2 (11.1%) | 8 (23.5%) | 0.284 |
| QRS duration (ms) | 123.8 ± 34.6 | 132.8 ± 40.1 | 119.0 ± 30.8 | 0.172 |
| NT-proBNP | 2,480.6 ± 2,283.3 | 3,648.6 ± 2,733.5 | 1,794.4 ± 1,877.9 | 0.006 |
| NS-VT | 28 (53.8%) | 13 (72.2%) | 15 (44.1%) | 0.135 |
| PVC | 2,153.7 ± 5,103.4 | 2,362.5 ± 4,203.2 | 2043.5 ± 5,577.9 | 0.832 |
| CLBBB | 12 (23.1%) | 4 (22.2%) | 8 (23.5%) | 0.722 |
| NYHA class I/II/III | 3/14/35 | 1/5/12 | 2/9/23 | 0.738 |
| Medication | ||||
| ACE inhibitors/ARBs | 48 (92.3%) | 16 (88.9%) | 32 (94.1%) | 0.410 |
| β-blockers | 50 (96.2%) | 18 (100%) | 32 (94.1%) | 0.303 |
| Diuretics | 47 (90.4%) | 16 (88.9%) | 31 (91.2%) | 0.795 |
| Digoxin | 15 (28.8%) | 7 (38.9%) | 8 (23.5%) | 0.200 |
| LV function parameters | ||||
| EDV | 308.7 ± 106.5 | 361.22 ± 117.8 | 280.88 ± 89.9 | 0.008 |
| ESV | 247.7 ± 99.3 | 300.67 ± 105.6 | 219.7 ± 85.8 | 0.004 |
| LVEF (%) | 21.2 ± 7.6 | 17.6 ± 5.9 | 23.1 ± 7.7 | 0.011 |
| Systolic PSD (°) | 36.2 ± 15.0 | 45.1 ± 13.7 | 31.5 ± 13.6 | 0.001 |
| Systolic PBW (°) | 149.1 ± 69.1 | 182.9 ± 66.2 | 131.2 ± 64.5 | 0.009 |
| Systolic PE | 0.782 ± 0.063 | 0.818 ± 0.042 | 0.762 ± 0.063 | 0.001 |
| Diastolic PSD (°) | 55.2 ± 18.9 | 50.6 ± 18.1 | 60.77 ± 9.8 | 0.014 |
| Diastolic PBW (°) | 199.7 ± 77.6 | 236.8 ± 73.9 | 180.0 ± 73.1 | 0.01 |
| Diastolic PE | 0.811 ± 0.079 | 0.847 ± 0.052 | 0.793 ± 0.086 | 0.018 |
Data are expressed as mean ± SD or number (percentage)
NT-proBNP, N-terminal pro-natriuretic brain natriuretic peptide; NS-VT, nonsustained ventricular tachycardia; PVC, premature ventricular contraction; CLBBB, complete left bundle branch block; NYHA, New York Heart Association; ACE, angiotensin-converting enzyme; ARBs, angiotensin II receptor blocker; EDV, end-diastolic volume; ESV, end-systolic volume; LVEF, left-ventricular ejection fraction
Table 1 also shows the LV function parameters measured from gated SPECT MPI. The LVEF was significantly lower in the cardiac death group than that in the survivor group (17.6 ± 5.9% vs 23.1 ± 7.7%, P = 0.011). For the LVSD parameters, the PSD, PBW, and PE in the cardiac death group were significantly larger than those in the survivor group (45.1 ± 13.7° vs 31.5 ± 13.6°, P = 0.001; 182.9 ± 66.2° vs 131.2 ± 64.5°, P = 0.009; 0.818 ± 0.042 vs 0.762 ±0 .063, P = 0.001, respectively). Meanwhile, for the LVDD parameters, the PSD, PBW, and PE in the cardiac death group were significantly larger than those in the survivor group (50.6 ± 18.1° vs 60.77 ± 9.8°, P = 0.014; 236.8 ± 73.9° vs 180.0 ± 73.7°, P = 0.011; 0.847 ± 0.052 vs 0.793 ± 0.860, P = 0.018, respectively) as well.
Table 2 shows the correlations between LVSD and LVDD parameters. The correlation coefficients between LVSD and LVDD parameters were 0.81, 0.88, and 0.81 for PSD, PBW, and PE, respectively. Furthermore, as suggested by the Bland-Altman plot in Figure 2, there is a great agreement between systolic PE and diastolic PE (95% CI − 0.02 ± 1.96 × SD). However, the LVSD parameters were significantly different from the LVDD parameters by the paired t-test (PSD: 36.2 ± 15.0° vs 55.2 ± 18.9°, P < 0.001; PBW: 149.1 ± 69.1° vs 199.7 ± 77.6°, P < 0.001) or Wilcoxon comparison (PE, 0.782 ± 0.063 vs 0.811 ± 0.08, P < 0.001).
Table 2.
Correlations between left-ventricular systolic dyssynchrony and diastolic dyssynchrony
| Systolic dyssynchrony |
Diastolic dyssynchrony |
|||||
|---|---|---|---|---|---|---|
| PSD (°) | PBW (°) | PE | PSD (°) | PBW (°) | PE | |
|
| ||||||
| Range | 12.4–70.7 | 46.0–328.0 | 0.628–0.889 | 16.6–97.7 | 82.0–346.0 | 0.587–0.925 |
| Median | 33.3 | 133.0 | 0.786 | 54.6 | 190.5 | 0.829 |
| P | 0.000 | 0.000 | 0.000 | |||
| R | 0.810 | 0.880 | 0.810 | |||
PSD, phase standard deviation; PBW, phase bandwidth; PE, phase entropy
P-value by paired t-test between the systolic and diastolic parameters; R, correlation coefficient
Figure 2.
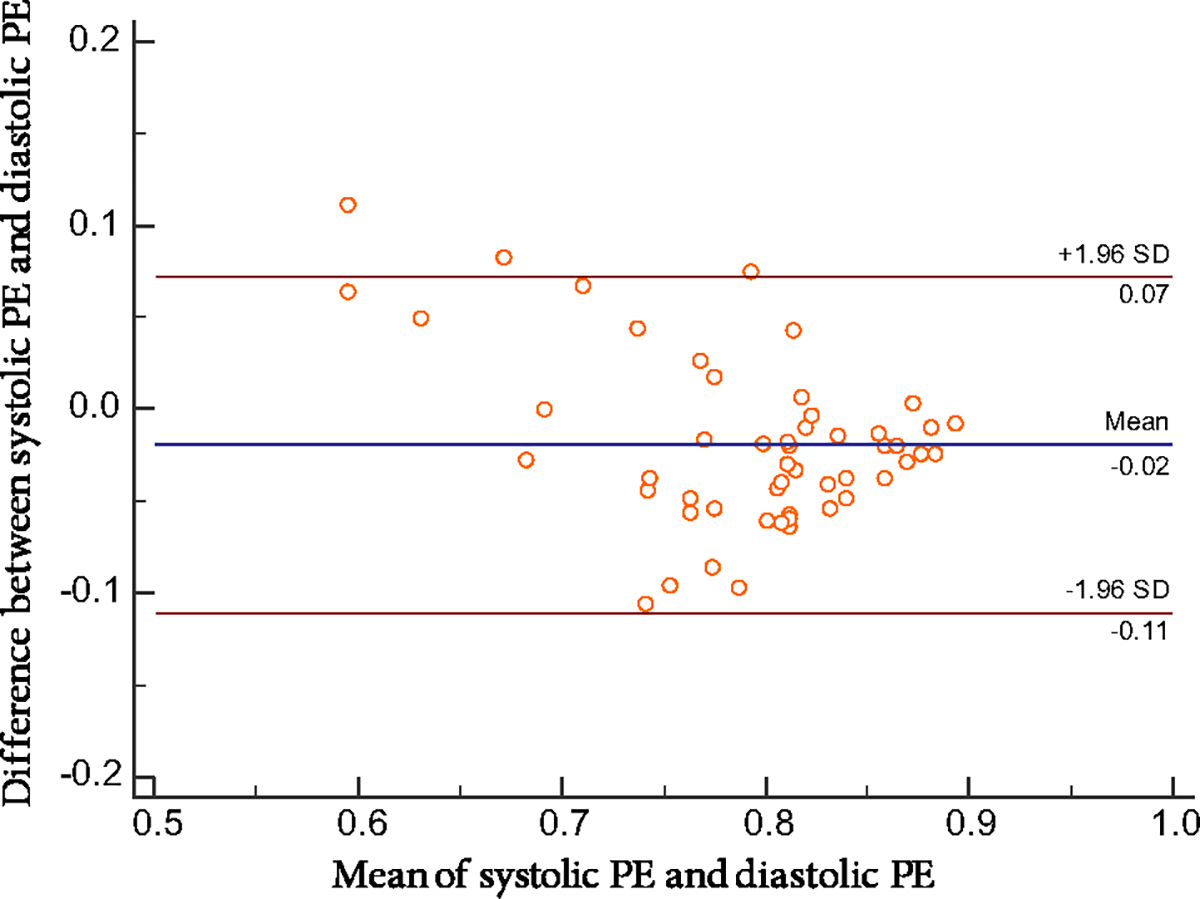
The Bland–Altman difference plot between systolic PE and diastolic PE, with a mean absolute difference (bold continuous line) and 95% confidence interval of mean differences (dashed lines). PE phase entropy; SD standard deviation.
Prediction of Cardiac Death
In Table 3, the univariate cox regression analysis showed that hypertension, NT-proBNP, LVEF, systolic PSD, systolic PE, and diastolic PBW were associated with cardiac death (all P < 0.05). When systolic PE was input into the multivariate cox regression separately (Table 4), it was the only independent predictive factor for cardiac death (OR: 3.23, 95% CI 1.016–10.276, P = 0.047). When diastolic PE was used (Table 5), it was also an independent predictor of cardiac death (OR: 3.177, 95% CI 1.004–10.050, P = 0.049) along with LVEF (OR: 0.907, 95% CI 0.829–0.991, P = 0.032). In the ROC analysis of diastolic PE alone, the area under the curve (AUC), optimal cutoff value, sensitivity, and specificity were 0.695, 0.832, 0.722, and 0.647, respectively; meanwhile, in the ROC analysis of systolic PE alone, the AUC, optimal cutoff value, sensitivity, and specificity were 0.766, 0.800, 0.722, and 0.735, respectively. Furthermore, the systolic PE and diastolic PE were combined to compute the PV by binary logistic regression for predicting cardiac death:
Table 3.
Univariate cox regression models for cardiac death
| Variables | P-value | Hazard ratio | 95% CI |
|---|---|---|---|
|
| |||
| LVEF | 0.017 | 0.897 | 0.820–0.981 |
| Hypertension | 0.038 | 0.118 | 0.016–0.891 |
| NT-proBNP | 0.017 | 1.000 | 1.000–1.000 |
| Systolic PSD (°) | 0.013 | 1.046 | 1.010–1.083 |
| Systolic PBW (°) | 0.053 | 1.007 | 1.000–1.013 |
| Systolic PE | 0.016 | 1.134 | 1.023–1.257 |
| Diastolic PSD (°) | 0.137 | 1.020 | 0.994–1.046 |
| Diastolic PBW (°) | 0.048 | 1.007 | 1.000–1.013 |
| Diastolic PE | 0.079 | 1.075 | 0.992–1.165 |
CI, confidence intervals; LVEF, left-ventricular ejection fraction; NT-proBNP, N-terminal pro-natriuretic brain natriuretic peptide
Table 4.
Multivariate cox regression models for cardiac events with systolic phase entropy
| Variables | Wald | P-value | Hazard ratio | 95% CI |
|---|---|---|---|---|
|
| ||||
| Systolic PE | 3.945 | 0.047 | 3.230 | 1.016–10.276 |
| Hypertension | 3.255 | 0.071 | 0.154 | 0.020–1.175 |
| NT-proBNP | 2.821 | 0.093 | 1.000 | 1.000–1.000 |
| LVEF | 1.906 | 0.167 | 0.936 | 0.852–1.028 |
Variables with P < 0.10 were included in the multivariate analysis
CI, confidence intervals; LVEF, left-ventricular ejection fraction; NT-proBNP, N-terminal pronatriuretic brain natriuretic peptide; Systolic PE was converted to binary variable according to its median (0.786)
Table 5.
Multivariate cox regression models for cardiac events with diastolic phase entropy
| Variables | Wald | P-value | Hazard ratio | 95% CI |
|---|---|---|---|---|
|
| ||||
| Diastolic PE | 3.870 | 0.049 | 3.177 | 1.004–10.050 |
| Hypertension | 3.208 | 0.073 | 0.156 | 0.020–1.191 |
| NT-proBNP | 2.928 | 0.087 | 1.000 | 1.000–1.000 |
| LVEF | 4.61 | 0.032 | 0.907 | 0.829–0.991 |
Variables with P < 0.10 were included in the multivariate analysis
CI, confidence intervals; LVEF, left-ventricular ejection fraction; NT-proBNP, N-terminal pro-natriuretic brain natriuretic peptide; Diastolic PE was converted to binary variable according to its median (0.829)
The ROC analysis based on the PV suggested that the AUC, sensitivity, and specificity were 0.766, 0.765, and 0.722, respectively. On the basis of the survival analysis, the Kaplan–Meier curve showed that at 76 months, the survivor proportions were 83.3% in the group with normal diastolic PE and 50.0% in the group with abnormal diastolic PE, respectively (log-rank P = 0.079; Figure 3).
Figure 3.
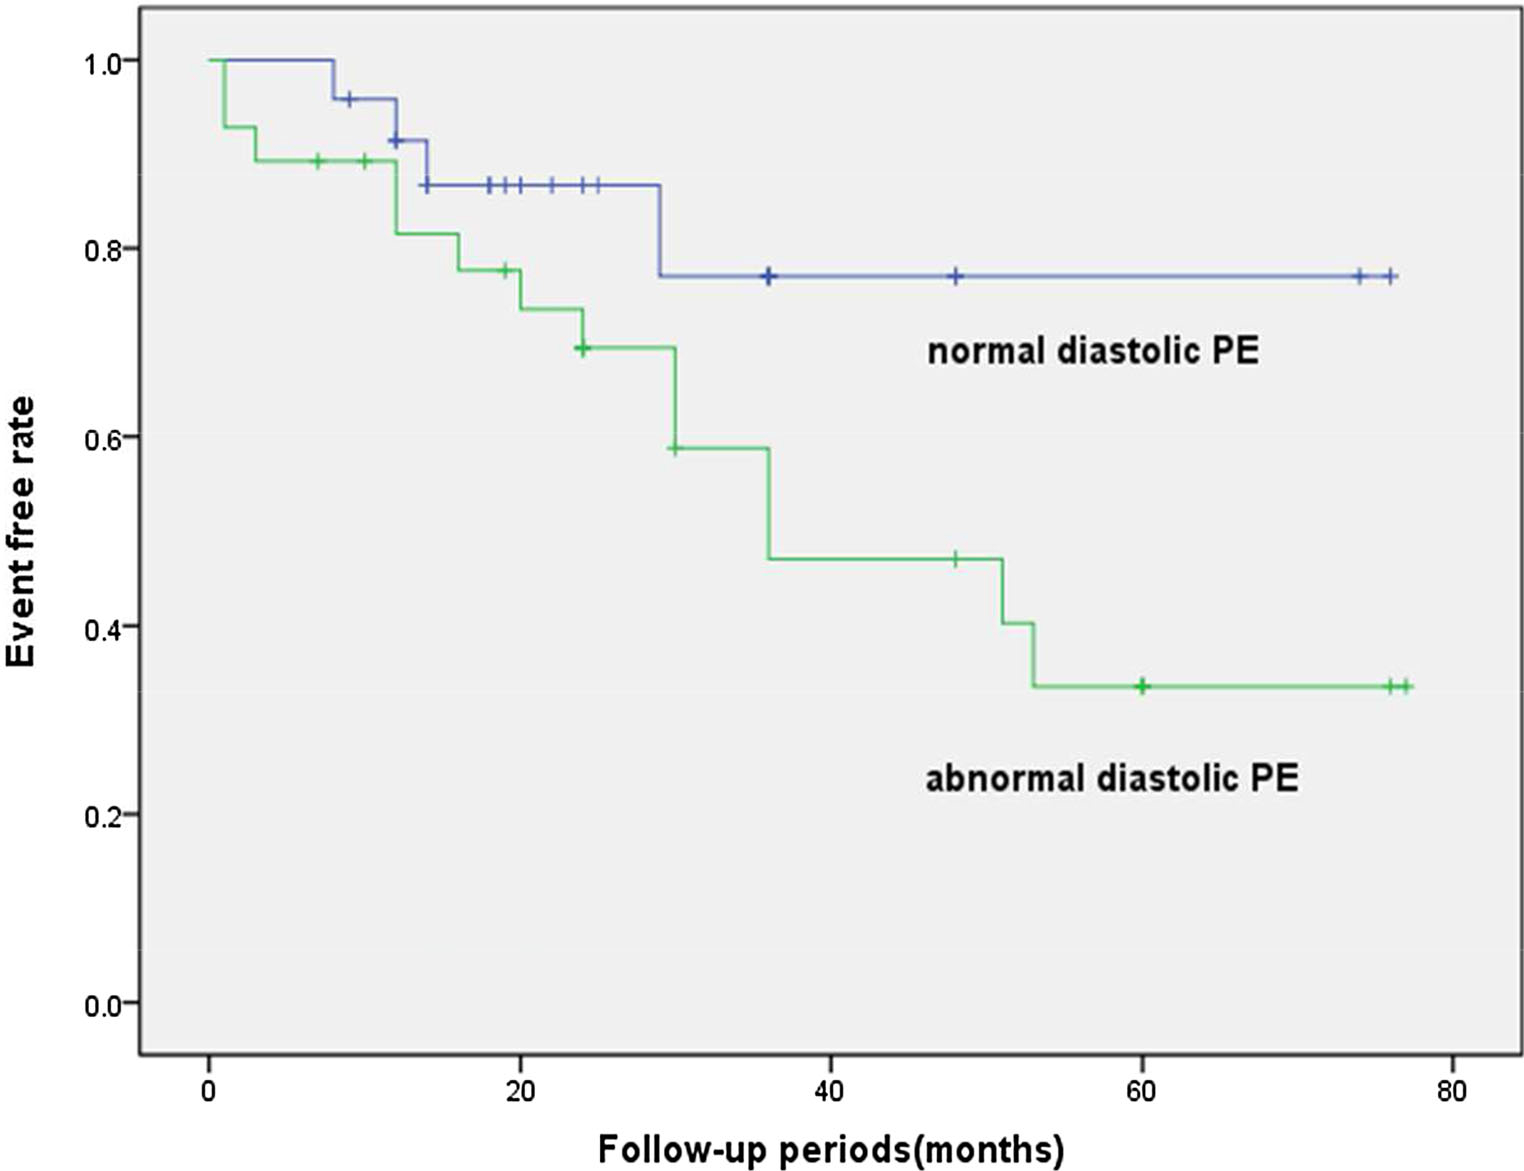
The Kaplan–Meier event-free survival curve.
DISCUSSION
Advantages of Phase Entropy as the Global Index of LV Dyssynchrony
The phase entropy is considered a promising parameter to characterize the dyssynchrony of the onset of mechanical contraction.14,15 It is defined as a term of information theory that reflects the disorder or uncertainty of a system. The phase entropy has been reported to be not influenced by the outliers (histogram bars located farther from the histogram peak), which increase the value of PSD and PBW to a greater extent.16 Wassenaar et al.19 also found that the phase entropy is able to detect mechanical dyssynchrony with low inter- and intra-observer variability in CRT patients. Furthermore, the phase entropy seems potentially more sensitive for assessing the index of dispersion than the PSD.20 In addition, compared with PSD and PBW, phase entropy may be less influenced by the selection of LV base site especially in patients with DCM because of large LV variability.21 Kano et al.15 showed that the phase entropy was a novel prognostic predictor in patients with DCM exhibiting narrow QRS complex, but did not further report the specificity and sensitivity and thus did not quantitatively evaluate its prognostic accuracy in DCM patients.
Our study demonstrated that both systolic PE and diastolic PE were independent predictive factors. Meanwhile, the systolic and diastolic PE correlated well (r = 0.81). Our result confirmed the previous study that systolic PE measured from gated SPECT MPI was a useful prognostic parameter in patients with DCM.15
Systolic Dyssynchrony and Diastolic Dyssynchrony in DCM
LV dyssynchrony in heart failure and its clinical relevance have been increasingly discussed in the recent years. LV dyssynchrony leads to impairment in myocardial perfusion, progressive deterioration of myocyte structure and function, conduction delay, and discoordination between contraction and relaxation. Previous studies have shown that patients with obvious LVSD are at the risk of adverse cardiac events.11,22 Moreover, LVDD is more frequent than LVSD in both diastolic and systolic heart failure patients and may explain the lack of CRT response despite good systolic synchrony.9,10 Kim et al.23 demonstrated that systolic and diastolic dyssynchrony played an important role in diastolic dysfunction among those with HF symptoms or not. In addition, previous studies were mainly focused on echocardiography evaluation which is limited in reproducibility. The measurements of LVSD and LVDD assessed by phase analysis from gated SPECT MPI can reveal more global and detailed dyssynchrony of the whole LV mechanical activation with high reproducibility and reliability.
In this study, we measured both systolic and diastolic dyssynchrony from gated MPI in patients with DCM. The global diastolic dyssynchrony parameters (PSD, PBW, and PE) showed excellent correlations with systolic dyssynchrony parameters (r = 0.81, 0.88, and 0.81, respectively). Our results are partially in accordance with the previous research in which it was found that there was a good correlation between diastolic dyssynchrony by phase analysis from SPECT and that by TDI.24 Chen et al.11 showed that the correlation coefficients between the systolic and diastolic dyssynchrony parameters from SPECT were 0.53 and 0.61 for PSD and PBW in 30 normal subjects, respectively; and in 121 patients with end-stage renal disease and normal LVEF, the correlation coefficients between the systolic and diastolic dyssynchrony parameters were 0.78 and 0.79 for PSD and PBW, respectively. Hsu et al.25 demonstrated that the patients with severe LV systolic dysfunction had severe LV systolic dyssynchrony, but the patients with LV diastolic dysfunction did not necessarily have LV diastolic dyssynchrony. The systolic and diastolic dyssynchrony were physiologically related, but they measured different LV mechanisms. The previous study by Kano et al. identified that high systolic PE was an independent predictive factor for cardiac death in DCM patients;15 our study had the similar finding. Furthermore, in our study, the multivariate cox regression for long-term prediction of adverse cardiac events suggested that diastolic PE as a global diastolic dyssynchrony parameter was an independent predictive factor along with LVEF, indicating that diastolic dysfunction might provide incremental value in patients with DCM. Besides, on the basis of the death analysis, the Kaplan–Meier curve showed that at 76 months patients with normal DPE showed a trend of better outcomes compared with patients with abnormal DPE. However, considering the relatively small patient population in this study, our conclusion might be preliminary.
Clinical Value of Our Findings
Our study adds important evidence about the incremental clinical value of diastolic PE in predicting adverse cardiac events.
Our data clearly indicate that both systolic PE and diastolic PE are independent predictive factors for DCM patients. Although the underlying mechanisms of diastolic PE remain to be systematically investigated, our study demonstrates that diastolic dyssynchrony has incremental value compared with systolic dyssynchrony in DCM, which is conventionally ignored in clinical practice. Because the diastolic dyssynchrony occurring in all heart failure patients influences the long-term prognosis of DCM patients, this abnormality should be identified and quantified in each DCM patient, which would be helpful for the therapeutic strategy. Moreover, after applying the ROC analysis into the combination of systolic PE and diastolic PE to predict adverse cardiac events, the AUC, sensitivity, and specificity were 0.766, 0.765, and 0.722, respectively. Besides, the mismatch between LVSD and LVDD may provide further insight while exploring the mechanisms in DCM.
LIMITATIONS
First, the population of enrolled patients is relatively small, which is a disadvantage for screening the predictive factors for adverse cardiac events. Second, although all the study population received medical treatment without assistant cardiac devices, the therapeutic schedule might be different for each patient, which was not referred and might cause variability of the clinical course. Third, the follow-up period was relatively short for the chronic episode. Fourth, the dyssynchrony data in DCM patients were not compared to those in normal subjects. Besides that, because of relatively small AUC which determines the prediction accuracy, additional prospective multicenter studies in a larger population are needed.
CONCLUSION
Both the LVSD and LVDD parameters from gated SPECT MPI have important prognostic values in patients with DCM. Systolic PE and diastolic PE are independent prognostic factors for cardiac death.
Supplementary Material
Acknowledgement
This research was supported by a grant from the American Heart Association (Project Number: 17AIREA33700016, PI: Weihua Zhou), and a New Faculty startup grant from the University of Southern Mississippi (Project Number: DE01791, PI: Weihua Zhou).
Abbreviations
- DCM
Dilated cardiomyopathy
- LVEF
Left-ventricular ejection fraction
- NYHA
New York Heart Association
- BMI
Body mass index
- ECG
Electrocardiogram
- SPECT
Single photon emission computed tomography
- PSD
Phase standard deviation
- PBW
Phase histogram bandwidth
- PE
Phase entropy
- ROC
Receiver operating characteristic
Footnotes
Disclosures
Dr. Garcia receives royalties from the sales of Emory Cardiac Toolbox. The terms of this arrangement have been reviewed and approved by the Emory University in accordance with its conflicts of interest practice. None of the other authors have any relevant conflicts of interest.
The authors of this article have provided a PowerPoint file, available for download at SpringerLink, which summarises the contents of the paper and is free for re-use at meetings and presentations. Search for the article DOI on SpringerLink.com.
Electronic supplementary material The online version of this article (https://doi.org/10.1007/s12350-018-01468-z) contains supplementary material, which is available to authorized users.
References
- 1.Bader H, Garrigue S, Lafitte S, Reuter S, Jaïs P, Haïssaguerre M, et al. Intra-left ventricular electromechanical asynchrony. A new independent predictor of severe cardiac events in heart failure patients. J Am Coll Cardiol. 2004;43:248–56. [DOI] [PubMed] [Google Scholar]
- 2.Farwell D, Patel NR, Hall A, Ralph S, Sulke AN. How many people with heart failure are appropriate for biventricular resynchronization. Eur Heart J. 2000;21:1246–50. [DOI] [PubMed] [Google Scholar]
- 3.Pocock SJ, Wang D, Pfeffer MA, Yusuf S, McMurray JJ, Swedberg KB, et al. Predictors of mortality and morbidity in patients with chronic heart failure. Eur Heart J. 2006;27:65–75. [DOI] [PubMed] [Google Scholar]
- 4.McMurray JJ, Adamopoulos S, Anker SD, Auricchio A, Böhm M, Dickstein K, et al. ESC guidelines for the diagnosis and treatment of acute and chronic heart failure 2012: The Task Force for the Diagnosis and Treatment of Acute and Chronic Heart Failure 2012 of the European Society of Cardiology. Developed in collaboration with the Heart Failure Association (HFA) of the ESC. Eur J Heart Fail. 2012;14:803–69. [DOI] [PubMed] [Google Scholar]
- 5.Koutalas E, Kanoupakis E, Vardas P. Sudden cardiac death in non-ischemic dilated cardiomyopathy: A critical appraisal of existing and potential risk stratification tools. Int J Cardiol. 2013;167:335–41. [DOI] [PubMed] [Google Scholar]
- 6.Pazhenkottil AP, Buechel RR, Husmann L, Nkoulou RN, Wolfrum M, Ghadri JR, et al. Long-term prognostic value of left ventricular dyssynchrony assessment by phase analysis from myocardial perfusion imaging. Heart. 2011;97:33–7. [DOI] [PubMed] [Google Scholar]
- 7.Yu CM, Zhang Q, Yip GW, Lee PW, Kum LC, Lam YY, et al. Diastolic and systolic asynchrony in patients with diastolic heart failure: a common but ignored condition. J Am Coll Cardiol. 2007;49:97–105. [DOI] [PubMed] [Google Scholar]
- 8.Chen J, Garcia EV, Folks RD, Cooke CD, Faber TL, Tauxe EL, et al. Onset of left ventricular mechanical contraction as determined by phase analysis of ECG-gated myocardial perfusion SPECT imaging: development of a diagnostic tool for assessment of cardiac mechanical dyssynchrony. J Nucl Cardiol. 2005;12:687–95. [DOI] [PubMed] [Google Scholar]
- 9.Schuster I, Habib G, Jego C, Thuny F, Avierinos JF, Derumeaux G, et al. Diastolic asynchrony is more frequent than systolic asynchrony in dilated cardiomyopathy and is less improved by cardiac resynchronization therapy. J Am Coll Cardiol. 2005;46:2250–7. [DOI] [PubMed] [Google Scholar]
- 10.Wang J, Kurrelmeyer KM, Torre-Amione G, Nagueh SF. Systolic and diastolic dyssynchrony in patients with diastolic heart failure and the effect of medical therapy. J Am Coll Cardiol. 2007;49:88–96. [DOI] [PubMed] [Google Scholar]
- 11.Chen J, Kalogeropoulos AP, Verdes L, Butler J, Garcia EV. Left-ventricular systolic and diastolic dyssynchrony as assessed by multi-harmonic phase analysis of gated SPECT myocardial perfusion imaging in patients with end-stage renal disease and normal LVEF. J Nucl Cardiol. 2011;18:299–308. [DOI] [PMC free article] [PubMed] [Google Scholar]
- 12.Elliott P, Andersson B, Arbustini E, Bilinska Z, Cecchi F, Charron P, et al. Classification of the cardiomyopathies: A position statement from the European Society Of Cardiology Working Group on Myocardial and Pericardial Diseases. Eur Heart J. 2008;29:270–6. [DOI] [PubMed] [Google Scholar]
- 13.Pedersen CT, Kay GN, Kalman J, Borggrefe M, Della-Bella P, Dickfeld T, et al. EHRA/HRS/APHRS expert consensus on ventricular arrhythmias. Europace. 2014;16:1257–83. [DOI] [PubMed] [Google Scholar]
- 14.Nakajima K, Okuda K, Matsuo S, Kiso K, Kinuya S, Garcia EV. Comparison of phase dyssynchrony analysis using gated myocardial perfusion imaging with four software programs: Based on the Japanese Society of Nuclear Medicine working group normal database. J Nucl Cardiol. 2017;24:611–21. [DOI] [PMC free article] [PubMed] [Google Scholar]
- 15.Kano N, Okumura T, Isobe S, Sawamura A, Watanabe N, Fukaya K, et al. Left ventricular phase entropy: Novel prognostic predictor in patients with dilated cardiomyopathy and narrow QRS. J Nucl Cardiol. 2017;25:1677–87. [DOI] [PubMed] [Google Scholar]
- 16.Van Kriekinge SD, Nishina H, Ohba M, Berman DS, Germano G. Automatic global and regional phase analysis from gated myocardial perfusion SPECT imaging: application to the characterization of ventricular contraction in patients with left bundle branch block. J Nucl Med. 2008;49:1790–7. [DOI] [PubMed] [Google Scholar]
- 17.Takahashi K, Uchiyama H, Yanagisawa S, Kamae I. The logistic regression and ROC analysis of group-based screening for predicting diabetes incidence in four years. Kobe J Med Sci. 2006;52:171–80. [PubMed] [Google Scholar]
- 18.Su JQ, Liu JS. Linear combinations of multiple diagnostic markers. J Am Stat Assoc. 1993;88:1350–5. [Google Scholar]
- 19.Wassenaar R, O’Connor D, Dej B, Ruddy TD, Birnie D. Optimization and validation of radionuclide angiography phase analysis parameters for quantification of mechanical dyssynchrony. J Nucl Cardiol. 2009;16:895–903. [DOI] [PubMed] [Google Scholar]
- 20.O’Connell JW, Schreck C, Moles M, Badwar N, DeMarco T, Olgin J, et al. A unique method by which to quantitate synchrony with equilibrium radionuclide angiography. J Nucl Cardiol. 2005;12:441–50. [DOI] [PubMed] [Google Scholar]
- 21.Zhou W, Hung GU. Left-ventricular mechanical dyssynchrony in the prognosis of dilated cardiomyopathy: Which parameter is more useful. J Nucl Cardiol. 2017. 10.1007/s12350-017-0863-6. [DOI] [PubMed] [Google Scholar]
- 22.Wang L, Yang MF, Cai M, Zhao SH, He ZX, Wang YT. Prognostic significance of left ventricular dyssynchrony by phase analysis of gated SPECT in medically treated patients with dilated cardiomyopathy. Clin Nucl Med. 2013;38:510–5. [DOI] [PubMed] [Google Scholar]
- 23.Kim JH, Jang HS, Bae BS, Shin SM, Kim KJ, Park JG, et al. Left ventricular dyssynchrony in patients showing diastolic dysfunction without overt symptoms of heart failure. Korean J Intern Med. 2010;25:246–52. [DOI] [PMC free article] [PubMed] [Google Scholar]
- 24.Boogers MJ, Chen J, Veltman CE, van Bommel RJ, Mooyaart EA, Al YI, et al. Left ventricular diastolic dyssynchrony assessed with phase analysis of gated myocardial perfusion SPECT: a comparison with tissue Doppler imaging. Eur J Nucl Med Mol Imaging. 2011;38:2031–9. [DOI] [PMC free article] [PubMed] [Google Scholar]
- 25.Hsu TH, Huang WS, Chen CC, Hung GU, Chen TC, Kao CH, et al. Left ventricular systolic and diastolic dyssynchrony assessed by phase analysis of gated SPECT myocardial perfusion imaging: a comparison with speckle tracking echocardiography. Ann Nucl Med. 2013;27:764–71. [DOI] [PubMed] [Google Scholar]
Associated Data
This section collects any data citations, data availability statements, or supplementary materials included in this article.