

Abstract
Background & aims:
Patients with cirrhosis secondary to chronic hepatitis C (HCV) are at risk for hepatocellular carcinoma (HCC) despite a sustained virological response (SVR). We examined whether post-SVR liver stiffness measurement (LSM) could be used to stratify HCC risk.
Methods:
This was a retrospective cohort study of 1,850 participants identified from the Veterans Health Administration, with HCV cirrhosis and SVR, followed up over 5099 person-years, from the time of post-SVR elastography until death, HCC, or the end of the study.
Results:
The risk of HCC increased by 3% with every 1 kPa increase in LSM (adjusted Hazard Ratio [aHR] 1.03, 95% confidence interval [CI] 1.01–1.04, p<0.001) and decreased with the number of years from SVR (aHR 0.79, 0.70–0.90, p=0.0003). The adjusted annual risk of HCC was 2.03% among participants with post-SVR LSM <10 kPa, 2.48% in LSM 10–14.9 kPa (aHR 1.71, 95% CI 1.01–2.88, p=0.046), 3.22% for LSM 15–19.9 kPa (aHR 1.59, 95% CI 0.78–3.20, p=0.20), 5.07% among LSM 20–24.9 kPa (aHR 2.55, 95% CI 1.30–5.01, p=0.01), and 5.44% in LSM≥25 kPa (aHR 3.03, 95% CI 1.74–5.26, p<0.0001). The adjusted annual risk of HCC was < 0.4% in participants with LSM< 5 kPa and without diabetes mellitus.
Conclusions:
LSM predicts rates of HCC in patients with HCV cirrhosis after SVR at multiple cutoff levels and offers a single test to predict portal hypertension-related complications and HCC. Patients with LSM <5 kPa in the absence of diabetes mellitus had a low risk of HCC where surveillance could be discontinued.
Keywords: Liver Cancer, Fibroscan, cancer surveillance, Baveno VII, Fib-4, liver elastography
Graphical Abstract

Introduction:
Although an estimated 843,000 individuals have been successfully treated with Direct Acting Antiviral therapy (DAAs) between 2014 and 2020, a substantial number with cirrhosis at the time of sustained virological response (SVR) and require continued follow-up for Hepatocellular carcinoma (HCC). However, fibrosis regresses post-SVR even in patients with cirrhosis, and the risk of HCC decreases with time from SVR. No stopping rules have been described to identify patients who can discontinue HCC surveillance. Additionally, tools are needed to identify patients at the highest risk, to prioritize HCC surveillance as part of a surveillance program.
Current guidelines recommend using LSM to predict the risk of variceal hemorrhage.2 The Baveno VII criteria “rule of 5” has been proposed as a non-invasive method to identify clinically significant portal hypertension (CSPH) and associated risks of hepatic decompensation.3 Because LSM is a surrogate marker for portal hypertension and HCC risk increases with portal hypertension and greater fibrosis, LSM may be a surrogate marker for HCC risk.4
Our study aimed to examine whether LSM can be used to stratify the risk of HCC in patients with HCV cirrhosis after SVR, to identify both participants at the highest, as well as low risk potentially below the threshold for surveillance. The secondary aim was to compare the performance of LSM with Fib-4 to identify the performance of both noninvasive markers to predict HCC risk.
Methods:
Study Design
This was a retrospective cohort study using the Veterans Outcomes and Costs Associated with Liver Disease (VOCAL) cohort, with over 120,000 well-characterized veterans with cirrhosis from the Veterans Health Administration (VHA) Corporate Data Warehouse (CDW). The assembly and cohort characteristics have been described previously.5 The VHA is the largest integrated system treating HCV in the United States, with the availability of DAAs to all veterans regardless of the severity of the liver disease.6 Institutional review boards at each participating Veterans Affairs (VA) medical center approved the study and waived the requirement for informed consent.
Inclusion and Exclusion Criteria
Eligibility criteria included patients with cirrhosis aged 18 years or older who were diagnosed with HCV cirrhosis, underwent SVR, and had LSM after SVR.
The diagnosis of cirrhosis was based on the following was assembled using ICD codes for cirrhosis and complications as described in prior publications (Supplementary methods).7 This definition has been shown to have a greater than 97% positive predictive value for the diagnosis of cirrhosis.8
The participants were treated for HCV between 4/4/2008 and 10/16/2021. The treatments included both Interferon and DAA-based therapies.
The diagnosis of HCC was based on ICD-9 code 155.0 or ICD-10 code C22.0.7
Veterans who had LSM after HCC were excluded. The participants were followed up until the development of HCC, death, or the end of the study (March 1st, 2022).
Liver Elastography Data
Vibration-controlled transient elastography (TE, FibroScan; Echosens, Paris, France) was used for the LSM. All measurements were performed after a minimum fasting period of 4 hours.
Reports for TE for each participant were extracted from the CDW using Natural Language Processing (NLP), using keywords included in a standardized national template and from notes, and are described in Supplementary methods. Only the most recent study included participants with multiple elastography studies. The baseline was defined as the date of elastography.
Participants were categorized based on the LSM, measured in kilo Pascals (kPa), using the rule of 5 (<10, 10–14.9, 15–19.9, 20–24.9, and ≥25), similar to what was described by the Baveno VII group for categorization of portal hypertension-related complications, without incorporation of the platelet count.
Variables
Patient demographics (including sex and self-reported race/ethnicity), and baseline measurements (including age, Body Mass Index [BMI], diabetes mellitus, alcohol use disorders identification test concise (AUDIT-C) score, electronic Child Turcotte Pugh scores (eCTP), MELD-Na, and lab results) at the time closest to the time of LSM were extracted for all patients. Smoking status was assessed at the time of diagnosis of cirrhosis. BMI, eCTP score, and AUDIT-C score were obtained both at baseline and during follow-up. Patients for whom LSM was obtained after the date of HCC were excluded from the sample.
We used laboratory tests that were closest to the LSM date and within six months of the date to calculate the FIB-4 score as follows: (age ×AST)/(platelet count×√ALT).
Three FIB-4 categories were created based on predefined criteria. (<1.45, 1.45–3.25, and ≥3.25).
Statistical Analysis
Descriptive statistics were compared between the groups of liver stiffness measurement scores for all the control variables. P-values were calculated using Wilcoxon tests to compare the median of continuous variables or chi-squared tests for binary and categorical variables. In addition, multivariable Cox hazard models were fit for liver cancer to estimate the unadjusted and adjusted association of HCC with liver stiffness measurement score adjusted for the possible confounders, both as a continuous variable and for every 5 kPa increase in LSM. Adjusted Hazard Ratio (aHR) was calculated after adjusting for the following a priori selected confounders that are known to be associated with HCC risk: age,9 sex,9 race/ethnicity,10 time-varying BMI,11 diabetes mellitus,11 smoking status,12 time-varying AUDIT-C score12, time-varying eCTP score13 and time from SVR.14 Similarly, multivariable Cox hazard models were fit for liver cancer to check the unadjusted and adjusted association with Fib-4 scores at pre-defined cut-offs and the same covariates as above.14
Additionally, we combined the predefined cut-offs of LSM and Fib-4 and examined the hazard of HCC. To preserve an adequate sample size in each sub-category, we used the two cut-offs of Fib-4 (<3.25 and ≥3.25), and three for LSM (<10, 10–19.9, and ≥20), and combined them.
The unadjusted HCC rates per 100 person-years were estimated. Adjusted event rates per 100 person-years were estimated using Poisson regression adjusted for the same covariates used in the multivariable Cox model.
Since there was wide variation among participants in the median time from SVR to elastography, we performed a subgroup analysis of those who underwent elastography within one and three years, respectively of SVR, respectively. Additionally, we performed a subgroup analysis to identify veterans with HCC risk that may be below the annual risk of HCC surveillance of 0.4 per 100 PY15. As ongoing alcohol use and diabetes mellitus are likely to increase the risk of HCC even after SVR, we identified patients with low LSM with or without one or both of these risk factors to identify those below the threshold warranting HCC surveillance.
Statistical significance was defined as P <0.05. Statistical analysis was performed using SAS (version 9.4; SAS Inc., Cary, NC, USA).
Results
Study Population
In total, 24,596 participants with HCV cirrhosis in the VOCAL cohort achieved SVR during the study period. Of these, 3154 underwent elastography after SVR.
Comparison of baseline characteristics (at the time of cirrhosis diagnosis) indicate that participants who received elastography were less likely to be white (45.4 vs. 52.9%), diabetic (44.6 vs. 50.1%, p<0.0001), had portal hypertension (72.5 vs. 82.1%, p<0.0001), and more likely to be black (37.6 vs. 31.2%) and well-compensated (91.5 vs. 82.9%, p<0.0001) (Supplementary Table 1). Other baseline variables between the elastography and non-elastography groups, respectively, while statistically significant, were not clinically meaningful, including age (61.9 vs. 60.9 years, p<0.0001), BMI (27.8 vs. 28.1, p=0.01), and high AUDIT-C (17.2 vs. 18.9%, p=0.03).
Baseline characteristics
Of the 3154 patients with HCV cirrhosis who achieved SVR and underwent LSM after SVR, 1026 had either missing LSM measurements, less than ten valid measurements for LSM, or an IQR%>30%, and an additional 278 who had the outcome (HCC) before LSM were excluded. This left 1850 participants for the final analysis. (Figure 1)
Figure 1:
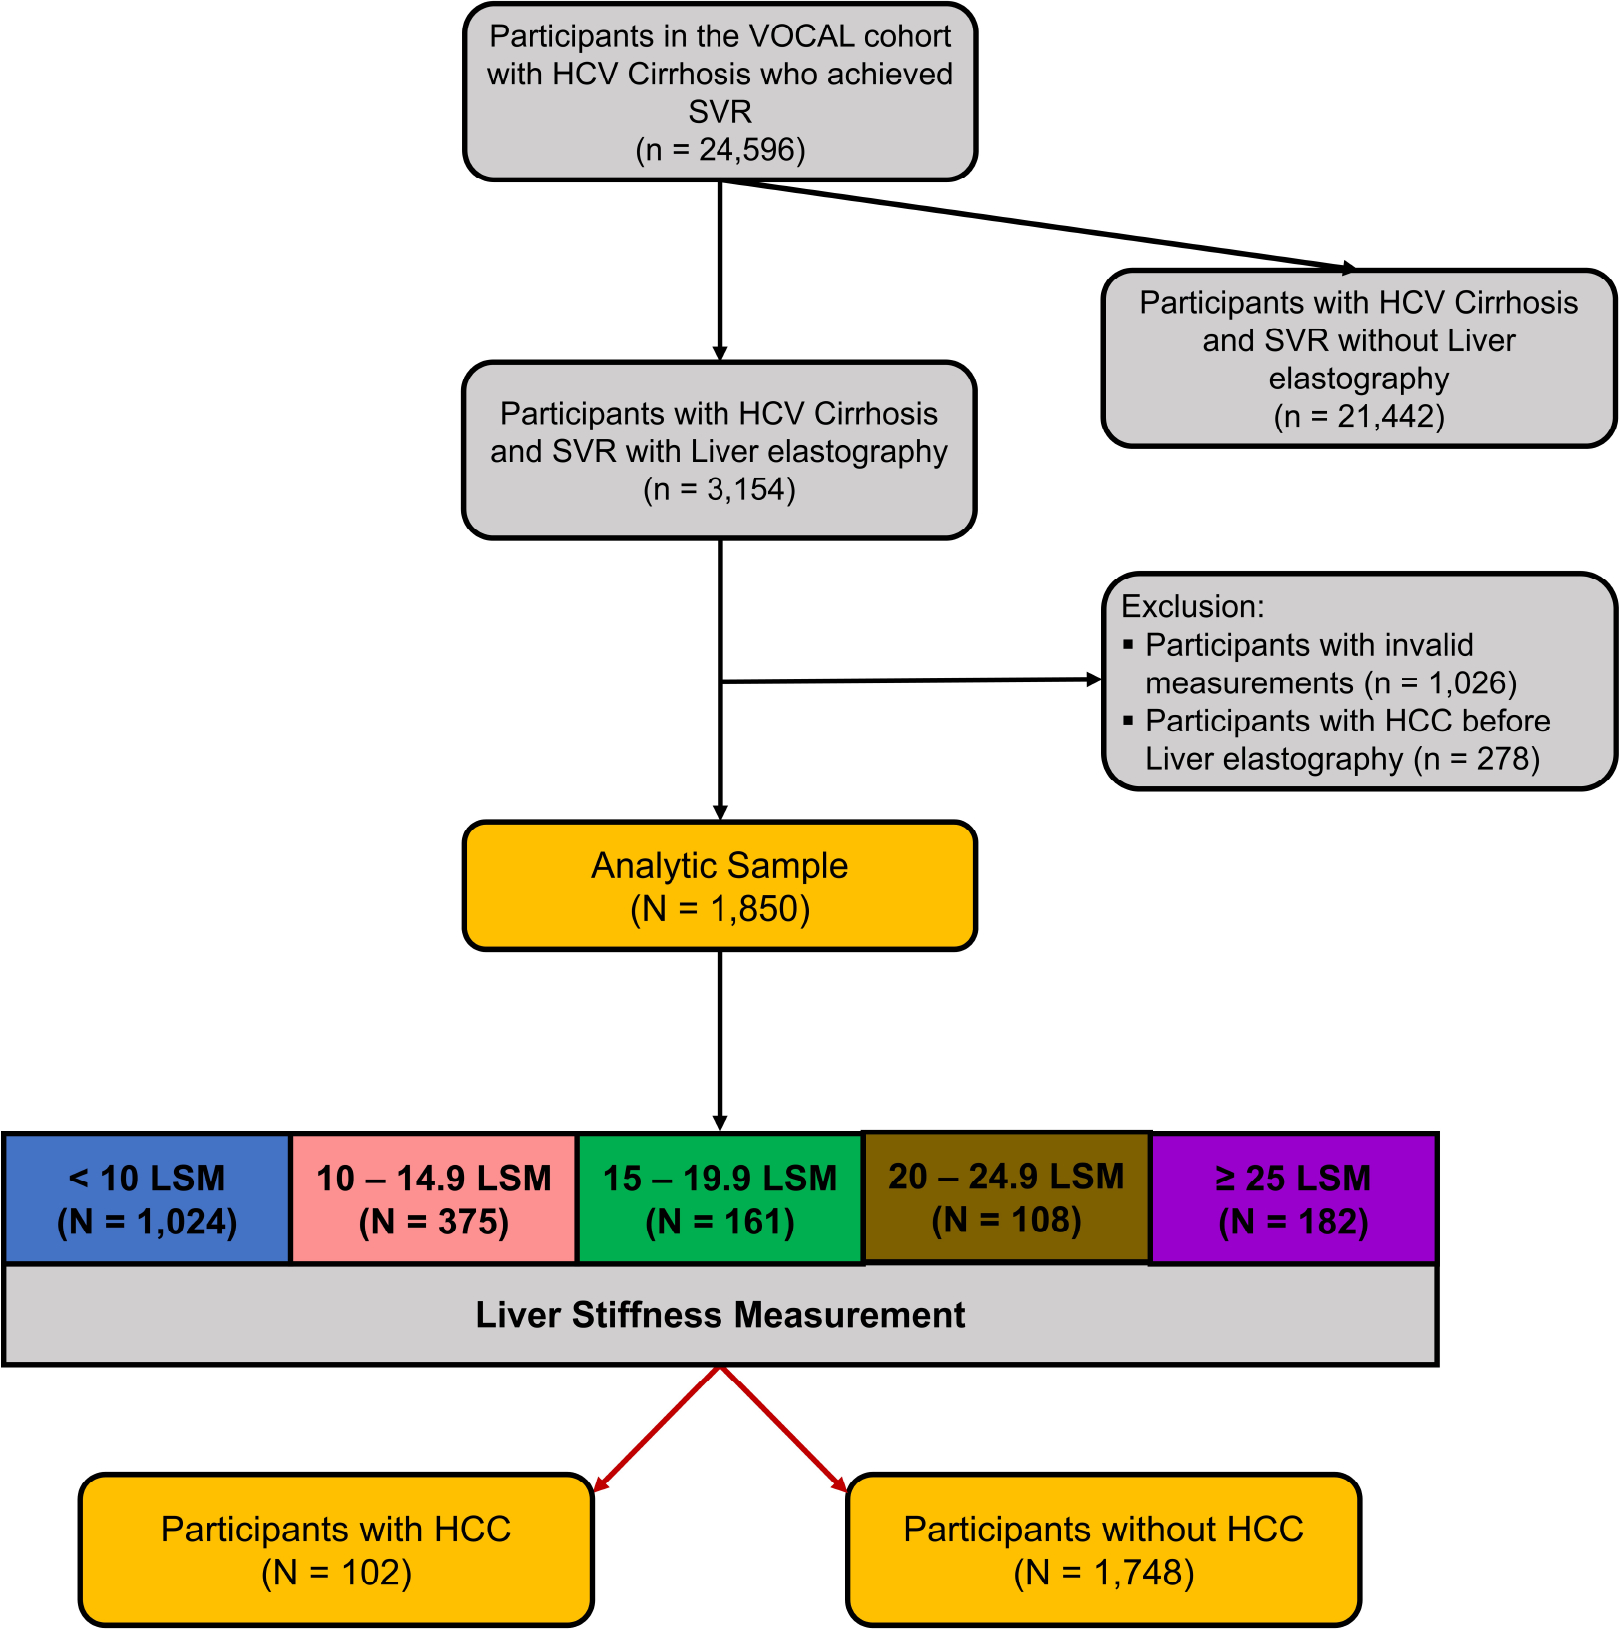
Study flow chart
The median age of the overall study sample was 66.2 years (interquartile range [IQR] 6.8) (Table 1). The cohort was predominantly male (n=1802, 97.4%) and white (n=827, 44.7%); however, a significant proportion (n=701, 37.9%) were black. The median BMI was 28.0 (IQR 6.4); 14.9% (n=275) had a high AUDIT-C score at the time of LSM, and 32.8% (n=606) had a high AUDIT-C score during follow-up. The majority of participants had evidence of portal hypertension (n=1371, 74.1%), and 1311 (70.1%) had a pre-SVR Fib-4 score of ≥3.25. The median controlled attenuation parameter (CAP) score was 264.5 (IQR 87). The XL probe was used in 771 patients (48%).
Table 1:
Baseline Characteristics
| Parameters | Total | <10 LSM | 10–14.9 LSM | 15–19.9 LSM | 20–24.9 LSM | ≥25 LSM | P Value |
|---|---|---|---|---|---|---|---|
|
| |||||||
| Total | n = 1850 | n = 1024 | n = 375 | n = 161 | n = 108 | n = 182 | |
|
| |||||||
| Sex, N (%) | |||||||
| Male | 1802 | 1001 (97.8%) | 363 (96.8%) | 156 (96.9%) | 105 (97.2%) | 177 (97.3%) | 0.8762 |
| Female | 48 | 23 (2.3%) | 12 (3.2%) | 5 (3.1%) | 3 (2.8%) | 5 (2.8%) | |
|
| |||||||
| Age, Median (IQR) | 66.2 (6.8) | 66.9 (6.7) | 66.2 (6.5) | 65.9 (7) | 65.7 (6.4) | 64 (7.2) | <.0001 |
|
| |||||||
| Race / Ethnicity, N (%) | |||||||
| White | 827 | 448 (43.8%) | 180 (48%) | 69 (42.9%) | 45 (41.7%) | 85 (46.7%) | |
| Black | 701 | 412 (40.2%) | 135 (36%) | 63 (39.1%) | 36 (33.3%) | 55 (30.2%) | 0.0851 |
| Hispanic/Latino | 173 | 92 (9%) | 26 (6.9%) | 18 (11.2%) | 14 (13%) | 23 (12.6%) | |
| Other / Unknown | 149 | 72 (7%) | 34 (9.1%) | 11 (6.8%) | 13 (12%) | 19 (10.4%) | |
|
| |||||||
| BMI, Median (IQR) | 27.99 (6.35) | 27.9 (6.04) | 27.58 (6.47) | 27.97 (6.57) | 28.06 (6.43) | 28.96 (6.59) | 0.2468 |
|
| |||||||
| BMI Class, N (%) | |||||||
| Underweight (≤18.4) | 24 | 14 (1.4%) | 5 (1.3%) | 0 (0%) | 2 (1.9%) | 3 (1.7%) | |
| Ideal (18.5–24.9) | 448 | 251 (24.5%) | 101 (26.9%) | 38 (23.6%) | 18 (16.7%) | 40 (22%) | 0.3090 |
| Overweight (25–29.9) | 753 | 433 (42.3%) | 143 (38.1%) | 64 (39.8%) | 48 (44.4%) | 65 (35.7%) | |
| Obesity (≥30) | 625 | 326 (31.8%) | 126 (33.6%) | 59 (36.7%) | 40 (37%) | 74 (40.7%) | |
|
| |||||||
| Diabetes, N (%) | 819 | 423 (41.3%) | 165 (44%) | 74 (46%) | 64 (59.3%) | 93 (51.1%) | 0.0018 |
|
| |||||||
| Current / Former Smoker, N (%) | 1255 | 693 (67.7%) | 239 (63.7%) | 120 (74.5%) | 76 (70.4%) | 127 (69.8%) | 0.1441 |
|
| |||||||
| AUDIT-C Score at LSM, N (%) | |||||||
| Low | 1575 | 888 (86.7%) | 322 (85.9%) | 136 (84.5%) | 94 (87%) | 135 (74.2%) | 0.0005 |
| High | 275 | 136 (13.3%) | 53 (14.1%) | 25 (15.5%) | 14 (13%) | 47 (25.8%) | |
|
| |||||||
| AUDIT-C Score during follow-up, N (%) | |||||||
| Low | 1244 | 699 (68.3%) | 267 (71.2%) | 107 (66.5%) | 65 (60.2%) | 106 (58.2%) | 0.0151 |
| High | 606 | 325 (31.7%) | 108 (28.8%) | 54 (33.5%) | 43 (39.8%) | 76 (41.8%) | |
|
| |||||||
| Cirrhosis Comorbidity Index, N (%) | |||||||
| 0 | 174 | 108 (10.6%) | 35 (9.3%) | 8 (5%) | 6 (5.6%) | 17 (9.3%) | |
| 1+0 | 501 | 278 (27.2%) | 106 (28.3%) | 46 (28.6%) | 28 (25.9%) | 43 (23.6%) | 0.9653 |
| 1+1 | 451 | 240 (23.4%) | 91 (24.3%) | 45 (28%) | 25 (23.2%) | 50 (27.5%) | |
| 3+0 | 60 | 32 (3.1%) | 11 (2.9%) | 6 (3.7%) | 5 (4.6%) | 6 (3.3%) | |
| 3+1 | 662 | 364 (35.6%) | 132 (35.2%) | 56 (34.8%) | 44 (40.7%) | 66 (36.3%) | |
|
| |||||||
| eCTP Class, N (%) | |||||||
| A | 1803 | 1007 (98.3%) | 361 (96.3%) | 157 (97.5%) | 108 (100%) | 170 (93.4%) | 0.0004 |
| B | 47 | 17 (1.7%) | 14 (3.7%) | 4 (2.5%) | 0 (0%) | 12 (6.6%) | |
|
| |||||||
| Lab Results at time of elastography, Median (IQR) | |||||||
| Alanine Aminotransferase (IU/ml) | 24 (11.5) | 23 (10) | 25 (11) | 28 (14) | 29 (12) | 35.5 (22.5) | <.0001 |
| Aspartate Aminotransferase (IU/ml) | 22 (15) | 21(12) | 23 (14.33) | 26 (16) | 27 (16) | 30.5 (21) | <.0001 |
| Platelet Count (x10E9/L) | 176 (75) | 182.25 (74) | 174.5 (70) | 171 (76) | 164 (80.5) | 149.5 (87) | <.0001 |
| Creatinine (mg/dL) | 1.02 (0.41) | 1.04 (0.4) | 1 (0.48) | 1.01 (0.56) | 1.02 (0.49) | 1 (0.49) | 0.4349 |
| Total Bilirubin (mg/dL) | 0.6 (0.45) | 0.6 (0.4) | 0.6 (0.37) | 0.6 (0.5) | 0.6 (0.5) | 0.77 (0.6) | <.0001 |
| MELD-Na | 7 (5) | 7 (5) | 7 (6) | 7 (9) | 8 (6) | 9 (6) | 0.0004 |
|
| |||||||
| Diagnosis of Cirrhosis, N (%) | |||||||
| Portal Hypertension at any time point | 1371 | 700 (68.4%) | 290 (77.3%) | 131 (81.4%) | 90 (83.3%) | 160 (87.9%) | <.0001 |
| Platelet Count (x10E9/L) < 150 at any time point | 1333 | 677 (66.1%) | 282 (75.2%) | 130 (80.8%) | 86 (79.6%) | 158 (86.8%) | 0.4441 |
| Varices at any time point | 250 | 98 (9.6%) | 48 (12.8%) | 28 (17.4%) | 28 (25.9%) | 48 (26.4%) | <.0001 |
| Ascites at any time point | 82 | 21 (2.1%) | 14 (3.7%) | 14 (8.7%) | 7 (6.5%) | 26 (14.3%) | <.0001 |
| FIB-4>3.25 at any time point | 1311 | 652 (63.7%) | 278 (74.1%) | 129 (80.1%) | 90 (83.3%) | 162 (89%) | 0.0454 |
| Liver stiffness>12.5 at any time point | 714 | 83 (8.1%) | 180 (48%) | 161 (100%) | 108 (100%) | 182 (100%) | <.0001 |
|
| |||||||
| Other Elastography parameters, Median (IQR) | |||||||
| IQR | 1.45 (2.41) | 0.9 (0.88) | 1.8 (1.49) | 2.99 (2.29) | 3.83 (3.79) | 6.71 (7.33) | <.0001 |
| IQR Percentage (%) | 14 (9) | 13 (8) | 14 (9) | 16 (10) | 14(11) | 16 (12) | 0.0251 |
| CAP Score | 264.5 (87) | 260.5 (85) | 258 (99) | 274 (86) | 292(106) | 279 (90) | 0.0167 |
|
| |||||||
| Time to Event, Median (IQR) | |||||||
| Time from elastography to HCC in years | 2.8 (2.51) | 2.76 (2.49) | 2.78 (2.52) | 2.94 (2.85) | 3.05 (2.38) | 2.88 (2.22) | 0.6794 |
| Time from SVR to elastography in years | 3.27 (3.55) | 3.58 (3.15) | 2.98 (3.79) | 2.58 (3.76) | 2.83 (3.52) | 2.53 (3.67) | <.0001 |
| Time from SVR to HCC in years | 6.31 (2.38) | 6.46 (2.08) | 6.32 (2.67) | 5.92 (2.35) | 6.33 (2.95) | 5.74 (2.9) | 0.0002 |
|
| |||||||
| Prob Size, N (%) | |||||||
| Medium | 1215 | 656 (64.1%) | 266 (70.9%) | 109 (67.7%) | 68 (63%) | 116 (63.7%) | 0.1509 |
| XL | 635 | 368 (35.9%) | 109 (29.1%) | 52 (32.3%) | 40 (37%) | 66 (36.3%) | |
|
| |||||||
| Treatment, N (%) | |||||||
| Interferon-based Therapy | 759 | 382 (37.3%) | 160 (42.7%) | 78 (48.5%) | 50 (46.3%) | 89 (48.9%) | 0.0032 |
| DAA | 1091 | 642 (62.7%) | 215 (57.3%) | 83 (51.6%) | 58 (53.7%) | 93 (51.1%) | |
Abbreviations: HCC - Hepatocellular Carcinoma; BMI - body mass index; AUDIT-C - Alcohol Use Disorders Identification Test-Concise; eCTP - electronic Child Pugh Turcotte; MELD-Na - Model for End-Stage Liver Disease adding Serum Sodium; FIB-4 - Fibrosis-4 Index; SVR - Sustained Virological Response; IQR - interquartile range; CAP-Controlled Attenuation Parameter
Statistical method/test applied: Chi-Square test (categorical variables); Wilcoxon median test (continuous variables). Values in bold denote statistical significance (p <0.05).
Outcomes
Of the 1850 participants, 102 developed HCC during the study period over a total follow-up time of 5098.49 years. The median time from SVR to LSM was 3.27 (IQR 3.55) years, the median time from LSM to HCC was 2.8 (IQR 2.51) years, and the overall time from SVR to HCC was 6.31 (IQR 2.38) years. Four patients underwent liver transplantation, and 124 died during follow-up.
Association of Liver stiffness measurement as a continuous Variable and HCC
The multivariable Cox model that regressed the time to HCC on the continuous LSM and adjusted for potential confounders estimated that every 1 kPa increase in LSM was associated with a 3% increase in the adjusted hazard of HCC (adjusted hazard rate [aHR] 1.03, 95% CI 1.01–1.04, p<0.0001) (Supplementary Table 2). Male sex was associated with an increased risk of HCC (aHR 4.09, 95% CI 2.54–6.57, p<0.0001), while the time from SVR to LSM was associated with a decreased risk of HCC (aHR 0.79 per year after SVR, 95% CI 0.70–0.90, p=0.0003). Diabetes mellitus was associated with an increased hazard of HCC on univariate analysis but was just below the statistical level of significance on multivariate analysis (aHR 1.45, 95% CI 0.98–2.15, p=0.06). Similarly, there was no association between veterans who were treated with direct-acting antivirals compared to interferon-based therapy (aHR 1.39, 95% CI 0.92–2.11, p=0.12). To evaluate the role of steatosis in HCC risk, we performed a multivariable regression of HCC risk, including CAP scores to the above model (Supplementary Table 3). We observed no association between CAP score and HCC (aHR 0.99, 95% CI 0.95–1.03, p=0.68)
Unadjusted and Adjusted Rates of HCC by 5 kPa Increase in Liver stiffness measurement
Among 1024 participants with LSM<10 KPA, with 2774.3 person-years (PY) of follow-up, the adjusted rate of HCC was 2.03 per 100 PY (Table 2). The annual adjusted rate of HCC was incrementally higher with an increase in post-SVR LSM and was 2.48 per 100 PY in patients with LSM 10–14.9, 3.22 per 100 PY among those with LSM 15–19.9, 5.07 per 100 PY among LSM 20–24.9 kPa, and highest at 5.44 per 100 PY (21 HCC in 507.74 PY of follow up) among patients with LSM of ≥25 kPa.
Table 2:
Unadjusted and adjusted rates of HCC in participants with hepatitis C cirrhosis after SVR, by liver stiffness measurement
| Event | #. Patients | Person-Years | #. Event (%) | Unadjusted event per 100 Person-Years | Adjusted event per 100 Person-Years |
|---|---|---|---|---|---|
|
| |||||
| Liver Stiffness | |||||
| <10 LSM | 1024 | 2774.26 | 36 (3.5%) | 1.82 | 2.03 |
| 10–14.9 LSM | 375 | 1031.11 | 24 (6.4%) | 3.34 | 2.48 |
| 15–19.9 LSM | 161 | 465.10 | 10 (6.2%) | 2.38 | 3.22 |
| 20–24.9 LSM | 108 | 320.28 | 11 (10.2%) | 4.87 | 5.07 |
| ≥25 LSM | 182 | 507.74 | 21 (11.5%) | 5.64 | 5.44 |
Abbreviations: SVR - Sustained Virological Response
Statistical method/test applied: Adjusted event per 100 person-years was calculated using Poisson regression adjusted for the same covariates used in the multivariable model.
On multivariable Cox model, after adjusting for potential confounders, compared to the baseline group with LSM<10 kPa, the adjusted hazard of HCC was 1.71 (95% CI 1.01–2.88, p=0.046) for LSM 10–14.9, 1.59 (95% CI 0.78–3.20, p=0.20) for those with LSM 15–19.9, 2.55 (95% CI 1.30–5.01, p=0.01) for those with LSM 20–24.9, and 3.03 (95% CI 1.74–5.26, p<0.0001) for participants with LSM ≥25 kPa (Table 3 and Figure 2). Additionally, male sex was associated with an increased risk of HCC (aHR 3.93, 95% CI 2.40–6.44, p<0.0001), while the time from SVR was associated with a decrease (aHR 0.80 per year after SVR, 95% CI 0.71–0.90, p=0.0003). Diabetes mellitus was associated with an increased hazard of HCC in univariate analysis but not in multivariate analysis (aHR 1.42, 95% CI 0.96–2.11, p=0.08).
Table 3:
HCC risk by LSM (every 5kPa increase), among patients with HCV cirrhosis after SVR
| Parameters | Adjusted Model | |
|---|---|---|
| aHR (95% CI) | P Value | |
|
| ||
| Number of Patients | 1850 | |
|
| ||
| Liver Cancer | 102 | |
|
| ||
| Liver Stiffness | ||
| <10 LSM | REF | |
| 10–14.9 LSM | 1.71 (1.01, 2.88) | 0.0463 |
| 15–19.9 LSM | 1.59 (0.78, 3.20) | 0.1988 |
| 20–24.9 LSM | 2.55 (1.30, 5.01) | 0.0067 |
| ≥25 LSM | 3.03 (1.74, 5.26) | <.0001 |
|
| ||
| Age at ELASTOGRAPHY | 1.28 (0.96, 1.71) | 0.0891 |
|
| ||
| Sex | ||
| Female | REF | |
| Male | 3.93 (2.40, 6.44) | <.0001 |
|
| ||
| Race / Ethnicity | ||
| White | REF | |
| Black | 1.24 (0.80, 1.90) | 0.3386 |
| Hispanic/Latino | 1.36 (0.73, 2.55) | 0.3336 |
| Other / Unknown | 0.44 (0.16, 1.25) | 0.1112 |
|
| ||
| BMI | ||
| Ideal (18.5–24.9) | REF | |
| Underweight (≤18.4) | 2.09 (0.61, 7.15) | 0.2422 |
| Overweight (25–29.9) | 0.70 (0.43, 1.15) | 0.1586 |
| Obesity (≥30) | 0.87 (0.52, 1.45) | 0.5881 |
|
| ||
| Diabetes | ||
| No | REF | |
| Yes | 1.42 (0.96, 2.11) | 0.0831 |
|
| ||
| Current / Former Smoker | ||
| No | REF | |
| Yes | 1.14 (0.74, 1.75) | 0.5626 |
|
| ||
| AUDIT-C Score (Time updated) | ||
| Low | REF | |
| High | 1.03 (0.70, 1.53) | 0.8744 |
|
| ||
| eCTP Class | ||
| A | REF | |
| B | 1.10 (0.34, 3.61) | 0.8751 |
|
| ||
| Treatment | ||
| Interferon-based Therapy | REF | |
| DAA | 1.41 (0.93, 2.13) | 0.1077 |
|
| ||
| Time from SVR to Elastography in years | 0.80 (0.71, 0.90) | 0.0003 |
Abbreviations: HCV - Hepatitis C Virus; SVR - Sustained Virological Response; BMI - body mass index; AUDIT-C - Alcohol Use Disorders Identification Test-Concise; eCTP - electronic Child Pugh Turcotte; ELASTOGRAPHY - Elastography; HR - Hazard Ratio; aHR - adjusted Hazard Ratio.
Statistical method/test applied: Cox proportional-hazards model. Values in bold denote statistical significance (p<0.05).
Figure 2:
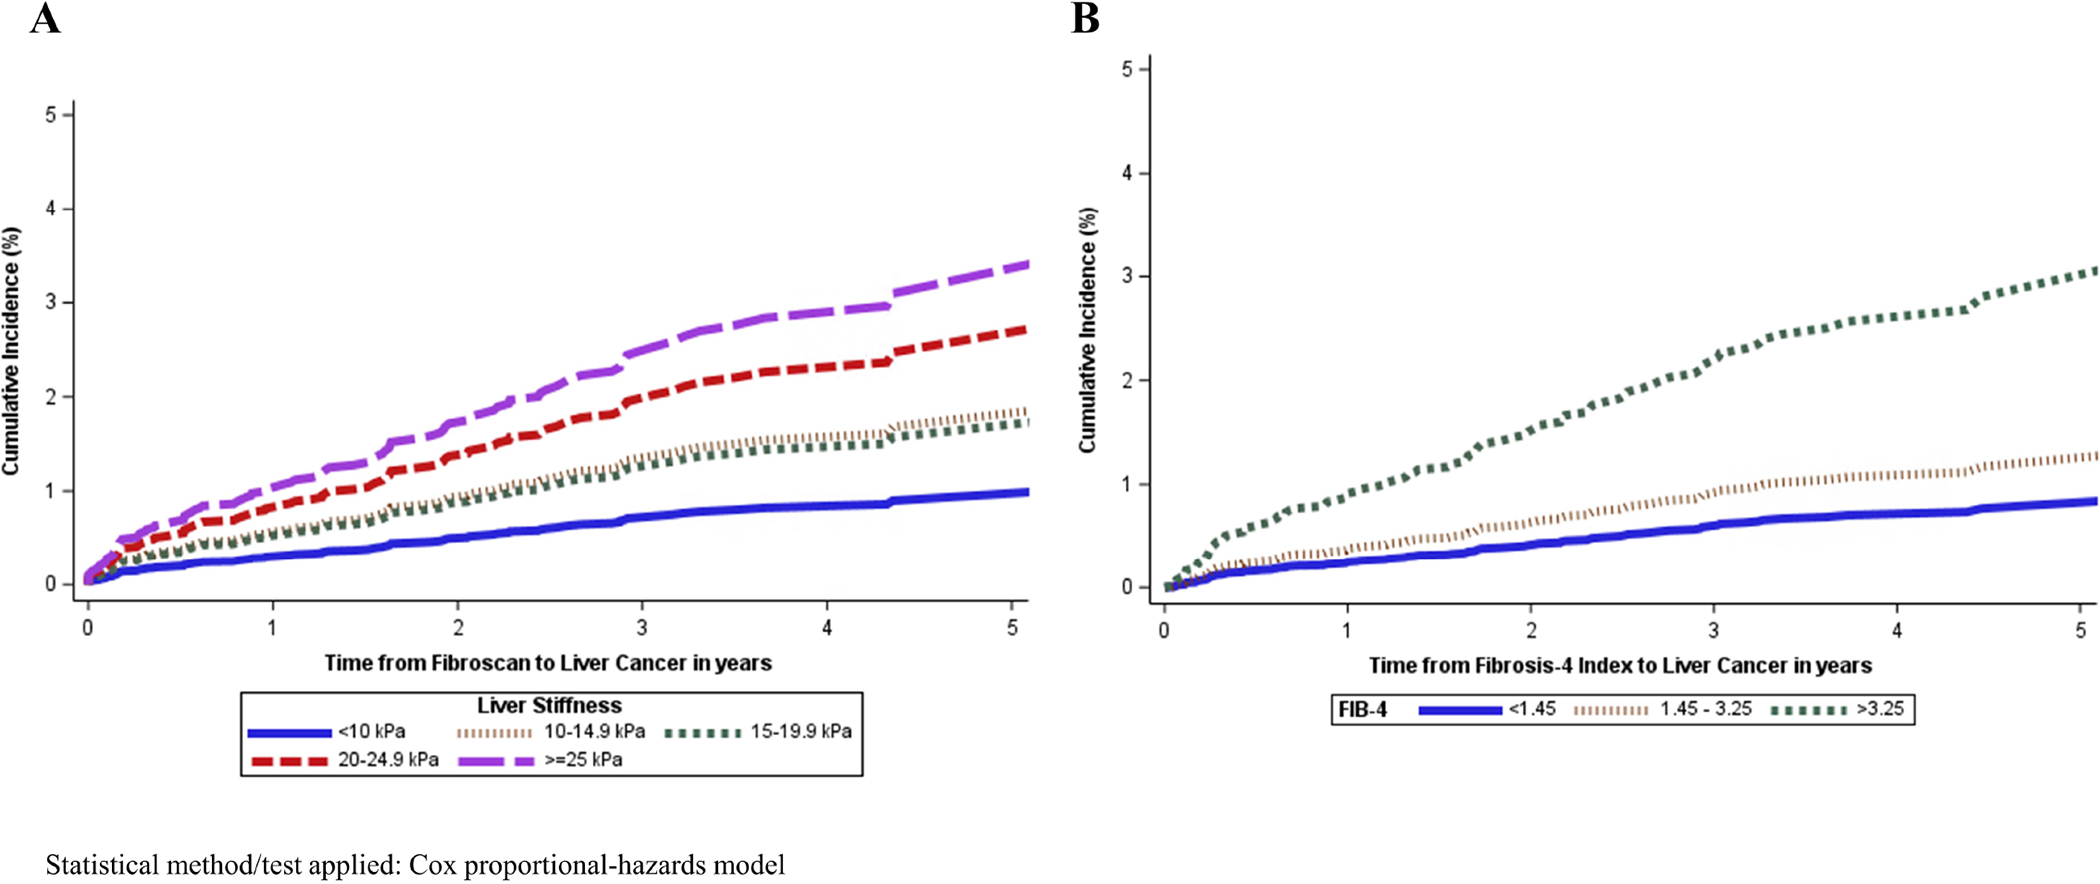
Cumulative incidence of HCC by LSM and FIB-4, among participants with HCV cirrhosis after SVR
Hazard of HCC by Pre-defined Cut-offs of Fib-4
In the multivariable Cox model, after adjusting for potential confounders, compared to the baseline group with Fib-4<1.45, the adjusted hazard rate of HCC was not elevated among participants with Fib-4 of 1.45–3.25 (aHR 1.43, 95% CI 0.80–2.57, p=0.23), but increased among those with Fib-4 ≥3.25, with an adjusted hazard rate of 3.16 (95% CI 1.68–5.97, p=0.0004) (Supplementary Table 4 and Figure 2). Male sex and diabetes mellitus (aHR 1.58, 95% CI 1.07–2.34, p=0.02) were associated with an increased risk of HCC, whereas the time from SVR was associated with a decrease (aHR 0.79 per year after SVR, 95% CI 0.69–0.90, p=0.0003).
We examined the association of APRI with HCC risk using a new model that incorporated APRI (instead of Fib-4). We found that compared to a reference group of APRI ≤ 0.70, risk of HCC was higher in both patients with APRI of 0.71–0.99 (aHR 2.25, 1.23–4.14, p=0.01), and ≥ 1.00 (aHR 2.85, 1.59–5.11, p=0.001). (Supplementary Table 5)
Rates of HCC by Combining Pre-defined cut-offs of LSM and Fib-4
On multivariate analysis, after adjusting for confounders, compared to those with LSM<10 and Fib-4<3.25, participants with LSM 10–19.9 and Fib-4<3.25 had a similar risk of HCC (aHR 1.69, 95% CI 0.98–2.89, p=0.06), as did those with LSM <10 kPA and Fib-4 ≥3.25. (Supplementary Table 6) However, patients in the following groups had elevated risk of HCC: LSM ≥20 and Fib-4<3.25 (aHR 2.62, 95% CI 1.43–4.81, p=0.002), LSM 10–19.9 and Fib-4 ≥3.25 (aHR 3.35, 95% CI 1.61–6.97, p=0.001), and LSM ≥20 and Fib-4≥3.25 (aHR 4.94, 95% CI 2.63–9.27, p<0.0001). (Supplementary Table 5 and Figure 3).
Figure 3:

CIF plot for HCC risk by combining LSM and FIB-4, among patients with HCV cirrhosis after SVR
HCC Risk among participants who had elastography within the first year of SVR
We performed a subgroup analysis of patients who underwent LSM measurement within one year of SVR (Supplementary Table 7). After adjusting for potential confounders, compared to the baseline group with LSM<10 kPa, the adjusted hazard of HCC was 2.93 (95% CI 1.20–7.18, p=0.02) for LSM 10–19.9, and 4.38 (95% CI 1.83–10.48, p<0.0001) for those with LSM ≥20 kPa.
HCC Risk among participants who had elastography within three years of SVR
The findings were similar for patients who underwent elastography within three years of SVR. After adjusting for potential confounders, compared to the baseline group with LSM<10 kPa, the adjusted hazard of HCC was 2.27 (95% CI 1.22–4.21, p=0.01) for LSM 10–19.9, and 3.51 (95% CI 1.84–6.70, p=0.0001) for those with LSM ≥20 kPa (Supplementary Table 8).
Identification of Patients at Low Risk of HCC by Liver Stiffness Measurement
Because patients with LSM<10 kPa had the lowest risk, we analyzed this subgroup to identify those with HCC risk that may be below the annual risk of HCC surveillance.
Among patients with LSM<5kPa and no diabetes, we observed no HCC over 430.9 PY, with an annual rate that was below the recommended surveillance threshold (Supplementary Table 9).
Similarly, among the 621 participants with HCV cirrhosis after SVR with low AUDIT-C (including those with and without diabetes mellitus), the adjusted annual risk of HCC was below the recommended threshold for HCC surveillance in participants with LSM<5kPa (0.38 per 100 PY). The adjusted annual rate of HCC was higher in veterans with LSM<6 kPa (1.30 per 100 PY), LSM<7 (0.81 per 100 PY), LSM<8 kPa (1.36 per 100 PY), and LSM<9 kPa (1.83 per 100 PY).
Among patients with HCV cirrhosis after SVR without high AUDIT-C or diabetes mellitus, the adjusted annual risk of HCC was again the lowest and below the recommended threshold for surveillance in participants with LSM<5kPa at 0 per 100 PY. Participants with an LSM of 6 kPa or higher had annual adjusted HCC rates > 0.4 per 100 PY.
Discussion
Traditionally, the risk of HCC in patients with HCV cirrhosis has been considered fixed. Although the data suggested that HCC risk dropped following SVR, there was limited ability to predict dynamic risk in these patients. Our data indicate that among veterans with HCV cirrhosis who achieved SVR, the risk of HCC increased by 3% for every 1 kPa increase in post-SVR LSM. There was a linear increase in the risk of HCC with every 5 kPa increase in LSM above 10. Compared to the baseline group with LSM<10 kPa, the risk of HCC was significantly elevated among patients with LSM of 10–14.9, 20–24.9, and ≥25. The risk of HCC was not statistically higher in those with LSM of 15–19.9, likely due to a Type II error (post hoc power analysis suggests a power of 47.9% with an alpha error of 0.05). The HCC risk appears to mirror the increasing risk of hepatic decompensation predicted by the Baveno VII criteria rule of 5 (which, however, combines LSM with platelet count). The association between Fib-4 and increased HCC risk compared to the baseline group <1.45 was only observed at the highest cut-off of ≥3.25. The data that combined three cut-offs of LSM and Fib-4 suggest that even among patients with high Fib-4 ≥3.25, the use of LSM is able to identify progressively higher risks of HCC, with patients with Fib-4≥3.25 and LSM ≥25 having the highest risk. The above data may be useful for targeted HCC surveillance to prioritize patients at the highest risk of HCC to target surveillance at the population level.
Additionally, we observed that patients with HCV cirrhosis after SVR who had LSM<5kPa, and without either diabetes mellitus or a high AUDIT-C score had an annual adjusted HCC rate below 0.4 per 100 PY.15 Currently, guidelines recommend that all patients who are once identified as having cirrhosis continue lifelong surveillance, with no stopping rules in these patients unless they are Child C and not transplant candidates.
Our findings also corroborate the known risk factors of HCC observed in other studies, including a higher incidence with male sex, decrease with time from SVR, and no association between DAA use and increased HCC risk.
In a study of 526 individuals with HCV cirrhosis who achieved SVR with a median follow-up of 41 months, Semmler et al. identified an HCC rate of 1.45 per 100 PY in patients with compensated advanced chronic liver disease (cACLD) and 7.0 per 100 PY among patients with decompensated cirrhosis.16 The authors found that a model incorporating post-treatment LSM, albumin, AFP, age, and alcohol consumption predicted de novo HCC development. A prospective two-center study by Pons et al. followed 572 individuals with cACLD who had been treated with DAAs and achieved SVR.17 They found that over a median follow-up of 2.8 years, HCC occurred in 25 patients (at 1.5/100 PY). Our study of 1850 veterans build on the above data, but is also able to demonstrate a linear association between post-SVR LSM and HCC risk, is adequately powered to stratify HCC risk with every 5kPa increase in LSM, and also identify a subgroup of patients in whom HCC risk is low enough for surveillance to be avoided.
The data presented herein has relative strengths. This is a large national cohort of patients who were identified without a tertiary center bias and are therefore more generalizable to the real-world. The follow up over 5000 person-years, as well as the 102 cases of HCC allowed adequate power to identify HCC risk even with the stratification by LSM into five groups, and was powered to identify a subgroup with HCC risk low enough to avoid surveillance.
We acknowledge the following limitations. First, because of its retrospective nature, the study may have been affected by residual confounding. Additionally, we did not adjust for potential confounders like statin exposure. Second, we acknowledge selection bias in patients who underwent SVR and LSM were included in the study. However, we had a large number of participants with LSM<10 kPa and > LSM >25 kPa, suggesting that the results are generalizable to participants across the LSM spectrum. Third, the proportion of females was low in this Veteran cohort. The multivariable analysis observed in our analysis and published data show that females have a significantly lower risk of HCC. In addition to the lower biological risk, females may have different concomitant risk factors such as NAFLD and alcohol misuse. A subgroup analysis of female participants in our study did not accrue adequate numbers of HCC cases to run a multivariable analysis; therefore, more studies are needed to determine whether our findings are generalizable and applicable to female participants. Fourth, we identified participants using a combination of ICD codes for cirrhosis with or without portal hypertension. The definitions we used have been shown to have a high positive predictive value in the veteran population. Fifth, we acknowledge survivor bias since only participants who achieved SVR and survived LSM before HCC received one. Our data (and others) have shown that the risk of HCC decreases with time, and the time from SVR was incorporated into the multivariable model.14
In participants with HCV cirrhosis post-SVR, an increase in LSM predicts higher rates of HCC. A 5kPa increase in LSM above 10 is able to stratify the risk of HCC at multiple cut-off levels, compared to dichotomous risk stratification by Fib-4. Additionally, participants with LSM<5 kPa without diabetes mellitus and/or high AUDIT-C have a low risk of HCC and surveillance could potentially be discontinued. Pending confirmation in prospective studies, liver elastography may offer a single test for predicting the risk of hepatic decompensation and HCC in patients with HCV cirrhosis after SVR. Based on the Baveno VII guidelines, patients with cACLD are recommended to repeat LSM every 12 months.3 We believe that the same can be applied to patients with HCV cirrhosis, and an LSM of <5 kPa in the absence of diabetes be potentially used to defer HCC surveillance.
Supplementary Material
What you need to know:
Background:
Patients with cirrhosis from chronic hepatitis C (HCV) are at risk for liver cancer (HCC) despite cure of HCV. We studied 1,850 participants with HCV cirrhosis and cured HCV, to see if Liver stiffness measurement (LSM) using elastography can predict risk of HCC.
Findings:
We find that the risk of HCC increased by 3% with every 1 unit increase in LSM. Non-diabetic patients with LSM<5 kPa had low HCC risk.
Implications for Patient Care:
Liver stiffness measurement may help to identify participants with HCV cirrhosis who no longer require HCC surveillance and help to prioritize those at increased risk.
Grants and Funding:
Services supporting this analysis and interpretation of data of this research project were generated by the VCU Massey Cancer Center Biostatistics Shared Resource, supported in part by funding from the NIH-NCI Cancer Center Support Grant P30 CA016059.
Footnotes
Conflicts of Interests: Dr. John reported no conflicts of interest related to this study. He received institutional research support from Gilead, Exact Sciences, and Glycotest Inc. He served on the advisory board for GSK, Astra Zeneca, and as a speaker for GSK. Dr. Kaplan received institutional research support from Gilead Sciences, Glycotest Inc., Astra Zeneca, Bayer, and Exact Sciences. None of the other authors has any personal or financial conflicts of interest concerning this publication.
Disclaimer: The authors prepared this study based on their personal capacity. The opinions expressed in this article are the author’s own and do not reflect the views of the Department of Veterans Affairs or the United States government.
Publisher's Disclaimer: This is a PDF file of an unedited manuscript that has been accepted for publication. As a service to our customers we are providing this early version of the manuscript. The manuscript will undergo copyediting, typesetting, and review of the resulting proof before it is published in its final form. Please note that during the production process errors may be discovered which could affect the content, and all legal disclaimers that apply to the journal pertain.
Data Availability Statement:
The United States Department of Veterans Affairs (VA) places legal restrictions on access to veterans’ healthcare data, including identifying data and sensitive patient information. The analytic datasets used in this study cannot leave the VA firewall without a Data Use Agreement. This limitation is consistent with those of other studies based on VA data. However, VA data are freely available to researchers behind the VA firewall, with an approved VA study protocol. For more information, please visit https://www.virec.research.va.gov or contact the VA Information Resource Center (VIReC) at Virec@Va.gov
References:
- 1.Teshale EH, Roberts H, Gupta N, Jiles R. Characteristics of Persons Treated for Hepatitis C Using National Pharmacy Claims Data, United States, 2014–2020, Clinical Infectious Diseases 2022: 75 (6); 1078–1080 [DOI] [PubMed] [Google Scholar]
- 2.Garcia-Tsao G, Abraldes JG, Berzigotti A, Bosch J. Portal hypertensive bleeding in cirrhosis: Risk stratification, diagnosis, and management: 2016 practice guidance by the American Association for the study of liver diseases. Hepatology. 2017. Jan;65(1):310–335 [DOI] [PubMed] [Google Scholar]
- 3.de Franchis R, Bosch J, Garcia-Tsao G, Reiberger T, Ripoll C; Baveno VII Faculty. Baveno VII - Renewing consensus in portal hypertension. J Hepatol. 2022. Apr;76(4):959–974. [DOI] [PMC free article] [PubMed] [Google Scholar]
- 4.Piedade J, Pereira G, Guimarães L, Duarte J, Victor L, Baldin C, et al. Liver stiffness regression after sustained virological response by direct-acting antivirals reduces the risk of outcomes. Sci Rep. 2021. Jun 3;11(1):11681. [DOI] [PMC free article] [PubMed] [Google Scholar]
- 5.John BV, Doshi A, Ferreira RD, Taddei TH, Kaplan DE, Spector SA, et al. Comparison of infection-induced and vaccine-induced immunity against COVID-19 in patients with cirrhosis. Hepatology. 2023. Jan 1;77(1):186–196 [DOI] [PubMed] [Google Scholar]
- 6.US Department of Veteran Affairs Office of Public and Intergovernmental Affairs. VA on path to cure 100,000 veterans of hepatitis C. https://www.va.gov/opa/pressrel/pressrelease.cfm?id=5219. Accessed 7/5/23 [Google Scholar]
- 7.John BV, Dahman B, Deng Y, Khakoo NS, Taddei TH, Kaplan DE, Levy C. Rates of decompensation, hepatocellular carcinoma and mortality in AMA-negative primary biliary cholangitis cirrhosis. Liver Int. 2022. Feb;42(2):384–393 [DOI] [PMC free article] [PubMed] [Google Scholar]
- 8.Ioannou GN, Green P, Lowy E, et al. Differences in hepatocellular carcinoma risk, predictors and trends over time according to etiology of cirrhosis. PLoS One 2018;13:e0204412. [DOI] [PMC free article] [PubMed] [Google Scholar]
- 9.Liu P, Xie SH, Hu S, Cheng X, Gao T, Zhang C, Song Z. Age-specific sex difference in the incidence of hepatocellular carcinoma in the United States. Oncotarget. 2017. Jul 12;8(40):68131–68137 [DOI] [PMC free article] [PubMed] [Google Scholar]
- 10.Mathur AK, Osborne NH, Lynch RJ, Ghaferi AA, Dimick JB, Sonnenday CJ. Racial/Ethnic Disparities in Access to Care and Survival for Patients With Early-Stage Hepatocellular Carcinoma. Arch Surg. 2010;145(12):1158–1163 [DOI] [PubMed] [Google Scholar]
- 11.Polesel J, Zucchetto A, Montella M, Dal Maso L, Crispo A, La Vecchia C, et al. The impact of obesity and diabetes mellitus on the risk of hepatocellular carcinoma. Ann Oncol. 2009. Feb;20(2):353–7 [DOI] [PubMed] [Google Scholar]
- 12.Petrick JL, Campbell PT, Koshiol J et al. Tobacco, alcohol use and risk of hepatocellular carcinoma and intrahepatic cholangiocarcinoma: The Liver Cancer Pooling Project. Br J Cancer. 2018. Apr;118(7):1005–1012 [DOI] [PMC free article] [PubMed] [Google Scholar]
- 13.Peng Ying; Qi Xingshun; Guo Xiaozhong. Child–Pugh Versus MELD Score for the Assessment of Prognosis in Liver Cirrhosis: A Systematic Review and Meta-Analysis of Observational Studies. Medicine 95(8):p e2877, February 2016 [DOI] [PMC free article] [PubMed] [Google Scholar]
- 14.Ioannou GN, Beste LA, Green PK et al. Increased Risk for Hepatocellular Carcinoma Persists Up to 10 Years After HCV Eradication in Patients With Baseline Cirrhosis or High FIB-4 Scores. Gastroenterology. 2019. Nov;157(5):1264–1278 [DOI] [PMC free article] [PubMed] [Google Scholar]
- 15.Parikh ND, Singal AG, Hutton DW, Tapper EB. Cost-Effectiveness of Hepatocellular Carcinoma Surveillance: An Assessment of Benefits and Harms. Am J Gastroenterol. 2020. Oct;115(10):1642–1649 [DOI] [PMC free article] [PubMed] [Google Scholar]
- 16.Semmler G, Meyer EL, Kozbial K, Schwabl P, Hametner-Schreil S, Zanetto A, et al. HCC risk stratification after cure of hepatitis C in patients with compensated advanced chronic liver disease. J Hepatol. 2022. Apr;76(4):812–821. doi: 10.1016/j.jhep.2021.11.025. [DOI] [PubMed] [Google Scholar]
- 17.Pons M, Rodríguez-Tajes S, Esteban JI, Mariño Z, Vargas V, Lens S, et al. Non-invasive prediction of liver-related events in patients with HCV-associated compensated advanced chronic liver disease after oral antivirals. J Hepatol. 2020. Mar;72(3):472–480 [DOI] [PubMed] [Google Scholar]
Associated Data
This section collects any data citations, data availability statements, or supplementary materials included in this article.
Supplementary Materials
Data Availability Statement
The United States Department of Veterans Affairs (VA) places legal restrictions on access to veterans’ healthcare data, including identifying data and sensitive patient information. The analytic datasets used in this study cannot leave the VA firewall without a Data Use Agreement. This limitation is consistent with those of other studies based on VA data. However, VA data are freely available to researchers behind the VA firewall, with an approved VA study protocol. For more information, please visit https://www.virec.research.va.gov or contact the VA Information Resource Center (VIReC) at Virec@Va.gov