Abstract
Objective
Acute respiratory infections are a major global public health concern. However, there are few epidemiological studies investigating pathogens associated with respiratory tract infections in Guizhou Province, China.
Methods
We collected 17,850 blood samples from Guizhou Provincial People’s Hospital between November 2018 and May 2023 to investigate the epidemiological characteristics of respiratory pathogens and their spread during the SARS-CoV-2 epidemic in Guizhou Province.
Results
We identified influenza virus and Mycoplasma pneumoniae as the predominant pathogens involved in acute respiratory infections in the study area. Immunoglobulin M positivity for respiratory syncytial virus, influenza virus, and M. pneumoniae showed a strong correlation with the clinical diagnosis of pneumonia. Seasonal epidemic patterns were observed for influenza A and B viruses. Following the SARS-CoV-2 outbreak, there was a significant decrease in the positive rates for most respiratory pathogens, particularly influenza A and B, Legionella pneumophila, and respiratory syncytial virus.
Conclusion
This retrospective study contributes to the epidemiological evidence regarding respiratory pathogens in Guizhou Province, thereby enhancing the surveillance network for respiratory pathogens in China and providing valuable guidance for local hospitals.
Keywords: Acute respiratory infection, epidemiology, influenza virus, Mycoplasma pneumoniae, respiratory syncytial virus, SARS-CoV-2
Introduction
Acute respiratory infections (ARIs) pose a serious global public health challenge, given their substantial impact on morbidity and mortality. The World Health Organization ranks ARIs as the fourth leading cause of death worldwide, with nearly 3 million deaths recorded in 2016. These infections particularly affect vulnerable populations, such as children and older adults.1–3 Depending on the site of infection, ARIs can be classified as acute upper respiratory infections (AURIs) and acute lower respiratory infections (ALRIs). AURIs, often referred to as the common cold, encompass various conditions such as rhinitis, laryngitis, and tonsillitis. These infections typically present with mild symptoms and are primarily self-limited diseases.4,5 The clinical symptoms and morbidities associated with ALRIs, such as pneumonia, are more severe than those of AURIs. ALRIs have become the leading cause of hospital admission and in-hospital mortality among children in low- and middle-income developing countries.1,6 China has a high incidence of pneumonia that causes more than 30,000 deaths annually among children aged under 5 years. 7 A variety of pathogens can lead to ARIs, such as influenza virus, adenovirus (AdV), respiratory syncytial virus (RSV), echovirus (ECHO), Legionella pneumophila (LP), and Mycoplasma pneumoniae (MP).1,8,9 Of particular concern is the emergence of SARS-CoV-2 toward the end of 2019, characterized by its high transmissibility, pathogenicity, and fatality rate. This outbreak has posed a serious threat to both the global economy and health security, prompting increased attention to respiratory infectious diseases. In several studies,10–12 polymerase chain reaction has been used to investigate the epidemiological characteristics of respiratory pathogens in various countries. Li et al. 1 conducted a large-scale investigation of the pathogenic and epidemiological characteristics of ARIs in China prior to the SARS-CoV-2 epidemic (2009–2019). The authors found that influenza virus and RSV were common in patients with pneumonia, and RSV was the main pathogen causing ARIs and pneumonia in children. Additionally, Streptococcus pneumoniae and MP had the highest positive detection rates among non-viral pathogens. 1 To understand the etiological characteristics of ARIs in China, epidemiological investigations have been carried out among children, adults, and older adults in several Chinese cities, such as Beijing, 13 Guangzhou, 14 and Shanghai. 15 However, epidemiological studies are lacking on respiratory infection-related pathogens in Guizhou Province, China. Therefore, in this retrospective study, we systematically investigated the etiology of infection and the epidemic characteristics of respiratory infectious disease pathogens in Guizhou Province before and after the SARS-CoV-2 outbreak. Our findings will be of particular importance in enhancing China’s respiratory pathogen surveillance network and providing valuable guidance for local hospitals in treatment protocols.
Methods
Eligibility criteria
This study was conducted at Guizhou Provincial People’s Hospital, one of the largest tertiary hospitals in Guizhou Province. Samples were collected between November 2018 and May 2023 for inclusion in the analysis. All patient details were de-identified for the included samples. All samples underwent immunoglobulin M (IgM) detection for antibodies against the following eight viruses: RSV, AdV, influenza A virus (IAV), influenza B virus (IBV), parainfluenza virus (PIV), coxsackievirus A (CVA), coxsackievirus B (CVB), ECHO, as well as LP, MP, and Chlamydia pneumoniae (CP). The presence of one or more pathogens with positive IgM results was used to classify cases as either past infection or current infection. According to this classification, we conducted analysis of the positive rate, age distribution, seasonal characteristics of infection, and co-infection patterns among the various pathogens. The reporting of this study conforms to the Strengthening the Reporting of Observational Studies in Epidemiology (STROBE) guidelines. 16
Processing and laboratory testing of blood samples
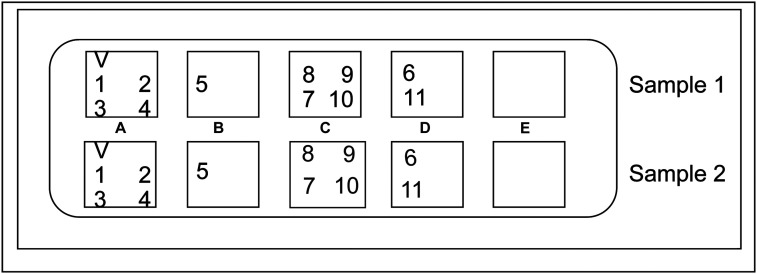
A total of 3 to 5 mL of venous blood was extracted using vacuum blood collection tubes containing ethylenediaminetetraacetic acid (EDTA) anticoagulant. Each sample was slowly and gently mixed five times and centrifuged at 1174 × g for 5 minutes to separate the plasma. The Respiratory tract Profile 1 (IgM) Mosaic indirect immunofluorescence test (FI 2821-1002-16M; EUROIMMUN, Germany) was used to detect RSV, AdV, IAV, IBV, PIV, CVA, CVB, ECHO, LP, MP, and CP IgM. The plasma to be tested was first diluted with a sample dilution (containing IgG and IgA sorbents) at 1:10 and centrifuged at room temperature for 15 minutes or at 575 × g for 5 minutes. The supernatant was then aspirated, followed by dilution with phosphate-buffered saline with Tween-20 (PBST) to 1:100. A 25-μL sample at an appropriate dilution ratio was taken and incubated dropwise for 30 minutes on a matrix sheet coated with the corresponding pathogen. This was followed by washing three times with PBST, with careful removal of excess PBST solution. Subsequently, 25 μL of fluorescein isothiocyanate (FITC)-labeled secondary antibody was added, and the mixture was incubated at room temperature for 30 minutes. After another round of washing three times with PBST, the matrix sheet was sealed with glycerol containing anti-fluorescence quenching agent. The fluorescence of the various pathogens was observed under a fluorescence microscope. For LP and MP, the plasma dilution ratio used was 1:100, and for other pathogens, the plasma dilution ratio was 1:10. Figure 1 illustrates the coating locations of the various pathogen biological matrix sheets.
Figure 1.
Region A was coated with V, 1, 2, 3, and 4 biological substrate sheets, which were quality control, respiratory syncytial virus, adenovirus, influenza A virus, and influenza B virus, respectively. Region B was coated with 5 biological substrate sheet containing parainfluenza virus. Region C was coated with 7, 8, 9, and 10 biological substrate sheets, which were Chlamydia pneumoniae, coxsackievirus B, coxsackievirus A, and echovirus respectively. Region D was coated with 6 and 11 biological substrate sheets, which were Mycoplasma pneumoniae and Legionella pneumophila, respectively.
Data management and analysis
The Department of Clinical Laboratory at Guizhou Provincial People’s Hospital received ISO15189 qualification accreditation (CNAS MT0333) in February 2018. All the staff involved in specimen testing were well-trained, with a high level of professional knowledge, and all procedures adhered to unified standards for test result interpretation. The experimental results were entered into the hospital reporting system according to classification of the detected pathogens. Patients with missing data for clinical diagnosis and personal information were eliminated during the follow-up.
In this study, a total of six age groups were set, as follows: infants (age 0–1 year), toddlers (age >1–3 years), preschool children (age >3–7 years), adolescents (age >7–18 years), adults (age >18–60 years), and older adults (age >60 years). This study was reviewed and approved by the Ethics Committee of Guizhou Provincial People’s Hospital. This was a retrospective study so the requirement for informed consent was waived.
Results
Participants’ characteristics
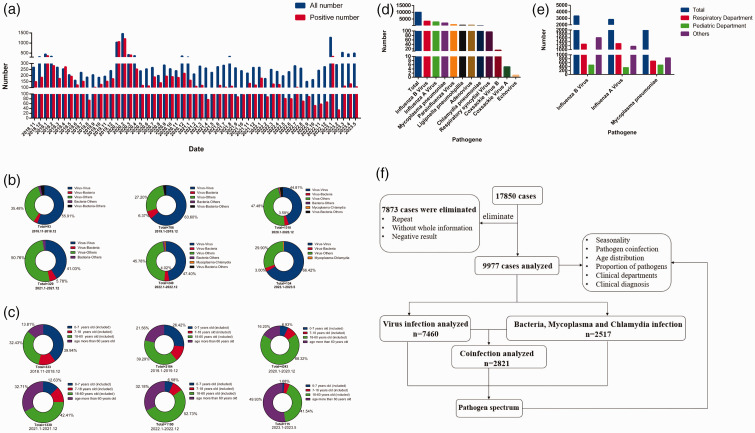
In this study, 17,850 samples were collected from November 2018 to May 2023 and tested for IgM antibodies against 11 respiratory pathogens. Among these samples, 9977 (55.89%) were positive for one or more pathogens (Figure 2a). Notably, there was a rapid increase in the number of patient samples collected during January and February 2020, coinciding with the outbreak of SARS-CoV-2 in December 2019 (Figure 2a). Subsequently, in January 2023, there was another peak in sample volume owing to adjustments in China’s epidemic response, followed by a period OF stabilization (Figure 2a). Prior to the SARS-CoV-2 outbreak (i.e., before December 2019), the lowest number of specimens testing positive for respiratory pathogens was observed in August 2019, with a total of 187 cases and 74 viral positive cases (positive rate of 39.57%) (Figure 2a). After the outbreak of SARS-CoV-2 (from January 2020 to May 2023), the fewest positive specimens was in February 2023, with 290 cases and 34 positive cases (positive rate of approximately 11.72%) (Figure 2a).
Figure 2.
Characteristics of 17,850 blood samples included in this retrospectively analysis. (a) Total number of specimens tested and number of positive samples from November 2018 to May 2023. (b) Proportion of different co-infections at different time points from November 2018 to May 2023. (c) Age distribution of positive cases from November 2018 to May 2023. (d) Number of samples positive for 11 pathogens. (e) Number of samples positive for influenza B virus, influenza A virus, and Mycoplasma pneumoniae in the respiratory and pediatric departments and (f) schematic diagram of follow-up research.
From November 2018 to December 2019, co-infection with different viruses was commonly observed (Figure 2b), particularly co-infections involving IAV and IBV. However, during the period from January 2020 to December 2021, there was an increase in the proportion of co-infections between viruses and other pathogens (Figure 2b), particularly IAV/IBV–MP co-infection. From January 2022 to May 2023, the largest proportion of co-infections involved different viruses (Figure 2b), with IAV–IBV co-infection being particularly common. Regarding age groups, from November 2018 to December 2019, the age groups 0 to 7 years and >18 to 60 years had the highest positive rates (Figure 2c). However, from January 2020 to May 2023, there was a gradual increase in the positive rate among individuals over age 60 years (Figure 2c). Among the 17,850 specimens, the highest positive rates were found for IBV (3363 cases), IAV (2825 cases), and MP (1999 cases), accounting for 18.84%, 15.83%, and 11.20%, respectively (Figure 2d). These pathogens were most commonly detected in the Respiratory Department, accounting for 38.00% (1277/3363), 46.23% (1306/2825), and 34.02% (680/1999) of total cases, respectively (Figure 2e). IBV, IAV, and MP were also common in the Pediatrics Department, accounting for 14.18% (477/3363), 12.39% (350/2825), and 23.86% (477/1999) of cases, respectively (Figure 2e). We subsequently conducted a more in-depth analysis of positive samples, the details of which are depicted in Figure 2f.
Viral positivity rates and pathogen spectra
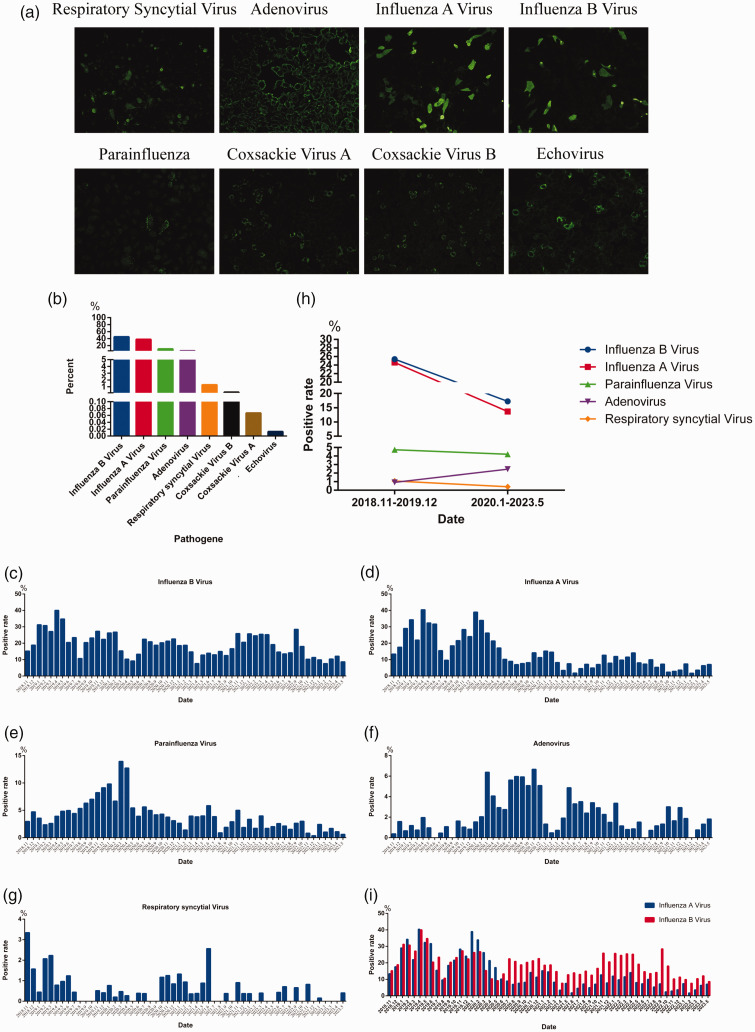
Using indirect immunofluorescence, we detected IgM antibodies against RSV, AdV, IAV, IBV, PIV, CVA, CVB, and ECHO (Figure 3a). Among the 7460 samples that were IgM-positive for viral infection, the most common pathogens were IBV (3363 cases), IAV (2825 cases), and PIV (771 cases), accounting for 45.08%, 37.87%, and 10.34% of cases, respectively (Figure 3b). The most infrequently detected pathogens were CVB (14 cases), CVA (5 cases), and ECHO (1 case), accounting for 0.19%, 0.067%, and 0.013% of cases, respectively (Figure 3b). We performed seasonal epidemic trend analysis for IBV (Figure 3c), IAV (Figure 3d), PIV (Figure 3e), AdV (Figure 3f), and RSV (Figure 3g). Prior to December 2019, the positive rate of IBV increased from January to May and decreased from June to October (Figure 3c). However, the positive rate of IAV was higher in February and April. With implementation of prevention and control measures after the outbreak of SARS-CoV-2, the positive detection rate of IAV decreased significantly after May 2020 (Figure 3d). PIV, AdV, and RSV did not exhibit significant seasonal epidemiological characteristics (Figure 3e–3g). When comparing positive rates of the five viruses (IAV, IAB, AdV, RSV and PIV) before and after the outbreak of SARS-CoV-2, we observed that the positive rate of IBV, IAV, and RSV decreased significantly; however, the positive rate of PIV decreased slightly and the positive rate of AdV increased. We noted an interesting phenomenon in that before December 2019, the positive rates of IAV and IBV were equal. However, from January to May 2020, the positive rate of IAV was significantly higher than that of IBV. From June 2020 to May 2023, the positive rate of IBV was significantly higher than that of IAV, reaching approximately four times the IAV positivity rate (e.g., in September 2022, the IAV positive rate was 7.28% and that of IBV was 28.48%) (Figure 3i)
Figure 3.
Viral positivity rates and pathogen spectra. (a) IgM-positive indirect immunofluorescence maps for respiratory syncytial virus, adenovirus, influenza A virus, influenza B virus, parainfluenza virus, coxsackievirus A, coxsackievirus B, and echovirus. (b) Viral positivity rates for influenza B virus, influenza A virus, parainfluenza virus, adenovirus, respiratory syncytial virus, coxsackievirus A, coxsackievirus B and echovirus. (c–g) Monthly positive rate of influenza B virus (c), influenza A virus (d), parainfluenza virus (e), adenovirus (f), and respiratory syncytial virus (g) from November 2018 to May 2023. (h) Comparison of positive rates for influenza B virus, influenza A virus, parainfluenza virus, adenovirus, and respiratory syncytial virus before (November 2018 to December 2019) and after (January 2020 to May 2023) the outbreak of SARS-CoV-2 and (i) comparison of monthly positive rates of influenza A virus and influenza B virus from November 2018 to May 2023.
Positive rates and pathogen spectra of bacterial, mycoplasma, and chlamydia infections
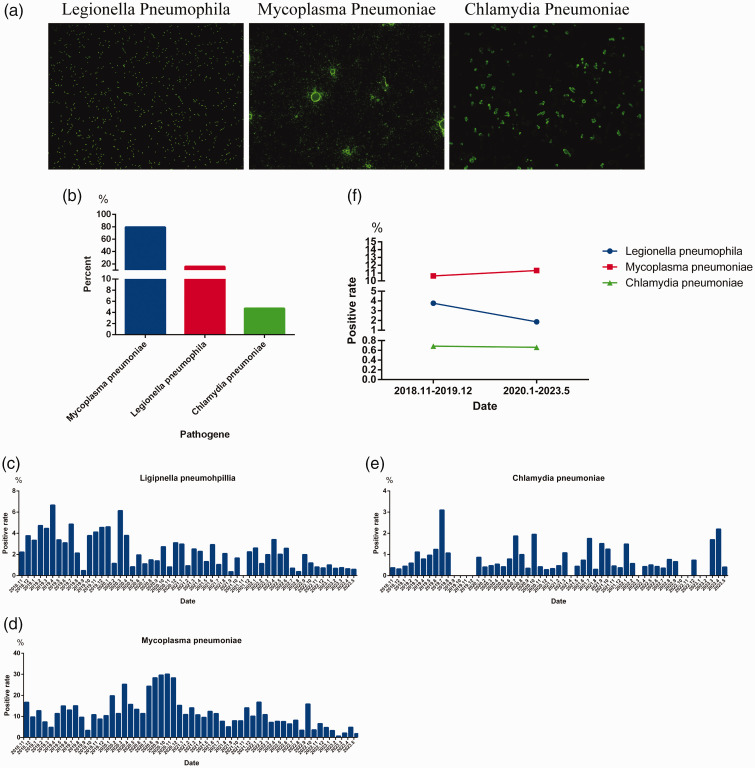
Using indirect immunofluorescence, we detected IgM antibodies against LP, MP, and CP (Figure 4a). Among the 2517 cases with IgM-positive results, LP accounted for approximately 15.85% (399 cases), MP accounted for 79.42% (1999 cases), and CP accounted for 4.73% (119 cases) of the total (Figure 4b). Seasonal epidemiological trends were analyzed for LP (Figure 4c), MP (Figure 4d), and CP (Figure 4e). No clear seasonal characteristics were observed for the infection patterns of LP, MP, and CP (Figure 4c–4e). A comparison of the positive rates for these three pathogens before and after the outbreak of SARS-CoV-2 revealed that the positive rate of LP decreased significantly, the positive rate of CP did not change significantly, and the positive rate of MP increased slightly (Figure 4f).
Figure 4.
Positive rates and pathogen spectra for bacterial, mycoplasma, and chlamydia infections. (a) IgM-positive indirect immunofluorescence maps for Legionella pneumophila, Mycoplasma pneumoniae and Chlamydia pneumoniae. (b) Positive rate for L. pneumophila, M. pneumoniae, and C. pneumoniae. (c–e) Monthly positive rate of L. pneumophila (c), M. pneumoniae (d), and C. pneumoniae (e) from November 2018 to May 2023 and (f) comparison of positive rates for L. pneumophila, M. pneumoniae, and C. pneumoniae before (November 2018 to December 2019) and after (January 2020 to May 2023) the outbreak of SARS-CoV-2.
Patterns of the age-specific viral positivity rate and diagnosis pneumonia
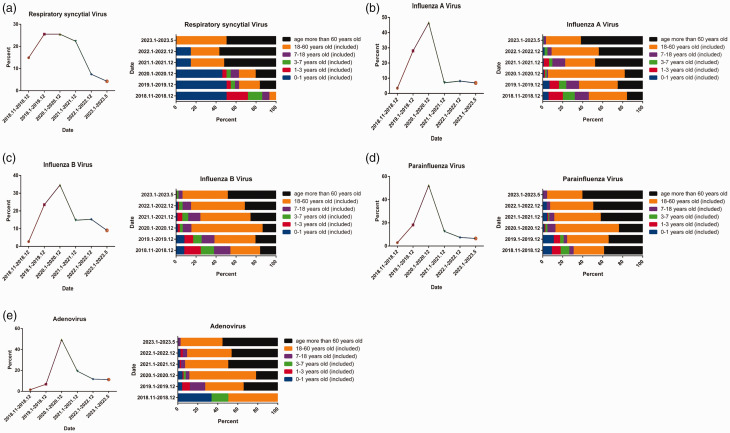
During the SARS-CoV-2 outbreak, there was a significant decrease in the positive rate of RSV (Figures 3h and 5a) and a notable shift in age-specific RSV positivity, shifting from the age group 0 to 1 year old to the group over 60 years old (Figure 5a). The positive rates of IAV and IBV also decreased significantly after December 2020 (Figure 5b and 5c), accompanied by an increase in the proportion of positive cases in the age group over 60 years old (Figure 5b and 5c). Similarly, the positive rate of PIV exhibited a significant decrease after December 2020 (Figure 5d), with a higher proportion of positive cases in the age group over 18 years (Figure 5d). Notably, although the positivity rates of AdV decreased significantly after December 2020 (Figure 5e), these rates remained higher than pre-pandemic levels (i.e., before December 2019) (Figures 3h and 5e), with a higher proportion of positive cases in the age group over 18 years (Figure 5e). We conducted correlation studies to examine the association between positive cases and a clinical diagnosis of pneumonia for RSV, IBV, IAV, PIV, and AdV (Table 1). The strongest correlation was identified for RSV, accounting for approximately 43.75% of cases, followed by IBV, IAV, PIV, and AdV .
Figure 5.
Patterns of age-specific viral positivity rate and diagnosis of pneumonia. (a–e) Positive rates for respiratory syncytial virus, influenza A and B, parainfluenza, and adenovirus at different times from November 2018 to May 2023 (left) and age-specific positive cases (right).
Table 1.
Association of clinical diagnosis of pneumonia with IgM positivity for respiratory syncytial virus (RSV), influenza A virus (IAV), influenza B virus (IBV), parainfluenza virus (PIV), and adenovirus (AdV), 2018–2023.
| Nov–Dec 2018 |
Jan–Dec 2019 |
Jan–Dec 2020 |
Jan–Dec 2021 |
Jan–Dec 2022 |
Jan–May 2023 |
Nov 2018–May 2023 |
||||||||
|---|---|---|---|---|---|---|---|---|---|---|---|---|---|---|
| Pos | Pne | Pos | Pne | Pos | Pne | Pos | Pne | Pos | Pne | Pos | Pne | Pos | Pne | |
| RSV | 14 | 13 | 24 | 10 | 25 | 10 | 21 | 4 | 8 | 3 | 4 | 2 | 96 | 42 (43.75%) |
| IAV | 92 | 27 | 770 | 182 | 1315 | 80 | 247 | 38 | 218 | 42 | 183 | 21 | 2825 | 390 (13.81%) |
| IBV | 101 | 33 | 101 | 190 | 789 | 84 | 1164 | 68 | 496 | 87 | 511 | 45 | 3363 | 507 (15.08%) |
| PIV | 23 | 8 | 143 | 36 | 397 | 28 | 99 | 16 | 58 | 11 | 51 | 4 | 771 | 103 (13.36%) |
| AdV | 6 | 2 | 26 | 5 | 193 | 23 | 75 | 10 | 42 | 11 | 43 | 4 | 385 | 45 (11.69%) |
IgM, immunoglobulin M; Pos, number of positive cases; Pne, number of pneumonia cases.
Values in the table are n or n (%).
Age-specific positivity rates of bacterial, mycoplasma, and chlamydia infections and association with pneumonia diagnosis
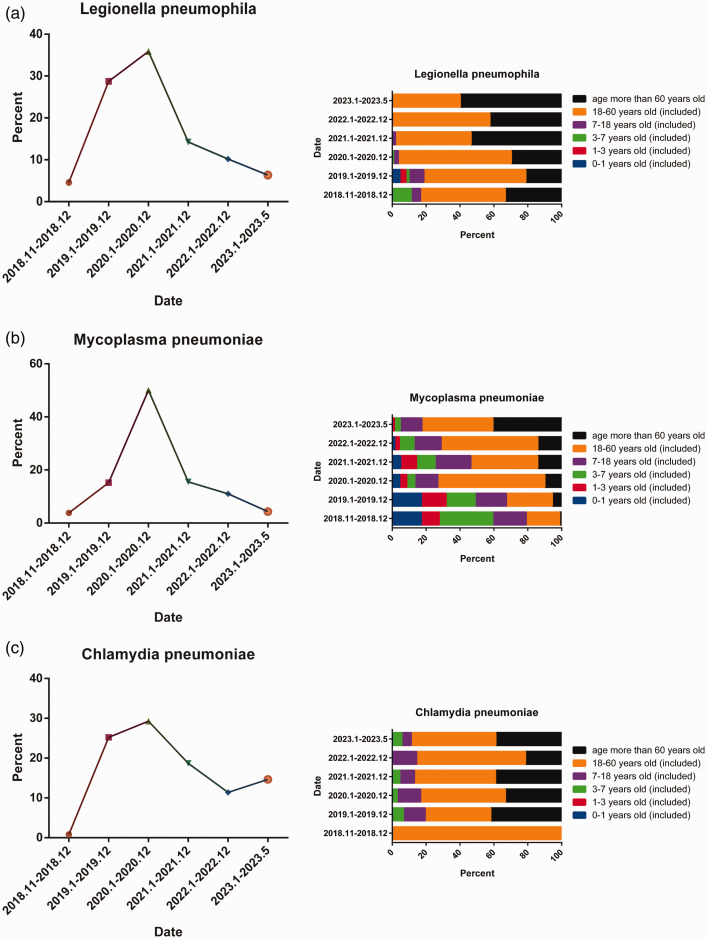
During the SARS-CoV-2 outbreak, there was a significant decrease in the positive rate of LP after December 2020 (Figure 6a). Furthermore, there were notable shifts in age-specific positivity, with a gradual decrease among individuals under 18 years old and an increase among those aged 18 to 60 years and over 60 years old (Figure 6a). Similarly, the positive rate of MP decreased significantly after December 2020 (Figure 6b). Over time, there was a gradual decrease in the proportion of positive cases in the age group 0 to 1 year old whereas the positive rate gradually increased among individuals over 60 years of age (Figure 6b). Additionally, the positive rate of CP decreased significantly after December 2020 (Figure 6c) and exhibited an increase in 2023 (Figure 6c), with no clear change in the age distribution (Figure 6c). We further examined the association between cases that were IgM-positive for LP, MP, and CP and the clinical diagnosis of pneumonia (Table 2). The strongest association with a pneumonia diagnosis was identified for MP, accounting for approximately 17.56% of cases, followed by LP and CP.
Figure 6.
Age-specific positive rates of bacterial, mycoplasma, and chlamydia infections and diagnostic association with pneumonia. (a–c) Positive rates of Legionella pneumophila, Mycoplasma pneumoniae, and Chlamydia pneumoniae at different times from November 2018 to May 2023 (left) and age-specific positive cases (right).
Table 2.
Association of with clinical diagnosis of pneumonia with IgM positivity for Legionella pneumophila (LP), Mycoplasma pneumoniae (MP), and Chlamydia pneumoniae (CP), 2018–2023.
| Nov–Dec 2018 |
Jan–Dec 2019 |
Jan–Dec 2020 |
Jan–Dec 2021 |
Jan–Dec 2022 |
Jan–May 2023 |
Nov 2018–May 2023 |
||||||||
|---|---|---|---|---|---|---|---|---|---|---|---|---|---|---|
| Pos | Pne | Pos | Pne | Pos | Pne | Pos | Pne | Pos | Pne | Pos | Pne | Pos | Pne | |
| LP | 18 | 3 | 114 | 19 | 142 | 16 | 56 | 5 | 44 | 8 | 25 | 4 | 399 | 55 (13.78%) |
| MP | 76 | 43 | 297 | 115 | 1005 | 102 | 314 | 41 | 221 | 42 | 86 | 8 | 1999 | 351 (17.56%) |
| CP | 2 | 0 | 22 | 2 | 37 | 3 | 23 | 2 | 14 | 2 | 21 | 4 | 119 | 13 (10.92%) |
IgM, immunoglobulin M; Pos, number of positive cases; Pne, number of pneumonia cases.
Values in the table are n or n (%).
Discussion
In this study, we examined 17,850 samples collected between November 2018 and May 2023 to detect IgM antibodies for 11 respiratory pathogens, namely, RSV, AdV, IAV, IBV, PIV, CVA, CVB, ECHO, MP, CP, and LP. Although previous studies have analyzed the prevalence and genotype of RSV in Guizhou Province, 17 there are few epidemiological investigations of other respiratory pathogens in this region. Therefore, we aimed to help improve understanding of the transmission characteristics of multiple respiratory pathogens in Guizhou Province and their impact on the epidemic dynamics before and after the outbreak of SARS-CoV-2. Our findings can help enhance knowledge regarding the epidemic characteristics and etiology of respiratory infectious diseases in Guizhou Province and provide insights into the influence of epidemic prevention and control measures on the spread of respiratory pathogens.
Among samples that were IgM-positive against the 11 respiratory pathogens, the most common were for IBV, IAV, and MP (Figure 2d), accounting for approximately 18.84%, 15.83%, and 11.20% of cases, respectively. Influenza viruses accounted for the most positive results. Among the remaining pathogens, MP had the highest proportion of positive results, followed by LP and CP (Figure 2d), which is consistent with a report by Li et al. 1 The positive rate for IBV was higher among adults (>18 years of age). Prior to the outbreak of SARS-CoV-2 (before December 2019), MP infections were observed across all age groups; however, the positive rate decreased in the age group 0 to 1 year old after January 2020 (Figure 6b). Additionally, before December 2019, RSV infections were more common in children aged 0 to 3 years (Figure 5a), which is in line with previous studies.1,4,7,17 However, there was a significant increase in the RSV positivity rates among adults over 18 years of age after the outbreak of SARS-CoV-2 (i.e., after January 2020) (Figure 5a). This finding may be associated with reduced exposure risks owing to restricted mobility during the pandemic, during which time children tended to have limited opportunities to engage in outdoor activities. RSV infection among adults and older adults (>60 years) is a matter of particular concern. Following the outbreak of SARS-CoV-2 (i.e., after December 2019), the positive rates of most respiratory pathogens decreased significantly owing to reduced population movement and improved personal protection measures. This was particularly evident for IBV, IAV, LP, and RSV (Figures 3h and 4f). PIV showed a slight decrease in the positivity rate (Figure 3h), and CP demonstrated no significant change (Figure 4f). Notably, the positive detection rates of AdV and CP showed a slight increase (Figures 3h and 4f). Correlation analysis revealed strong associations of a clinical diagnosis of pneumonia with pathogen positivity for RSV, IBV, IAV, and MP (Tables 1 and 2). Additionally, seasonal trend analysis of LP (Figure 4c), MP (Figure 4d), and CP (Figure 4e) showed no distinct seasonal epidemiological characteristics, which is consistent with previous studies. 1
Two noteworthy findings emerged from our study. (1) From November 2018 to December 2019, virus–virus co-infections were common, particularly IAV–IBV co-infections (Figure 2b). However, from January 2020 to December 2021, the proportion of co-infections involving viruses and other pathogens increased (Figure 2b), especially IAV/IBV–MP co-infections. Subsequently, from January 2022 to May 2023, there was a resurgence of virus–virus co-infections, primarily IAV–IBV co-infections (Figure 2b). We speculate that this phenomenon may be related to the high positive rate of MP observed from January 2020 to December 2021 (Figure 6b), which significantly increased the proportion of IAV/IBV–MP co-infections. (2) The positive rates of IAV and IBV remained relatively stable until December 2019 (Figure 3i). However, from January 2020 to May 2020, the positive rate of IAV greatly surpassed that of IBV (Figure 3i), consistent with previous studies.1,10 From June 2020 to May 2023, the positive rate of IBV exceeded that of IAV by approximately four-fold (Figure 3i), reaching its peak in September 2022 (IAV positive rate: 7.28% and IBV positive rate: 28.48%). The underlying biological characteristics contributing to this distinct epidemic pattern warrant further exploration.
Herein, we report important findings of our comprehensive analysis regarding the etiology of ARIs in Guizhou Province from November 2018 to May 2023. However, there are certain study limitations that should be acknowledged. First, among the 17,850 specimens tested, only 9977 (55.89%) were positive for IgM antibodies, leaving a portion of specimens from patients with respiratory symptoms but with negative IgM results, for which the underlying etiology remains unexplained. IgM detection is used instead of nucleic acid testing to avoid false negatives, and the use of IgG detection for epidemiological profiling may lead to higher positive detection rates owing to the longer duration of IgG antibodies. Therefore, IgM detection is widely used in the investigation of the epidemic characteristics of various pathogens.18–19 Despite these limitations, our analysis of the transmission characteristics of respiratory pathogens contributes to improving understanding of the predominant transmission patterns in Guizhou Province. This information may serve as a valuable reference for subsequent diagnosis, prevention, control, and vaccination strategies in the region.
Supplemental Material
Supplemental material, sj-pdf-1-imr-10.1177_03000605241236050 for Etiological characteristics of acute respiratory infections during the SARS-CoV-2 epidemic in Guizhou Province, China by Xue Fu, Ming-Wang Long, Zhen-Xuan Ye, Hong-Mei Li, Hai-Yan Zhang, Yu He, Bi-Wei Yang, Bo Xu, Hua Zhang in Journal of International Medical Research
Acknowledgements
We would like to thank the staff of the Department of Clinical Laboratory of the Guizhou Provincial People’s Hospital, Guiyang City, China for their help in collecting blood samples. We also thank all study participants for their donated blood samples and support.
Author contributions: Ming-Wang Long, Xue Fu, and Hua Zhang designed the research. Xue Fu, Zhen-Xuan Ye, Hong-Mei Li, Hai-Yan Zhang, and Ming-Wang Long collected blood samples. Yu He, Bi-Wei Yang, and Bo Xu performed a literature review. Xue Fu and Ming-Wang Long provided the study materials. Xue Fu, Zhen-Xuan Ye, Hong-Mei Li, Hai-Yan Zhang, and Ming-Wang Long performed the experiment. Xue Fu, Ming-Wang Long, and Hua Zhang wrote the manuscript and analyzed the data. Xue Fu, Ming-Wang Long, and Hua Zhang performed the article revision. All authors reviewed and approved the final version of the manuscript.
These authors declare that there is no conflict of interest.
Funding: The study was sponsored by the Guizhou Provincial People’s Hospital Youth Fund (no. GZSYQN202218) and Guizhou Provincial People’s Hospital Doctoral Fund (no. GZSYBS201708).
ORCID iD: Ming-Wang Long https://orcid.org/0009-0007-0097-5093
Data availability statement
The data that support the findings of this study are available from Ming-Wang Long (1109022653@qq.com or longmingwang@gz5055.com) upon reasonable request.
References
- 1.Li ZJ, Zhang HY, Ren LL, et al. Chinese Centers for Disease Control and Prevention (CDC) Etiology of Respiratory Infection Surveillance Study Team. Etiological and epidemiological features of acute respiratory infections in China. Nat Commun 2021; 12: 5026. doi: 10.1038/s41467-021-25120-6. [DOI] [PMC free article] [PubMed] [Google Scholar]
- 2.GBD 2019 Diseases and Injuries Collaborators. Global burden of 369 diseases and injuries in 204 countries and territories, 1990-2019: a systematic analysis for the Global Burden of Disease Study 2019. Lancet 2020; 396: 1204–1222. doi:10.1016/S0140-6736(20)30925-9. [DOI] [PMC free article] [PubMed] [Google Scholar]
- 3.World Health Organization. Global Health Estimates 2016: deaths by cause, age, sex, by country and by region, 2000–2016 (2018). http://www.who.int/healthinfo/global_burden_disease/estimates/en/index1.html.
- 4.Tregoning JS, Schwarze J. Respiratory viral infections in infants: causes, clinical symptoms, virology, and immunology. Clin Microbiol Rev 2010; 23: 74–98. doi:10.1128/CMR.00032-09. [DOI] [PMC free article] [PubMed] [Google Scholar]
- 5.Mahony JB. Detection of respiratory viruses by molecular methods. Clin Microbiol Rev 2008; 21: 716–747. doi:10.1128/CMR.00037-07. [DOI] [PMC free article] [PubMed] [Google Scholar]
- 6.Jain S, Williams DJ, Arnold SR, et al. Community-acquired pneumonia requiring hospitalization among U.S. children. N Engl J Med 2015; 372: 835–845. doi:10.1056/NEJMoa1405870. [DOI] [PMC free article] [PubMed] [Google Scholar]
- 7.Zhang Y, Yuan L, Zhang Y, et al. Burden of respiratory syncytial virus infections in China: Systematic review and meta-analysis. J Glob Health 2015; 5: 020417. doi:10.7189/jogh.05.020417. [DOI] [PMC free article] [PubMed] [Google Scholar]
- 8.Griffiths C, Drews SJ, et al. Marchant DJ. Respiratory Syncytial Virus: Infection, Detection, and New Options for Prevention and Treatment. Clin Microbiol Rev 2017; 30: 277–319. doi:10.1128/CMR.00010-16. [DOI] [PMC free article] [PubMed] [Google Scholar]
- 9.Chen Y, Liu F, Wang C, et al. Molecular Identification and Epidemiological Features of Human Adenoviruses Associated with Acute Respiratory Infections in Hospitalized Children in Southern China, 2012-2013. PLoS One 2016; 11: e0155412. doi:10.1371/journal.pone.0155412. [DOI] [PMC free article] [PubMed] [Google Scholar]
- 10.Avolio M, Venturini S, De Rosa R, et al. Epidemiology of respiratory virus before and during COVID-19 pandemic. Infez Med 2022; 30: 104–108. doi:10.53854/liim-3001-12. [DOI] [PMC free article] [PubMed] [Google Scholar]
- 11.Sherif B, Hamza HM, Abdelwahab HEE. Impact of Nested Multiplex Polymerase Chain Reaction Assay in the management of pediatric patients with acute respiratory tract infections: a single center experience. Infez Med 2023; 31: 539–552. doi:10.53854/liim-3104-13. [DOI] [PMC free article] [PubMed] [Google Scholar]
- 12.Leli C, Di Matteo L, Gotta F, et al. Prevalence of respiratory viruses by Multiplex PCR: a four-and-a-half year retrospective study in an Italian general hospital. Infez med 2021; 29: 94–101. [PubMed] [Google Scholar]
- 13.Liu C, Xiao Y, Zhang J, et al. Adenovirus infection in children with acute lower respiratory tract infections in Beijing, China, 2007 to 2012. BMC Infect Dis 2015; 15: 408. doi:10.1186/s12879-015-1126-2. [DOI] [PMC free article] [PubMed] [Google Scholar]
- 14.Zou L, Yi L, Yu J, et al. Adenovirus infection in children hospitalized with pneumonia in Guangzhou, China. Influenza Other Respir Viruses 2021; 15: 27–33. doi:10.1111/irv.12782. [DOI] [PMC free article] [PubMed] [Google Scholar]
- 15.Jiang H, Yang T, Yang C, et al. Molecular epidemiology and clinical characterization of human rhinoviruses circulating in Shanghai, 2012-2020. Arch Virol 2022; 167: 1111–1123. doi:10.1007/s00705-022-05405-x. [DOI] [PMC free article] [PubMed] [Google Scholar]
- 16.Von Elm E, Altman DG, Egger M, et al. The Strengthening the Reporting of Observational Studies in Epidemiology (STROBE) statement: guidelines for reporting observational studies. Ann Intern Med 2007; 147: 573–577. doi:10.7326/0003-4819-147-8-200710160-00010. [DOI] [PubMed] [Google Scholar]
- 17.Zhao T, Ye Z, Wang B, et al. Virus isolation and genotype identification of human respiratory syncytial virus in Guizhou Province, China. Braz J Infect Dis 2019; 23: 427–434. doi:10.1016/j.bjid.2019.10.007. [DOI] [PMC free article] [PubMed] [Google Scholar]
- 18.Khan MA, Imtiaz K, Shafaq H, et al. Screening for arboviruses in healthy blood donors: Experience from Karachi, Pakistan. Virol Sin 2022; 37: 774–777. doi:10.1016/j.virs.2022.07.008. [DOI] [PMC free article] [PubMed] [Google Scholar]
- 19.Fernández Villalobos NV, Kessel B, Torres Páez JC, et al. Seroprevalence of Hepatitis E virus in children and adolescents living in urban Bogotá: An explorative cross-sectional study. Front Public Health 2023; 11: 981172. doi:10.3389/fpubh.2023.981172. [DOI] [PMC free article] [PubMed] [Google Scholar]
Associated Data
This section collects any data citations, data availability statements, or supplementary materials included in this article.
Supplementary Materials
Supplemental material, sj-pdf-1-imr-10.1177_03000605241236050 for Etiological characteristics of acute respiratory infections during the SARS-CoV-2 epidemic in Guizhou Province, China by Xue Fu, Ming-Wang Long, Zhen-Xuan Ye, Hong-Mei Li, Hai-Yan Zhang, Yu He, Bi-Wei Yang, Bo Xu, Hua Zhang in Journal of International Medical Research
Data Availability Statement
The data that support the findings of this study are available from Ming-Wang Long (1109022653@qq.com or longmingwang@gz5055.com) upon reasonable request.


