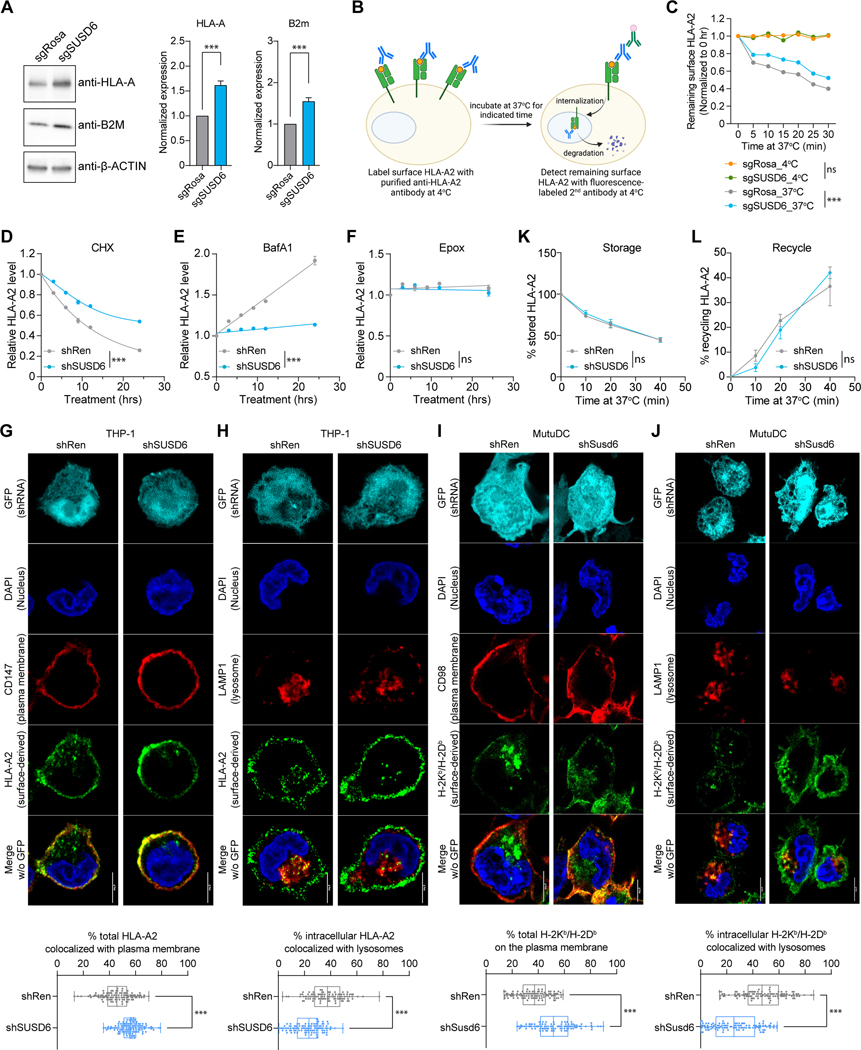
Figure 5. SUSD6 targets MHC-I for lysosomal degradation. See also Figure S5.
(A) Representative western blots (left) and normalized band intensities (right) of HLA-A and B2m in sgRNA-transduced THP-1 cells. (n=5).
(B) Schematic of the surface HLA-A2 internalization assay in sgRNA-transduced THP-1 cells.
(C) Quantifications of the surface-remaining HLA-A2. (n=3)
(D-F) Time course studies of the surface HLA-A2 expression on shRNA-transduced THP-1 cells treated with Cycloheximide (CHX, D), Bafilomycin A1 (BafA1, E), or Epoxomicin (Epox, F) (n=4).
(G-J) Representative confocal images (top) and quantifications (bottom) of the surface-derived MHC-I colocalized with the plasma membrane markers (G and I) or the lysosomal marker (H and J) in THP-1 cells (G and H) or MutuDC cells (I and J) transduced with indicated shRNAs. At least 100 cells were quantified in each group. All scale bars: 5 μm.
(K and L) Flow cytometric analyses of intracellular MHC-I storage (K) and recycle (L) in shRNA-transduced THP-1 cells as described in Figures S5H and S5I, respectively. (for K: n=6; for L: n=4)
Data are presented as the mean ± SEM (A-F, K, and L) or box and whiskers with all data points (G-J). ns, not significant; ***, p<0.001 by two-tailed unpaired Student’s t-test (A), two-way ANOVA for the last time point (C-F, K, and L), or Mann-Whitney test (G-J). sgRosa and shRen were used as controls.

