

Abstract
Background
This study aimed to evaluate the immediate effect of transcatheter aortic valve implantation (TAVI) on mechanical efficiency.
Methods
A total of 46 patients (25 females) with an average age of 83 ± 6.4 years underwent TAVI using the CoreValve system. During the same hospitalization, we conducted a comprehensive comparison of the patients before and after TAVI without inotropic support using echocardiography. The parameters encompassed left ventricular (LV) geometry, valvular load, global LV afterload and ventricular hemodynamics. The analysis using pressure-volume loops enabled the determination of load-independent contractility (Ees) and afterload, in addition to assessing potential energy, stroke work, and mechanical efficiency.
Results
The immediate effect was an augmented aortic valve area accompanied by a reduction in the transvalvular pressure gradient. We observed reductions in left ventricular end-systolic volume and end-diastolic volume, and also reductions in global afterload and end-systolic meridional wall stress. The Ea index decreased, while the Ees index remained relatively stable. We noted increases in stroke volume and systemic arterial compliance, indicating more efficient blood transfer from the ventricle to aorta. These changes contributed to the normalization of ventricular-arterial coupling. In terms of mechanical work of the chamber, we observed significant decreases in potential energy, stroke work, and pressure-volume area. There was an increase in the mechanical efficiency of the chamber.
Conclusions
The TAVI procedure immediately reduced global afterload and improved diastolic compliance of the chamber, resulting in enhanced ventricular function and mechanical efficiency.
Keywords: Mechanical efficiency, Pressure-volume loop, Ventricular-arerial coupling
Abbreviations
AS, Aortic valve stenosis
Ea, Arterial elastance
Ees, Ventricular end systolic elastance
ELI, Indexed energy loss
EOAI, Indexed effective orifice area
LV, Left ventricular
LVMI, Indexed left ventricular mass
LVOT, Left ventricular outflow tract
ME, Mechanical efficiency
PE, Potential energy
PV, Pressure-volume
PVA, Pressure volume area
RWT, Relative wall thickness
SAC, Systemic arterial compliance
SVI, Indexed stroke volume
SVR, Systemic vascular resistance
SW, Stroke work
TAVI, Transcatheter aortic valve implantation
VAC, Ventricular-arterial coupling
WS, Wall stress
Zva, Valvular-arterial impedance
INTRODUCTION
Transcatheter aortic valve implantation (TAVI) has emerged as an option for inoperable high-risk patients with severe aortic stenosis (AS). As left ventricular outflow tract (LVOT) obstruction increases ventricular afterload, the workload and transaortic pressure gradient rise exponentially.1 The chronic pressure overload results in gradual structural modifications and adaptive remodeling. Concentric hypertrophy initiates a cascade of effects, including a disturbance of coronary flow reserve, subsequent post-apoptotic fibrosis, elevated myocardial stiffness, and compromised ventricular diastolic compliance.2,3 Transitional deformations temporarily sustain adequate cardiac output, however they come at the expense of amplified energy consumption and may ultimately contribute to left ventricular dysfunction over time.2,4
The immediate effects of TAVI include aortic valve augmentation and transaortic pressure gradient reduction. This contributes to reduced ventricular afterload and enhanced diastolic compliance, and subsequently reverse remodeling.5,6 This research is centered on identifying the acute impact on ventricular performance. With advanced imaging technology, pressure-volume (PV) loop reconstruction with echocardiography is more feasible for clinical surveillance.6-8 It is used to investigate how TAVI enhances ventricular function by surveying energy consumption and mechanical efficiency. In this study, we assessed changes in chamber geometry and hemodynamics, as well as the interaction between the left ventricle and arterial system.9,10 Additionally, PV loop provides insights into ventricular energetics, evaluation of diastolic compliance, mechanical efficiency, and ventricular-arterial coupling (Figure 1).4,11
Figure 1.
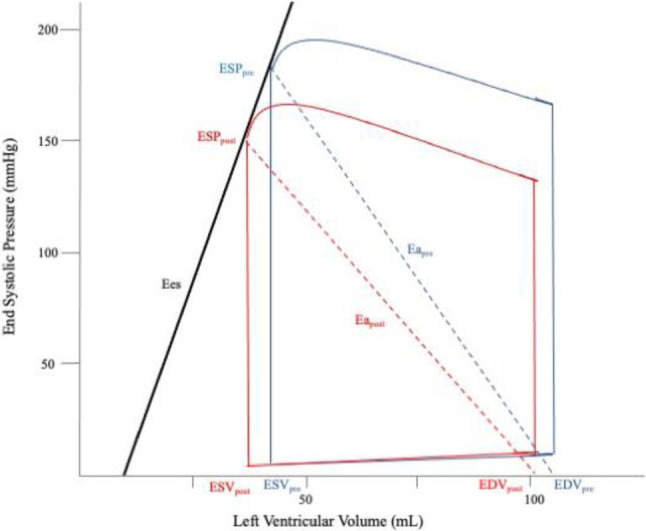
Average left ventricular pressure-volume loop, pre-TAVI (blue lines) and post-TAVI (red lines). Following TAVI, reductions in ESV, EDV, ESP, and Ea were observed, along with decreases in PE, SW, and PVA. Furthermore, the PV loop exhibited leftward shifts. PE represents the triangular area enclosed by the ESPVR, EDPVR, and the left border of the PV loop, while SW represents the overall area of the PV loop. The PV area is calculated as the sum of PE and SW. Ea, arterial elastance; EDPVR, end-diastolic pressure-volume relationship; EDV, end-diastolic volume; Ees, ventricular end-systolic elastance; ESP, end-systolic pressure; ESPVR, end-systolic pressure-volume relationship; ESV, end-systolic volume; PE, potential energy; PVA, pressure-volume area; SW, stroke work; TAVI, transcatheter aortic valve implantation. Modified from Di Bello (7).
The primary objective of this study was to validate the acute changes in geometry and hemodynamics following TAVI. The secondary objective was to use PV loop analysis to evaluate the correlations between hemodynamics, ventricular energetics, and mechanical efficiency.
METHODS
Study population
This study recruited a total of 46 patients who underwent TAVI for severe AS between January 2016 and December 2022. Data were obtained from electronic medical records, and the study procedures followed the guidelines outlined in the Declaration of Helsinki. The study received approval from the Institutional Review Board of Far Eastern Memorial Hospital (approval number: 111256-E).
Doppler echocardiography
Doppler echocardiography assessments were performed on all patients both before and after TAVI without inotropic support during the same hospitalization. These assessments were conducted by the same cardiologist using the Philips iE33 ultrasound system.
TAVI technique
The CoreValve (Medtronic, Inc., Minneapolis, MN) was implanted in all 46 cases. Vascular access was obtained either through a percutaneous approach or surgical cut down of the common femoral artery. All procedures were performed under general anesthesia. Acute device success was determined by the proper technical placement of the valve within the aortic root, without major complications.
Definitions of comorbidities
Hypertension was defined as a documented history or the use of antihypertensive drugs. Chronic renal insufficiency was defined as an estimated glomerular filtration rate below 60 mL·min-1 1.73 m-2. A stroke event was diagnosed by a neurologist and confirmed through brain computed tomography or magnetic resonance imaging. Diabetes was defined the use of oral hypoglycemic agents or insulin for treatment. Peripheral artery disease was determined by the presence of intermittent claudication symptoms confirmed by computed tomography angiography. Hyperlipidemia was defined as a low-density lipoprotein cholesterol level exceeding 100 mg/dL.
Assessment of AS severity and prosthesis-patient mismatch
Effective orifice area (EOA) calculation
The aortic valve area was determined using a continuity equation and modified Bernoulli equation.1


VTI, velocity time integral; BSA, body surface area.
Definition of prosthesis-patient mismatch
The severity of prosthesis-patient mismatch (PPM) was assessed by the EOAI. PPM was categorized based on the following criteria: severe if the EOAI was less than 0.65 cm2·m-2, moderate if the EOAI ranged from 0.65 cm2·m-2 to 0.85 cm2·m-2, and not PPM if the EOAI was greater than 0.85 cm2·m-2.
Definitions of left ventricular and systemic arterial hemodynamic parameters
LV geometry assessment
Geometric measurements, including the LV end-diastolic diameter (LVEDD), LV end-systolic diameter (LVESD), end-diastolic septal thickness (IVST), and end-diastolic posterior wall thickness (PWT) were determined using M-mode echocardiography. Additionally, the LV end-diastolic volume (LVEDV) and end-systolic volume (LVESV) were calculated from apical two-chamber and four-chamber views using the Teichholz formula.12
LV mass (LVM) was calculated using the corrected American Society of Echocardiography formula as follows:
LVM = 0.8 × [1.04 × ((IVST + LVEDD + PWT)3 – LVEDD3] + 0.6
The indexed LVM was indexed by body surface area.
The relative wall thickness (RWT) ratio was calculated as:

Definition of remodel mode:13
Hypertrophy was defined as an LVM exceeding cutoff values of > 95 g·m-2 in females and > 115 g·m-2 in males.
Remodel Mode: Concentric was defined as RWT > 0.42, eccentric as RWT < 0.42.
LV systolic function


Stroke volume index was calculated as stroke volume indexed by body surface area.
LV diastolic function
The assessment of diastolic function involved parameters of trans-mitral inflow, including the peak velocities of the E wave (representing early diastole), A wave (representing late diastole), ratio of E/A, deceleration time of the E wave, and the e′ wave (early diastolic lateral mitral annular velocities). The E/e′ ratio was calculated as the ratio between the E velocity and e′ velocity. The grading of diastolic dysfunction was determined based on guidelines.14
Global LV hemodynamic load
The global left ventricular afterload, as valvular-arterial impedance (Zva), was calculated by summing the double load and dividing it by the indexed stroke volume.15


where h is the end systolic LV wall thickness calculated as the mean between LV end systolic septal thickness and posterior wall thickness.7
Definition of change in hemodynamic parameter
Change in hemodynamic parameter = postTAVI value – preTAVI value.
Definitions of elastance, ventricular-arterial coupling, potential energy, stroke work and mechanical efficiency
LV end-systolic pressure = (0.9 × systolic arterial pressure) + mean pressure gradient.
Arterial elastance represents an integrative index of arterial load.16

LV end-systolic elastance represents load-independent index of LV contractility and LV end-systolic stiffness.11,17


Stroke Work ≈ Stroke volume × LV end sytolic pressure.
The approximation of potential energy was represented by a triangle formed by the end-systolic pressure-volume relationship (ESPVR), the end-systolic volume, and the x-axis.
Potential Energy = 0.5 × LV end systolic volume × LV end systolic pressure
Pressure-volume area = Potential Energy + Stroke Work

Definitions of end point
The primary objective was to compare differences between baseline and post-TAVI, the immediate changes in geometry and hemodynamics without inotropic support. The secondary objective was to investigate correlations between changes in hemodynamics and changes in chamber mechanics, including potential energy, stroke work, PV area, and mechanical efficiency.
Statistical analysis
Hemodynamic parameters, including geometry and function, were compared using paired Mann-Whitney U test for repeated variables. Linear regression analysis was employed to examine associations between changes in the desired hemodynamic parameters and work. All statistical tests were two-tailed, with a significance level set at p < 0.05. The statistical analyses were conducted using MedCalc statistical software.
RESULTS
From January 2016 to December 2022, a total of 46 patients underwent TAVI, of whom 37 (81%) had pure aortic stenosis. Successful implantation was achieved in all patients. The distribution of implanted sizes was as follows: 5 patients (11%) received a 23 mm valve, 19 patients (41%) received a 26 mm valve, 18 patients (39%) received a 29 mm valve, 1 patient (2%) received a 31 mm valve, and 3 patients (7%) received a 34 mm valve. There were no deaths during the hospitalization.
Demographic and clinical data at baseline
Table 1 illustrates that hypertension was the most common comorbidity, affecting 76% of the population, followed by coronary artery disease (61%), dyslipidemia (57%), chronic kidney disease (57%), and pulmonary hypertension (48%). Twenty-nine (63%) patients had a small annulus size (< 21 mm), and EOAI < 0.65 cm2/m2 was present in 91% of the patients. LV dilation (LVEDD > 5.5 cm) was observed in 9 patients (19.62%), and systolic dysfunction was found in 19.6%. All patients exhibited diastolic dysfunction, with grades classified as grade I (46%), grade II (24%), and grade III (30%). The LV remodeling mode showed concentric hypertrophy in 81% and eccentric hypertrophy in 11% of the patients. Except for body surface area, there were no significant differences in comorbidities, geometry, and function between genders.
Table 1. Demography and clinical data in baseline.
| Variable | N (%) |
| Age (y) | 83 ± 6.4 |
| Men | 21 (46%) |
| Dyslipidemia | 26 (57%) |
| Hypertension | 35 (76%) |
| Coronary artery disease | 28 (61%) |
| Diabetes | 15 (33%) |
| Cerebrovascular accident | 6 (13%) |
| Atrial fibrillation | 10 (22%) |
| Permanent pacemaker implantation | 3 (7%) |
| Chronic obstructive pulmonary disease | 8 (17%) |
| Pulmonary hypertension | 22 (48%) |
| Peripheral artery disease | 3 (7%) |
| Carotid stenosis | 7 (15%) |
| Chronic kidney disease | 26 (57%) |
| Annulus < 21 mm | 29 (63%) |
| Stratification of effective orifice area index | |
| EOAI > 0.65, ≤ 0.85 cm2/m2 | 4 (9%) |
| EOAI ≤ 0.65 cm2/m2 | 42 (91%) |
| Systolic dysfunction | |
| LVEF ≥ 50% | 37 (81%) |
| LVEF < 50% | 9 (19%) |
| Diastolic dysfunction | |
| Grade I | 21 (46%) |
| Grade II | 11 (24%) |
| Grade III | 14 (30%) |
| Remodel mode | |
| Normal | 1 (2%) |
| Concentric remodeling | 3 (6%) |
| Eccentric hypertrophy | 5 (11%) |
| Concentric hypertrophy | 37 (81%) |
Data were expressed as frequency (percentage) or mean ± standard deviation.
EOAI, effective orifice area index; LVEF, left ventricular ejection fraction.
Comparisons of acute changes in geometry and hemodynamics before and after TAVI
Table 2 illustrates the significant observations in decreased transaortic pressure gradient (MPG) after expanding the stenosed aortic valve. The reductions in both LVESD and LVESV were significant. Reduced systemic vascular resistance (SVR) and arterial elastance (Ea) were also noted, along with a significant increase in systemic artery compliance. These changes contributed to a decrease in both global Zva and wall stress. Additionally, increased stroke volume index and improved diastolic dysfunction were noted, including both elevated trans-mitral inflow E velocity and mitral annular tissue Doppler e′ velocity. Increased ventricular performance was evidenced by increased stroke volume. After the LVOT obstruction was relieved, there were substantial decreases in both potential energy and stroke work. This reduction in total input energy consumption was accompanied by an increase in ventricular mechanical efficiency. Furthermore, the ventricular-arterial (VA) coupling exhibited towards normalization.
Table 2. Comparisons of acute changes in geometry and hemodynamics between pre-TAVI and post-TAVI.
| Pre-TAVI (N = 46) | Post-TAVI (N = 46) | p value | |||
| Median | 95% CI | Median | 95% CI | ||
| Geometry | |||||
| LVESVI, mL | 23.28 | 19.66-27.15 | 20.62 | 16.76-24.62 | 0.0039 |
| LVEDVI, mL | 66.42 | 63.80-75.71 | 64.60 | 55.14-70.71 | 0.0893 |
| Valvular | |||||
| EOAI, cm2 · m-2 | 0.47 | 0.42-0.53 | 1.17 | 1.09-1.41 | < 0.0001 |
| ELI, cm2 · m-2 | 0.54 | 0.46-0.58 | 1.70 | 1.55-2.15 | < 0.0001 |
| Mean PG, mmHg | 41 | 35-47 | 7 | 6-8 | < 0.0001 |
| Arterial | |||||
| SAC, ml · mmHg-1 · m-2 | 0.78 | 0.69-1.01 | 0.89 | 0.80-1.03 | 0.0001 |
| SVR, dyne · s · cm-5 | 1374 | 1291-1503 | 1099 | 1033-1194 | 0.0005 |
| Ea, mmHg · mL-1 | 2.88 | 2.49-3.18 | 2.20 | 1.78-2.56 | < 0.0001 |
| Global | |||||
| Zva, mmHg · ml-1 · m2 | 3.56 | 3.27-3.92 | 2.53 | 2.34-2.78 | < 0.0001 |
| Wall stress, Kdyne · cm-2 | 94.95 | 85.53-114.72 | 63.70 | 56.20-67.91 | < 0.0001 |
| Systolic | |||||
| SVI, mL · m-2 | 40.10 | 37.61-43.59 | 53.05 | 49.85-59.49 | 0.0001 |
| LVEF, % | 65.13 | 61.63-67.80 | 67.18 | 63.46-68.66 | 0.0129 |
| Ees, mmHg · mL-1 | 4.32 | 3.79-5.65 | 4.04 | 3.44-4.84 | 0.1447 |
| Diastolic | |||||
| E, cm · s-1 | 108 | 88-118 | 124 | 109-144 | < 0.0001 |
| E/A, % | 1.00 | 0.74-1.22 | 1.09 | 0.82-1.57 | 0.0422 |
| DT, ms | 225 | 182-275 | 225 | 208-262 | 0.6653 |
| e′, cm · s-1 | 5.20 | 4.33-5.92 | 5.95 | 5.00-6.33 | 0.0273 |
| E/e′, ratio | 20.07 | 15.26-22.70 | 19.06 | 17.11-24.79 | 0.2631 |
| Work | |||||
| PE, cJ | 38.02 | 32.26-45.99 | 24.71 | 21.32-31.77 | < 0.0001 |
| SW, cJ | 134.75 | 122.74-146.86 | 97.26 | 84.88-118.19 | 0.0001 |
| PVA, cJ | 181.27 | 170.42-202.62 | 126.56 | 113.70-153.47 | < 0.0001 |
| Efficiency, % | 78.88 | 76.26-80.81 | 80.41 | 77.64-81.42 | 0.0107 |
| VA coupling, ratio | 0.54 | 0.48-62.26 | 0.49 | 0.46-0.58 | 0.0104 |
cJ, centi Joule; E, early diastolic trans-mitral flow velocity; e′, early lateral mitral annulus tissue doppler velocity; Ea, arterial elastance; Ees, left ventricle end-systolic elastance; ELI, energy loss index; EOAI, effective orifice area index; LVEDV, left ventricular end diastolic volume; LVEF, left ventricular ejection fraction; LVESV, left ventricular end systolic volume; MPG, mean transaortic pressure gradient; PE, potential energy; PVA, pressure-volume loop area; SAC, systemic arterial compliance; SVI, stroke volume index; SVR, systemic vascular resistance; SW, stroke work; TAVI, transcatheter aortic valve implantation; VA coupling, ventricular arterial coupling; Zva, valvulo-arterial impedance.
Data were expressed as median, 95% confidence interval.
Correlations of alterations in hemodynamics and energetics between baseline and post-TAVI
Table 3 illustrates that the change in potential energy was proportional to changes in ESV, EDV, and wall stress, but inversely related to the change in Ees.
Table 3. Correlation in alterations of hemodynamics and energetics between baseline and post-TAVI.
| ΔPotential energy, cJ | ΔStroke work, cJ | ΔPressure volume area, cJ | ΔMechanical efficiency, % | |||||||||
| β | r | p value | β | r | p value | β | r | p value | β | r | p value | |
| ΔLVESV, mL | 1.06 | 0.95 | < 0.0001 | 0.16 | 0.07 | 0.6449 | 1.21 | 0.45 | 0.0017 | -0.34 | 0.82 | < 0.0001 |
| ΔLVEDV, mL | 0.55 | 0.74 | < 0.0001 | 0.48 | 0.32 | 0.0305 | 1.03 | 0.57 | < 0.0001 | -0.13 | 0.48 | 0.0007 |
| ΔSV, mL | 0.14 | 0.12 | 0.4111 | 2.02 | 0.90 | < 0.0001 | 2.15 | 0.80 | < 0.0001 | 0.16 | 0.40 | 0.0064 |
| ΔMPG, mmHg | 0.29 | 0.22 | 0.1361 | 1.00 | 0.38 | 0.0095 | 1.29 | 0.41 | 0.0049 | -0.034 | 0.07 | 0.6450 |
| ΔESP, mmHg | 0.18 | 0.16 | 0.2771 | 1.11 | 0.50 | < 0.0001 | 1.28 | 0.49 | < 0.0001 | 0.03 | 0.07 | 0.6304 |
| ΔWall stress, kdyne · cm-2 | 0.41 | 0.80 | < 0.0001 | 0.42 | 0.41 | 0.0051 | 0.83 | 0.67 | < 0.0001 | -0.09 | 0.46 | 0.0013 |
| ΔEa, mmHg · mL-1 | 15.3 | 0.30 | 0.0453 | 22.08 | 0.21 | 0.1585 | 37.4 | 0.30 | 0.0436 | -3.99 | 0.21 | 0.1680 |
| ΔEes, mmHg · mL-1 | -3.06 | 0.49 | 0.0005 | -2.57 | 0.20 | 0.1724 | -5.63 | 0.37 | 0.0104 | 1.26 | 0.54 | 0.0001 |
cJ, centi-Joule; Ea, arterial elastance; Ees, ventricular end systolic elastance; ESP, endsystolic pressure; LVEDV, left ventricular end diastolic volume; LVESV, left ventricular end systolic volume; MPG, mean transaortic pressure gradient; r, correlation coefficient; TAVI, transcatheter aortic valve implantation; β, regression coefficient.
The change in stroke work was proportional to changes in SV, MPG, ESP and WS. The change in mechanical efficiency was proportional to changes in SV and Ees, but inversely related to changes in ESV, EDV, and WS. The change inLVESV was found to be directly related to the change inpotential energy (PE) (Figure 2A), but inversely related to the change in mechanical efficiency (ME) (Figure 2B). Similarly, the change in LVEDV showed a direct relationship with changes in PE and stroke work (SW), but an inverse relationship with the change in ME (Figure 2C). Furthermore, the change in stroke volume (SV) demonstrated a direct relationship with changes in SW (Figure 2D) and ME. Additionally, changes in MPG and LV end-systolic pressure (ESP) exhibited a direct relationship with the change in stroke work (Figure 2E). Conversely, the change in wall stress displayed a direct relationship with changes in PE (Figure 2F) and SW, but an inverse relationship with the change in ME. Lastly, the change in Ees revealed an inverse relationship with the change in PE, but a direct relationship with the change in ME.
Figure 2.

Correlation in alterations of hemodynamics and energetics between baseline and post-TAVI with linear regression. The change in ESV is proportional to the changes in PE, as shown in A. But inverse relation with change in mechanical efficiency as depicted in B. The change in EDV is inverse relation with change in mechanical efficiency as shown in C. The change in SV is proportional with change in stroke work in D. The change in ESP is proportional to the changes in stroke work as depicted in E. The change in wall stress is proportional to change in potential energy as shown in F. cJ, centi-Joule; EDV, end-diastolic volume; ESP, end-systolic pressure; ESV, end-systolic volume; LVESP, left ventricular end-systolic pressure; ME, mechanical efficiency; PE, potential energy; SV, stroke volume; SW, stroke work; TAVI, transcatheter aortic valve implantation; WS, wall stress.
DISCUSSION
The primary findings of this study showed a reduction in total energy consumption, encompassing decreases in both potential energy and stroke work, leading to enhanced mechanical efficiency. Ventricular-arterial coupling tended towards normalization.
Ventricular function curve: Frank-Starling law, afterload, compliance
Ejection fraction is commonly used to evaluate cardiac performance, but it is load-dependent and does not account for ventricular workload.17,18 An enhanced comprehension of ventricular pumping capacity can be achieved by utilizing the ventricular function curve, which illustrates the relationship between input (preload) and output (cardiac output). This correlation is influenced by factors such as intrinsic contractility, diastolic compliance, and afterload (Central Illustration).17,19 The analysis of pressure-volume loop can provide valuable insights including Ees, global Ea index, and the proportions of energy consumption including ineffective work (PE), effective work (SW), and total work (PVA). These parameters are used to calculate mechanical efficiency and ventricular-arterial coupling, which indicate the energy conversion efficiency from the ventricle to the aortic vasculature.20
Central Illustration.

(A) The ventricular function curve relates end-diastolic pressure to cardiac output. The ventricular function curve shifts up and to the left when increased ventricular contractility, decreased afterload, and increased compliance. (B) TAVI reduces LV end-systolic pressure (LV ESP) and LV end-systolic volume (LV ESV), improving afterload and compliance, ultimately resulting in decreased potential energy and stroke work. Ea, arterial elastance; EDPVR, end-diastolic pressure-volume relationship; EDV, LV end-diastolic volume; Ees, LV end-systolic elastance; ESP, LV end-systolic pressure; ESPVR, end-systolic pressure-volume relationship; ESV, end-systolic volume; PE, potential energy; SW, stroke work; TAVI, transcatheter aortic valve. Modified from Walley (17).
Aortic stenosis: pathophysiology, structure-function relationship
Degenerative aortic valve stenosis is associated with comorbidities such as hypertension and atherosclerosis in older individuals.15,21 In this study, concentric hypertrophy was noted in 81% of the patients, all of whom exhibited diastolic dysfunction.15,22 The left ventricle is subject to dual load comprising valvular and arterial load in each ejection. Zva, which serves as a reflection of the global ventricular afterload, has been shown to be correlated with mass regression and clinical outcomes.8,15,22,23 Chronic pressure overload impairs the NO-cGMP-PKG-titin signaling pathway from the endothelium to myocardium, leading to exacerbated myocardial relaxation and adaptive hypertrophy, subsequently affecting coronary reserve.24 Chronic inflammatory stress leads to time-dependent post-apoptotic fibrosis, amplifying both myocardial and arterial stiffness. These adaptive changes help to maintain wall tension in accordance with the law of LaPlace. The remodeled geometry is marked by a reduction in the inner dimension and a concurrent increase in wall thickness. Structural alterations contribute to diastolic dysfunction by increasing myofilament stiffness and impairing relaxation, ultimately leading to heightened chamber stiffness and reduced capacitance.3,25,26 The hypertrophied ventricle ensures adequate stroke volume into the arterial vasculature, but at the expense of higher total energy consumption and reduced mechanical efficiency.
Benefits from TAVI: acute modification in regional structure, improvement in afterload and compliance
TAVI provides instant advantages over surgical AVR, such as shorter recovery time and hospital stay. It avoids ischemia-reperfusion injury by cardiopulmonary bypass and cardiac arrest. Transcatheter prosthetic valves offer a larger effective orifice area, reduced risk of prosthetic-patient mismatch, and enhanced mass regression.5 The instant enlargement of the stenosed aortic valve and reduction in LV afterload improve diastolic compliance. Our results revealed a reduction in LV end-systolic pressure and Ea, accompanied with decreases in LVESV and LVEDV. The elevations in stroke volume and cardiac output aligned with the Frank-Starling law, but the Ees index remained stable.19 The acute reduction in ventricular afterload indicates a reduced force to overcome resistance for the ventricle to eject blood into the vasculature. According to the law of Laplace, wall stress is derived with LVESP and LVESD and correlated with coronary flow reserve. We observed increases in mitral inflow E velocity and mitral annular tissue e′ velocity. By reducing wall stiffness and increasing capacitance, improved diastolic compliance enabled the accommodation of a larger volume of blood filling into the less distended chamber during the diastolic phase. Coupled with increased systemic arterial compliance, this improvement in ventricular-arterial coupling enhanced the efficiency of blood transfer from the ventricle to aorta.
Cardiac energetics: energy conservation, pressure-volume loop, effective work
Ejection fraction is a load-dependent method for assessing ventricular function. The principle of energy conservation is a more rational approach for evaluating ventricular function. Suga demonstrated a linear correlation between ventricular myocardial oxygen consumption (MVO2) per beat and the PV area.11,27 The "input energy" signifies the total energy consumption per beat, and it can be estimated by calculating the PV area. The "output work" signifies ventricular effective work, the actual energy required to propel blood throughout the vasculature. The ratio between stroke work and PV area provides insights into ventricular pumping efficiency and represents the conversion of chemical energy into mechanical work.4,28-30 Potential energy signifies the stored energy within the sarcomere at the end of systole. It comprises reserve energy for basal metabolism, calcium cycling, and actin-myosin uncoupling.24,31 The matching of VA coupling provides insights regarding energy conversion between cardiac pumping into the vasculature.17,32
Clinical implications
TAVI reduces the risk of ischemia-reperfusion injury compared to SAVR by avoiding cardiac arrest and cardiopulmonary bypass. It also provides a EOA, decreases the proportion of prosthesis-patient mismatch, enhances mass regression, and reduces the incidence of cardiac events.22 LVOT obstruction results in an immediate reduction in LV end-systolic pressure and LV end-systolic volume. Reduced wall stress and improved chamber compliance facilitate more blood influx into the ventricle, leading to an increased stroke volume. The decreases in SVR and Ea, along with the increase in systemic arterial compliance, suggests a normalization of ventricular-arterial coupling, indicating improved efficiency in transferring blood from the ventricle to the arterial vasculature. Reduced wall stress enhances the NO-cGMP-PKG-titin signaling pathway and inhibits hypertrophy, thereby initiating mass regression and reverse remodeling.
The immediate advantage lies in the reduction of potential energy, stroke work, and pressure-volume area, indicating a decrease in both wasted and total energy consumption. This means less energy is wasted on ineffective work and more is dedicated to effective output work. Nevertheless, the immediate advantages in energy consumption and mechanical efficiency may be mitigated by residual aortic regurgitation or conduction disturbances, which are often related to uneven calcified leaflet and inappropriate sizing. When assessing long-term durability through advanced prosthetic valve technology, TAVI could emerge as a viable choice for younger, lower-risk patients. Leveraging advanced imaging technology and energetics analysis through PV loop with echocardiography, we may find a valuable surrogate for clinical surveillance.
New knowledge gained
Enhances ventricular performance primarily due to an acute reduction in afterload and improved diastolic compliance by the ventricular function curve. Further analysis using PV loop confirmed a decrease in total energy consumption and an increase in ventricular mechanical efficiency. The advance in structure-function adaptation preceded mass regression. Reverse remodeling altered the force dynamics in the chamber, leading to further enhancements in ventricular performance. Ventricular energetics may be a potential surrogate marker for clinical surveillance.
Study limitations
This study has several limitations that warrant consideration. First, it is a single-center, nonrandomized retrospective cross-sectional study with a limited number of patients. Second, the quality of echocardiographic assessments may have varied depending on the observer. Third, this study primarily focused on evaluating acute changes in hemodynamics, energetics, and mechanical efficiency. Long-term surveillance is needed to assess sustained effects.
CONCLUSIONS
TAVI expands stenosed aortic valves and decreases the pressure gradient, leading to a decrease in end-systolic volume and wall stress. Pressure-volume loop analysis revealed that the improvement in ventricular function was attributed to the relief of afterload and the enhancement of diastolic compliance. A reduction in potential energy, coupled with improved mechanical efficiency, was observed. The normalization of ventricular-arterial coupling led to increased efficiency in transferring blood from the ventricle to the aorta. The enhancement in ventricular function became apparent before mass regression and reverse remodeling.
DECLARATION OF CONFLICT OF INTEREST
All the authors declare no conflict of interest.
Acknowledgments
This research did not receive any specific grant from funding agencies in the public, commercial, or not-for-profit sectors. All the authors would like to thank all colleagues contributed to this study.
REFERENCES
- 1.Pibarot P, Dumesnil JG. Hemodynamic and clinical impact of prosthesis-patient mismatch in the aortic valve position and its prevention. J Am Coll Cardiol. 2000;36:1131–1141. doi: 10.1016/s0735-1097(00)00859-7. [DOI] [PubMed] [Google Scholar]
- 2.Kawaguchi M, Hay I, Kass DA, et al. Combined ventricular systolic and arterial stiffening in patients with heart failure and preserved ejection fraction: implications for systolic and diastolic reserve limitations. Circulation. 2003;107:714–720. doi: 10.1161/01.cir.0000048123.22359.a0. [DOI] [PubMed] [Google Scholar]
- 3.Munagala VK, Hart CY, Burnett JC, Jr., et al. Ventricular structure and function in aged dogs with renal hypertension: a model of experimental diastolic heart failure. Circulation. 2005;111:1128–1135. doi: 10.1161/01.CIR.0000157183.21404.63. [DOI] [PMC free article] [PubMed] [Google Scholar]
- 4.Laine H, Katoh C, Luotolahti M, et al. Myocardial oxygen consumption is unchanged but efficiency is reduced in patients with essential hypertension and left ventricular hypertrophy. Circulation. 1999;100:2425–2430. doi: 10.1161/01.cir.100.24.2425. [DOI] [PubMed] [Google Scholar]
- 5.Tasca G, Brunelli F, Cirillo M, et al. Impact of the improvement of valve area achieved with aortic valve replacement on the regression of left ventricular hypertrophy in patients with pure aortic stenosis. Ann Thorac Surg. 2005;79:1291–1296. doi: 10.1016/j.athoracsur.2004.09.002. [DOI] [PubMed] [Google Scholar]
- 6.Chau KH, Douglas PS, Pibarot P, et al. Regression of left ventricular mass after transcatheter aortic valve replacement: the PARTNER trials and registries. J Am Coll Cardiol. 2020;75:2446–2458. doi: 10.1016/j.jacc.2020.03.042. [DOI] [PubMed] [Google Scholar]
- 7.Di Bello V, Giannini C, De Carlo M, et al. Acute improvement in arterial-ventricular coupling after transcatheter aortic valve implantation (CoreValve) in patients with symptomatic aortic stenosis. Int J Cardiovasc Imaging. 2012;28:79–87. doi: 10.1007/s10554-010-9772-3. [DOI] [PubMed] [Google Scholar]
- 8.Chen CH, Fetics B, Nevo E, et al. Noninvasive single-beat determination of left ventricular end-systolic elastance in humans. J Am Coll Cardiol. 2001;38:2028–2034. doi: 10.1016/s0735-1097(01)01651-5. [DOI] [PubMed] [Google Scholar]
- 9.Burkhoff D, Mirsky I, Suga H. Assessment of systolic and diastolic ventricular properties via pressure-volume analysis: a guide for clinical, translational, and basic researchers. Am J Physiol Heart Circ Physiol. 2005;289:H501–H512. doi: 10.1152/ajpheart.00138.2005. [DOI] [PubMed] [Google Scholar]
- 10.Monosilio S, Filomena D, Luongo F, et al. Cardiac and vascular remodeling after 6 months of therapy with sacubitril/valsartan: mechanistic insights from advanced echocardiographic analysis. Front Cardiovasc Med. 2022;9:883769. doi: 10.3389/fcvm.2022.883769. [DOI] [PMC free article] [PubMed] [Google Scholar]
- 11.Burkhoff D, Sagawa K. Ventricular efficiency predicted by an analytical model. Am J Physiol Regul Integr Comp Physiol. 1986;250:R1021–R1027. doi: 10.1152/ajpregu.1986.250.6.R1021. [DOI] [PubMed] [Google Scholar]
- 12.Lang RM, Bierig M, Devereux RB, et al. Recommendations for chamber quantification: a report from the American Society of Echocardiography’s guidelines and standards committee and the chamber quantification writing group, developed in conjunction with the European Association of Echocardiography, a branch of the European Society of Cardiology. J Am Soc Echocardiogr. 2005;18:1440–1463. doi: 10.1016/j.echo.2005.10.005. [DOI] [PubMed] [Google Scholar]
- 13.Gjesdal O, Bluemke DA, Lima JA. Cardiac remodeling at the population level - risk factors, screening, and outcomes. Nat Rev Cardiol. 2011;8:673–685. doi: 10.1038/nrcardio.2011.154. [DOI] [PubMed] [Google Scholar]
- 14.Nagueh SF, Smiseth OA, Appleton CP, et al. Recommendations for the evaluation of left ventricular diastolic function by echocardiography: an update from the American Society of Echocardiography and the European Association of Cardiovascular Imaging. Eur J Echocardiogr. 2016;17:1321–1360. doi: 10.1093/ehjci/jew082. [DOI] [PubMed] [Google Scholar]
- 15.Briand M, Dumesnil JG, Kadem L, et al. Reduced systemic arterial compliance impacts significantly on left ventricular afterload and function in aortic stenosis: implications for diagnosis and treatment. J Am Coll Cardiol. 2005;46:291–298. doi: 10.1016/j.jacc.2004.10.081. [DOI] [PubMed] [Google Scholar]
- 16.Kelly RP, Ting CT, Yang TM, et al. Effective arterial elastance as index of arterial vascular load in humans. Circulation. 1992;86:513–521. doi: 10.1161/01.cir.86.2.513. [DOI] [PubMed] [Google Scholar]
- 17.Walley KR. Left ventricular function: time-varying elastance and left ventricular aortic coupling. Crit Care. 2016;20:270. doi: 10.1186/s13054-016-1439-6. [DOI] [PMC free article] [PubMed] [Google Scholar]
- 18.Cikes M, Solomon SD. Beyond ejection fraction: an integrative approach for assessment of cardiac structure and function in heart failure. Eur Heart J. 2016;37:1642–1650. doi: 10.1093/eurheartj/ehv510. [DOI] [PubMed] [Google Scholar]
- 19.Elzinga G, Westerhof N. How to quantify pump function of the heart. The value of variables derived from measurements on isolated muscle. Circ Res. 1979;44:303–308. doi: 10.1161/01.res.44.3.303. [DOI] [PubMed] [Google Scholar]
- 20.Ky B, French B, May Khan A, et al. Ventricular-arterial coupling, remodeling, and prognosis in chronic heart failure. J Am Coll Cardiol. 2013;62:1165–1172. doi: 10.1016/j.jacc.2013.03.085. [DOI] [PMC free article] [PubMed] [Google Scholar]
- 21.Nkomo VT, Gardin JM, Enriquez-Sarano M, et al. Burden of valvular heart diseases: a population-based study. Lancet. 2006;368:1005–1011. doi: 10.1016/S0140-6736(06)69208-8. [DOI] [PubMed] [Google Scholar]
- 22.Chen JS, Chiu KM, Chiang CY, et al. Extent of left ventricular mass regression and impact of global left ventricular afterload on cardiac events and mortality after aortic valve replacement. J Clin Med. 2022;11:7482. doi: 10.3390/jcm11247482. [DOI] [PMC free article] [PubMed] [Google Scholar]
- 23.Giannini C, Petronio AS, De Carlo M, et al. The incremental value of valvuloarterial impedance in evaluating the results of transcatheter aortic valve implantation in symptomatic aortic stenosis. J Am Soc Echocardiogr. 2012;25:444–453. doi: 10.1016/j.echo.2011.12.008. [DOI] [PubMed] [Google Scholar]
- 24.Paulus WJ, Tschöpe C. A novel paradigm for heart failure with preserved ejection fraction: comorbidities drive myocardial dysfunction and remodeling through coronary microvascular endothelial inflammation. J Am Coll Cardiol. 2013;62:263–271. doi: 10.1016/j.jacc.2013.02.092. [DOI] [PubMed] [Google Scholar]
- 25.Herrmann S, Störk S, Niemann M, et al. Low-gradient aortic valve stenosis: myocardial fibrosis and its influence on function and outcome. J Am Coll Cardiol. 2011;58:402–412. doi: 10.1016/j.jacc.2011.02.059. [DOI] [PubMed] [Google Scholar]
- 26.Bortone AS, Hess OM, Chiddo A, et al. Functional and structural abnormalities in patients with dilated cardiomyopathy. J Am Coll Cardiol. 1989;14:613–623. doi: 10.1016/0735-1097(89)90102-2. [DOI] [PubMed] [Google Scholar]
- 27.Suga H, Hayashi T, Shirahata M. Ventricular systolic pressure-volume area as predictor of cardiac oxygen consumption. Am J Physiol Heart Circ Physiol. 1981;240:H39–H44. doi: 10.1152/ajpheart.1981.240.1.H39. [DOI] [PubMed] [Google Scholar]
- 28.Ikonomidis I, Aboyans V, Blacher J, et al. The role of ventricular–arterial coupling in cardiac disease and heart failure: assessment, clinical implications and therapeutic interventions. A consensus document of the European Society of Cardiology working group on aorta & peripheral vascular diseases, European Association of Cardiovascular Imaging, and Heart Failure Association. Eur J Heart Fail. 2019;21:402–424. doi: 10.1002/ejhf.1436. [DOI] [PubMed] [Google Scholar]
- 29.Seemann F, Arvidsson P, Nordlund D, et al. Noninvasive quantification of pressure-volume loops from brachial pressure and cardiovascular magnetic resonance. Circ Cardiovasc Imaging. 2019;12:e008493. doi: 10.1161/CIRCIMAGING.118.008493. [DOI] [PubMed] [Google Scholar]
- 30.Bastos MB, Burkhoff D, Maly J, et al. Invasive left ventricle pressure–volume analysis: overview and practical clinical implications. Eur Heart J. 2020;41:1286–1297. doi: 10.1093/eurheartj/ehz552. [DOI] [PMC free article] [PubMed] [Google Scholar]
- 31.Suga H. Physiological reviews. Am J Physiol. 1990;70:247–277. doi: 10.1152/physrev.1990.70.2.247. [DOI] [PubMed] [Google Scholar]
- 32.Starling MR. Left ventricular-arterial coupling relations in the normal human heart. Am Heart J. 1993;125:1659–1666. doi: 10.1016/0002-8703(93)90756-y. [DOI] [PubMed] [Google Scholar]