Abstract
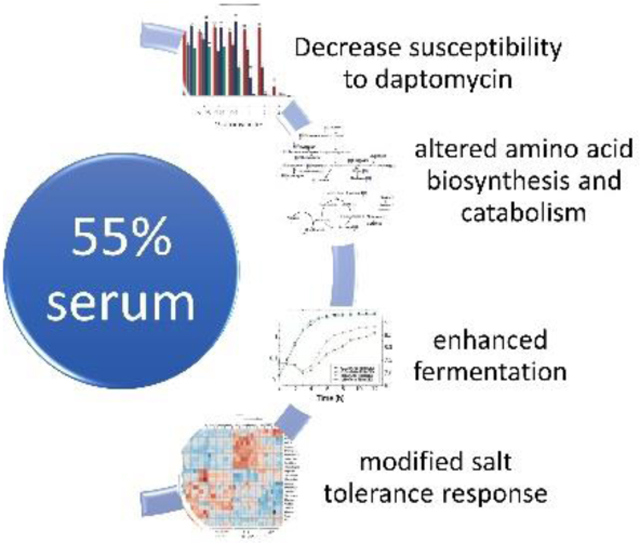
Staphylococcus aureus is a common source of hospital acquired bacterial infections, where the emergence of antibiotic resistance is a serious human health concern. Most investigations into S. aureus virulence and antibiotic resistance have relied on in vitro cultivation conditions and optimized media formulations. However, S. aureus can survive and adapt to a hostile host environment or antibiotic treatments by rapidly adjusting its metabolic activity. To assess this metabolic response, S. aureus strains susceptible and non-susceptible to daptomycin were cultivated in medium supplemented with 55% serum to more closely approximate in vivo conditions. Growth analyses, MIC testing, and NMR-based metabolomics determined that serum decreased daptomycin susceptibility and altered metabolism in S. aureus. Both S. aureus strains exhibited an altered amino acid biosynthesis and catabolism, enhanced fermentation, and a modified salt tolerance response. The observation that growth conditions defined an adaptive metabolic response to antibiotics by S. aureus may be a critical consideration for designing an effective drug discovery study.
Keywords: Staphylococcus aureus, serum, antibiotics resistance, metabolomics, NMR
Graphical Abstract
Introduction
Staphylococcus aureus is a prevalent pathogen capable of infecting any anatomical site. The pathogenic success of S. aureus is partly due to its large repertoire of adhesins, toxins, and immune evasion proteins, and its resistance to antibiotics. The majority of studies on S. aureus virulence determinants were performed in whole, or in part, using in vitro cultivation conditions. Variations in in vitro cultivation conditions and media formulations can dramatically alter the elaboration of these virulence determinants and antibiotic resistance.1, 2 Inherent within in vitro experiments is the recognition that they do not replicate in vivo conditions; however, this does not diminish the significance of these experiments in contributing to the understanding of S. aureus virulence. To advance in vitro studies and more closely approximate in vivo conditions, numerous studies have assessed the influence of serum and/or blood on staphylococcal virulence and/or virulence determinant synthesis.3, 4 Fewer studies have assessed the effect(s) of serum and/or blood on staphylococcal survival and/or metabolism.5, 6 This latter point is important because all virulence determinants are dependent on metabolism for synthesis, most are regulated by the availability of nutrients, and antibiotic resistance is strongly influenced by nutrients.7–9 For these reasons, it is critical to understand how variations in cultivation media formulations and growth conditions perturb the bacterial metabolome.
Human serum is a complex mixture of nutrients, hormones, lipids, antibodies, and abundant proteins, but lacking the clotting factors found in plasma.10 One example of a protein found in serum is transferrin, an iron-binding protein that delivers iron to eukaryotic cells via receptor mediated endocytosis. The transferrin family of proteins are important for controlling the availability of free iron, which minimizes the potential for deleterious free radical oxidative damage. A consequence of having iron-binding proteins in serum is that during a bacterial infection the level of free iron is below what is necessary to support robust bacterial growth. The effect of iron-limitation on bacterial growth is largely through the inactivation of redox active enzymes that require iron for activity.1, 11 While the effects of iron-limitation on bacterial metabolism and growth are broadly known, far less is known about the cumulative effects of serum on bacterial metabolism and growth. To address this deficiency, the growth and metabolomics of two S. aureus strains (i.e., 616 and 703)12 were assessed during cultivation with human serum.
Materials and Methods
Media and reagents.
S. aureus strains were grown in tryptic soy broth (TSB) containing 0.25% dextrose (BD Biosciences), TSB without dextrose (TSB-DEX; BD Biosciences), or on TSB containing 1.5% agar (TSA). Human male AB pooled serum (AB Serum) was purchased from Sigma-Aldrich. Deuterium oxide (D2O), 3-(trimethylsilyl)propionic-2,2,3,3-D4 acid sodium salt (TMSP), and 13C glucose were obtained from Cambridge Isotopes. Lysing matrix B tubes were obtained from MP biomedical.
Bacterial strains and cultivation conditions.
The University of Nebraska-Lincoln Institutional Biosafety committee approved the work conducted in this manuscript under Protocol ID # 111. All experiments were conducted in accordance with Biosafety Level – 2 precautions.
S. aureus strains 616 (DapS, daptomycin susceptible) and 703 (DapNS, daptomycin non-susceptible) were described.12 Analysis of AB serum revealed it contained 3.33 mM glucose; hence, S. aureus strains were cultivated in filter-sterilized TSB-DEX medium supplemented with either 3.33 mM glucose (TSB+DEX) or 55% AB serum. For 2D NMR experiments, all culture media were supplemented with an additional 3.33 mM 13C6-glucose. Bacterial pre-cultures were inoculated 1:100 from an overnight culture into TSB, incubated at 37°C, aerated at 225 rpm, using a flask-to-medium ratio of 10:1, and grown for 2 h. These exponential growth phase pre-cultures were centrifuged for 5 min at 5,000 rpm (4272.5 X g) at 22°C and suspended in 1–2 mL of medium. Primary cultures were inoculated into 100 mL pre-warmed medium at an absorbance at 600 nm (A600) of 0.01, and incubated at 37°C, aerated at 225 rpm, with a flask-to-medium ratio of 10:1.
Microplate antimicrobial susceptibility assay.
2h pre-cultures were prepared in TSB-DEX, as described. Daptomycin, which requires CaCl2 for activity, was serially diluted into a 96-well plate prior to inoculation. The pre-cultures were diluted to produce a final inoculum of 1–5 × 10⁵ CFU/mL containing TSB-DEX supplemented with 3.33 mM glucose and 1.25 mM CaCl2 or TSB-DEX supplemented with 55% Serum and 1.25 mM CaCl2. The plates were incubated at 37°C for 18 h. After incubation, the cultures were mixed, diluted 1:10 in new 96-well plates containing ultrapure water, and the optical density at 595 nm was recorded using a plate reader. The growth for 8 biological replicates per strain with 8 technical replicates per plate were averaged.
Metabolome extraction.
Bacteria (30 A600 units) were harvested at 6 h post-inoculation by centrifugation for 5 min at 5,000 rpm (4272.5 X g) and 0°C. The supernatant was removed and stored at −80°C, and the cell pellet was quenched in liquid nitrogen. After quenching, the bacteria were maintained on ice and suspended in chilled 18.2 MΩ resistance water to a final cell density of 20 A600 units/ml. 1 mL of the cell suspension was transferred to a lysing matrix B tube and lysed for 30 s at a setting of 6 m/s in a FastPrep 96 (MP biomedical). The cell lysate was centrifuged for 5 min at 13,200 rpm and 0°C. The supernatant was transferred into a microcentrifuge tube. A second aliquot of chilled 18.2 MΩ resistance water was added to the cell lysate in the lysing matrix B tube, lysed a second time, and centrifuged. The two supernatants were pooled for a final volume of 1.5 mL. The cell-free lysates were then frozen in liquid nitrogen, lyophilized, and stored in a −80°C freezer until analyzed. Similarly, 1 mL of each supernatant was lyophilized, and then stored in −80°C.
NMR sample preparation and data collection.
Each lyophilized cell-free lysate or culture supernatant was reconstituted with 575 μL of 50 mM phosphate buffer at pH 7.2 (uncorrected) in D2O with 50 μM of TMSP as a chemical shift reference. The samples were centrifuged for 20 min at 13,200 rpm and 0°C to remove any remaining cell debris or protein. The samples were transferred to a 5 mm or 3 mm NMR tubes for data analysis. The 1D 1H and 2D 1H- 13C HSQC NMR spectra were collected at 298K on a Bruker AVANCE III-HD 700 MHz spectrometer equipped with a 5 mm quadruple resonance QCI-P cryoprobe (1H, 13C, 15N, and 31P) with z-axis gradients. A SampleJet automatic sample changer, an auto tune and match (ATM) system, and Bruker ICON-NMR software were used to automate NMR data collection. The 1D 1H NMR spectra were collected with 32K data points, 128 scans, 16 dummy scans, a relaxation delay of 1.5 s, an acquisition time of 1.468 s, and a spectral width of 8417 Hz or 11160 Hz. An excitation sculpting pulse was used to suppress the residual water resonance.13 Nonuniform sampling (NUS) at a 25% sparsity with our deterministic schedular14 was used to decrease the running time of the 2D 1H- 13C HSQC NMR spectra. The 2D 1H- 13C HSQC NMR spectra were acquired with the Bruker hsqcetgpsisp2 pulse sequence, 32 scans, 16 dummy scans, a 1.5 s relaxation delay, GARP 13C-decoupling (65 μsec 90° pulse), 2K data points with a spectral width of 11160 Hz in the direct dimension, and 1K data points with a spectral width of 29059 Hz in the indirect dimension. A 1.5 s relaxation delay was chosen to approximate an optimal recycle delay (1.3 x T1) for a complex mixture considering 1H T1 values for small molecules are usually less than 1 s. Also, full relaxation recovery was unnecessary since only relative (not absolute) changes in metabolite concentrations were measured between two culture conditions. In this regard, incomplete peak recovery is an irrelevant constant across multiple identical experiments that would simply cancel out in a fold-change measurement.
NMR data processing and analysis.
The 1D 1H NMR spectra were processed and analyzed with our MVAPACK software suite (http://bionmr.unl.edu/mvapack.php).15 The 1D 1H NMR spectra were processed using one zero-fill, 1.0 Hz exponential apodization function, Fourier transformed and automatically phased.16 The processed 1D 1H NMR spectra were then normalized with standard normal variate (SNV) normalization, aligned with Icoshift,17 and referenced to TMSP at 0 ppm. The noise regions and residual water signal from 4.6 to 4.8 ppm were automatically removed from the spectra. The spectra were binned using adaptive intelligent binning18 and scaled using unit variance (UV) scaling. The resulting data matrix was then used to create a principal component analysis (PCA) and an orthogonal projection to latent structure discriminant analysis (OPLS-DA) model. CV-ANOVA19 was used to validate the OPLS-DA model. Chenomx NMR suite 8.3 (Chenomx Inc.) was used to assign the metabolites from the peaks in the back scaled loadings plots.
The 2D 1H- 13C HSQC NMR spectra were processed and analyzed using NMRpipe20 and NMRViewJ.21 The peaks identified in the spectra were assigned using the Human Metabolomics Database (HMDB) (http://www.hmdb.ca/) by matching reference metabolite chemical shifts to the experimental spectra using a peak-error tolerance of 0.08 ppm and 0.25 ppm for 1H and 13C, respectively.22 A probabilistic quotient (PQ) normalization was used to normalize the relative metabolite intensities in the spectra. BioCyc (https://biocyc.org)23 and KEGG (https://www.kegg.jp)24 were used to identify the S. aureus metabolic pathways associated with the metabolite alterations.
Determination of glucose concentrations in media.
Cell culture media were harvested hourly (1 mL) by centrifugation at 13,200 rpm (16,168 x g), for 5 min at 4 °C. The cell-free media were transferred to 1.5 mL microcentrifuge tubes, flash frozen in liquid nitrogen, and stored at −20°C until use. Glucose concentrations were determined from three independent cell cultures with a glucose kit (#10716251035) purchased from R-biopharm.
Statistical analysis.
The statistical significance difference between the growth curves and pH curves, and the microplate antimicrobial susceptibility assay data were assessed by using a 2-way ANOVA.25 The statistical significance between relative metabolite concentration changes in the 2D 1H- 13C HSQC was evaluated using a pair-wise Student’s t-test. A false discovery rate for multiple hypothesis testing was addressed using the Benjamini-Hochberg procedure.26 Metabolite concentration changes were determined to be statistically significant with a corrected p-value < 0.05. MetaboAnalyst (https://www.metaboanalyst.ca) was used to create a heatmap with hierarchical clustering of the 2D 1H- 13C HSQC NMR peak intensities.27
Results and Discussion
Bacterial cultivation in medium containing serum.
Whole blood is comprised of ~55% plasma, while serum is plasma that is devoid of fibrinogen.10 Plasma requires the presence of anticoagulants such as citrate or heparin to prevent clotting, adulterants that can alter bacterial growth. For this reason, human serum was preferred over plasma for cultivation experiments. In addition, a concentration of 55% was used during cultivation experiments to approximate the percentage found in whole blood. The choice of S. aureus strains 703 and 616 was driven by the connection between serum and antibiotic resistance and recent work on the metabolic profiling of daptomycin non-susceptible S. aureus.28, 29 Cultivation of S. aureus strains 703 and 616 in tryptic soy broth confirmed the presence of a modest, statistically significant post-exponential growth phase difference between the strains as previously reported (Fig. 1A).28 The pH profiles of the culture supernatants reflected this modest growth difference (Fig. 1B), and indicated that post-exponential growth phase acid extraction and base accumulation, from amino acid deamination, were altered. Interestingly, the modest growth and pH differences diminished and were no longer statistically significant with the addition of 55% serum to the cultivation medium (Fig. 1B). Most importantly, these data demonstrated that cultivation with serum did not induce any artificial growth defects that would impair the metabolomics analysis.
Fig. 1.
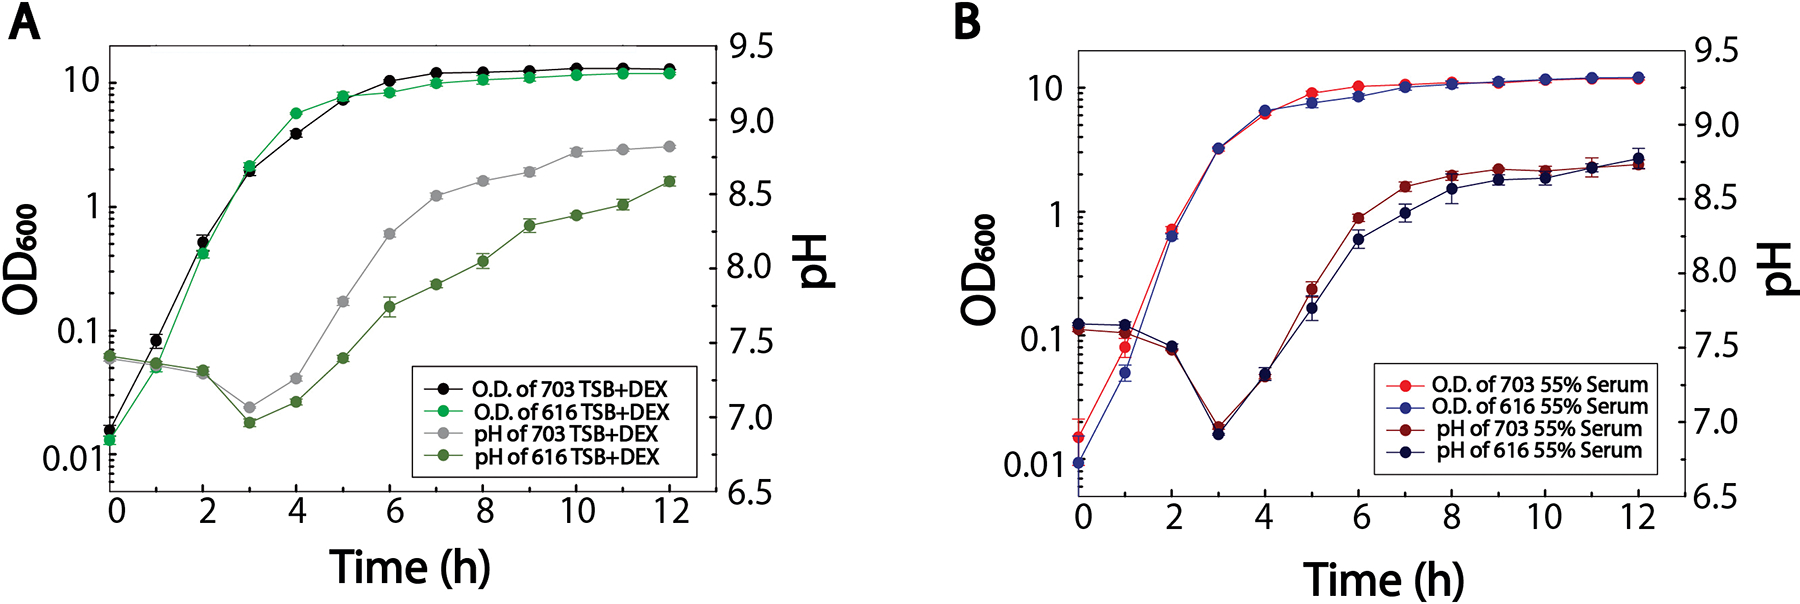
Growth analyses for S. aureus strains 616 and 703 cultivated in (A) TSB+DEX or (B) 55% serum. The mean of biological triplicates is plotted with error bars corresponding to the standard deviation. The statistical difference in the growth conditions were assessed by two-way ANOVA.
While S. aureus grew normally in TSB medium containing 55% serum (Fig. 1), serum can alter susceptibility to antibiotics.30 The transition of a bacterium from an antibiotic susceptible state to a non-susceptible state correlates with changes in bacterial metabolism.31 To assess if cultivation in 55% serum similarly altered S. aureus non-susceptibility to daptomycin, the susceptibility of strains 703 and 616 to daptomycin was determined in bacteria cultivated in TSB medium containing 55% serum. As expected, serum decreased the susceptibility of S. aureus strains 703 and 616 to daptomycin (Fig. 2). These data demonstrated that S. aureus strains 703 and 616 had susceptibility phenotypes consistent with previous observations of bacteria cultivated with human serum,30 making these strains appropriate for further metabolomics analysis.
Fig. 2.
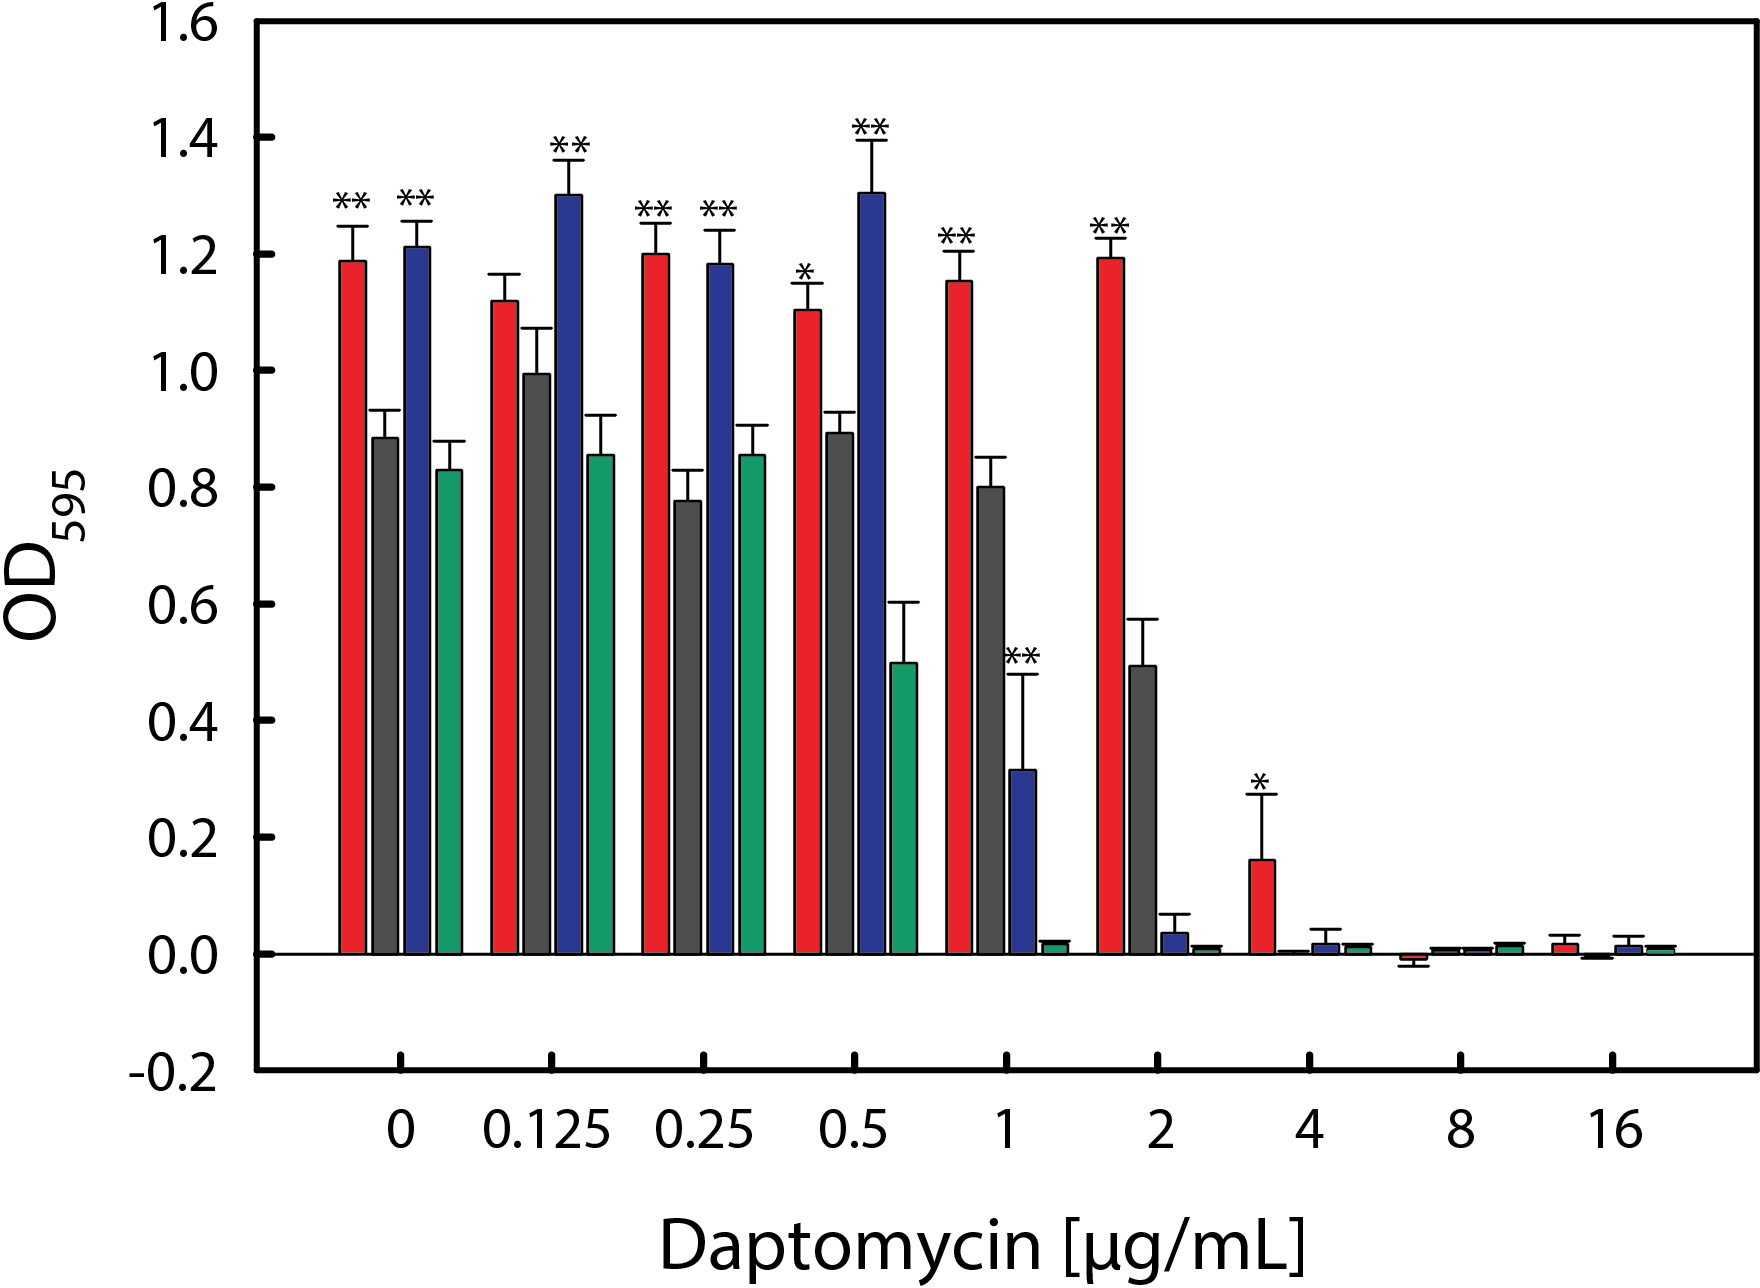
Daptomycin susceptibility of S. aureus strains 616 and 703 cultivated in TSB+DEX (green and black) or 55% serum (blue and red). The data represent the average and standard deviation for 8 biological replicates per strain with 8 technical replicates per plate. The p-values were calculated using a two-way ANOVA. Statistical significance is indicated by: **p < 0.001, * p < 0.05.
Serum alters the bacterial metabolome.
To determine if serum induces metabolic changes in S. aureus, strains 703 and 616 were cultivated for 6 h in TSB minus dextrose supplemented with either 55% serum or 3.33 mM glucose (this glucose concentration normalizes the glucose level to that found in human serum), the metabolomes were harvested, and the samples were analyzed by 1D 1H NMR. Representative 1D 1H NMR spectra for strains 703 and 616 cultured in TSB supplemented with 55% serum or 3.33 mM glucose are shown in Fig. S1. PCA of the NMR datasets from strains 703 and 616 confirmed modest metabolomic differences due to daptomycin susceptibility status (Fig. 3A and 3B).31 In contrast, the presence of serum in the cultivation medium created a significant divergence between the metabolomes, irrespective of daptomycin susceptibility status (Fig. 3A and 3B). Taken together, these data suggest that bacterial growth is similar in medium containing 55% human serum (Fig. 1), although marked metabolic differences occur due to the presence of serum (Fig. 3).
Fig. 3.
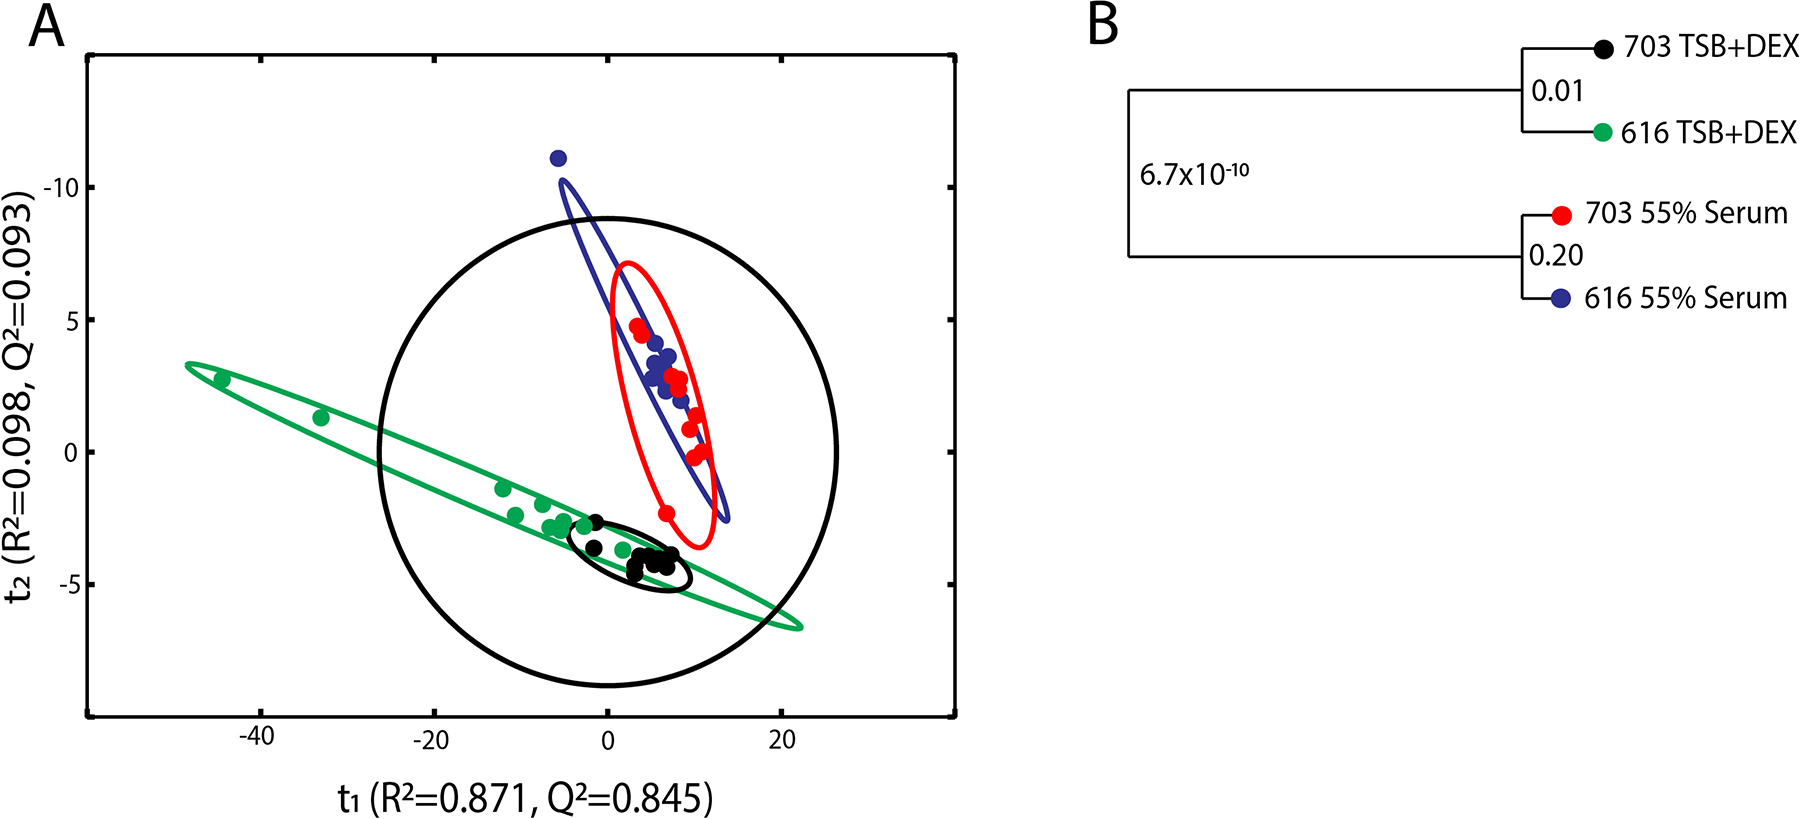
Statistical analysis of 1D 1H NMR data set obtained from S. aureus strains 616 and 703 in the presence and absence of 55% serum. (A) PCA scores plot comparing the metabolomes from S. aureus strains 616 and 703 in TSB+DEX (green, black) and in 55% serum (blue, red). The R2 and Q2 are 0.981 and 0.938, respectively. (B) A dendrogram generated from the PCA model in A where each node is labeled with a p-value. The ellipses in the PCA scores plot represent the 95% confidence limit of the normal distribution for each group.
S. aureus metabolic alterations in human serum.
PCA of 1D 1H NMR spectra demonstrated that cultivation of S. aureus in 55% serum significantly altered metabolism. To determine which metabolic pathways were most affected by cultivation with serum, 2D 1H- 13C HSQC spectra were acquired for S. aureus strains 616 and 703 cultivated for 6 hours in 55% serum or TSB supplemented with an additional equivalent concentration of 13C6-glucose in the medium and the metabolic differences were identified (i.e., stable isotope-resolved metabolomics, SIRM).32 Importantly, only metabolites derived from 13C6-glucose were detected in the 2D 1H- 13C HSQC spectra, which tends to provide the broadest coverage (most detected metabolites) of the metabolome. It is also important to note that only a single endpoint was measured to maximize the distribution of the 13C-label throughout the metabolome. Representative 2D 1H-13C HSQC spectra for strains 703 and 616 cultured in TSB supplemented with 55% serum or 3.33 mM glucose are shown in Fig. S2. Like the 1D 1H NMR PCA model (Fig. 3), there were modest differences between strains 616 and 703 when comparing metabolomes isolated from bacteria cultivated in the same medium (Fig. 4). In contrast, when comparing metabolomes isolated from bacteria cultivated in TSB with 55% serum versus TSB with 3.3 mM 13C6 glucose, dramatic differences were observed (Fig. 4). Most notably altered during cultivation with serum were the concentrations of amino acids. Interestingly, the concentrations of branched chain amino acids (i.e., valine, isoleucine, and leucine) were lower in S. aureus strains cultivated in 55% serum relative to that of those cultivated in TSB. This is interesting because the activity of the bacterial metabolite-responsive regulator CodY is regulated by branched chain amino acids and GTP,33, 34 raising the possibility that CodY regulatory activity increases in the host environment. This possibility is supported by the observation that genetic inactivation of codY in S. aureus significantly attenuated virulence in a murine bacteremia model.35 The decrease in branched chain amino acids is consistent with the increase in threonine accumulation during serum cultivation because threonine is the primary source of 2-oxo-butyrate used in branched chain amino acid biosynthesis. While cultivation in serum usually resulted in similar metabolic changes between strains 616 and 703, the oxaloacetate derived amino acids aspartate and asparagine were significantly lower in strain 703 relative to strain 616. This result was consistent with a decrease in TCA cycle activity observed with daptomycin non-susceptible strains relative to daptomycin susceptible strains.31 Overall, cultivation of S. aureus in medium containing 55% serum strongly affected amino acid levels.
Fig. 4.
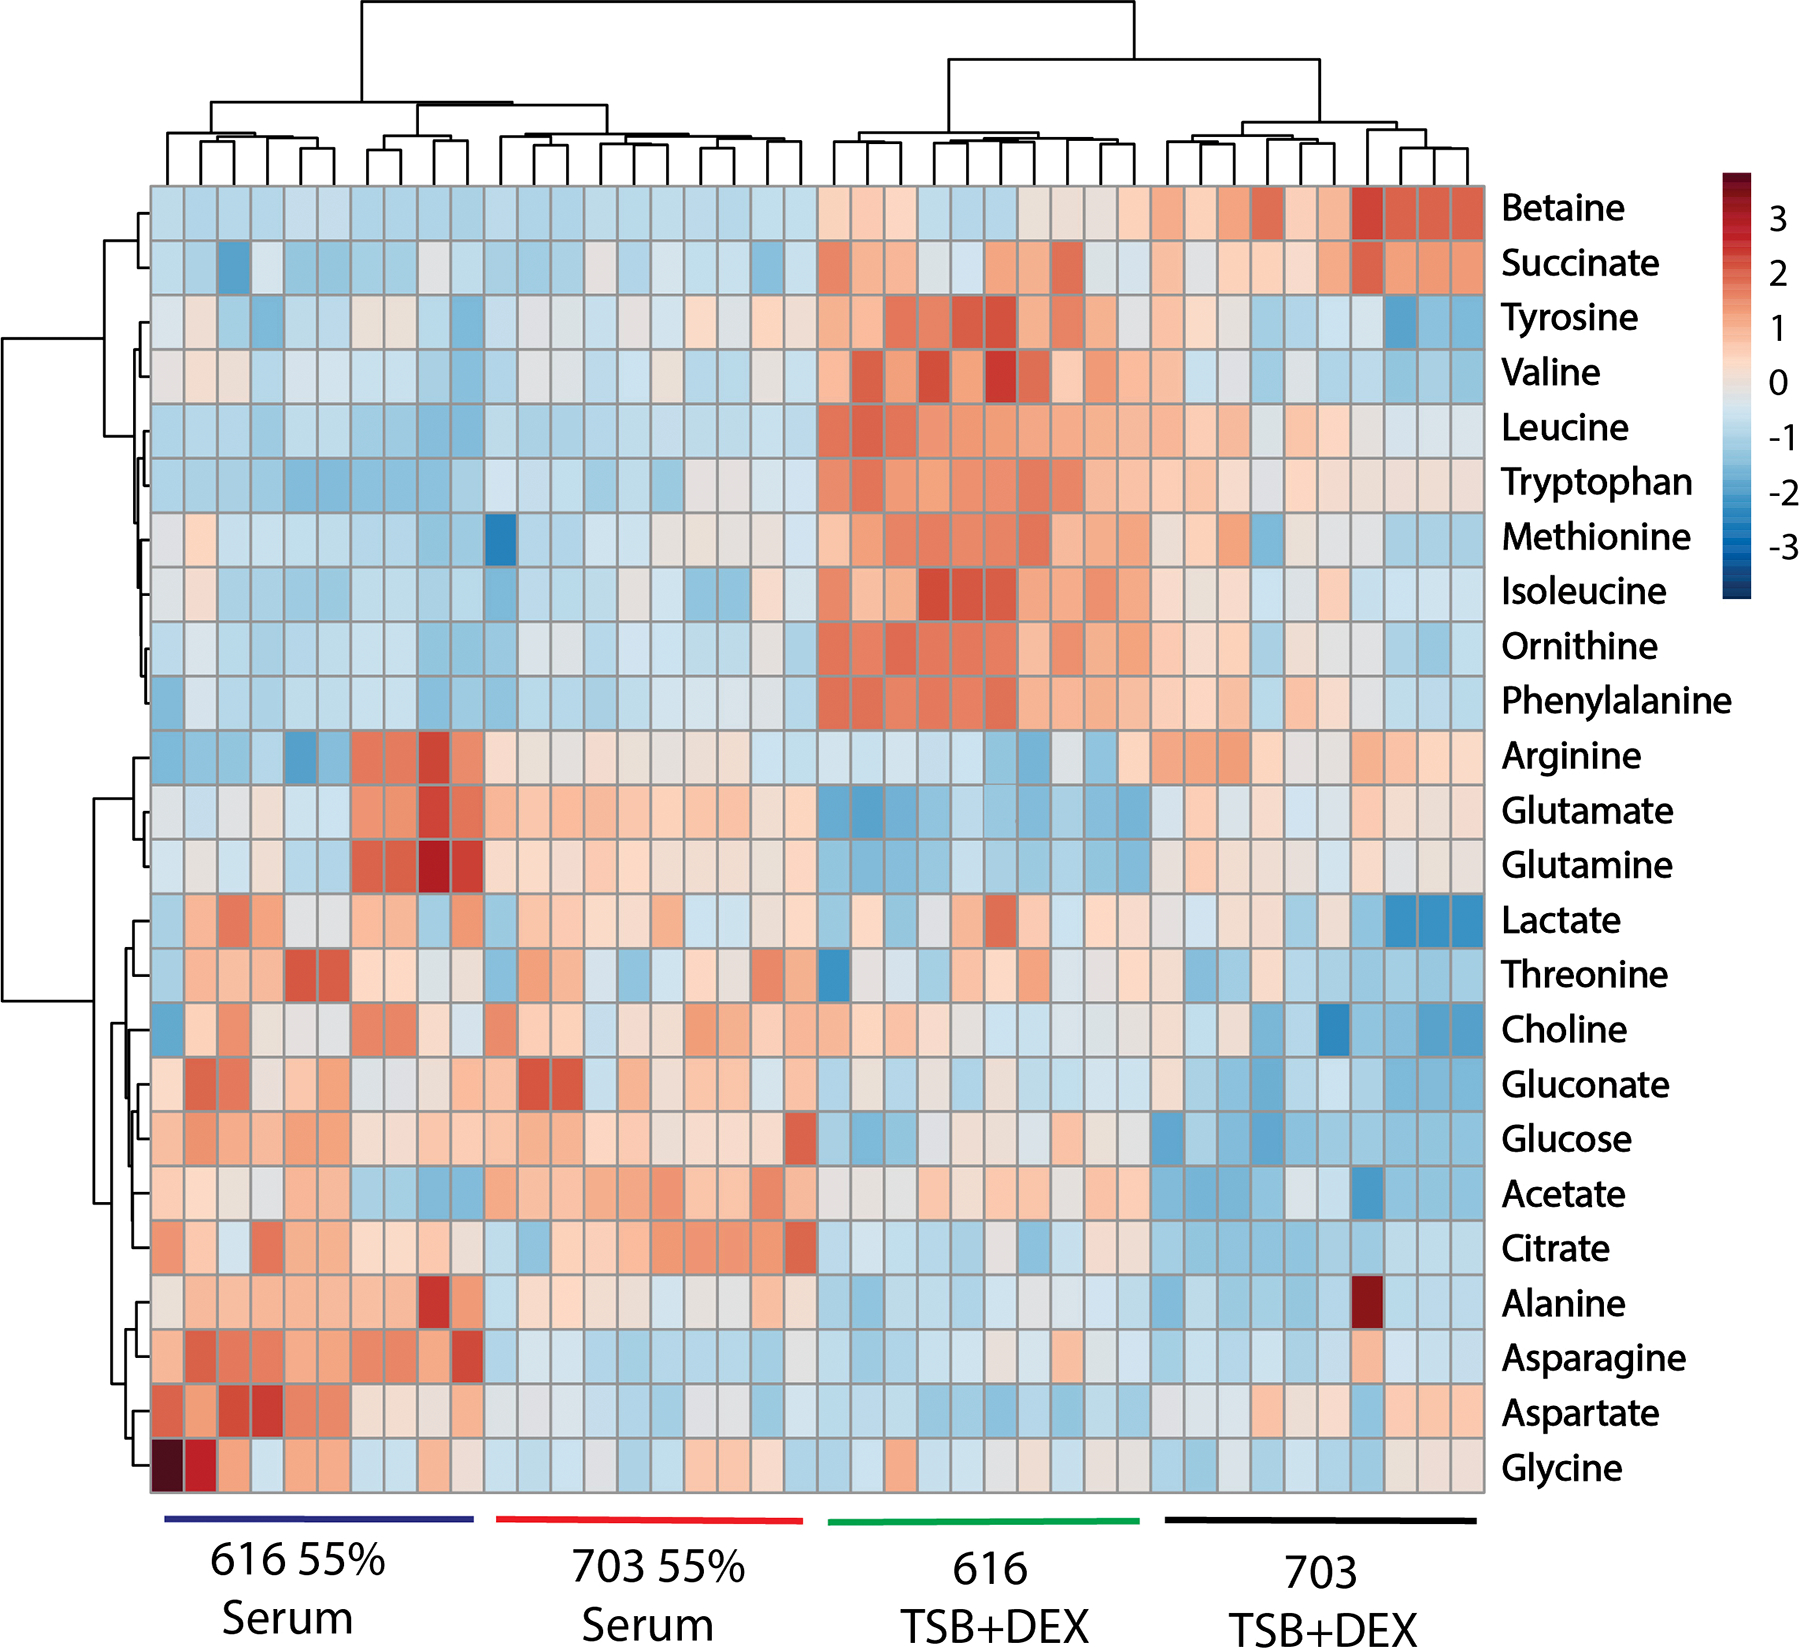
Heatmap and hierarchal clustering highlighting the metabolic alterations of S. aureus strains 616 and 703 due to the presence of 55% serum. The heat map plots normalized peak intensities from the 2D 1H−13C HSQC spectra. Each row displays the relative metabolite abundance for each replicate from the four groups, where red identifies a relative increase and blue indicates a relative decrease in the metabolite. Note all replicates per group cluster together.
The presence of serum in the medium also altered the catabolic fate of pyruvate, leading to a general increase in the fermentation products lactic acid and/or acetic acid relative to S. aureus cultivated without serum (Fig. 4 and 5). Because the cultures were highly aerated, the increase in fermentation metabolites was unlikely linked to the availability of oxygen. The increase in fermentation metabolites could be related to the bacterial iron-sparing response36 caused by the presence of transferrin in serum; however, this was unlikely the cause as serum cultivation leads to a general increase in glutamate and glutamine levels. Glutamate and glutamine are synthesized from the TCA cycle intermediate α-ketoglutarate, a process involving the iron-requiring enzyme aconitase. Alternatively, glutamate is generated during proline degradation,37 but no differences in proline levels were noted between bacteria cultivated with serum and those without serum. Taken together, there is an absence of an obvious metabolic rationale for the increase in fermentation, suggesting the cause is regulatory. Altered fermentation would be consistent with a change in CodY regulatory activity.38
Fig. 5.
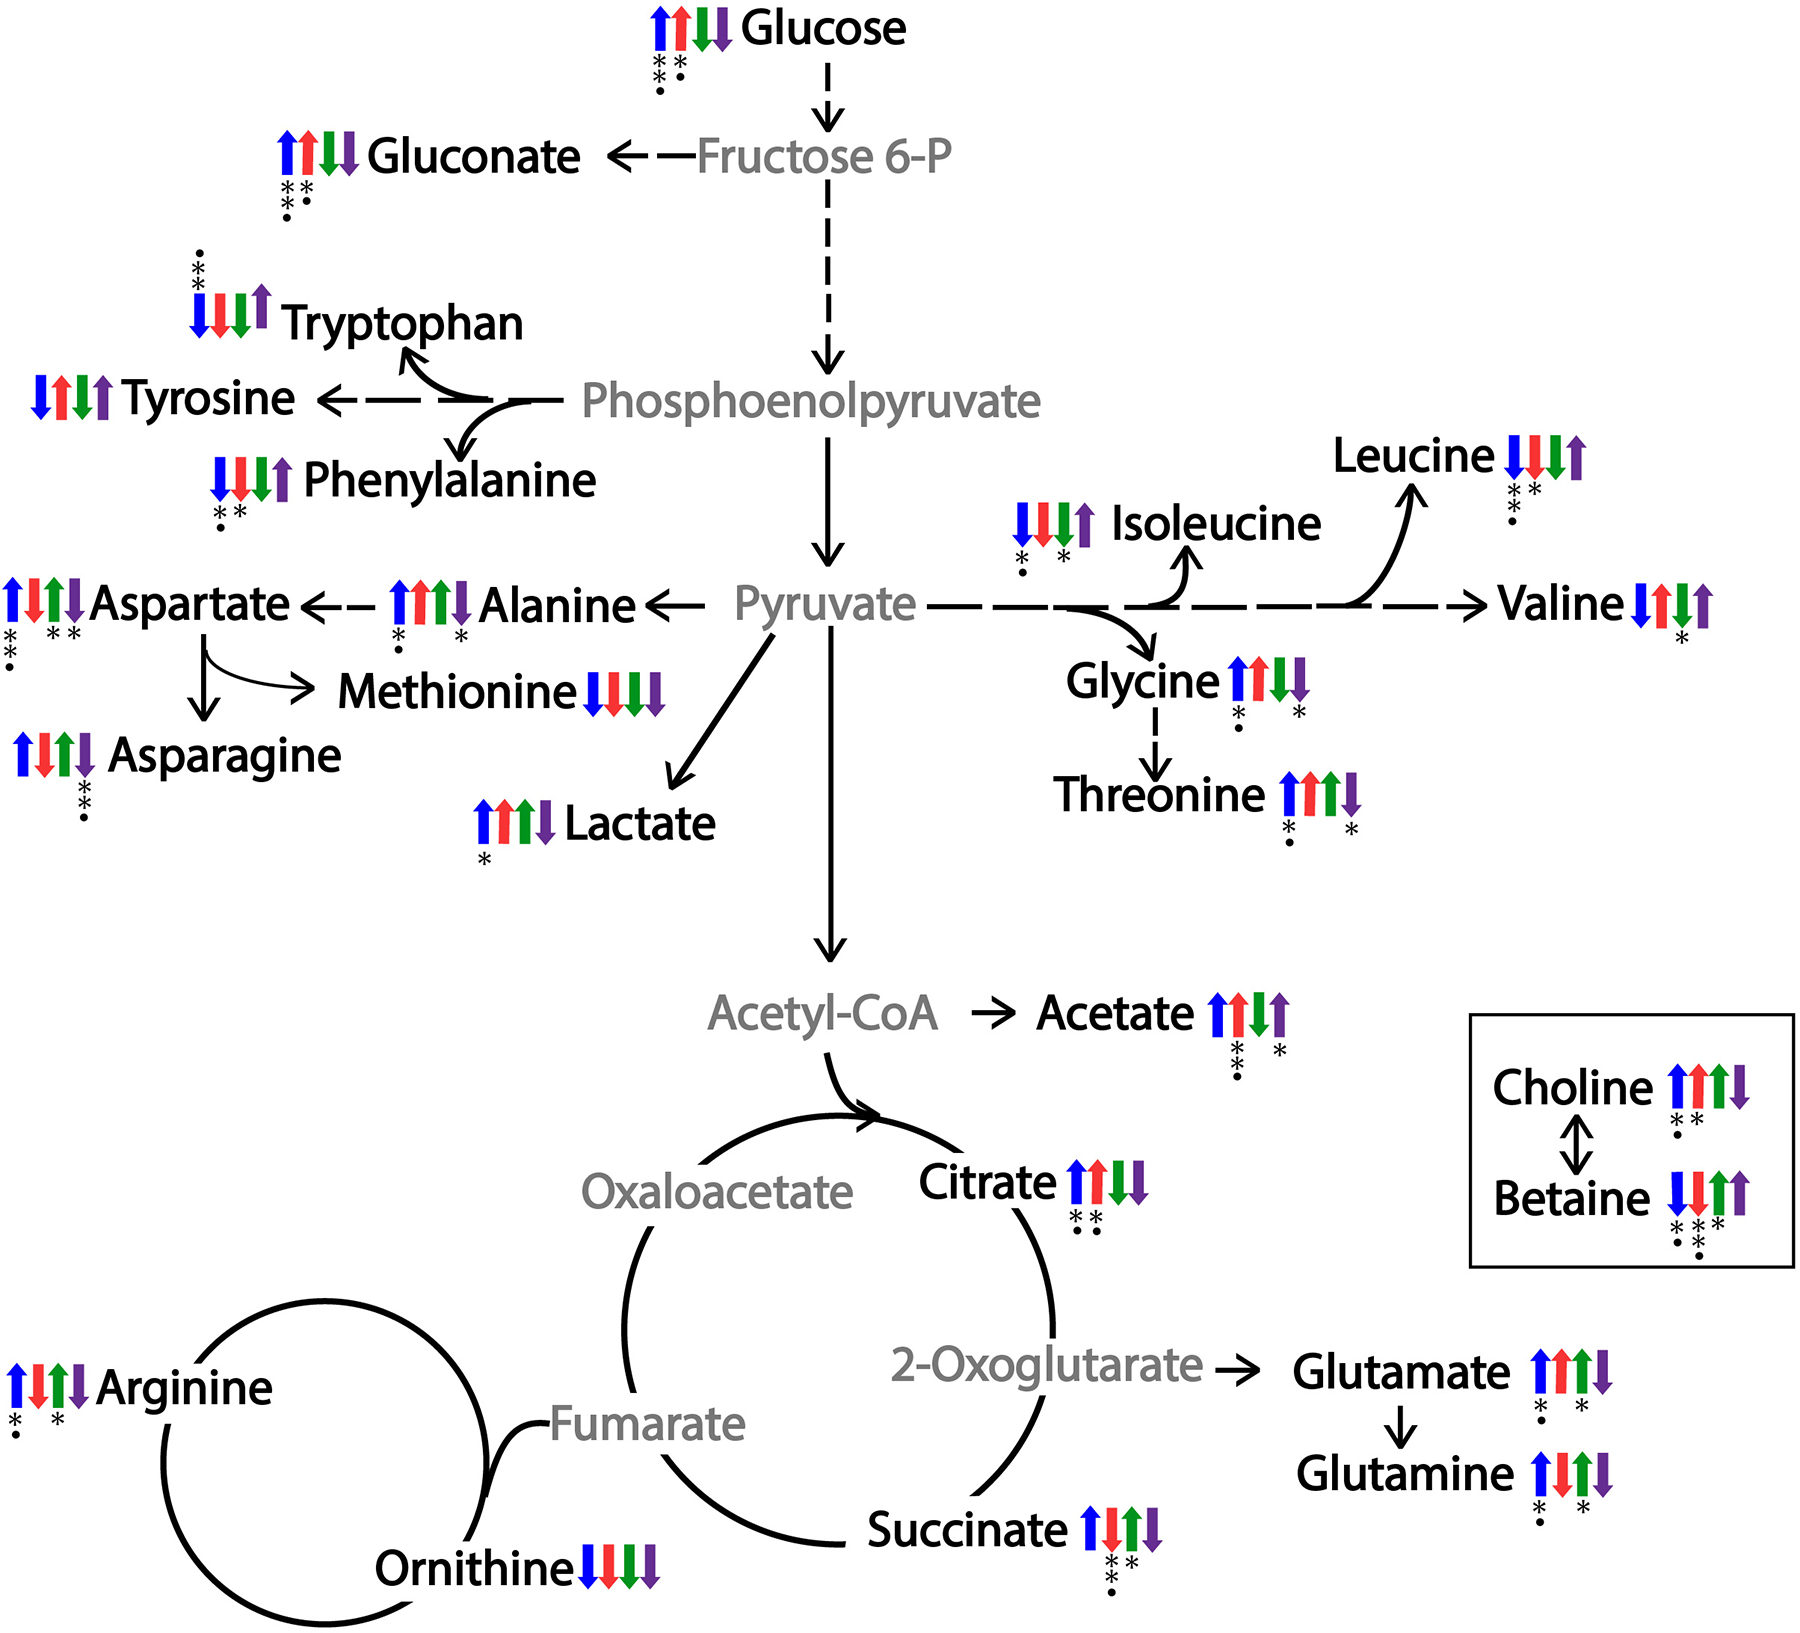
Summary of the metabolic differences between S. aureus strains 616 and 703 in the presence or absence of 55% serum. An up-arrow represents an increase in peak intensities in the 2D 1H-13C HSQC NMR spectra, where a down-arrow represents a decrease in peak intensities. The blue arrow represents strain 616 grown with 55% serum relative to TSB+DEX. The red arrow represents strain 703 grown in 55% serum relative to TSB+DEX. The green arrow compares strain 703 to strain 616 grown in TSB with 3.3 mM glucose. The purple arrow compares strain 703 to strain 616 grown in 55% serum. Intermediate metabolites not observed in the NMR spectra are colored gray. Statistical significance using Student’s t-test is indicated by * p<0.05 and ** p<0.001 and Benjamini-Hochberg corrected p-values are indicated by • p<0.05.
Cultivation in serum significantly decreased the accumulation of glycine betaine in both S. aureus strains 616 and 703 relative to bacteria cultivated in the absence of 55% serum (Figs. 4 and 5). Glycine betaine is an osmoprotectant whose synthesis from choline is regulated in response to the salt concentration of the medium.39 While choline is also an osmoprotectant, it is not as effective as glycine betaine.39 Importantly, the conversion of choline into glycine betaine via a betaine aldehyde intermediate requires oxidized NAD+ or quinone. The elevated level of choline in strains 616 and 703 during cultivation with serum suggests the availability of electron acceptors may be limited, which would be consistent with a CodY-directed increase in fermentation.
Conclusion
Pathogenic bacteria are routinely cultivated in media that are optimized or standardized to enhance a desirable outcome (e.g., high biomass, elaboration of virulence determinants), to facilitate diagnostic tests (e.g., antibiotic susceptibility), or “simulate” host conditions. These media manipulations all provide useful data, but they also generate physiologically and metabolically diverse bacterial states. One such metabolic state was found in S. aureus cultivated with 55% human serum. The presence of serum dramatically altered amino acid biosynthesis and catabolism, enhanced fermentation, and modified a response to salt tolerance. Specifically, significant decreases in glycine betaine, isoleucine, leucine, and valine, and an increase in acetic acid, glutamate, glutamine, lactic acid, and threonine were due to the presence of serum in the culture media. This serum induced metabolic difference was generally consistent between the two S. aureus strains, except for a relative decrease in TCA cycle activity for the daptomycin non-susceptible strain. Notably, both daptomycin susceptible and non-susceptible S. aureus strains exhibited a statistically significant decrease in their susceptibility to daptomycin when serum was added to the culture medium. Metabolism influences every aspect of the bacterial life cycle; hence, understanding how serum alters metabolism is critical to understanding how variations in cultivation conditions or the host’s environment affects antibiotic resistance, virulence, and survival.
Microbiologists routinely use cell-based assays to investigate fundamental questions concerning cellular processes of bacteria, disease pathology and virulence, and antibiotic susceptibility and resistance. These types of assays are also part of a drug discovery effort that commonly includes the application of high-through-put screens (HTS). The success of these endeavors are affected by the choice of cultivation media, as the media alters metabolism, growth, and antibiotic susceptibility. Since the culture media routinely employed in cell-based assays differ substantially from the host environment, an improper choice of culture media may negatively affect the validity, reproducibility, and relevance of a study. One scientific pursuit in which this issue is readily apparent is in the discovery of new antibiotics, which has had limited success over the past few decades.40 While there are a number of factors that have contributed to this poor performance, HTS is commonly cited as a major concern.41 Notably, the analysis of HTS assays to identify factors correlated with success found no difference between target-based (in vitro) and cell-based (in-vivo) assays.42 Strongly suggesting that these cell-based assays were equivalent to in vitro assays in being poor mimics of physiological conditions, which is likely a contributing factor to the low drug discovery success rate. Accordingly, under certain circumstances, investigators may want to adopt media containing serum to better mimic a host environment in both cell-based and HTS assays to improve scientific relevance and to increase the likelihood of successful outcomes.
Supplementary Material
Acknowledgments
We would like to thank Alexandra A. Crook for her assistance in preparing some figures for the manuscript. This work was supported in part by funding from the National Institutes of Health (R01 AI148160, NIAID), the Redox Biology Center (P30 GM103335, NIGMS), and the Nebraska Center for Integrated Biomolecular Communication (P20 GM113126, NIGMS). The research was performed in facilities renovated with support from the National Institutes of Health (RR015468-01).
Footnotes
Notes
The authors declare no competing financial interest.
Associated Content
Supporting Information
The following supporting information is available free of charge at ACS website https://urldefense.com/v3/__http://pubs.acs.org__;!!PvXuogZ4sRB2p-tU!RsHx7kX5ogEWYdqeCSy8SV3LVdZum1Lmqy1bi7v_EmUNy4xtFT91grX6-r8c3NQ2$
Figure S1. Representative 1D 1H NMR spectra.
Figure S2. Representative 2D 1H-13C HSQC NMR spectra.
References
- 1.Ledala N; Zhang B; Seravalli J; Powers R; Somerville GA, Influence of Iron and Aeration on Staphylococcus aureus Growth, Metabolism, and Transcription. Journal of bacteriology 2014, 196 (12), 2178–89. [DOI] [PMC free article] [PubMed] [Google Scholar]
- 2.Somerville GA; Proctor RA, Cultivation conditions and the diffusion of oxygen into culture media: the rationale for the flask-to-medium ratio in microbiology. BMC microbiology 2013, 13, 9. [DOI] [PMC free article] [PubMed] [Google Scholar]
- 3.Oogai Y; Matsuo M; Hashimoto M; Kato F; Sugai M; Komatsuzawa H, Expression of virulence factors by Staphylococcus aureus grown in serum. Appl Environ Microbiol 2011, 77 (22), 8097–105. [DOI] [PMC free article] [PubMed] [Google Scholar]
- 4.Poudel S; Tsunemoto H; Seif Y; Sastry AV; Szubin R; Xu S; Machado H; Olson CA; Anand A; Pogliano J; Nizet V; Palsson BO, Revealing 29 sets of independently modulated genes in Staphylococcus aureus, their regulators, and role in key physiological response. Proc Natl Acad Sci U S A 2020, 117 (29), 17228–17239. [DOI] [PMC free article] [PubMed] [Google Scholar]
- 5.Connolly J; Boldock E; Prince LR; Renshaw SA; Whyte MK; Foster SJ, Identification of Staphylococcus aureus Factors Required for Pathogenicity and Growth in Human Blood. Infect Immun 2017, 85 (11), e00337–17. [DOI] [PMC free article] [PubMed] [Google Scholar]
- 6.Antti H; Fahlgren A; Nasstrom E; Kouremenos K; Sunden-Cullberg J; Guo Y; Moritz T; Wolf-Watz H; Johansson A; Fallman M, Metabolic profiling for detection of Staphylococcus aureus infection and antibiotic resistance. PLoS One 2013, 8 (2), e56971. [DOI] [PMC free article] [PubMed] [Google Scholar]
- 7.Richardson AR; Somerville GA; Sonenshein AL, Regulating the Intersection of Metabolism and Pathogenesis in Gram-positive Bacteria. Microbiology Spectrum 2015, 3 (3), 3.3.11. [DOI] [PMC free article] [PubMed] [Google Scholar]
- 8.Somerville GA; Proctor RA, At the crossroads of bacterial metabolism and virulence factor synthesis in Staphylococci. Microbiol Mol Biol Rev 2009, 73 (2), 233–48. [DOI] [PMC free article] [PubMed] [Google Scholar]
- 9.Ammann CG; Neuhauser D; Eberl C; Nogler M; Coraca-Huber D, Tolerance towards gentamicin is a function of nutrient concentration in biofilms of patient-isolated Staphylococcus epidermidis. Folia Microbiol (Praha) 2018, 63 (3), 299–305. [DOI] [PMC free article] [PubMed] [Google Scholar]
- 10.Mathew J; Sankar P; Varacallo M, Physiology, Blood Plasma. In StatPearls, StatPearls Publishing Copyright © 2022, StatPearls Publishing LLC.:Treasure Island (FL), 2022. [PubMed] [Google Scholar]
- 11.Gaupp R; Ledala N; Somerville GA, Staphylococcal response to oxidative stress. Frontiers in cellular and infection microbiology 2012, 2, 33. [DOI] [PMC free article] [PubMed] [Google Scholar]
- 12.Jones T; Yeaman MR; Sakoulas G; Yang SJ; Proctor RA; Sahl HG; Schrenzel J; Xiong YQ; Bayer AS, Failures in Clinical Treatment of Staphylococcus aureus Infection with Daptomycin Are Associated with Alterations in Surface Charge, Membrane Phospholipid Asymmetry, and Drug Binding. Antimicrob Agents Chemother 2008, 52 (1), 269–78. [DOI] [PMC free article] [PubMed] [Google Scholar]
- 13.Simpson AJ; Brown SA, Purge NMR: effective and easy solvent suppression. J Magn Reson 2005, 175 (2), 340–6. [DOI] [PubMed] [Google Scholar]
- 14.Worley B; Powers R, Deterministic multidimensional nonuniform gap sampling. J. Magn. Reson. 2015, 261 (December 2015), 19–26. [DOI] [PMC free article] [PubMed] [Google Scholar]
- 15.Worley B; Powers R, MVAPACK: A Complete Data Handling Package for NMR Metabolomics. ACS Chem. Biol. 2014, 9 (5), 1138–1144. [DOI] [PMC free article] [PubMed] [Google Scholar]
- 16.Siegel MM, The use of the modified simplex-method for automatic phase correction in Fourier-transform nuclear magnetic-resonance spectroscopy. Analytica Chimica Acta-Computer Techniques and Optimization 1981, 5 (1), 103–108. [Google Scholar]
- 17.Savorani F; Tomasi G; Engelsen SB, icoshift: A versatile tool for the rapid alignment of 1D NMR spectra. J Magn Reson 2010, 202 (2), 190–202. [DOI] [PubMed] [Google Scholar]
- 18.De Meyer T; Sinnaeve D; Van Gasse B; Tsiporkova E; Rietzschel ER; De Buyzere ML; Gillebert TC; Bekaert S; Martins JC; Van Criekinge W, NMR-based characterization of metabolic alterations in hypertension using an adaptive, intelligent binning algorithm. Anal Chem 2008, 80 (10), 3783–90. [DOI] [PubMed] [Google Scholar]
- 19.Eriksson L; Trygg J; Wold S, CV-ANOVA for significance testing of PLS and OPLS (R) models. J Chemometr 2008, 22 (11–12), 594–600. [Google Scholar]
- 20.Delaglio F; Grzesiek S; Vuister GW; Zhu G; Pfeifer J; Bax A, NMRPipe: a multidimensional spectral processing system based on UNIX pipes. J Biomol NMR 1995, 6 (3), 277–93. [DOI] [PubMed] [Google Scholar]
- 21.Johnson BA, Using NMRView to visualize and analyze the NMR spectra of macromolecules. Methods Mol Biol 2004, 278, 313–52. [DOI] [PubMed] [Google Scholar]
- 22.Wishart DS; Jewison T; Guo AC; Wilson M; Knox C; Liu Y; Djoumbou Y; Mandal R; Aziat F; Dong E; Bouatra S; Sinelnikov I; Arndt D; Xia J; Liu P; Yallou F; Bjorndahl T; Perez-Pineiro R; Eisner R; Allen F; Neveu V; Greiner R; Scalbert A, HMDB 3.0--The Human Metabolome Database in 2013. Nucleic Acids Res 2013, 41 (Database issue), D801–7. [DOI] [PMC free article] [PubMed] [Google Scholar]
- 23.Karp PD, BioCyc pathway database collection and the pathway tools software. Abstr Pap Am Chem S 2005, 229, U1178–U1178. [Google Scholar]
- 24.Zhang JD; Wiemann S, KEGGgraph: a graph approach to KEGG PATHWAY in R and bioconductor. Bioinformatics 2009, 25 (11), 1470–1. [DOI] [PMC free article] [PubMed] [Google Scholar]
- 25.Fujikoshi Y, Two-way ANOVA models with unbalanced data. Discrete Mathematics 1993, 116 (1–3), 315–334. [Google Scholar]
- 26.Benjamini Y; Hochberg Y, Controlling the false discovery rate: a practical and powerful approach to multiple testing. Journal of the Royal Statistical Society. Series B (Methodological) 1995, 57 (1), 289–300. [Google Scholar]
- 27.Chong J; Yamamoto M; Xia J, MetaboAnalystR 2.0: From Raw Spectra to Biological Insights. Metabolites 2019, 9 (3), 10.3390/metabo9030057. [DOI] [PMC free article] [PubMed] [Google Scholar]
- 28.Gaupp R; Lei S; Reed JM; Peisker H; Boyle-Vavra S; Bayer AS; Bischoff M; Herrmann M; Daum RS; Powers R; Somerville GA, Staphylococcus aureus metabolic adaptations during the transition from a daptomycin susceptibility phenotype to a daptomycin nonsusceptibility phenotype. Antimicrob Agents Chemother 2015, 59 (7), 4226–38. [DOI] [PMC free article] [PubMed] [Google Scholar]
- 29.Reed JM; Gardner SG; Mishra NN; Bayer AS; Somerville GA, Metabolic interventions for the prevention and treatment of daptomycin non-susceptibility in Staphylococcus aureus. J Antimicrob Chemother 2019, 74 (8), 2274–2283. [DOI] [PubMed] [Google Scholar]
- 30.Leuthner KD; Cheung CM; Rybak MJ, Comparative activity of the new lipoglycopeptide telavancin in the presence and absence of serum against 50 glycopeptide non-susceptible staphylococci and three vancomycin-resistant Staphylococcus aureus. J Antimicrob Chemother 2006, 58 (2), 338–43. [DOI] [PubMed] [Google Scholar]
- 31.Gaupp R; Lei S; Reed JM; Peisker H; Boyle-Vavra S; Bayer AS; Bischoff M; Herrmann M; Daum RS; Powers R; Somerville GA, Staphylococcus aureus metabolic adaptations during the transition from a daptomycin susceptible phenotype to a daptomycin non-susceptible phenotype. Antimicrob Agents Chemother 2015. [DOI] [PMC free article] [PubMed] [Google Scholar]
- 32.Fan TWM; Lorkiewicz PK; Sellers K; Moseley HNB; Higashi RM; Lane AN, Stable isotope-resolved metabolomics and applications for drug development. Pharmacol. Ther. 2012, 133 (3), 366–391. [DOI] [PMC free article] [PubMed] [Google Scholar]
- 33.Majerczyk CD; Dunman PM; Luong TT; Lee CY; Sadykov MR; Somerville GA; Bodi K; Sonenshein AL, Direct targets of CodY in Staphylococcus aureus. Journal of bacteriology 2010, 192 (11), 2861–77. [DOI] [PMC free article] [PubMed] [Google Scholar]
- 34.Majerczyk CD; Sadykov MR; Luong TT; Lee C; Somerville GA; Sonenshein AL, Staphylococcus aureus CodY negatively regulates virulence gene expression. Journal of bacteriology 2008, 190 (7), 2257–65. [DOI] [PMC free article] [PubMed] [Google Scholar]
- 35.Rom JS; Atwood DN; Beenken KE; Meeker DG; Loughran AJ; Spencer HJ; Lantz TL; Smeltzer MS, Impact of Staphylococcus aureus regulatory mutations that modulate biofilm formation in the USA300 strain LAC on virulence in a murine bacteremia model. Virulence 2017, 8 (8), 1776–1790. [DOI] [PMC free article] [PubMed] [Google Scholar]
- 36.Smaldone GT; Revelles O; Gaballa A; Sauer U; Antelmann H; Helmann JD, A global investigation of the Bacillus subtilis iron-sparing response identifies major changes in metabolism. Journal of bacteriology 2012, 194 (10), 2594–605. [DOI] [PMC free article] [PubMed] [Google Scholar]
- 37.Halsey CR; Lei S; Wax JK; Lehman MK; Nuxoll AS; Steinke L; Sadykov M; Powers R; Fey PD, Amino Acid Catabolism in Staphylococcus aureus and the Function of Carbon Catabolite Repression. mBio 2017, 8 (1). [DOI] [PMC free article] [PubMed] [Google Scholar]
- 38.Dineen SS; McBride SM; Sonenshein AL, Integration of metabolism and virulence by Clostridium difficile CodY. Journal of bacteriology 2010, 192 (20), 5350–62. [DOI] [PMC free article] [PubMed] [Google Scholar]
- 39.Graham JE; Wilkinson BJ, Staphylococcus aureus osmoregulation: roles for choline, glycine betaine, proline, and taurine. Journal of bacteriology 1992, 174 (8), 2711–6. [DOI] [PMC free article] [PubMed] [Google Scholar]
- 40.Boyd NK; Teng C; Frei CR, Brief Overview of Approaches and Challenges in New Antibiotic Development: A Focus On Drug Repurposing. Frontiers in cellular and infection microbiology 2021, 11. [DOI] [PMC free article] [PubMed] [Google Scholar]
- 41.Macarron R; Banks MN; Bojanic D; Burns DJ; Cirovic DA; Garyantes T; Green DVS; Hertzberg RP; Janzen WP; Paslay JW; Schopfer U; Sittampalam GS, Impact of high-throughput screening in biomedical research. Nature Reviews Drug Discovery 2011, 10 (3), 188–195. [DOI] [PubMed] [Google Scholar]
- 42.Bender A; Bojanic D; Davies JW; Crisman TJ; Mikhailov D; Scheiber J; Jenkins JL; Deng Z; Hill WA; Popov M; Jacoby E; Glick M, Which aspects of HTS are empirically correlated with downstream success? Curr Opin Drug Discov Devel 2008, 11 (3), 327–37. [PubMed] [Google Scholar]
Associated Data
This section collects any data citations, data availability statements, or supplementary materials included in this article.


