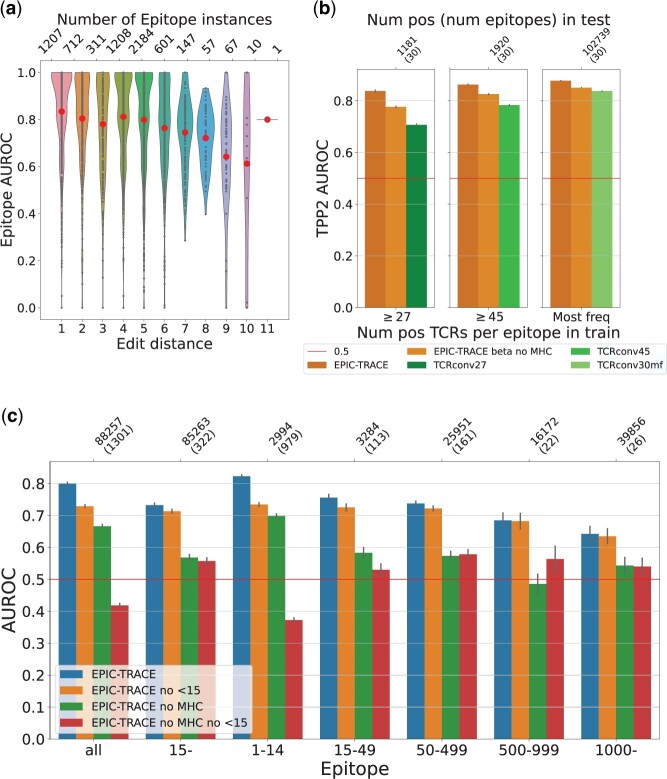
Figure 3.
(a) Violin plot of AUROC scores grouped by minimum edit distance to train dataset. The large (red) dots are (unweighted) averages of the scores for the given minimum edit distance. (b) Comparison to TCRconv. TCRconv was trained on three subsets of 30 epitopes from the dataset and compared to EPIC-TRACE trained on full folds either with all or reduced input features. The y-axis shows average per epitope AUROC values of frequency binned epitopes with standard error. (c) Comparison of models trained with all datapoints or by discarding epitopes with <15 TCRs from training for TPP3. Models were trained with or without MHC information. The y-axis shows the average per epitope AUROC with standard error.

