Abstract
The 3′-terminal 350 nucleotides of the tobacco etch potyvirus (TEV) genome span the end of the capsid protein (CP)-coding sequence and the 3′ nontranslated region (NTR). The CP-coding sequence within this region contains a 105-nucleotide cis-active element required for genome replication (S. Mahajan, V. V. Dolja, and J. C. Carrington, J. Virol. 70:4370–4379, 1996). To investigate the sequence and secondary structure requirements within the CP cis-active region and the 3′ NTR, a systematic linker-scanning mutagenesis analysis was done. Forty-six mutations, each with two to six nucleotide substitutions, were introduced at consecutive hexanucleotide positions in the genome of a recombinant TEV strain expressing a reporter protein (β-glucuronidase). Genome amplification activity of each mutant in the protoplast cell culture system was measured. Mutations that severely debilitated genome amplification were identified throughout the CP-coding cis-active sequence and at several distinct locations within the 3′ NTR. However, based on a computer model of RNA folding, mutations that had the most severe effects mapped to regions that were predicted to form base-paired secondary structures. Linker-scanning mutations predicted to affect either strand of a base-paired structure within the CP-coding cis-active sequence, a base-paired structure between two segments of the CP-coding cis-active sequence and a contiguous 14-nucleotide segment of the 3′ NTR, and a base-paired structure near the 3′ terminus of the 3′ NTR inactivated genome amplification. Compensatory mutations that restored base pair interactions in each of these regions restored amplification activity, although to differing levels depending on the structure restored. These data reveal that the 3′ terminus of the TEV genome consists of a series of functionally discrete sequences and secondary structures and that the CP-coding sequence and 3′ NTR are coadapted for genome amplification function through a requirement for base pair interactions.
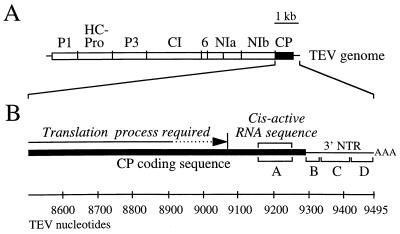
The plant potyviruses are members of the picornavirus supergroup of positive-strand RNA viruses. A typical potyvirus, such as tobacco etch virus (TEV), contains a single-component RNA genome of approximately 10 kilobases that encodes a large polyprotein whose processing is catalyzed by three virus-encoded proteinases (21) (Fig. 1A). The single capsid protein (CP) (263 amino acid residues) is encoded by sequences at the 3′ end of the open reading frame and, with genomic RNA, forms a flexuous rod-shaped virion of 700 to 800 nm in length (24). Based on mutational and biochemical analyses, all of the potyvirus-encoded proteins, except CP, were shown to be necessary for efficient genome replication (5, 11, 13, 15–17, 20, 23, 26).
FIG. 1.
Genetic organization of the TEV genome and CP-coding region. (A) Diagrammatic representation of the TEV genome. Proteins encoded by the designated regions are indicated above the map. Vertical lines indicate sequence encoding polyprotein processing sites. (B) Expanded diagram of the CP-coding region and 3′ NTR. The position at which translation must occur for genome amplification and the position of the 105-nucleotide cis-active RNA sequence are indicated above the map. The four regions (A, B, C, and D) subjected to linker-scanning mutagenesis are indicated below the map. The scale indicates TEV genome nucleotides from the 5′ terminus.
Despite the dispensability of the CP for TEV genome replication, two cis-active properties of the CP-coding region have been identified. First, ribosomes must be able to traverse the CP-coding sequence to a point between codons 138 and 189 (TEV nucleotides 8932 to 9084) (Fig. 1B). Inhibition of translation through the 5′ region of the CP sequence by introduction of stop codons and frameshift mutations results in a genome amplification-defective phenotype (16). However, deletion of CP codons 2 to 189 has no effect on amplification, indicating that neither the CP-coding sequence up to codon 189 nor the product encoded by this sequence is required for amplification. Second, a cis-active RNA sequence between CP codons 211 and 246 (TEV nucleotides 9148 to 9252) (Fig. 1B) is absolutely required, regardless of whether or not it is translated (Fig. 1B). This cis-active sequence occupies a discrete internal region within the CP-coding sequence situated 243 to 347 nucleotides from the 3′ terminal poly(A) tail (16). Computer-generated models of the cis-active CP-coding sequence suggested that this region forms a series of stem-loop structures involving RNA from both CP-coding and 3′ nontranslated sequences (16).
The involvement of cis-active 5′- and 3′-proximal genome sequence in promoting RNA replication is a well-documented feature of positive-strand RNA viruses (for examples, see references 25 and 28). The necessity of cis-active internal genomic RNA sequences for replication is less well documented, although there are a number of examples of such sequences in genomic and defective-interfering RNAs (1, 6, 8, 12, 16). Relatively little is known about the roles of RNA sequences and structures within the 3′ nontranslated region (NTR) of the potyvirus genome, as functional elements have yet to be identified. Rodríguez-Cerezo et al. (22) showed that a duplication mutation that resulted in lengthening of a proposed 3′ NTR stem in tobacco vein mottling potyvirus RNA caused an attenuated symptom phenotype, but the level of RNA accumulation in infected tissue was not affected. The basis for the attenuated phenotype is not clear.
To further investigate the function of the CP-coding cis-active sequence and the 3′ NTR, as well as the proposed secondary structure throughout the region encompassing these sequences, a linker-scanning mutational analysis was done. Recombinant TEV genomes containing linker-scanning substitution mutations spanning most of the 3′-terminal 350 nucleotides were constructed, and their amplification activities in protoplasts were measured. In addition, several genomes with compensatory mutations to restore predicted secondary structures disrupted by the linker-scanning mutations were analyzed. The data support a model in which several secondary structures involving both CP-coding and 3′ NTR sequences are necessary for TEV RNA replication.
MATERIALS AND METHODS
Linker-scanning mutagenesis.
All mutagenesis was done by the method of Kunkel et al. (14) with the intermediate plasmid pTL7SN-SP3′StuI (16). Consecutive hexanucleotide sequences between nucleotides 9145 and 9495 (3′ end) were replaced by the sequence ACGCGT (MluI site). The codes for each mutation, and the specific nucleotides substituted, are indicated throughout the text.
Each mutation was transferred from the intermediate plasmid to pTEV-7DANG↓H (10), a plasmid containing complementary DNA representing the genome of a recombinant TEV strain, TEV-GUS. This TEV-GUS genome encodes β-glucuronidase (GUS) as a reporter. Details of subcloning into pTEV-7DANG↓H are given elsewhere (10).
Compensatory mutations to restore predicted secondary structures were introduced into several of the linker-scanning mutagenized genomes. The pTL7SN-SP3′StuI-derived plasmid with the linker-scanning mutation was remutagenized, and the resulting genome segment containing both linker-scanning and compensatory mutations was subcloned into pTEV-7DANG↓H.
In vitro transcription and inoculation of protoplasts.
Production of capped transcripts from pTEV-7DANG↓H-derived plasmids and inoculation of Nicotiana tabacum cv Xanthi nc protoplasts were performed as described previously (5). All procedures for protoplast culturing, harvesting, and quantitation of GUS activity (pmol/min/105 protoplasts) were published previously (4). The relative amplification level of each mutant based on GUS activity at 72 h postinfection (p.i.) was calculated by using mean GUS activity in TEV-GUS-infected cells as the 100% standard. In all experiments, a minimum of three replicate inoculations with TEV-GUS and mutant genomes was done. Relative amplification levels were calculated by using only mutant and parental TEV-GUS activity values derived from the same batch of protoplasts.
In vitro translation.
Noncapped transcripts were produced from several BglII-digested pTEV-7DANG↓H-derived plasmids as described previously (4), except that the reactions were done at 40°C for 3 h. Transcripts were precipitated in the presence of ethanol, resuspended in diethyl pyrocarbonae-treated water, and subjected to electrophoresis in a 1% agarose gel. After staining with ethidium bromide, the relative concentration of the transcripts was measured using an Eagle Eye II digital-imaging system (Stratagene). Rabbit reticulocyte lysate (Promega) was programmed with normalized amounts of transcript (approximately 250 ng). All reactions (25 μl) were done at 30°C and contained 10 μCi of [35S]methionine (800 Ci/mmol). Aliquots (5 μl) were withdrawn, added to 95 μl of 2% hydrogen peroxide–1 M NaOH at 5-, 12-, and 30-min time points, and incubated for 10 min at 37°C. Incorporation of radiolabel into protein was measured using a trichloroacetic acid precipitation assay with GF/C glass fiber filters (Whatman) and liquid scintillation procedures. For each parental and mutant genome tested, in vitro translation assays were done in triplicate. Statistical analysis of data (Student’s t test) was done with Microsoft Excel.
RNA secondary structure predictions.
Secondary structure predictions for the TEV genome sequence between nucleotides 9145 and 9495 [3′ end, excluding the poly(A) tail] were done using mFOLD version 2.3 (9, 27, 29), with parameters set at 30°C, 1 M NaCl, and no divalent cations.
RESULTS
Secondary structure predictions for the 3′ region of the TEV genome.
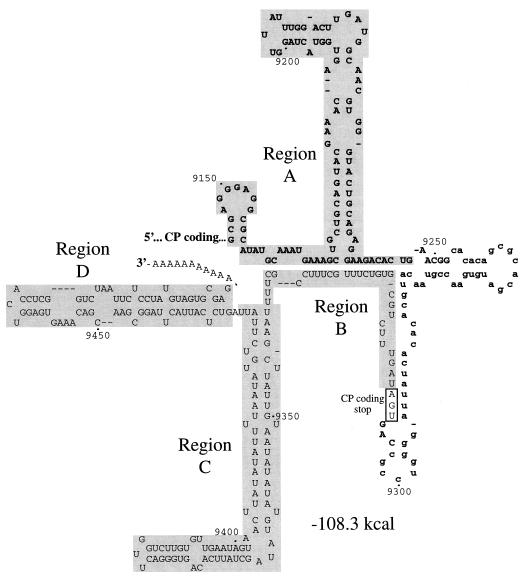
As shown previously (16) and in Fig. 2, the 3′ end of the TEV genome (nucleotides 9145 to 9495) has the potential to fold into a series of stems and loops with an overall free energy of −108.3 kcal/mol. For ease of presentation, this sequence-secondary structure will be discussed as a series of four regions: A, B, C, and D. Region A comprises the cis-active CP sequence between genome nucleotides 9145 and 9247. A notable feature of region A is a perfect 9-bp stem. Region B is composed of the 3′ NTR between the stop codon at the end of the polyprotein-coding sequence and nucleotide 9339. A 14-base segment of region B was predicted to form a base-paired structure with two discrete segments of region A, forming a base (the A-B stem) from which the region A stem ascends. The sequence between regions A and B (nucleotides 9253 to 9303) was shown previously to be dispensable for TEV genome amplification (7) and will not be considered here. Regions C and D contain 3′ NTR sequence from TEV nucleotide 9340 to 9495. Each of these regions was predicted to fold into an independent, extensively base-paired structure.
FIG. 2.
Secondary structure model for the TEV genome RNA sequence encompassing nucleotides 9145 to 9495. The partial CP-coding sequence is indicated by bold; the 3′ NTR region is indicated in regular font. The portion of the CP-coding sequence that is dispensable for genome amplification is indicated by lowercase font. The four regions (A, B, C, and D) subjected to linker-scanning mutagenesis are highlighted in gray.
Linker-scanning mutagenesis of region A.
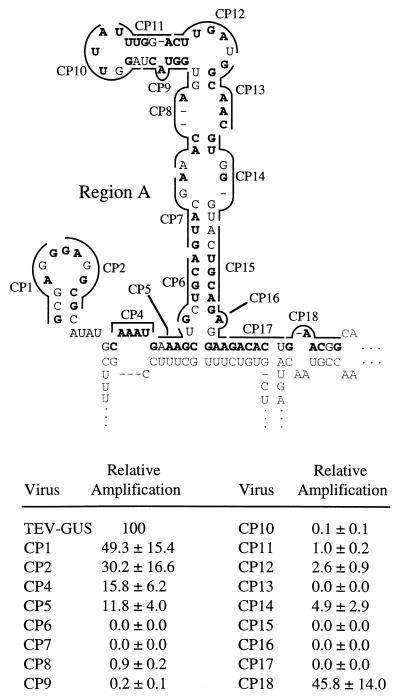
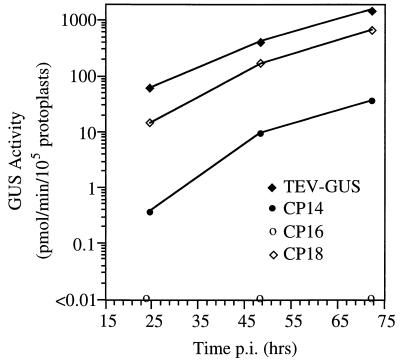
Seventeen linker-scanning mutations were introduced into region A (Fig. 3) of the TEV-GUS genome. Amplification of each mutant and parental genome in tobacco protoplasts was assayed in a time course experiment by measuring GUS activity at 24, 48, and 72 h p.i. As region A contains the CP cis-active sequence, one or more of these mutants were expected to possess amplification defects. Indeed, six region A mutants (CP6, CP7, CP13, CP15, CP16, and CP17) failed to induce detectable GUS activity in inoculated protoplasts at any time point (Fig. 3). Most of the amplification-inactivating mutations affected sequences predicted to form the region A stem and/or the A-B stem. Several mutants (CP8, CP9, CP10, CP11, CP12, and CP14) possessed low, but detectable, genome amplification activity. Each of these debilitated mutants contained nucleotide substitutions in a subregion with a low degree of base pairing in the predicted structure. Linker-scanning mutants with substitutions near the 5′ and 3′ boundaries of region A possessed only modest amplification defects. For the viable mutants, the relative amplification levels (as a percentage of parental TEV-GUS levels) were similar at each time point, regardless of the severity of the amplification defect. For example, CP14 and CP18 accumulated to relative levels of approximately 5 and 45%, respectively, at both 48 and 72 h p.i. (Fig. 4). These data confirm the importance of region A as a critical determinant for TEV genome amplification and suggest a critical role for sequences comprising the region A and A-B stems.
FIG. 3.
Linker-scanning mutagenesis of region A sequence and relative amplification of mutants. (Top) The wild-type (WT) sequence is drawn in proposed secondary structure format with hexanucleotide sequences affected by each mutation (CP1, CP2, CP4, …) indicated by the lines. Each mutagenized sequence resulted in an MluI site (ACGCGU in the RNA) in the intermediate plasmid. Nucleotides that were changed are indicated in bold. Sequences outside region A are indicated by the light font. (Bottom) Relative amplification level of each linker-scanning mutant genome. Using parental TEV-GUS as the 100% standard, mean relative GUS activity ± standard deviation (n = 3) in inoculated protoplasts at 72 h p.i. was calculated.
FIG. 4.
Genome amplification of TEV-GUS and selected mutant genomes in protoplasts. Amplification levels were measured indirectly by using the GUS activity assay at time points 24, 48 and 72 h p.i.
Linker-scanning mutagenesis of region B.
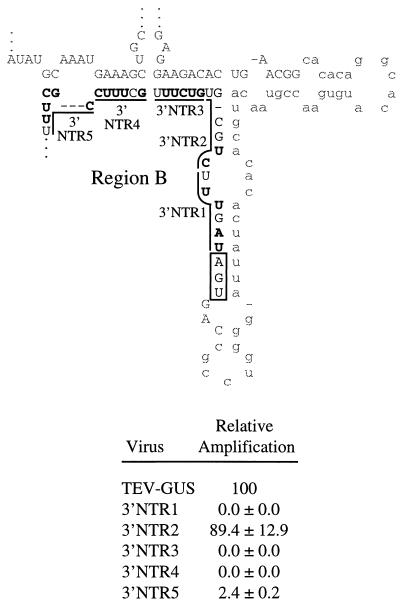
The relatively short region B sequence was modified by introduction of five linker-scanning mutations (Fig. 5). Three region B mutations (3′NTR1, 3′NTR3, and 3′NTR4) inactivated genome amplification. Both mutations that affected the A-B stem (3′NTR3 and 3′NTR4) were in this group. The 3′NTR5 mutation had a significant debilitating effect, although it amplified to a relative level of 2.4%. The 3′NTR2 mutation had no effect on amplification, but this mutation resulted in only two nucleotide substitutions.
FIG. 5.
Linker-scanning mutagenesis of region B sequence and relative amplification of mutants. The format is identical to that used for Fig. 3.
Linker-scanning mutagenesis of region C.
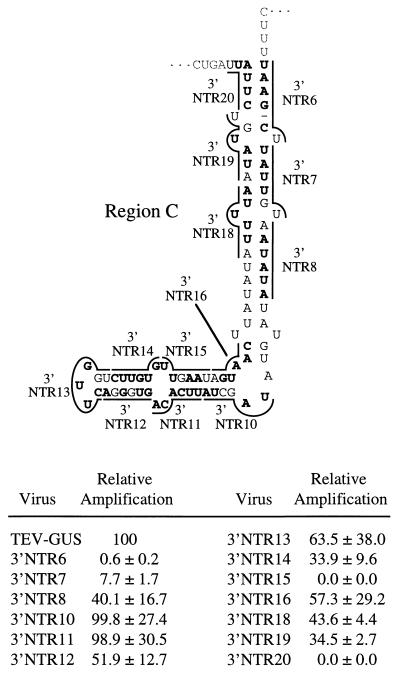
Thirteen linker-scanning mutations affected region C (Fig. 6). In general, this region was tolerant of the linker-scanning mutations, as nine mutants amplified to relative levels of 33% or greater. However, mutations in two subregions had significant debilitating effects. Linker-scanning mutants 3′NTR6 and 3′NTR20, which had substitutions that were predicted to destabilize the top of the region C stem, amplified to relative levels of 0.6 and 0.0%, respectively (Fig. 6). Mutant 3′NTR15, with substitutions predicted to affect three nucleotides of an 8-bp stem and a non-base-paired position, also failed to amplify. However, considering the 3′NTR10 and 3′NTR11 mutants should have also destabilized this predicted base-paired subregion but amplified to parental virus levels (Fig. 6), it is unlikely that the 3′NTR15 mutant defect was due to disruption of this stem. Four independently mutagenized 3′NTR15 sequences, prepared in two different mutagenesis reactions, yielded mutants with the same result (data not shown).
FIG. 6.
Linker-scanning mutagenesis of region C sequence and relative amplification of mutants. The format is identical to that used in Fig. 3.
Linker-scanning mutagenesis of region D.
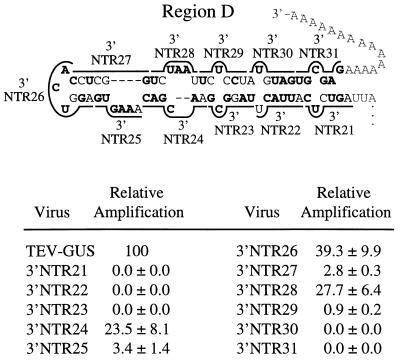
Among the 11 linker-scanning mutants with substitutions in region D (Fig. 7), five (3′NTR21, 3′NTR22, 3′NTR23, 3′NTR30, and 3′NTR31) failed to amplify and one (3′NTR29) amplified to a relative level of 0.9%. Each of these severely debilitated mutants had substitutions affecting sequences contributing to the predicted base-paired subregion on the right side of region D, although five of these mutants also had substitutions of non-base-paired cytosine and uridine residues. The remaining five mutants (3′NTR24, 3′NTR25, 3′NTR26, 3′NTR27, and 3′NTR28) had sequence alterations affecting the left side of region D and amplified to various relative levels of between 2.8 and 39.3%.
FIG. 7.
Linker-scanning mutagenesis of region D sequence and relative amplification of mutants. The format is identical to that used in Fig. 3.
Testing predictions of the roles of secondary structure in TEV genome amplification.
The proposed secondary structure model (Fig. 2) of the TEV genome 3′-proximal sequence was computer-derived using free-energy minimization principles. However, combined with the analysis of the linker-scanning mutants and additional mutants generated by site-specific modification, predictions about the physiological relevance of certain parts of the model can be tested. If a predicted base-paired subregion is important for genome amplification, linker-scanning mutations in each strand comprising the proposed structure should have similar debilitating effects. The linker-scanning mutant analysis suggested that several base-paired structures might be necessary. Mutations in both strands of the region A stem (CP6, CP7, CP15, and CP16) inactivated amplification activity, as did mutations affecting the right side of the A-B stem in region A (CP16 and CP17) and region B (3′NTR3). The importance of the left side of the A-B stem was supported by the inactivating effect of mutation 3′NTR4 in region B but not necessarily by the effects of the CP5 mutation in the opposing strand, which yielded a mutant that amplified to a relative level of 11.8%. A role for part of region C was supported by the debilitating effects of both 3′NTR6 and 3′NTR20 mutations. In addition, the debilitating effects of mutations in each strand on the right side of the region D stem (3′NTR21, 3′NTR22, 3′NTR23, 3′NTR29, 3′NTR30, and 3′NTR31) are consistent with the proposed secondary structure serving a critical function.
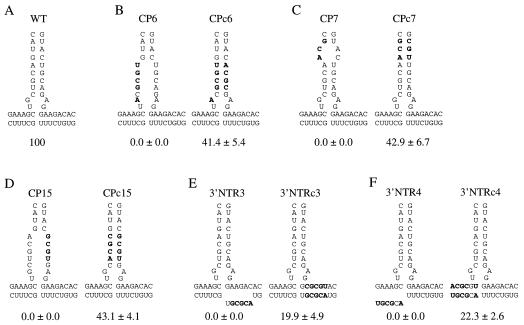
To further test the hypothesis that the predicted base-paired structures comprising the region A stem, the A-B stem, and the region D stem play important roles in genome amplification, compensatory mutations in the complementary strand to restore base pairing in several of the linker-scanning mutant genomes were introduced. Compensatory mutations CPc6, CPc7, and CPc15 were introduced into region A in the genomes of the CP6, CP7, and CP15 mutants, respectively (Fig. 8B, C, and D). For each region A compensatory mutant, genome amplification function was restored to a relative level of greater than 40% of that of parental TEV-GUS. The role of the proposed A-B stem was tested by introduction of compensatory mutations into the CP-coding region of the 3′NTR3 and 3′NTR4 mutant genomes (Fig. 8E and F). Genome amplification activity was restored to relative levels of 19.9 and 22.3% by the 3′NTRc3 and 3′NTRc4 compensatory mutations, respectively. These data provide strong evidence for the presence of the proposed base pairing in the region A and A-B stems and for roles of these secondary structures in genome amplification.
FIG. 8.
Effects of compensatory mutations to restore proposed secondary structures in the region A and A-B stems. (A) Proposed secondary structure at the base of the region A stem and A-B stem of WT sequence. (B to F) Proposed disruption of secondary structure of the region A or A-B stem by the specified linker-scanning mutations (left side of each panel) and restoration of base pairing by compensatory mutations (right side of each panel). Nucleotides that were changed are indicated in bold. The relative amplification level ± standard deviation (n = 3 to 6) of each mutant genome, using parental TEV-GUS as the 100% standard, is shown below each structure.
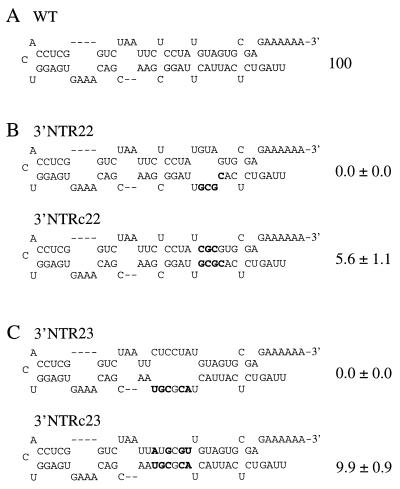
The role of the proposed base pairing in the right side of the region D stem was tested by introduction of compensatory mutations into the 3′NTR22 and 3′NTR23 mutant genomes (Fig. 9B and C). Amplification activity was restored by the 3′NTRc22 and 3′NTRc23 compensatory mutations, although the relative amplification level in each case was less than 10% of that of parental TEV-GUS. This provides support for a stimulatory effect of the region D stem proposed in the model, although it also suggests that additional features in region D were not restored or that the compensatory mutations themselves had debilitating effects.
FIG. 9.
Effects of compensatory mutations to restore proposed secondary structures in the region D stem. (A) Proposed secondary structure of region D of WT sequence. (B and C) Proposed disruption of secondary structure in base-paired segments of region D by the specified linker-scanning mutations (top of each panel) and restoration of base pairing by compensatory mutations (bottom of each panel). Nucleotides that were changed are indicated in bold. The relative amplification level ± standard deviation (n = 3) of each mutant genome, using parental TEV-GUS as the 100% standard, is shown to the right of each structure.
Effect of linker-scanning and compensatory mutations on in vitro translation.
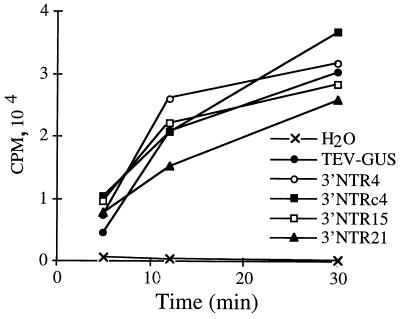
It is possible that the amplification defects of the debilitated linker-scanning mutants were due to indirect effects of reduced translation efficiency. The rabbit reticulocyte lysate in vitro translation system has been useful for understanding translational features, including cap-independent translational enhancement, of the TEV genome. Twelve genomes with linker-scanning mutations, and some with compensatory mutations, were tested for translation efficiency in a time course experiment using the rabbit reticulocyte lysate system. The mutants tested had substitutions affecting the region A stem (CP6 and CPc6), the A-B stem (3′NTR4 and 3′NTRc4), region C (3′NTR15), and region D (3′NTR21, 3′NTR22, 3′NTRc22, 3′NTR23, 3′NTRc23, 3′NTR26, and 3′NTR30). Radiolabel incorporation assays revealed that each mutant genome was translated with an efficiency similar to that of the parental TEV-GUS genome (Fig. 10 and data not shown). No statistically significant differences were detected between the parental TEV-GUS genome and any of the mutant genomes (P > 0.25 in all pairwise comparisons). Similarly, no significant differences (P > 0.26) were detected between the in vitro translation efficiency of four debilitated mutant genomes (CP6, 3′NTR4, 3′NTR22, and 3′NTR23) and the corresponding compensatory mutant genomes (CPc6, 3′NTRc4, 3′NTRc22, or 3′NTRc23). The genome amplification phenotypes of the linker-scanning and compensatory mutants, therefore, do not correlate with translational efficiency in the in vitro assay.
FIG. 10.
Incorporation of [35S]methionine during in vitro translation of TEV-GUS and selected mutant genomes. Data points represent the mean incorporation from three independent translation reactions at 5-, 12-, or 30-min time points. The negative translation control (water) lacked exogenous RNA. CPM, counts per minute.
DISCUSSION
Through a systematic mutational analysis, sequence and secondary structure requirements within a 350-nucleotide segment comprising the 3′ end of the CP-coding region and the 3′ NTR were investigated. Except for three hexanucleotide gaps and a 57-nucleotide sequence spanning the nonessential region at the end of the polyprotein-coding region, the functional properties of the entire sequence were surveyed by linker-scanning mutagenesis. Combined with previous data and computer modeling of secondary structure, the results indicate that cis-active functions are dispersed noncontiguously in the CP-coding and 3′ noncoding regions, that a series of base-paired regions confer functions necessary for amplification, and that a crucial secondary structure involving base pair interactions between CP-coding and 3′NTR sequences exists.
The cis-active sequence within the CP-coding region (region A) was functionally resolved into a series of three sequences or structures. First, a perfect 9-bp stem formed exclusively by CP-coding sequence within region A is a clear requirement for amplification. Each mutant with disruptions of this structure failed to amplify. As the CPc6, CPc7, and CPc15 compensatory mutants, with up to eight nucleotide substitutions within the structure but with base pairing restored, each amplified to nearly 50% of the level of parental virus, it is likely that functional properties of this subregion are conferred predominantly by secondary (rather than primary) structure. These compensatory mutation data also argue against the interpretation that the amplification defects of the region A mutants were due to effects on the CP translation product. Second, the 42-nucleotide sequence between the two segments comprising the 9-bp structure is necessary for efficient amplification. None of seven mutants with substitutions in this subregion amplified to a relative level greater than 5%. The computer-derived model of secondary structure lacked extensive base pairing through this sequence. Either this sequence is necessary in a form composed largely of single-stranded loops or this sequence adopts a secondary structure that differs from that shown in the model or one that includes noncanonical base pairs. Third, the sequence flanking each side of the 9-bp stem forms a base-paired secondary structure (A-B stem) with a contiguous 14-nucleotide sequence of the 3′ NTR. Support for the existence and importance of the A-B stem derives from the debilitating effects of the CP17, 3′NTR3, and 3′NTR4 linker-scanning mutations affecting this structure and from the 3′NTRc3 and 3′NTRc4 compensatory mutant phenotypes. It should be noted, however, that the CP5 mutation, which should have eliminated base pairing on the left side of this structure, retained nearly 12% relative amplification activity. It is conceivable that the CP5 mutant RNA adopted an alternate secondary structure that compensated partially for the disruption. One possible alternate structure in this region, where region A nucleotides 9149 to 9155 (5′-GGGAGGC-3′) base pair with region B nucleotides 9334 to 9328 (3′-CCUUUCG-5′), was proposed previously (16).
The 3′ NTR was conceptualized, based on the proposed secondary structure, as a series of three separate regions (B, C, and D). As discussed above, region B contributes to the essential A-B stem structure. The requirement for complementarity in the A-B stem indicates that the CP-coding sequence in region A and the 3′ NTR sequence in region B are coadapted to provide a replicative function. The debilitating effect of the 3′NTR1 mutation suggests that the region B sequence immediately following the stop codon for the TEV open reading frame is necessary. The 3′NTR1 mutation should have destabilized a 7-bp secondary structure involving the stop codon, 3′ NTR sequence, and CP-coding sequence (Fig. 5). This proposed secondary structure, however, is unlikely to provide important information for genome amplification as the CP-coding sequence contributing to this structure is clearly dispensable (a deletion mutant lacking TEV nucleotides 9253 to 9303 in the CP-coding region amplifies to a relative level of 82.3% [7]).
The computer model of region C suggested a structure with extensive base pairing. The linker-scanning analysis indicated that the sequences and/or proposed base pair interactions near the proximal part of region C are important, but conclusions about a role for this secondary structure are tenuous as a compensatory mutational analysis in this subregion was not done. Evidence to support a function in genome amplification for most of the remainder of the region C sequence and proposed secondary structure was lacking. Aside from the 3′NTR15 mutation, most of the other region C mutations had relatively little impact on genome amplification. Roles for the central and distal parts of the region C proposed secondary structure, therefore, are not clear. The sequence altered by the 3′NTR15 mutation, while certainly necessary for genome amplification, is unlikely to be required in the context of the secondary structure shown in the model as there was no effect of mutations in the complementary strand of the proposed base-paired structure (3′NTR10 and 3′NTR11 mutations). The critical nucleotides affected by the 3′NTR15 mutation may reside in a single-stranded configuration or may form a base-paired structure different from that predicted.
In contrast to region C, most of region D provides an essential function during TEV genome amplification. The linker-scanning mutants and compensatory mutant analysis supported a role for the proposed base pair interactions on the right side of region D. However, it is reasonable to propose that factors in addition to the base pair interactions proposed are involved in amplification activity. The level of restoration of nonviable region D mutants by introduction of compensatory mutations was relatively low (<10% of parental virus) compared to the level of restoration of compensatory mutations affecting the region A and A-B secondary structures. One reason for the low level may have been negative effects of the linker-scanning mutations and/or compensatory mutations on the primary sequence. The two compensatory mutations introduced into region D each affected nucleotides within 17 positions from the 3′ terminus [excluding the poly(A) tail]. It is likely that key nucleotide or sequence determinants for initiation of negative-strand RNA synthesis reside within this subregion.
While the linker-scanning mutational approach is informative about the requirements for specific nucleotides and sequences in the genome amplification process, the secondary structure model used as a guide to dissect the 3′-terminal 350 nucleotides has definite limitations in the absence of additional experimental data. In general, the compensatory mutation approach provides experimental confirmation of secondary structure only when a proposed structure affects a measurable function. In this case, restoration of genome amplification activity provided an effective means to identify region A, A-B, and D secondary structures contributing to RNA replication. It is stressed, however, that all other features of the secondary structure model are speculative in the absence of experimental data.
Although the precise biochemical functions of the region A and A-B secondary structures are not clear, there are important ramifications for these structures. If one assumes that the region A and A-B secondary structures provide functions necessary for TEV negative-strand RNA synthesis from a positive-strand RNA template and that disruption of these secondary structures would suppress RNA synthesis, then one can propose that replication of any given TEV genome in a cell would be dependent on factors that affect these structures. Considering that the region A stem and one of the strands of the A-B structure are within the CP-coding sequence, an obvious potential influence on secondary structure is the translational apparatus. Passage of ribosomes and associated factors undoubtedly would disrupt these base-paired structures. As a logical extension, a TEV genome undergoing active translation at the 3′ end of the CP-coding region would be a poor template for synthesis of negative-strand RNA. This could conceivably result in functional sequestration of a pool of genomic RNA dedicated to translation. Translational modulation of critical RNA secondary structure is reminiscent of regulation in positive-strand RNA phages, such as MS2 and Qβ. These bacteriophages employ secondary structure as a means to regulate accessibility of start codons, as well as for regulating the interaction of CP and replicase protein with critical cis-active sites (for examples, see references 2, 3, 18, and 19). The dependence on the translation apparatus to provide transient disruption of secondary structure, or to drive formation of alternate secondary structure, is well documented.
A negative impact of translation of the 3′ end of the CP-coding sequence (CP codons 215 and beyond) on RNA replication would be in striking juxtaposition to another requirement for TEV RNA replication. The translation process must occur to a position between CP codons 138 and 189, even though the CP product is not required (16). Several hypotheses, including relief of inhibitory secondary structure(s) and ribosome-associated delivery of cis-active replication proteins to a site near the genome’s 3′ end, were proposed to explain the requirement for translation through part of the CP-coding region. Thus, TEV RNA may function efficiently as a replication template only after ribosomes have reached a specific point within the CP-coding sequence but before they encounter the cis-active region A sequence.
ACKNOWLEDGMENTS
We thank Aaron Unterbrink for providing excellent plant care and maintenance.
This research was supported by grants from the U.S. Department of Agriculture (NRICGP 95-37303-1867) and the National Institutes of Health (AI27832).
REFERENCES
- 1.Ball L A, Li Y. cis-acting requirements for the replication of flock house virus RNA 2. J Virol. 1993;67:3544–3551. doi: 10.1128/jvi.67.6.3544-3551.1993. [DOI] [PMC free article] [PubMed] [Google Scholar]
- 2.Berkhout B, van Duin J. Mechanism of translational coupling between coat protein and replicase genes of RNA bacteriophage MS2. Nucleic Acids Res. 1985;13:6955–6967. doi: 10.1093/nar/13.19.6955. [DOI] [PMC free article] [PubMed] [Google Scholar]
- 3.Berkhout B, Van Strien A, Van Boom J H, Van Westrenen J, Van Duin J. Lysis gene of bacteriophage MS2 is activated by translation termination at the overlapping coat gene. J Mol Biol. 1987;195:517–524. doi: 10.1016/0022-2836(87)90180-x. [DOI] [PubMed] [Google Scholar]
- 4.Carrington J C, Freed D D. Cap-independent enhancement of translation by a plant potyvirus 5′ nontranslated region. J Virol. 1990;64:1590–1597. doi: 10.1128/jvi.64.4.1590-1597.1990. [DOI] [PMC free article] [PubMed] [Google Scholar]
- 5.Carrington J C, Haldeman R, Dolja V V, Restrepo-Hartwig M A. Internal cleavage and trans-proteolytic activities of the VPg-proteinase (NIa) of tobacco etch potyvirus in vivo. J Virol. 1993;67:6995–7000. doi: 10.1128/jvi.67.12.6995-7000.1993. [DOI] [PMC free article] [PubMed] [Google Scholar]
- 6.Chang Y C, Borja M, Scholthof H B, Jackson A O, Morris T J. Host effects and sequences essential for accumulation of defective interfering RNAs of cucumber necrosis and tomato bushy stunt tombusviruses. Virology. 1995;210:41–53. doi: 10.1006/viro.1995.1315. [DOI] [PubMed] [Google Scholar]
- 7.Dolja V V, Haldeman-Cahill R, Montgomery A E, VandenBosch K A, Carrington J C. Capsid protein determinants involved in cell-to-cell and long distance movement of tobacco etch potyvirus. Virology. 1995;207:1007–1016. doi: 10.1006/viro.1995.1023. [DOI] [PubMed] [Google Scholar]
- 8.French R, Ahlquist P. Intercistronic as well as terminal sequences are required for efficient amplification of brome mosaic virus RNA3. J Virol. 1987;61:1457–1465. doi: 10.1128/jvi.61.5.1457-1465.1987. [DOI] [PMC free article] [PubMed] [Google Scholar]
- 9.Jaeger J A, Turner D H, Zuker M. Improved predictions of secondary structure for RNA. Proc Natl Acad Sci USA. 1989;86:7706–7710. doi: 10.1073/pnas.86.20.7706. [DOI] [PMC free article] [PubMed] [Google Scholar]
- 10.Kasschau K D, Carrington J C. Requirement for HC-Pro processing during genome amplification of tobacco etch potyvirus. Virology. 1995;209:268–273. doi: 10.1006/viro.1995.1254. [DOI] [PubMed] [Google Scholar]
- 11.Kasschau K D, Cronin S, Carrington J C. Genome amplification and long-distance movement functions associated with the central domain of tobacco etch potyvirus helper component-proteinase. Virology. 1997;228:251–262. doi: 10.1006/viro.1996.8368. [DOI] [PubMed] [Google Scholar]
- 12.Kim Y N, Jeong Y S, Makino S. Analysis of cis-acting sequences essential for coronavirus defective interfering RNA replication. Virology. 1993;197:53–63. doi: 10.1006/viro.1993.1566. [DOI] [PMC free article] [PubMed] [Google Scholar]
- 13.Klein P G, Klein R R, Rodríguez-Cerezo E, Hunt A G, Shaw J G. Mutational analysis of the tobacco vein mottling virus genome. Virology. 1994;204:759–769. doi: 10.1006/viro.1994.1591. [DOI] [PubMed] [Google Scholar]
- 14.Kunkel T A, Roberts J D, Zakour R. Rapid and efficient site-specific mutagenesis without phenotypic selection. Methods Enzymol. 1987;154:367–382. doi: 10.1016/0076-6879(87)54085-x. [DOI] [PubMed] [Google Scholar]
- 15.Li X H, Carrington J C. Complementation of tobacco etch potyvirus mutants by active RNA polymerase expressed in transgenic cells. Proc Natl Acad Sci USA. 1995;92:457–461. doi: 10.1073/pnas.92.2.457. [DOI] [PMC free article] [PubMed] [Google Scholar]
- 16.Mahajan S, Dolja V V, Carrington J C. Roles of the sequence encoding tobacco etch virus capsid protein in genome amplification: requirements for the translation process and a cis-active element. J Virol. 1996;70:4370–4379. doi: 10.1128/jvi.70.7.4370-4379.1996. [DOI] [PMC free article] [PubMed] [Google Scholar]
- 17.Murphy J F, Klein P G, Hunt A G, Shaw J G. Replacement of the tyrosine residue that links a potyviral VPg to the viral RNA is lethal. Virology. 1996;220:535–538. doi: 10.1006/viro.1996.0344. [DOI] [PubMed] [Google Scholar]
- 18.Peabody D S. The RNA binding site of bacteriophage MS2 coat protein. EMBO J. 1993;12:595–600. doi: 10.1002/j.1460-2075.1993.tb05691.x. [DOI] [PMC free article] [PubMed] [Google Scholar]
- 19.Poot R A, Tsareva N V, Boni I V, van Duin J. RNA folding kinetics regulates translation of phage MS2 maturation gene. Proc Natl Acad Sci USA. 1997;94:10110–10115. doi: 10.1073/pnas.94.19.10110. [DOI] [PMC free article] [PubMed] [Google Scholar]
- 20.Restrepo-Hartwig M A, Carrington J C. The tobacco etch potyvirus 6-kilodalton protein is membrane associated and involved in viral replication. J Virol. 1994;68:2388–2397. doi: 10.1128/jvi.68.4.2388-2397.1994. [DOI] [PMC free article] [PubMed] [Google Scholar]
- 21.Riechmann J L, Laín S, García J A. Highlights and prospects of potyvirus molecular biology. J Gen Virol. 1992;73:1–16. doi: 10.1099/0022-1317-73-1-1. [DOI] [PubMed] [Google Scholar]
- 22.Rodríguez-Cerezo E, Klein P G, Shaw J G. A determinant of disease symptom severity is located in the 3′-terminal noncoding region of the RNA of a plant virus. Proc Natl Acad Sci USA. 1991;88:9863–9867. doi: 10.1073/pnas.88.21.9863. [DOI] [PMC free article] [PubMed] [Google Scholar]
- 23.Schaad M C, Haldeman-Cahill R, Cronin S, Carrington J C. Analysis of the VPg-proteinase (NIa) encoded by tobacco etch potyvirus: effects of mutations on subcellular transport, proteolytic processing, and genome amplification. J Virol. 1996;70:7039–7048. doi: 10.1128/jvi.70.10.7039-7048.1996. [DOI] [PMC free article] [PubMed] [Google Scholar]
- 24.Shukla D D, Ward C W, Brunt A A. The Potyviridae. Oxon, United Kingdom: CAB International; 1994. [Google Scholar]
- 25.Strauss J H, Strauss E G. The alphaviruses: gene expression, replication, and evolution. Microbiol Rev. 1994;58:491–562. doi: 10.1128/mr.58.3.491-562.1994. [DOI] [PMC free article] [PubMed] [Google Scholar]
- 26.Verchot J, Carrington J C. Evidence that the potyvirus P1 protein functions as an accessory factor for genome amplification. J Virol. 1995;69:3668–3674. doi: 10.1128/jvi.69.6.3668-3674.1995. [DOI] [PMC free article] [PubMed] [Google Scholar]
- 27.Walter A E, Turner D H, Kim J, Lyttle M H, Muller P, Mathews D H, Zuker M. Coaxial stacking of helixes enhances binding of oligoribonucleotides and improves predictions of RNA folding. Proc Natl Acad Sci USA. 1994;91:9218–9222. doi: 10.1073/pnas.91.20.9218. [DOI] [PMC free article] [PubMed] [Google Scholar]
- 28.Wimmer E, Hellen C U, Cao X. Genetics of poliovirus. Annu Rev Genet. 1993;27:353–436. doi: 10.1146/annurev.ge.27.120193.002033. [DOI] [PubMed] [Google Scholar]
- 29.Zuker M. On finding all suboptimal foldings of an RNA molecule. Science. 1989;244:48–52. doi: 10.1126/science.2468181. [DOI] [PubMed] [Google Scholar]


