

Summary
The physiological performance of any sensory organ is determined by its anatomy and physical properties. Consequently, complex sensory structures with elaborate features have evolved to optimize stimulus detection. Understanding these structures and their physical nature forms the basis for mechanistic insights into sensory function. Despite its crucial role as a sensor for pheromones and other behaviorally instructive chemical cues, the vomeronasal organ (VNO) remains a poorly characterized mammalian sensory structure. Fundamental principles of its physico-mechanical function, including basic aspects of stimulus sampling, remain poorly explored. Here, we revisit the classical vasomotor pump hypothesis of vomeronasal stimulus uptake. Using advanced anatomical, histological, and physiological methods, we demonstrate that large parts of the lateral mouse VNO are composed of smooth muscle. Vomeronasal smooth muscle tissue comprises two subsets of fibers with distinct topography, structure, excitation-contraction coupling and, ultimately, contractile properties. Specifically, contractions of a large population of noradrenaline-sensitive cells mediate both transverse and longitudinal lumen expansion, whereas cholinergic stimulation targets an adluminal group of smooth muscle fibers. The latter run parallel to the VNO’s rostro-caudal axis and are ideally situated to mediate antagonistic longitudinal constriction of the lumen. This newly discovered arrangement implies a novel mode of function. Single-cell transcriptomics and pharmacological profiling reveal the receptor subtypes involved. Finally, 2/3D tomography provides non-invasive insight into the intact VNO’s anatomy and mechanics, allows measurements of luminal fluid volume, and an assessment of relative volume change upon noradrenergic stimulation. Together, we propose a revised conceptual framework for mouse vomeronasal pumping and, thus, stimulus sampling.
eTOC blurb
Mice detect social chemosignals via the vomeronasal organ. The mechanisms of stimulus sampling, however, remain elusive. Hamacher et al. report that noradrenaline and acetylcholine drive a vomeronasal smooth muscle pump that mediates suction and expulsion of pheromonal stimuli.
Graphical Abstract

Introduction
The performance of any sensory system is determined by the physical nature and operation of its peripheral sensory apparatus. Elaborate structures have evolved to detect, filter, amplify, and adapt to unique and often species-specific sets of adequate sensory stimuli. Knowledge about the physical characteristics of these structures has been crucial to promote an understanding of their functions. In vision, for instance, cornea, iris and lens determine how light is focused onto the retina 1. In the auditory system, air pressure changes at the tympanic membrane are transmitted to the oval window of the cochlea via the malleus, incus, and stapes in the middle ear 2. In olfaction, ortho- and retronasal air flow patterns dictate duration and strength of odor exposure to the main olfactory epithelium 3. Much less, however, is known about a variety of mammalian sensory modalities not included in the five Aristotelian senses.
One prime example of a poorly defined peripheral sensory structure is the VNO 4. In most mammals, it acts as a sensor for pheromones and other behaviorally instructive chemical cues. The VNO is an encapsulated blind-ended tube at the base of the nasal septum, which, in mice, opens via a narrow mucus-filled duct into the nasal cavity 5. Along its rostro-caudal axis, the duct extends into a larger lumen that separates a medial crescent-shaped sensory neuroepithelium from a lateral non-sensory epithelium and cavernous tissue, in which a prominent venous blood vessel provides a characteristic anatomical landmark. While substantial progress in understanding the molecular and cellular mechanisms of vomeronasal signaling has been made in the past decades (see Mohrhardt et al., 2018, and references therein), fundamental aspects of VNO function and anatomy remain elusive. To date, we still have limited knowledge about vomeronasal stimulus uptake and, importantly, stimulus clearance. To access the VNO lumen, chemostimuli are dissolved in the nasal mucus and then sucked into the vomeronasal duct via negative intraluminal pressure. The prevailing view is that during arousal, coordinated vasoconstriction in the richly vascularized cavernous tissue of the lateral VNO drives a hemodynamic vasomotor pump, reminiscent of penile erectile tissue 7. Pioneering work in hamsters and cats 8,9 has supported the vascular pump hypothesis, which was originally proposed by Herzfeld 10. Accordingly, sympathetic innervation of vomeronasal blood vessels by superior cervical ganglion fibers controls fluid entry into the VNO lumen 11–13.
Much less is known about fluid expulsion from the VNO and, thus, stimulus clearance. Given its secluded anatomical location, it has been extremely challenging to determine the precise mechanisms underlying vomeronasal pumping 6. Even the volume of fluid (and therefore the quantity of potential stimuli) that is exchanged by vascular pumping is unclear. If fluids are moved by cyclical vasomotor movements within the vomeronasal capsule, mucus expulsion would be driven by vasodilation, expansion of the lateral cavernous tissue, and a resulting increase in intraluminal pressure. Whether vasodilation results from passive (re)filling of the mostly venous vessels or is driven by endocrine and/or (para)sympathetic activation is currently unknown. Conflicting results were reported on the effects of atropine on vasodilation 8,9. In rats and hamsters, passive venous sinus relaxation and concomitant inflow of blood were proposed to mediate slow cavernous tissue expansion 9,14. Similar to cholinergic control of mucus secretion in guinea pig nasal glands 15, changes in VNO secretory gland activity have also been implicated in fluid expulsion 16. Finally, peripheral fibers of (trigeminal) sensory neurons were previously suggested as mediators of vasodilation 17,18.
Here, we report that large areas of the lateral VNO comprise smooth muscle. Smooth muscle cell (SMC) targeted expression of Ca2+-sensitive proteins reveals that noradrenaline (NA) and acetylcholine (ACh) activate topographically distinct SMC populations, each displaying different fiber orientations. A solely NA-sensitive SMC population is located more laterally and shows a circumferential arrangement around the venous sinus. By contrast, ACh-sensitive fibers close to the lumen run longitudinally along the rostro-caudal VNO axis. Single-cell RNAseq and pharmacology demonstrate that vomeronasal SMCs express α2-adrenergic and M3 muscarinic ACh receptors. In both acute horizontal tissue sections and whole-mount ex vivo preparations of the decapsulated organ, NA and ACh trigger qualitatively distinct soft tissue contractions. In slices that retain the VNO cartilaginous capsule, NA-induced contractions cause luminal expansion that is much larger than the constriction of the venous sinus. Concomitant cholinergic tone increases NA-dependent contraction strength and accelerates relaxation. Finally, optical coherence tomography (OCT) of the intact VNO allows both measurement of luminal volume and assessment of relative volume change upon NA exposure. Together, these data pave the way to deeper mechanistic insights into VNO function.
Results
The mouse lateral VNO is predominantly composed of smooth muscle
To gain a conceptual mechanistic understanding of vomeronasal stimulus sampling we revisited the vasomotor pump hypothesis that was brought forward by classical work in hamsters and cats 8,9. Specifically, we aimed to visualize the cavernous tissue vasculature and associated vascular SMC layers. Since the most prominent blood vessels in the lateral VNO are veins 18,19, we expected relatively thin smooth muscle sheaths restricted to the vascular tunica media. Surprisingly, that is not the case (Figure 1). In both coronal and horizontal VNO sections (Figure 1A), co-immunostaining against platelet endothelial cell adhesion molecule-1 (PECAM1; a.k.a. CD31) and α-smooth muscle actin (α-SMA), markers for endothelial cells and SMCs, respectively, reveals a dense smooth muscle network throughout the lateral VNO (Figure 1B & C). Only in the most anterior VNO, SMC localization is somewhat restricted to the perivascular envelope (Figure 1BI). Small vessels in the medial sensory epithelium are essentially devoid of SMCs. Notably, prominent α-SMA staining is apparent throughout the entire posterior aspect of the VNO, largely independent of endothelial position (Figure 1DIII). Together, these data reveal that SMCs represent a large, if not predominant fraction of cells in the cavernous tissue of the lateral and posterior VNO. Thus, these abundant SMCs could power a vomeronasal pump that operates largely independent of classical vasomotor mechanisms.
Figure 1 |. The mouse lateral VNO is predominantly composed of smooth muscle.
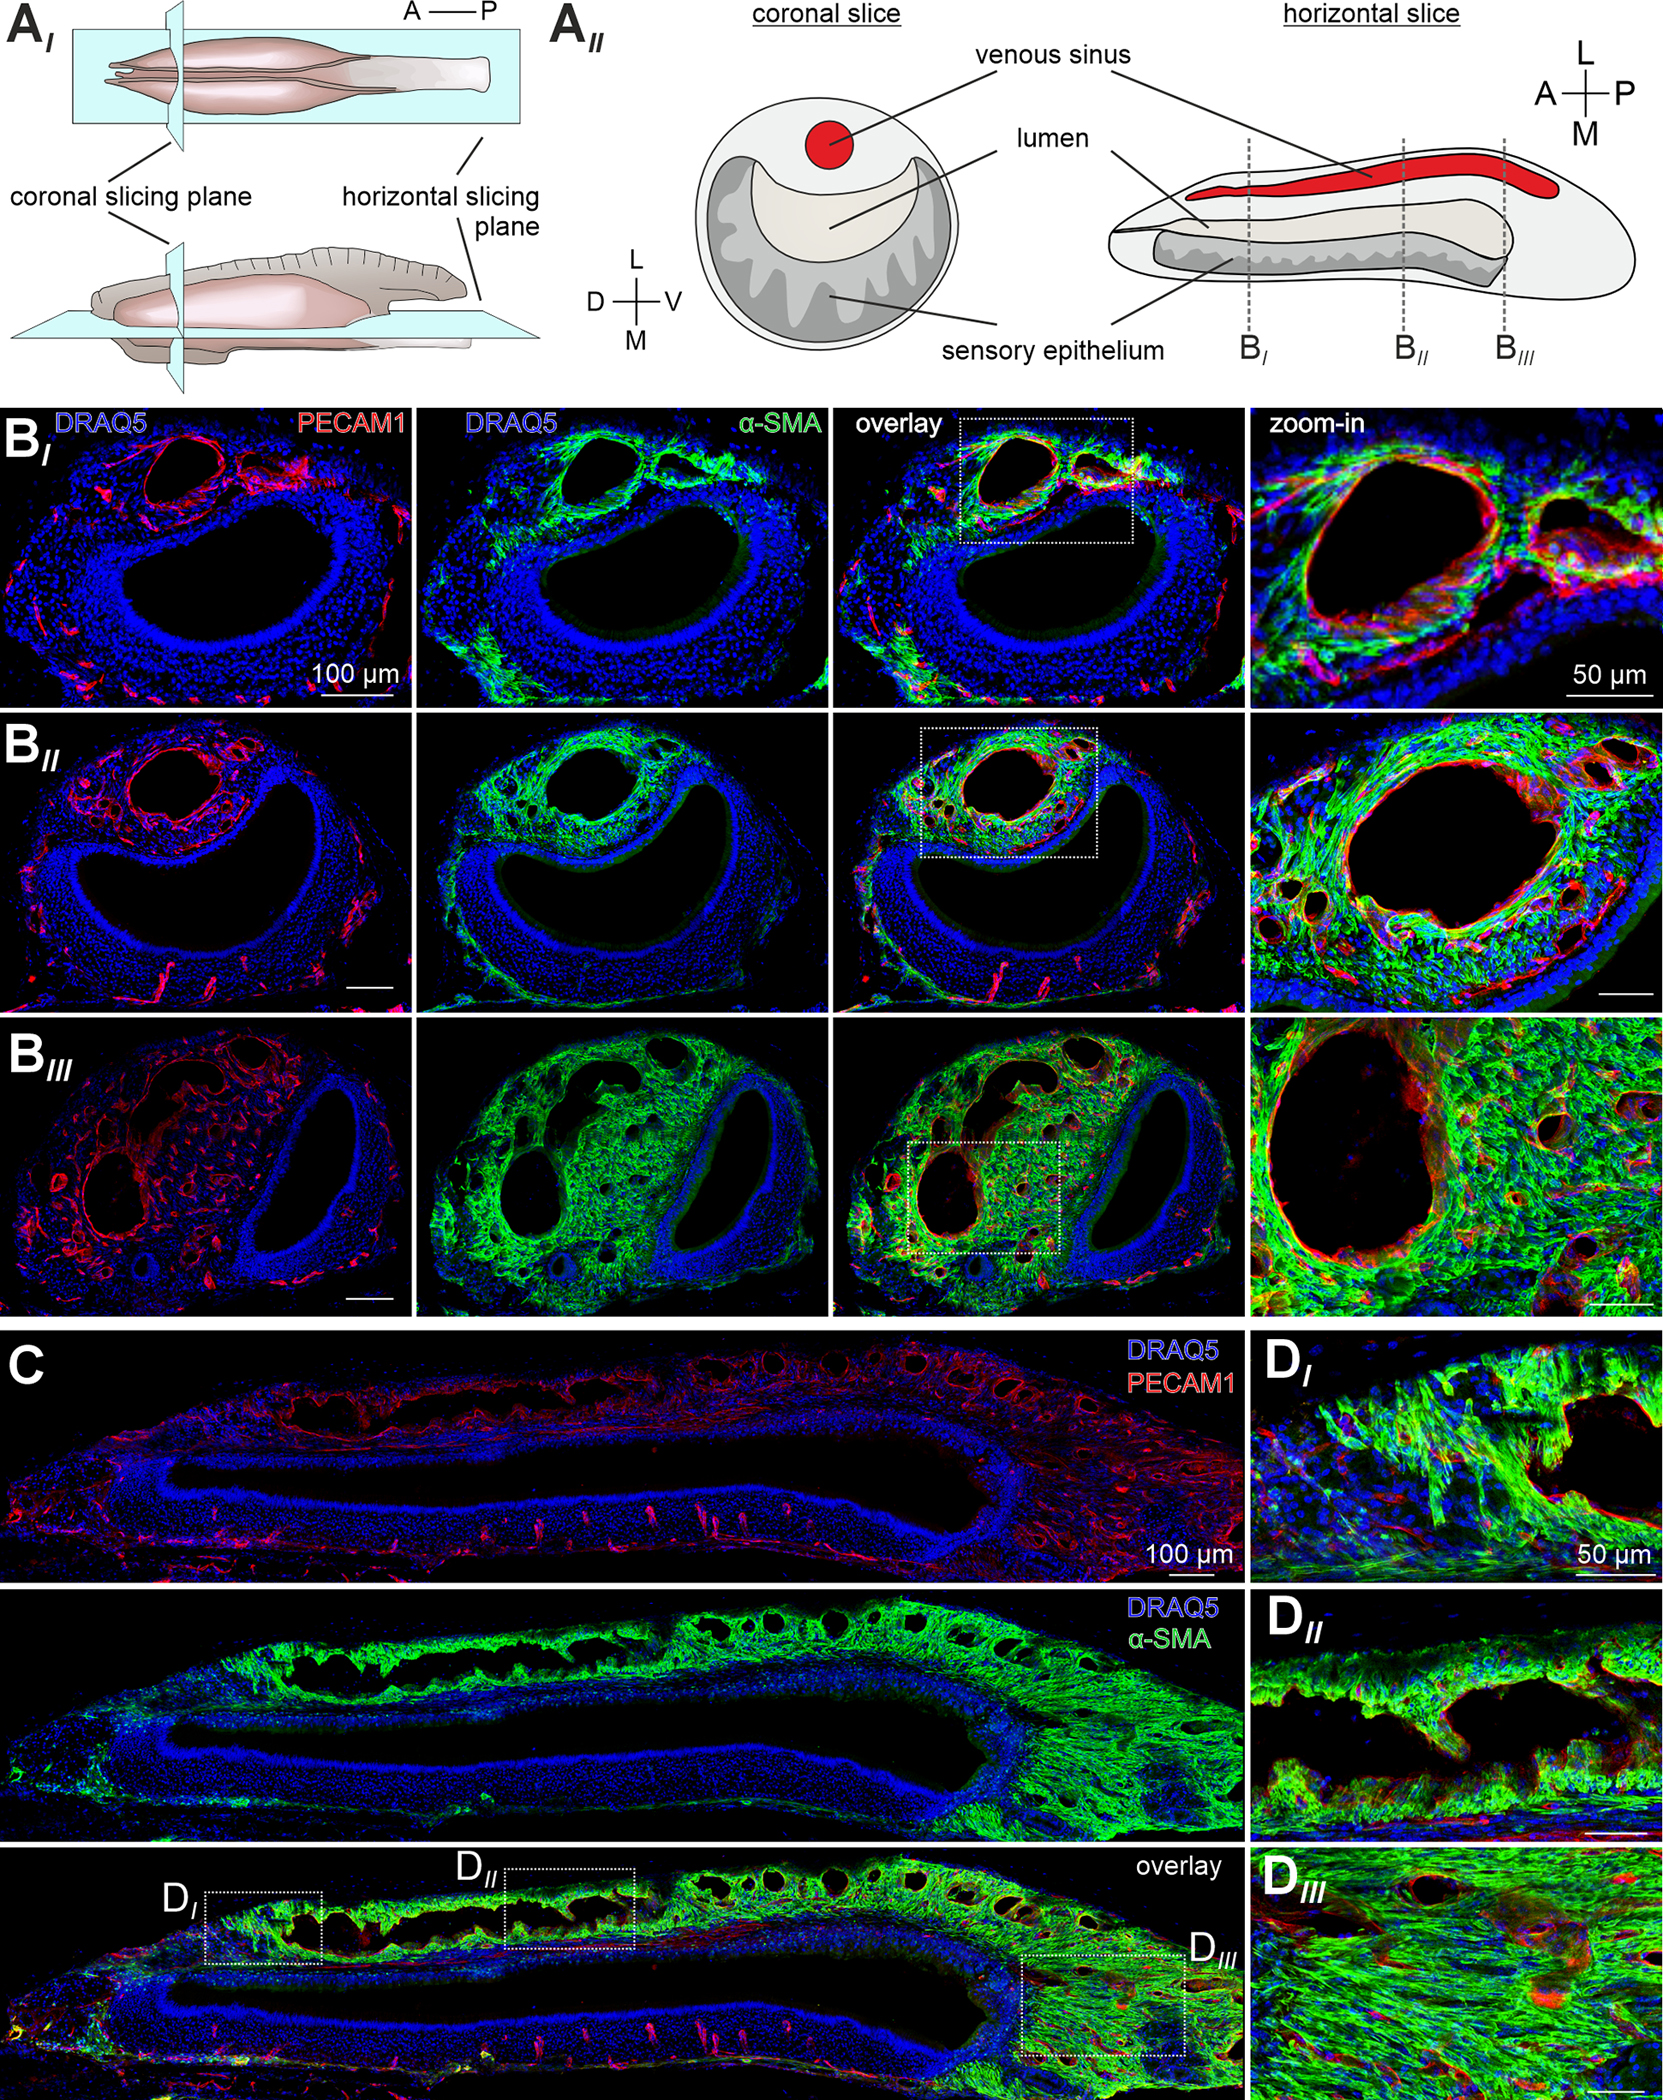
(A) Schematics illustrating the mouse VNO, histological section planes (AI), and corresponding coronal and horizontal slices (AII). (B-D) Co-immunostaining against markers for vascular endothelial cells (platelet endothelial cell adhesion molecule-1 (PECAM1); red) and SMCs (α-smooth muscle actin (α-SMA); green). Nuclear staining with DRAQ5 (blue). Representative coronal (B) and horizontal (C&D) cryosections (30 μm) depict a dense smooth muscle network throughout the lateral and posterior VNO. Anterior (BI), intermediate (BII), and posterior (BIII) coronal section planes as indicated in (AII). White dashed rectangles (B&C) delimit the zoomed-in areas in (B; left) and (DI-III). Note that, only in the anterior VNO, SMC localization is somewhat restricted to the perivascular envelope, whereas prominent α-SMA staining is observed throughout the intermediate and posterior cavernous tissue, largely independent of endothelial position. A, anterior; D, dorsal; L, lateral; M, medial; P, posterior; V, ventral. See also Figures S1 and S2.
Noradrenaline activates the smooth muscle pump via external Ca2+ influx
Previous work had implicated activation of sympathetic fibers from the superior cervical ganglion in VNO stimulus uptake 11–13. Therefore, if the large population of lateral SMCs drives vomeronasal pumping, exposure to the sympathetic transmitter NA should stimulate coordinated Ca2+ signals and concomitant contractions in the lateral VNO. To address this hypothesis, we employed a quasi-simultaneous image acquisition method 20 that enables parallel recording of both SMC Ca2+ responses and vomeronasal contractions (Figure 2A). To this end, we used SMMHC-CreERT2 x Ai95D mice to express the Ca2+ indicator GCaMP6f in SMCs 20,21. First, we confirmed SMC-targeted reporter expression via colocalization of tdTomato and α-SMA in SMMHC-CreERT2 x Ai14D mice (Figure S1). Second, when stimulating acute coronal VNO slices from SMMHC-CreERT2 x Ai95D mice with brief focal NA ‘puffs’, we observed robust Ca2+ transients in large areas of the lateral cavernous tissue (Figure 2A; Video S1). Such signals usually coincided with pronounced contractile motion of the lateral VNO. Using the area occupied by the large venous sinus as a proxy, movement was quantified as the relative change in sinus area 20. Plotting the Ca2+ signal and sinus area change as functions of time reveals strong correlation between both parameters (Figure 2B). Contractile movement is dose-dependent with a NA threshold concentration of ~1 μM and an EC50 value of ~5 μM (Figure 2C). Repetitive stimulation did not mediate strong potentiation or depression of contraction strength (Figure 2CII, inset).
Figure 2 |. Noradrenaline activates the lateral smooth muscle pump via external Ca2+ influx.
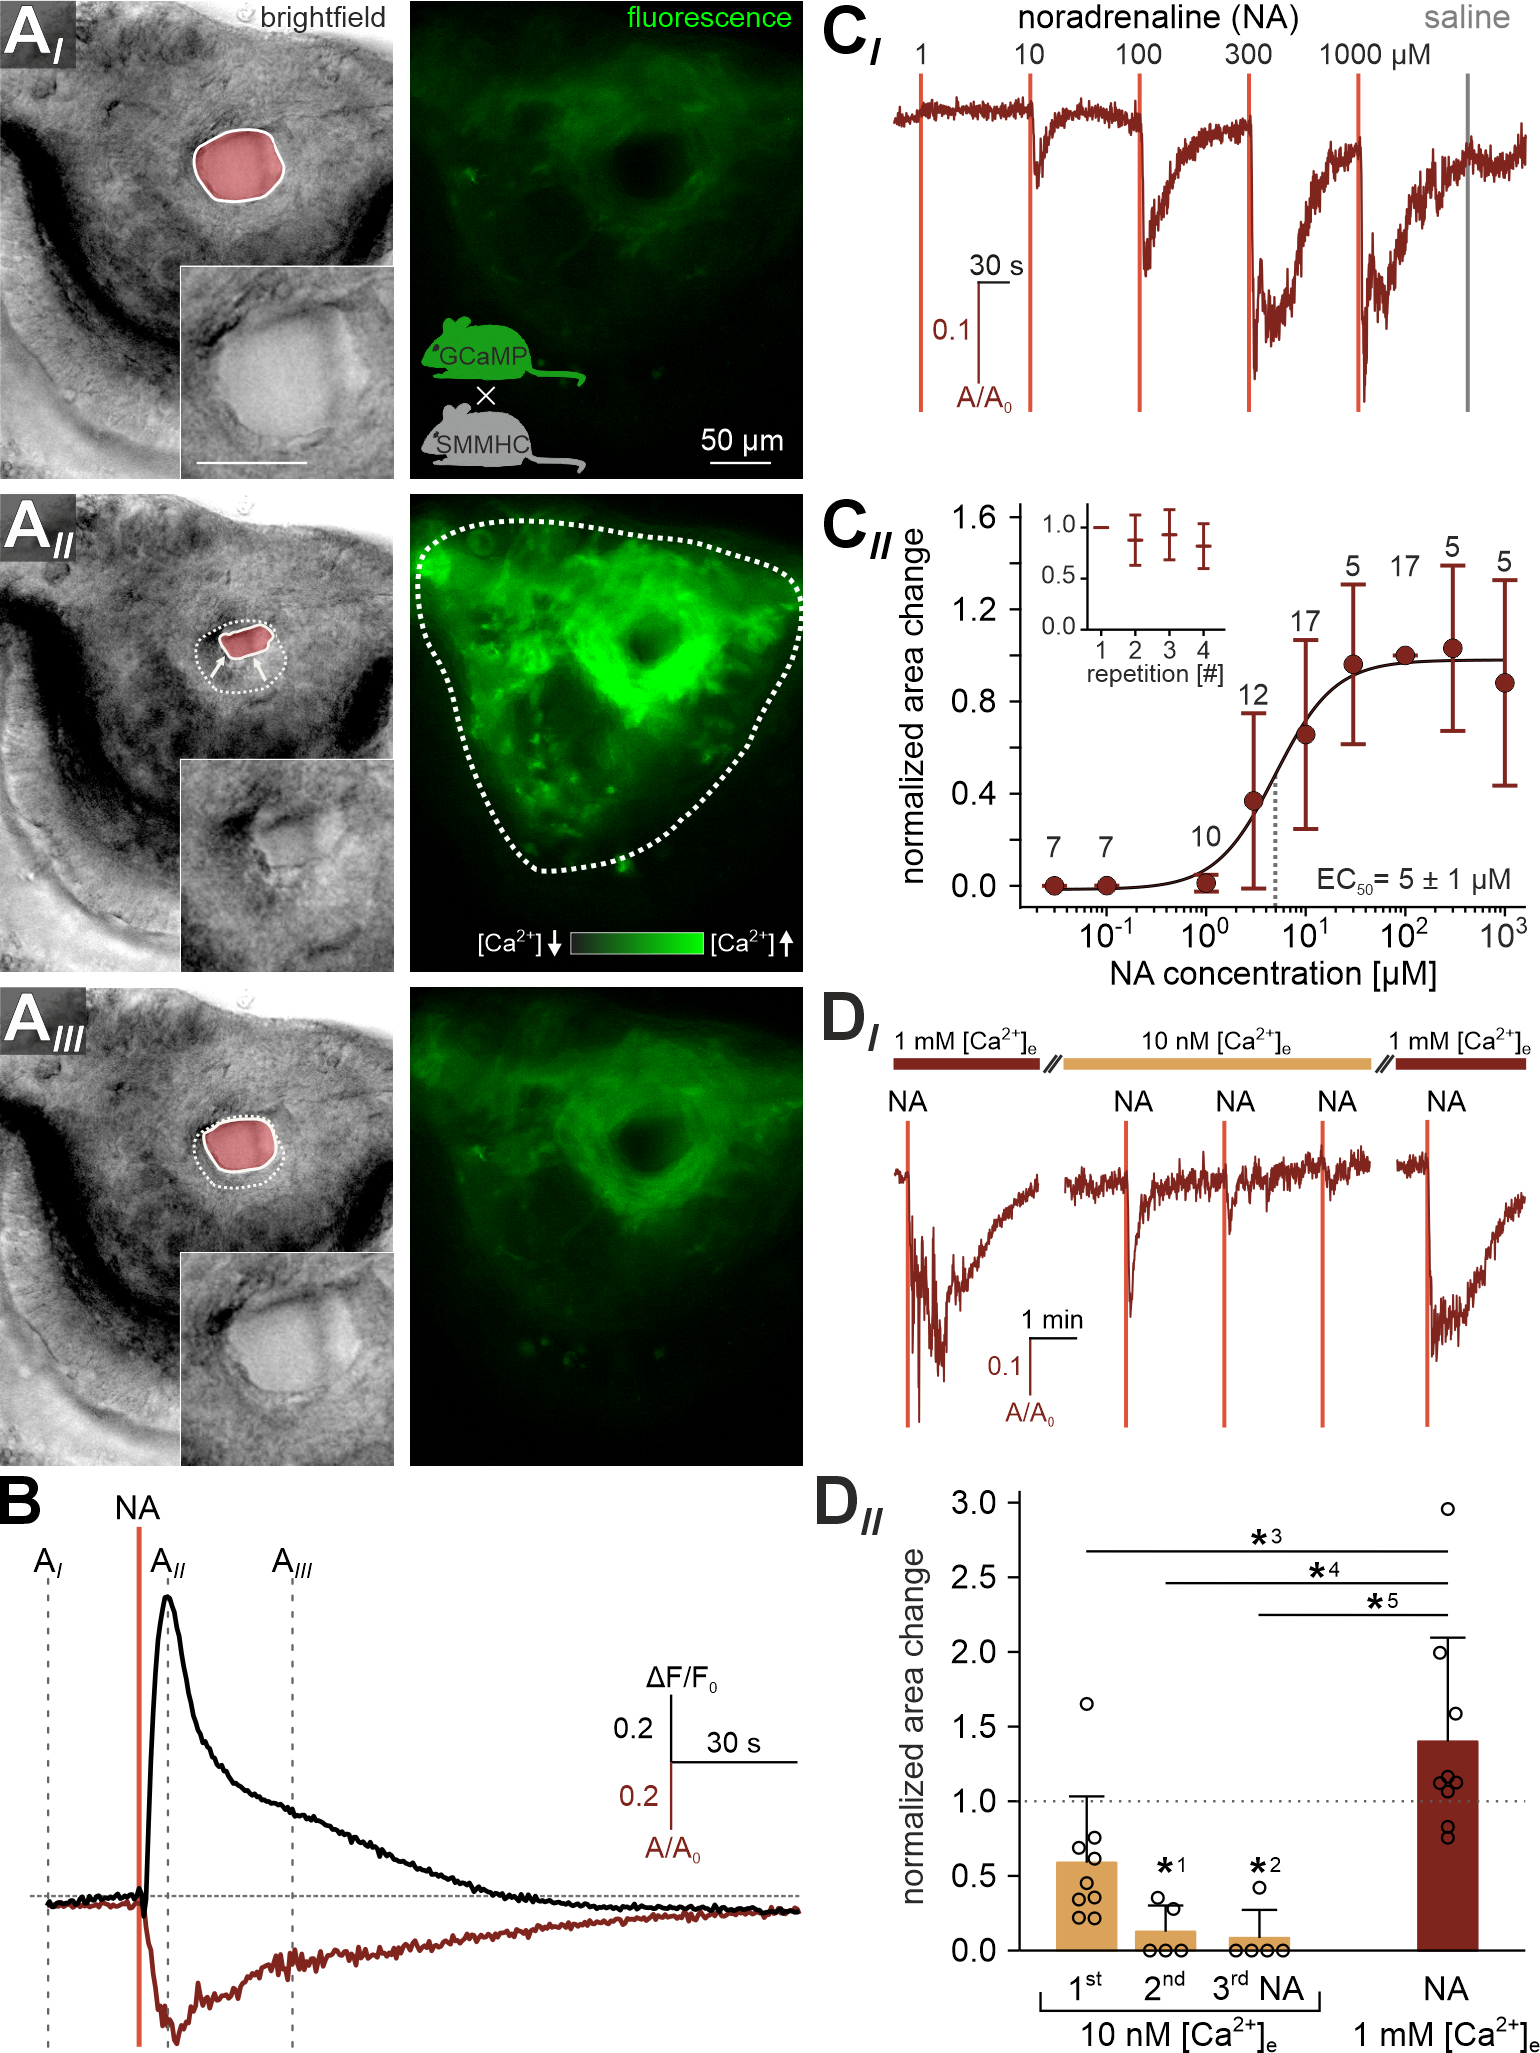
(A) Quasi-simultaneous imaging of lateral cavernous tissue contractions (left; reflected light microscopy) and [Ca2+]-dependent fluorescence (right; ΔF/F0; black-green 256 pseudocolor map) in acute coronal VNO slices. Focus adjusted to provide sharp images of the venous sinus. Representative individual frames (AI-III) correspond to the time points indicated in (B), i.e. before, during, and ~30 s after noradrenaline (NA) exposure (100 μM; 0.5 s). Left images: Solid white lines and pink shades outline the area occupied by the venous sinus (also shown at higher magnification without analysis mask in insets). Dashed white lines in (AII-III; left) depict the original sinus area prior to stimulation (AI) for comparison. Right images: Cre-dependent GCaMP6f expression in smooth muscle tissue of SMMHC-CreERT2 x Ai95D mice after tamoxifen injection (breeding scheme in (AI)) reveals robust and widespread [Ca2+] transients and concomitant contractions (left) in response to NA. (B) Relative fluorescence intensity (ΔF/F0, black trace corresponding to region outlined in (AII; right)) and relative change in sinus area size (A/A0, red trace; A0 is the average area size calculated from the recording’s initial 30 frames) over time. NA stimulation as indicated (vertical solid line). Dashed vertical lines mark the time points shown in (A). Note the strongly correlated waveforms of both signals. (C) Cavernous tissue contractions are dose-dependent. (CI) Representative original trace depicts sinus area change upon brief (0.5 s) stimulations with increasing NA concentrations (1–1000 μM; 2 min inter-stimulus interval (ISI)). Data calculated as in (B). Vertical solid lines indicate stimulation onset. Note that valve switching (saline control) triggers no mechanical artifacts. (CII) Data quantification. Dose-response curve (fitted by the Hill equation) illustrates average peak signals. Data (mean ± SD) are normalized to responses to 100 μM NA (numbers of experiments (n) are indicated above data points). Half-maximal contractions are triggered by 4.95 ± 1.04 μM NA (EC50). Inset depicts normalized peak contraction strength upon repetitive stimulation (100 μM; 0.5 s; 2 min ISI) with only minor response adaptation. (D) Influx of external Ca2+ powers force generation. (DI) Representative original trace depicts sinus area change upon NA stimulations (100 μM; 0.5 s; vertical lines) before, during, and after reducing the extracellular Ca2+ concentration ([Ca2+]e) to 10 nM (5 or 10 min preincubation). Reducing [Ca2+]e strongly diminishes responses to NA. Contractions regain their original strength upon wash-in of standard extracellular medium ([Ca2+]e = 1 mM). (DII) Quantification of data exemplified in (DI). Bar chart (mean ± SD) with individual data points illustrating peak contraction amplitudes normalized to the initial control stimulation. Asterisks denotes statistical significance (*1p = 4.4e−4, *2p = 1.9e−4, *3p = 2e−3, *4p = 1.8e−5, *5p = 7.5e−6; one-way ANOVA with post-hoc Tukey HSD test). See also Video S1.
We next investigated the Ca2+ signaling mechanism underlying NA-dependent SMC contractions. Specifically, we asked whether influx of external Ca2+ powers SMC force generation. When reversing the driving force for transmembrane Ca2+ flux by reducing the extracellular Ca2+ concentration ([Ca2+]e) to 10 nM, contractions ceased after few consecutive NA stimulations (Figure 2D). Wash-in of standard extracellular medium ([Ca2+]e = 1 mM) fully restored contractions. Together, NA triggers robust and dose-dependent Ca2+ influx in lateral vomeronasal SMCs. These signals induce extensive contractions of the cavernous tissue, which become relatively long-lasting with increasing NA concentrations.
Noradrenaline and acetylcholine stimulate topographically distinct groups of SMCs
So far, our experiments indicate that NA, rather than acting as a classical vasoconstriction agent, activates a substantial population of lateral SMCs in the mouse VNO. Whether this function is counteracted by an antagonistic pathway is unclear. Since parasympathetic fibers from the sphenopalatine ganglion have previously been implicated in autonomous control of VNO function 12, albeit with contradictory results 9, we hypothesized that ACh might trigger SMC relaxation. Surprisingly, Ca2+ imaging experiments revealed that, instead, ACh recruited a distinct SMC subpopulation near the lumen, i.e., in the adluminal part of the lateral cavernous tissue (Figure 3A–C). Yet, in coronal slices, this recruitment was not accompanied by measurable contractions (Figure 3CI). The ACh-sensitive region also retained some NA sensitivity, whereas the more lateral tissue was exclusively activated by NA (Figure 3CII). This finding indicates that the two autonomous neurotransmitters NA and ACh target topographically distinct subsets of vomeronasal SMCs.
Figure 3 |. NA and ACh stimulate topographically distinct groups of SMCs.
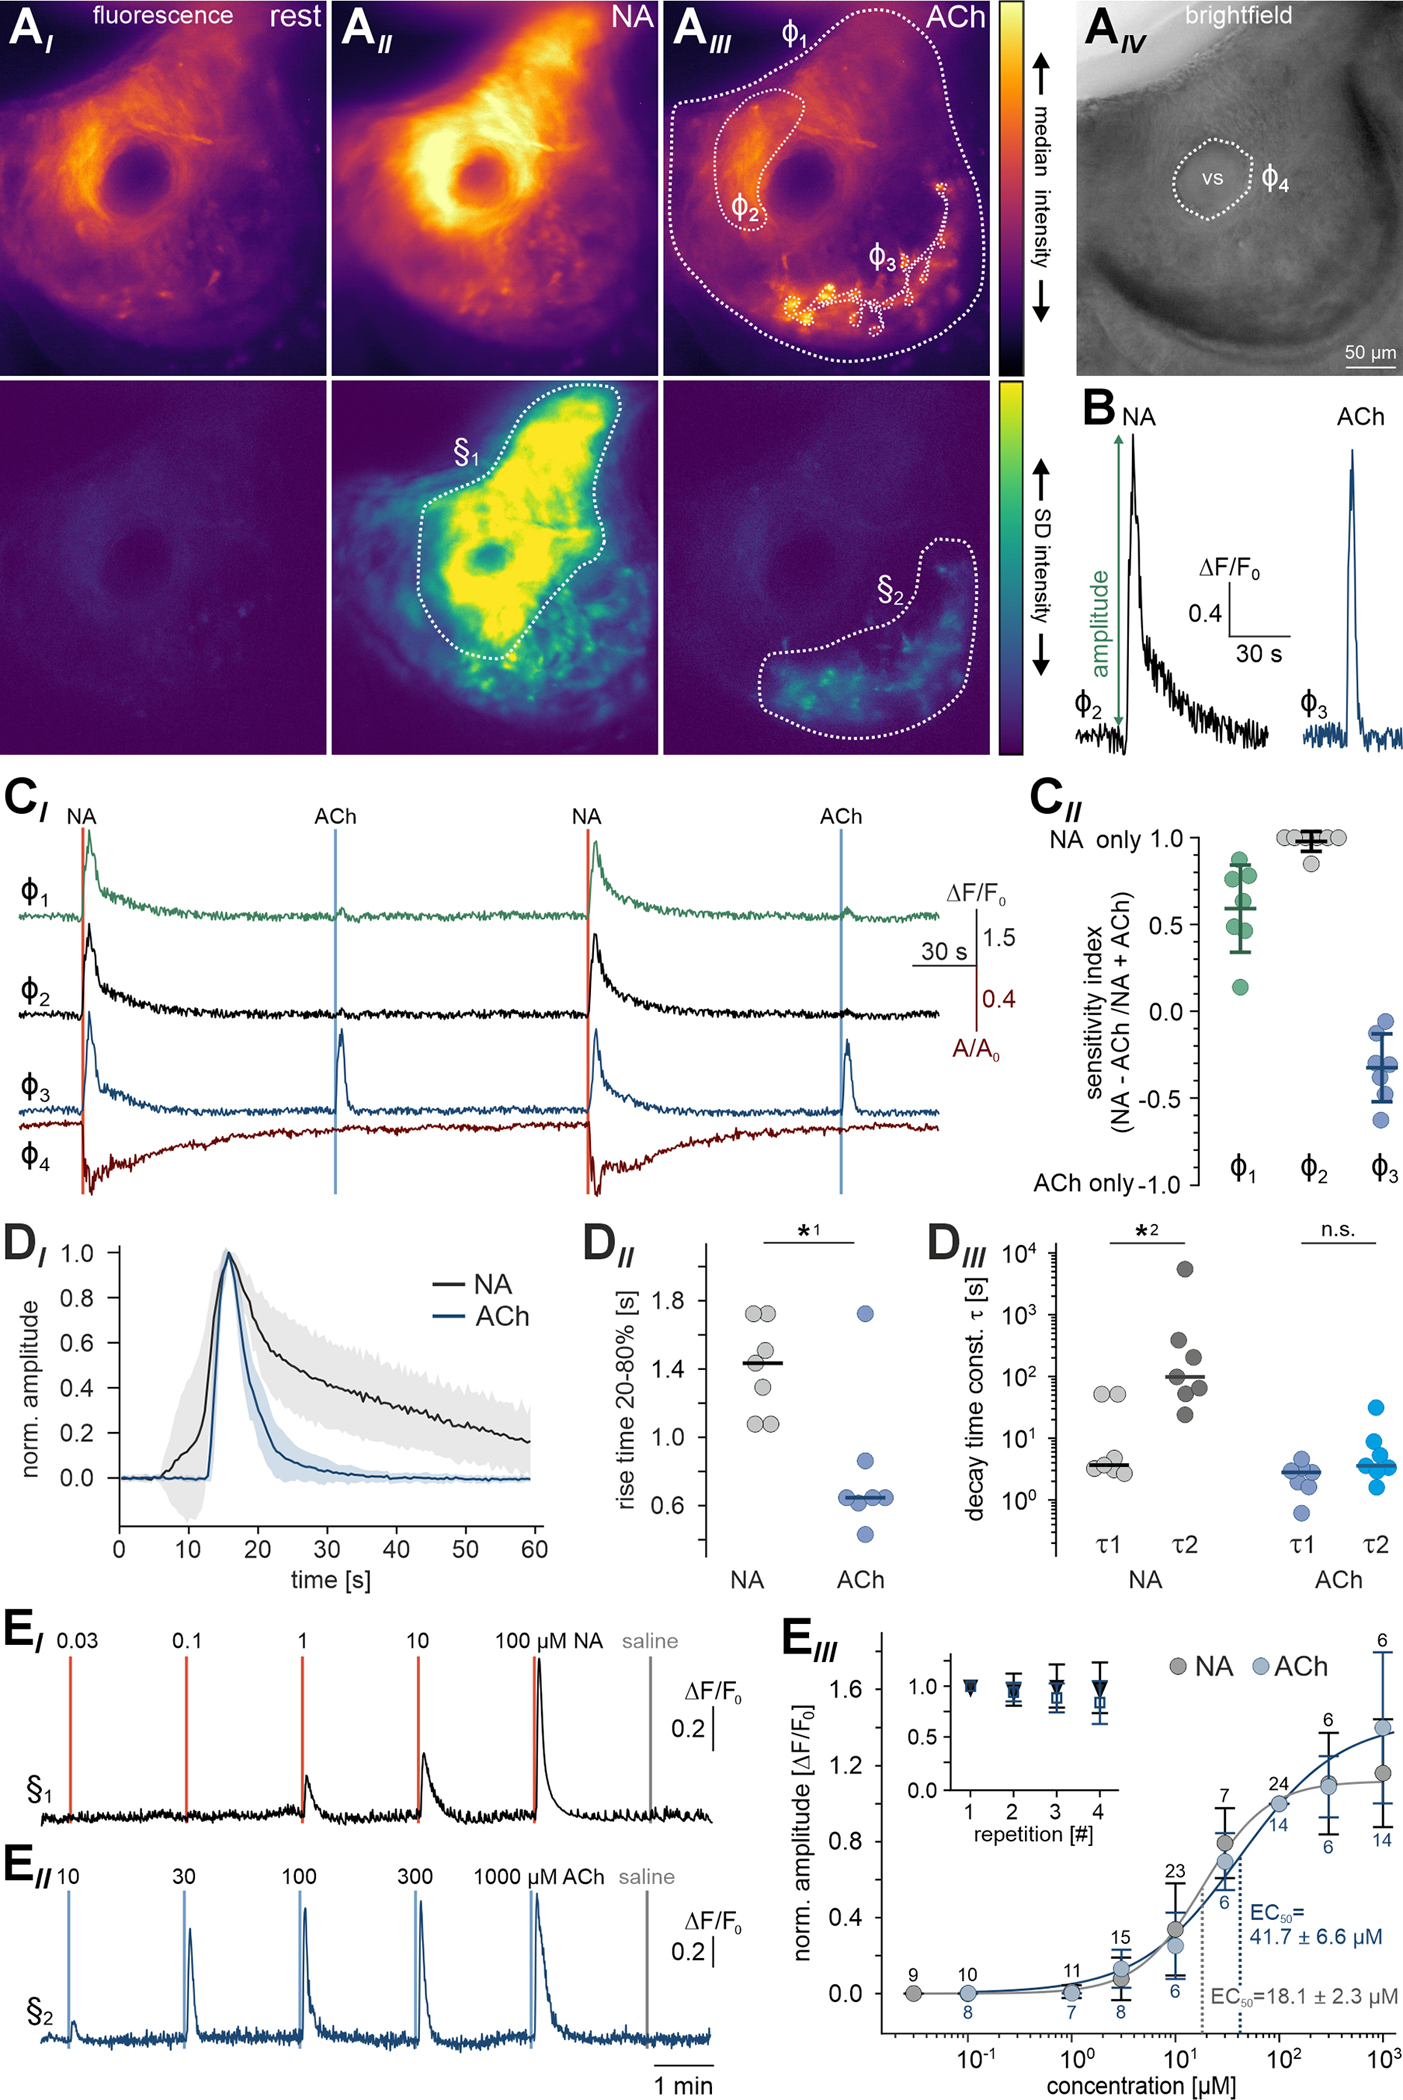
(A) Neurotransmitters recruit distinct SMC subpopulations. Pseudocolor fluorescence (AI-III) and brightfield (AIV) micrographs of lateral cavernous tissue in acute coronal VNO slices from SMMHC-CreERT2 x Ai95D mice. Images depict median GCaMP6f fluorescence intensity (top) as well as its standard deviation (bottom) calculated over several (11 – 56) frames during control conditions (AI), NA exposure (AII; 100 μM; 0.5 s), and ACh stimulation (AIII; 100 μM; 0.5 s). Note that, while NA induces widespread SMC Ca2+ signals, ACh-sensitive SMCs are confined to the adluminal region and show a characteristic ramified pattern. Dashed white lines depict regions-of-interest (ROIs) defined for time-lapse [Ca2+] (φ1–3) and quasi-simultaneous contraction (φ4) measurements (see CI). (B) Representative Ca2+ signals induced by either NA (black trace; 500 μM; 0.5 s) or ACh (blue trace; 100 μM; 0.5 s). (C) Transmitter sensitivity mapping in the lateral VNO. (CI) Relative fluorescence intensity (ΔF/F0; traces correspond to ROIs φ1–3) and relative change in sinus area size (A/A0; red trace, ROI φ4; A0 calculated from frames 1–30) over time. NA and ACh stimulations as indicated (vertical solid lines). ROIs identify the total cavernous tissue (φ1; green), a lateral area with the strongest response to NA (φ2; dark gray), and the adluminal ACh-sensitive region (φ3; blue). (CII) Quantification of data exemplified in (CI). Dot plot (including mean ± SD) depicting ROI-specific sensitivity indices, which are calculated from peak response amplitudes (see (B)) according to (NA − ACh) / (Na + ACh). Region color code as in (CI). (D) NA and ACh elicit characteristic Ca2+ signals. (DI) Average Ca2+ signal waveforms (normalized and aligned to peak) recorded from cavernous tissue SMCs in response to ACh (blue; n = 14; adluminal area (e.g., φ3)) and NA (red; n = 14; lateral area (e.g., φ2)). Shading indicates SD. (DII) Dot plot showing Ca2+ signal rise times (20%-to-80% of peak) from experiments exemplified in (CI). Each data point represents the average of two signals triggered by NA (gray) or ACh (blue), respectively (n = 7 experiments). ACh-induced Ca2+ signals rise fast (0.86 s; median), whereas signals evoked by NA show slower rise times (1.45 s). Asterisk denotes statistical significance (*1p = 2.3e−3; Mann–Whitney U test). (DIII) Dot plot showing Ca2+ signal decay time constants (fitted with double-exponential equations) from experiments exemplified in (CI). Data points are averages of NA (gray) or ACh (blue) signals, respectively (n = 7 experiments). NA-evoked Ca2+ signals display decelerated biexponential decay kinetics (τ1 = 3.7 s; τ2 = 98.2 s; median), whereas decay time constants for ACh responses are essentially identical (τ1 = 2.8 s; τ2 = 3.6 s), demonstrating a mono-exponential time course. Asterisk denotes statistical significance (*2p = 7e−3; Mann–Whitney U test). (E) Both stimuli operate dose-dependently within similar dynamic concentration ranges. (EI & EII) Representative original traces depict relative fluorescence intensity (ΔF/F0) over time upon brief (0.5 s) stimulations with increasing NA (EI) and ACh (EII) concentrations (2 min ISI). Vertical solid lines indicate stimulation onset. (EIII) Data quantification. Dose-response curves (fitted by the Hill equation) illustrate average peak signals. Data (mean ± SD) are normalized to responses to 100 μM NA and ACh, respectively (n and EC50 as indicated). Insets depict normalized peak Ca2+ signals upon repetitive stimulation (100 μM; 0.5 s; 2 min ISI) with only minor response adaptation. See also Figure S3.
Each transmitter (NA and ACh) elicits characteristic Ca2+ signals. While ACh-dependent transients display a fast rise and a similarly fast monoexponential decay, Ca2+ signals evoked by NA show slower rise times and decelerated biexponential decay kinetics (Figure 3D). While both stimuli operate within similar dynamic concentration ranges (Figure 3E), the differences in signal waveform suggest that each neurotransmitter triggers distinct Ca2+ mobilization pathways. Threshold concentrations are ~1 μM (NA) or ~3 μM (ACh) and EC50 values range from ~20 μM (NA) to ~40 μM (ACh). Together, we conclude that the large group of cavernous tissue SMCs comprises at least two distinct subpopulations that differ in (i) transmitter sensitivity, (ii) tissue topography, (iii) Ca2+ signal kinetics, and (iv) contractile function.
Transmitter sensitivity correlates with smooth muscle fiber orientation
Next, we asked whether the two functionally distinct SMC populations are also structurally unique. Therefore, we labeled actin filaments with a selective F-actin binding fluorophore (SPY555-actin). First, we analyzed coronal cryosections (Figure 4A) via standard confocal and stimulated emission depletion (STED) superresolution microscopy. As expected from α-SMA staining (Figure 1B) and genetic labeling of SMCs (Figures S1, 2A & 3A), the lateral cavernous VNO tissue is densely packed with labeled fibers. When focusing on the area between the large venous sinus and the lumen (Figure 4AII), a region exclusively sensitive to NA in its lateral part, but ACh-sensitive in its adluminal part (Figure 3), we observe a demarcation of both areas determined by divergent fiber orientations. Putative smooth muscle fibers in the adluminal zone run along the longitudinal VNO axis, whereas the more lateral fibers display a rather radial orientation. These observations are confirmed by 3D reconstructions from superresolution z-stacks (Figure 4AIII), which show the longitudinal arrangement of smooth muscle fibers along the cavernous tissue adluminal zone. If such topographically different fiber orientation is a VNO hallmark, the specific zonal division should also become apparent in horizontal sections. Indeed, in such cryosections, we observe strands of smooth muscle fibers in the adluminal zone that run parallel to the lumen along the VNO longitudinal axis (Figure S2AI & AII). Surprisingly, we note that fibers with similar orientation make up large parts of the posterior VNO beyond the lumen’s blind end (Figure S2AIII). Therefore, we next asked whether these longitudinal smooth muscle fibers in the posterior VNO are activated by ACh, NA, or neither of the two transmitters (Figure S3). Ca2+ imaging of posterior GCaMP6f-expressing SMCs revealed (i) widespread NA sensitivity (Figure S3AIII & B), (ii) a small Ach-sensitive region confined to the ventro-medial edges of the tissue (Figure S3AIV & B), and (iii) distinct Ca2+ signal kinetics (Figure S3CI) similar to observations in the central VNO (Figure 3). Together, these results suggest that those posterior smooth muscle fibers that run in longitudinal direction are, contrary to their adluminal counterparts in more central regions, activated by noradrenergic stimulation.
Figure 4 |. Unique patterns of smooth muscle fiber orientation.
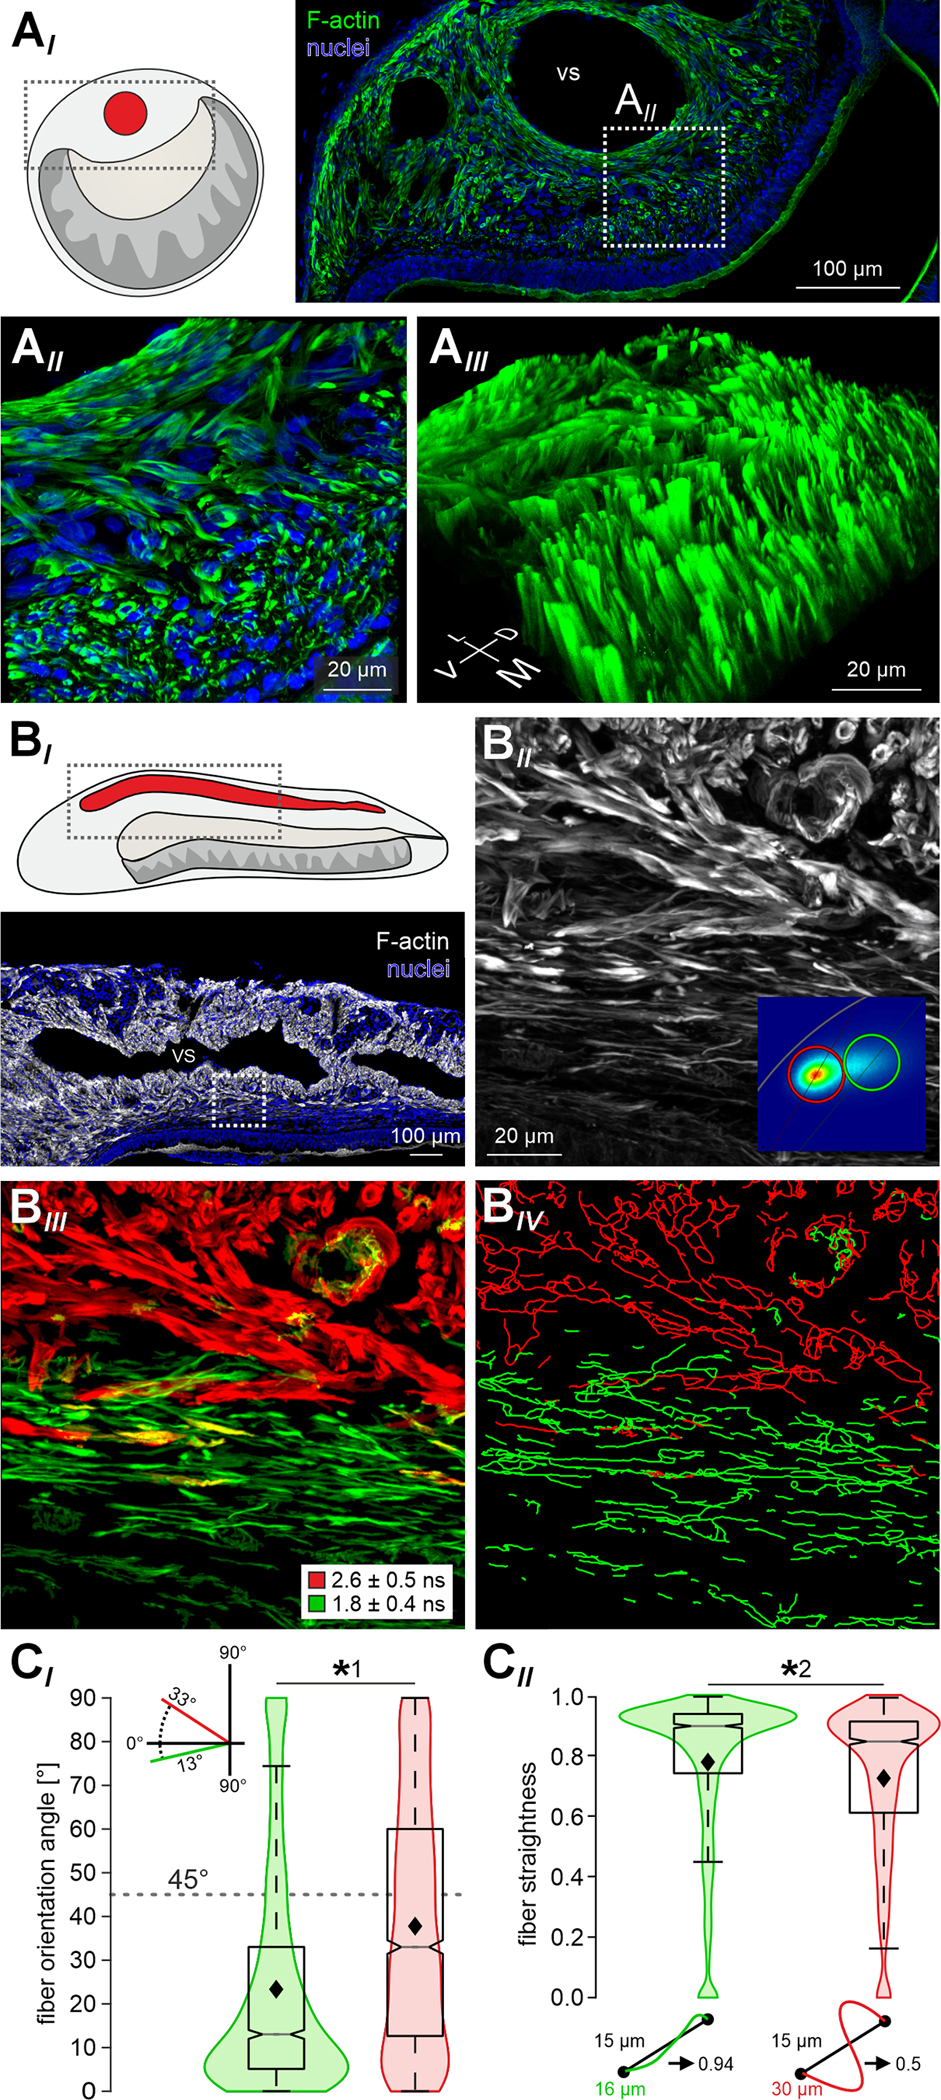
(A) Superresolution (STED) microscopy reveals divergent orientations of F-actin rich fibers in the mouse lateral VNO. (AI) STED micrograph of a coronal VNO cryosection (30 μm). Actin filaments (F-actin) are labeled with SPY555-actin (green), nuclei are stained with DRAQ5 (blue). White dashed rectangle delimits the zoomed-in area in (AII). At higher magnification (AII), the demarcation of two regions – adluminal and lateral – that differ by fiber orientation becomes apparent. (AIII) 3D z-stack reconstruction shows the parallel longitudinal arrangement of smooth muscle fibers along the adluminal zone. (BI) Horizontal cryosection depicting the lateral VNO. Actin filaments labeled with a selective fluorescent dye (SPY555-actin; gray scale). Nuclei stained with DRAQ5 (blue). Dashed white rectangle (bottom panel) delimits the area shown in (BII) at higher magnification. VS, venous sinus. (BII & BIII) Fluorescence intensity (gray scale (BII)) and fluorescence lifetime (red / green pseudocolor (BIII)) images of the F-actin labeled area outlined in (BI). Phasor representation of fluorescence lifetime distributions identifies two ‘hot spots’ in the phasor plot (inset in (BII); n = 8 sections from 6 animals). (BIII) Red or green pseudocoloring of SMCs according to the two populations’ average lifetimes (1.83 ± 0.38 ns (green); 2.62 ± 0.47 ns (red)) separates the adluminal from the more lateral zone of cavernous tissue. (BIV) Transformation of all fibered structures into 3D filaments (filament tracer tool in Imaris). (C) Quantitative analysis of data exemplified in (BIV). Over all experiments, filament tracing identified 1,837 ‘green’ and 2,209 ‘red’ fibers in representative areas (n = 8). In a cartesian coordinate system, each filament’s angle of orientation was determined (by drawing a start-to-end line (CII)) relative to the longitudinal VNO axis (0°). Fiber straightness was calculated as the trajectory-to-line length ratio (CII). Violin charts and merged box-and-whisker plots compare filament orientation angle (CI) as well as straightness (CII). Boxes represent the first-to-third quartiles. Whiskers represent the 10th and 90th percentiles, respectively. The central band represents the population median (P0.5) with its 95% confidence intervals depicted as notches. Diamonds show means. Adluminal (‘green’) fibers run largely parallel to the longitudinal axis (median = 13°; mean = 23.3° (CI)) and appear mostly straight (median = 0.9; mean = 0.78 (CII)). More lateral (‘red’) fibers display more heterogeneity regarding both orientation (median = 33°; mean = 37.7° (CI)) and straightness (median = 0.85; mean = 0.73 (CII)). Asterisks denotes statistical significance (*1p = 1.3e−68, *2p = 6.2e−28; Mann–Whitney U test). See also Figures S2 and S3.
For an unbiased classification and quantification of the above observations, we performed fluorescence lifetime imaging microscopy (FLIM) of F-actin labeled horizontal cryosections (Figure 4BI). As changes in fiber orientation affect (auto)fluorescence lifetime in striated muscle 22,23, we reasoned that fluorescence lifetimes of the SPY555-actin probe may reveal differences in vomeronasal SMC orientations. That was indeed the case. Phasor representation of FLIM data 24 identifies two different distributions in the phasor plot (Figure 4BII; inset). Pseudocolor representation according to the two lifetime distributions separates the adluminal from the more lateral zone (Figure 4BIII). Applying a filament-tracing algorithm, we next transformed all fibered structures into filaments (Figure 4BIV). Then, we calculated each filament’s angle of orientation relative to the longitudinal VNO axis (Figure 4CI) as well as each filament’s straightness (Figure 4CII). The distributions of both parameters were significantly different between adluminal and lateral fibers. In the adluminal zone, fibers appear mostly straight and run largely parallel to the longitudinal VNO axis, whereas the more lateral fibers display substantial heterogeneity regarding both orientation and straightness. Together, these data reveal that vomeronasal SMCs show functional and structural dichotomy. While the lateral, exclusively NA-sensitive SMCs display radial, albeit heterogenous orientations, the adluminal ACh-sensitive fibers run straight and parallel to the lumen along the rostro-caudal VNO axis.
Single-cell RNAseq and pharmacology reveal specific adrenergic and cholinergic receptor subtypes in vomeronasal SMCs
Next, we asked which receptors mediate NA and ACh sensitivity in vomeronasal SMC populations. To this end, we (re)analyzed published single cell RNA-sequencing (scRNA-seq) data from whole VNOs 25. Cells were clustered and visualized using uniform manifold approximation projection (UMAP) (Figure S4AI). Focusing on the Acta2 (a.k.a. α-SMA) positive cell cluster, we generated cell-specific expression profiles for all adrenergic and cholinergic receptors (Figure S4AII & AIII). Among adrenergic receptors, alpha 1b (Adra1b), alpha 2a (Adra2a), and alpha 2c (Adra2c) subtypes displayed moderate (Adra1b) to strong (Adra2a, Adra2c) expression. Among 10 nicotinic and 2 muscarinic cholinergic receptors, only muscarinic ACh receptor M3 (Chrm3) was strongly expressed in a subset of vomeronasal SMCs. These data point to Adra2a and/or Adra2c as well as Chrm3 as candidate SMC receptors that drive NA and ACh signaling, respectively.
To narrow down the relevant alpha-adrenergic receptor(s), we next performed NA-mediated contraction experiments in absence and presence of subtype-selective alpha 1 and alpha 2 receptor antagonists. Yohimbine, a selective inhibitor of alpha 2 receptors 26, blocked NA-dependent contractions (Figure S4BI & BII). Doxazosin, however, an agent known to preferentially inhibit alpha 1 relative to alpha 2 receptors 26, exhibited a less pronounced effect (Figure S4BI & BIII). So far, selective Chrm3 antagonists have not been described 26. Together, these results support a role of Adra2a and/or Adra2c receptors in mediating NA-dependent VNO contractions.
Next, to visualize both (nor)adrenergic and cholinergic nerve fibers, we genetically labeled either fiber type with tdTomato and co-stained presynaptic terminals with antibodies against synaptophysin (Figure S5A). Double labeling of fibers and presynaptic release sites suggests (i) that catecholaminergic fibers run more medially within the VNO cavernous tissue, whereas cholinergic fibers are more homogeneously distributed along both the medial and lateral side of the venous sinus (Figure S5C & D); (ii) that, especially in the posterior part, cholinergic fibers are more abundant than catecholaminergic fibers (Figure S5EI); and (iii) that synapse distribution is homogeneous for both fiber types along the VNO longitudinal axis (Figure S5EII).
Noradrenaline and acetylcholine trigger differential VNO contraction patterns
Based on (i) their distinct topographies (Figure 3A–C), (ii) their divergent SMC fiber orientations (Figures 4 & S2), and (iii) their unique Ca2+ signal kinetics (Figures 3D & S3), we hypothesized that stimulation of the adluminal ACh-sensitive muscle fibers versus the exclusively NA-sensitive lateral SMCs would not only trigger Ca2+ signals in topographically distinct SMC populations, but also mediate different and potentially antagonistic VNO contractions. To investigate the validity of this assumption, we first prepared acute horizontal VNO sections and recorded both Ca2+ signals and single SMC movement upon NA and ACh stimulation, respectively (Figure 5A–C; Video S2). As expected, NA activates large areas of the lateral and posterior cavernous tissue (Figure 5AII), whereas ACh clearly targets an adluminal band of SMCs (Figure 5AIII). Notably, the distinct SMC fiber orientations become again apparent. The horizontal slice plane, however, accentuates the transverse radial orientations of the lateral NA-responsive fibers (Video S2).
Figure 5 |. NA and ACh trigger distinct VNO contraction patterns.
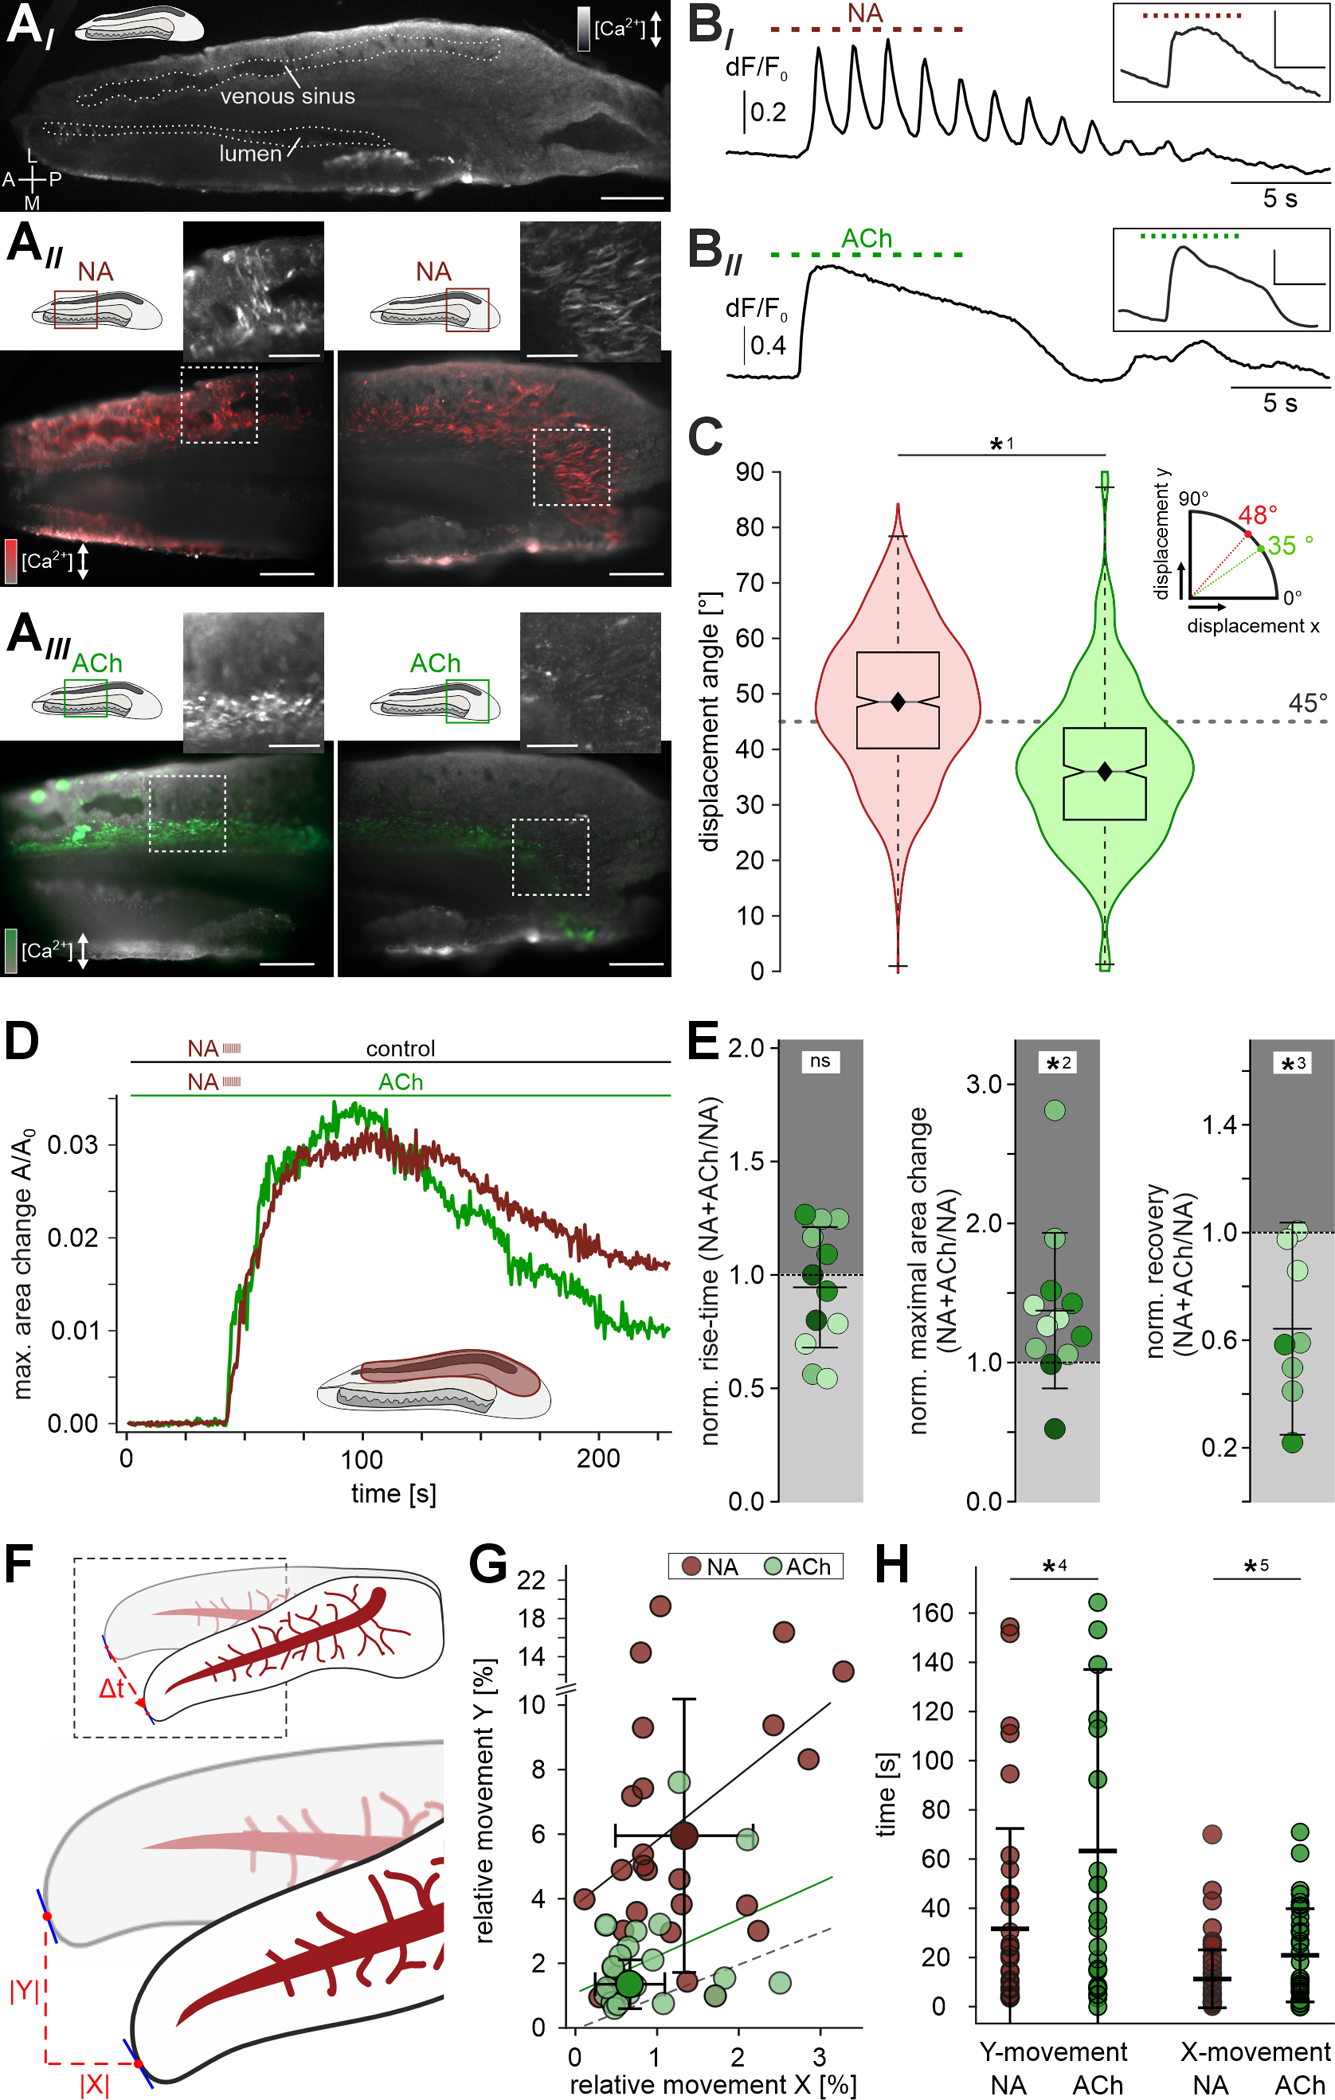
(A) Acute horizontal vibratome sections of the mouse VNO loaded with the Ca2+ reporter Cal-520/AM. Shown are a low magnification overview (AI) as well as micrographs depicting both the central (AII & III; left) and posterior (AII & III; right) regions (red and green rectangles in schematics). Overlay of pseudocolor fluorescence response signal (ΔF/F0; red for NA signals (AII; 100 μM), green for ACh responses (AIII; 100 μM)) and baseline fluorescence (F0) depicted in grayscale. Regions indicated by dashed white rectangles show raw peak responses (insets). Scale bars: 500 μm (AI), 200 μm (AII & III), 100 μm (insets). (B) Representative Ca2+ signals in individual SMCs induced by either NA ((BI); 100 μM) or ACh ((BII); 100 μM). Repetitive stimulation (10 s, 1 Hz, ISI: 0.5 s) as indicated by dashed horizontal lines. Insets depict average fluorescence signals collected from larger tissue areas (scale bars y: 0.2 ΔF/F0, x: 5 s). Note that a subpopulation of NA-sensitive SMCs follows stimulation at 1 Hz. (C) Quantification of individual SMC contraction / relaxation angles in the central cavernous tissue upon exposure to NA (red; n= 853) or ACh (green; n= 535), respectively. Boxes represent the first-to-third quartiles. Whiskers represent the 10th and 90th percentiles, respectively. The central band represents the population median (P0.5) with its 95% confidence intervals depicted as notches. Diamonds show means. Contractions of NA-sensitive (‘red’) cells show a more transverse angle (mean: 48°, median: 48°), whereas adluminal (‘green’) SMC contraction trajectories follow a more longitudinal path (mean: 36°, median: 35°). Asterisk denotes statistical significance (*1p = 5.1e−51; one-way ANOVA). (D & E) Presence of ACh affects NA-dependent contractility. (D) Original recordings of relative area changes (A/A0) in vomeronasal cavernous tissue (ROI indicated in schematic) over time. Contractions are triggered by repetitive NA stimulation (100 μM; 10 s, 1 Hz, 0.5 s ISI) as indicated by dashed vertical ticks. Horizontal slices were either kept in S2 (control; red trace) or incubated in ACh (100 μM; green trace). (E) Dot plots quantifying macroscopic contraction strength and kinetics in presence of ACh (normalized to control conditions; 12 ROIs, 4 slices). While NA-induced contraction speed is unaffected by ACh (pre)incubation (relative 10–90 % rise time; 0.94 ± 0.27 (mean ± SD)), both contraction amplitude (relative A/A0; 1.37 ± 0.56 (mean ± SD)) and relaxation (relative recovery; 0.65 ± 0.39 (mean ± SD)) are increased. Asterisks denote statistical significance (*2p = 1.4e−2, *3p = 1.0e−2; paired Student’s t-test). (F) Schematic illustrating our approach for frame-to-frame video tracking of macroscopic contractions in VNO whole-organ in decapsulated ex vivo preparations (also see Figure S6 and STAR Methods). Landmark pixel deflection vectors are tracked in vertical / transverse (y) and horizontal / longitudinal (x) directions. Values are then normalized to x/y dimensions occupied by the whole organ at rest. (G) Scatter plot quantifying relative pixel movement in response to either NA (gray; n = 25) or ACh (green; n = 22) exposure along the VNO transverse and longitudinal axis, respectively. Graph depicts average peak deflection (1.3 ± 0.9 (x) / 6.5 ± 4.9 (y) (NA); 0.8 ± 0.6 (x) / 2.1 ± 1.5 (y) (ACh); means ± SD) and regression lines (correlation coefficients r = 0.08 (p = 0.35; NA); r = 0.07 (p = 0.39; ACh)) in comparison to the dashed line of identity. (H) Dot plot quantifying the time to reach peak contraction in transverse (y; left) and longitudinal (x; right) directions upon either NA (gray; n = 25; x = 11.1 ± 12.2 s; y = 32.1 ± 40.3 s; means ± SD) or ACh (green; n = 22; x = 20.9 ± 19.0 s; y = 63.3 ± 73.8 s) stimulation. While values for a given neurotransmitter do not differ statistically in x- and y-direction, NA-triggered deflections reach peak strength significantly faster than ACh-mediated contractions. Asterisks denote statistical significance (*4p = 1.2e−2, *5p = 2.5e−3; one-way ANOVA). See also Figures S4 - S6 as well as Videos S2 and S3.
Previous work in hamsters indicated that sympathetic activation of the VNO occurs in bursts of 0.5 – 1 Hz oscillatory activity 12. Accordingly, we investigated whether individual SMCs are able to follow 1 Hz trains of NA pulses. Indeed, single SMCs responded to such stimulation patterns with somewhat pulse-locked Ca2+ transients (Figure 5BI). When Ca2+ responses from larger SMC populations were integrated signals become blurred (Figure 5BI, inset), most likely because perfusion of relatively large areas lacks temporal precision. Notably, and despite their more transient population signal kinetics measured in coronal sections (Figure 3D), ACh-sensitive SMCs did not display pulse-locked Ca2+ transients (Figure 5BII).
Ca2+ measurements in horizontal VNO slices enabled us to track the trajectories of contraction and relaxation of single SMCs. Calculating displacement angles (analogous to orientation angle analysis in Figure 4CI) revealed that the two distinct SMC populations moved in different directions upon stimulation with NA or ACh, respectively (Figure 5C). NA-sensitive SMCs preferentially contracted in transverse direction, whereas the majority of ACh-sensitive SMCs displayed contractile movement along the VNO’s longitudinal axis, albeit with smaller amplitudes (data not shown).
Since contractions of adluminal SMCs upon resting state ACh stimulation are much less pronounced than those triggered by NA in their more lateral and posterior counterparts, we hypothesized that a (if not the) primary physiological function of ACh-sensitive SMCs is to rapidly restore resting conditions after sympathetic bursts of NA release. Such acceleration of vomeronasal pumping could be achieved either by alternating bouts of ACh activation between episodes of NA release, or by establishing a constant cholinergic smooth muscle tone (analogous to an increase in spring tension). Therefore, we compared macroscopic contraction strength and kinetics in response to NA, under control conditions versus sustained (co)exposure to ACh (Figure 5D & E). While contraction onset and rise-time remained unchanged, both amplitude and recovery were significantly affected by ACh (pre)incubation (Figure 5E). We measured larger NA-dependent contraction amplitudes as well as faster and more complete relaxation when ACh was present.
Based on the above findings, we hypothesized that selective stimulation of either smooth muscle fiber type would trigger different macroscopic contractions in whole-organ ex vivo VNO preparations. To test this hypothesis, we prepared largely intact decapsulated VNOs and exposed the tissue to either NA or ACh (Figure S6A & B). First, NA stimulation triggers clearly discernable VNO movement (Figure S6C–E; Video S3). Without stabilization by the cartilaginous capsule, NA-induced contractions manifest as both small longitudinal constrictions (Figure S6D) and more substantial transversal tightening (Figure S6E) that, together, lead to torsion of the VNO and concomitant constriction of the venous sinus as evidenced by blood movement (Video S3). After peak contraction, slow relaxation largely restores the original state (Figure S6DIII & EIII). Second, when quantitatively comparing tissue movement along the longitudinal (x) and transverse (y) directions, we observed that NA triggers substantially more pronounced transverse movement as compared to changes in position along the longitudinal axis (Figure 5F & G). By contrast, ACh induces qualitatively different contractions that lead to similar movement amplitudes in both directions (Figure 5G; Video S3). Generally, NA triggers stronger deflections (Figure 5G) that also reach peak strength faster than ACh-mediated contractions (Figure 5H). Together, these data demonstrate that, on macroscopic level, the two transmitters induce distinct VNO contraction phenotypes that could serve antagonistic functions in vomeronasal pumping.
NA-induced smooth muscle contractions translate into luminal expansion
If noradrenergic SMC activation drives vomeronasal stimulus uptake, contractions should translate into substantial luminal expansion. Such mechanical force transmission, however, requires circumferential stabilization of the VNO soft tissue by its cartilaginous capsule. To monitor NA-dependent contractions and putative concomitant changes in luminal area, we therefore prepared acute coronal sections of neonatal mouse skulls (Figure 6A) 27 to keep the VNO capsule intact. Again, we regarded relative reductions in sinus area as a proxy for cavernous tissue contraction strength. Transient focal NA stimulation led to robust contractions of the lateral VNO tissue that were paralleled by expansion of the vomeronasal lumen (Figure 6B; Video S4). As expected from the longitudinal orientation of ACh-sensitive smooth muscle fibers (Figures 4&S2), exposure of coronal VNO sections to ACh triggered neither contractions, nor changes in luminal area (Figure 6B). However, NA stimulation resulted in contractions whose strength was highly correlated with luminal expansion. This was manifest in (i) corresponding signal kinetics (Figure 6BI), (ii) similar temporal dynamics (Figure 6C), and (iii) a clear interdependence of the sinus-to-lumen area change ratio (Figure 6D). If luminal expansion was solely driven by classical vasomotor constriction of the large venous sinus 8,9 the reduction in sinus area upon contraction should essentially equal the increase in luminal area. However, this is clearly not the case. In all experiments, luminal expansion exceeds the decrease in sinus area severalfold (Figure 6D&E). Moreover, while we frequently observed luminal expansion with only minute changes in sinus area, the opposite occurred only once (Figure 6D). In rare cases, we succeeded to prepare horizontal sections of neonatal skulls that preserved a horizontal cutting plane throughout the VNO with its cartilaginous capsule intact. In such sections, when challenged with NA, lumen expansion along both the transverse and longitudinal axes became readily apparent (Video S4). Together, these results show that NA-induced contractions indeed translate into VNO lumen expansion. Moreover, a standard vasomotor process does not represent the predominant driving force behind the vomeronasal pump.
Figure 6 |. NA-induced lateral smooth muscle contractions translate into lumen expansion.
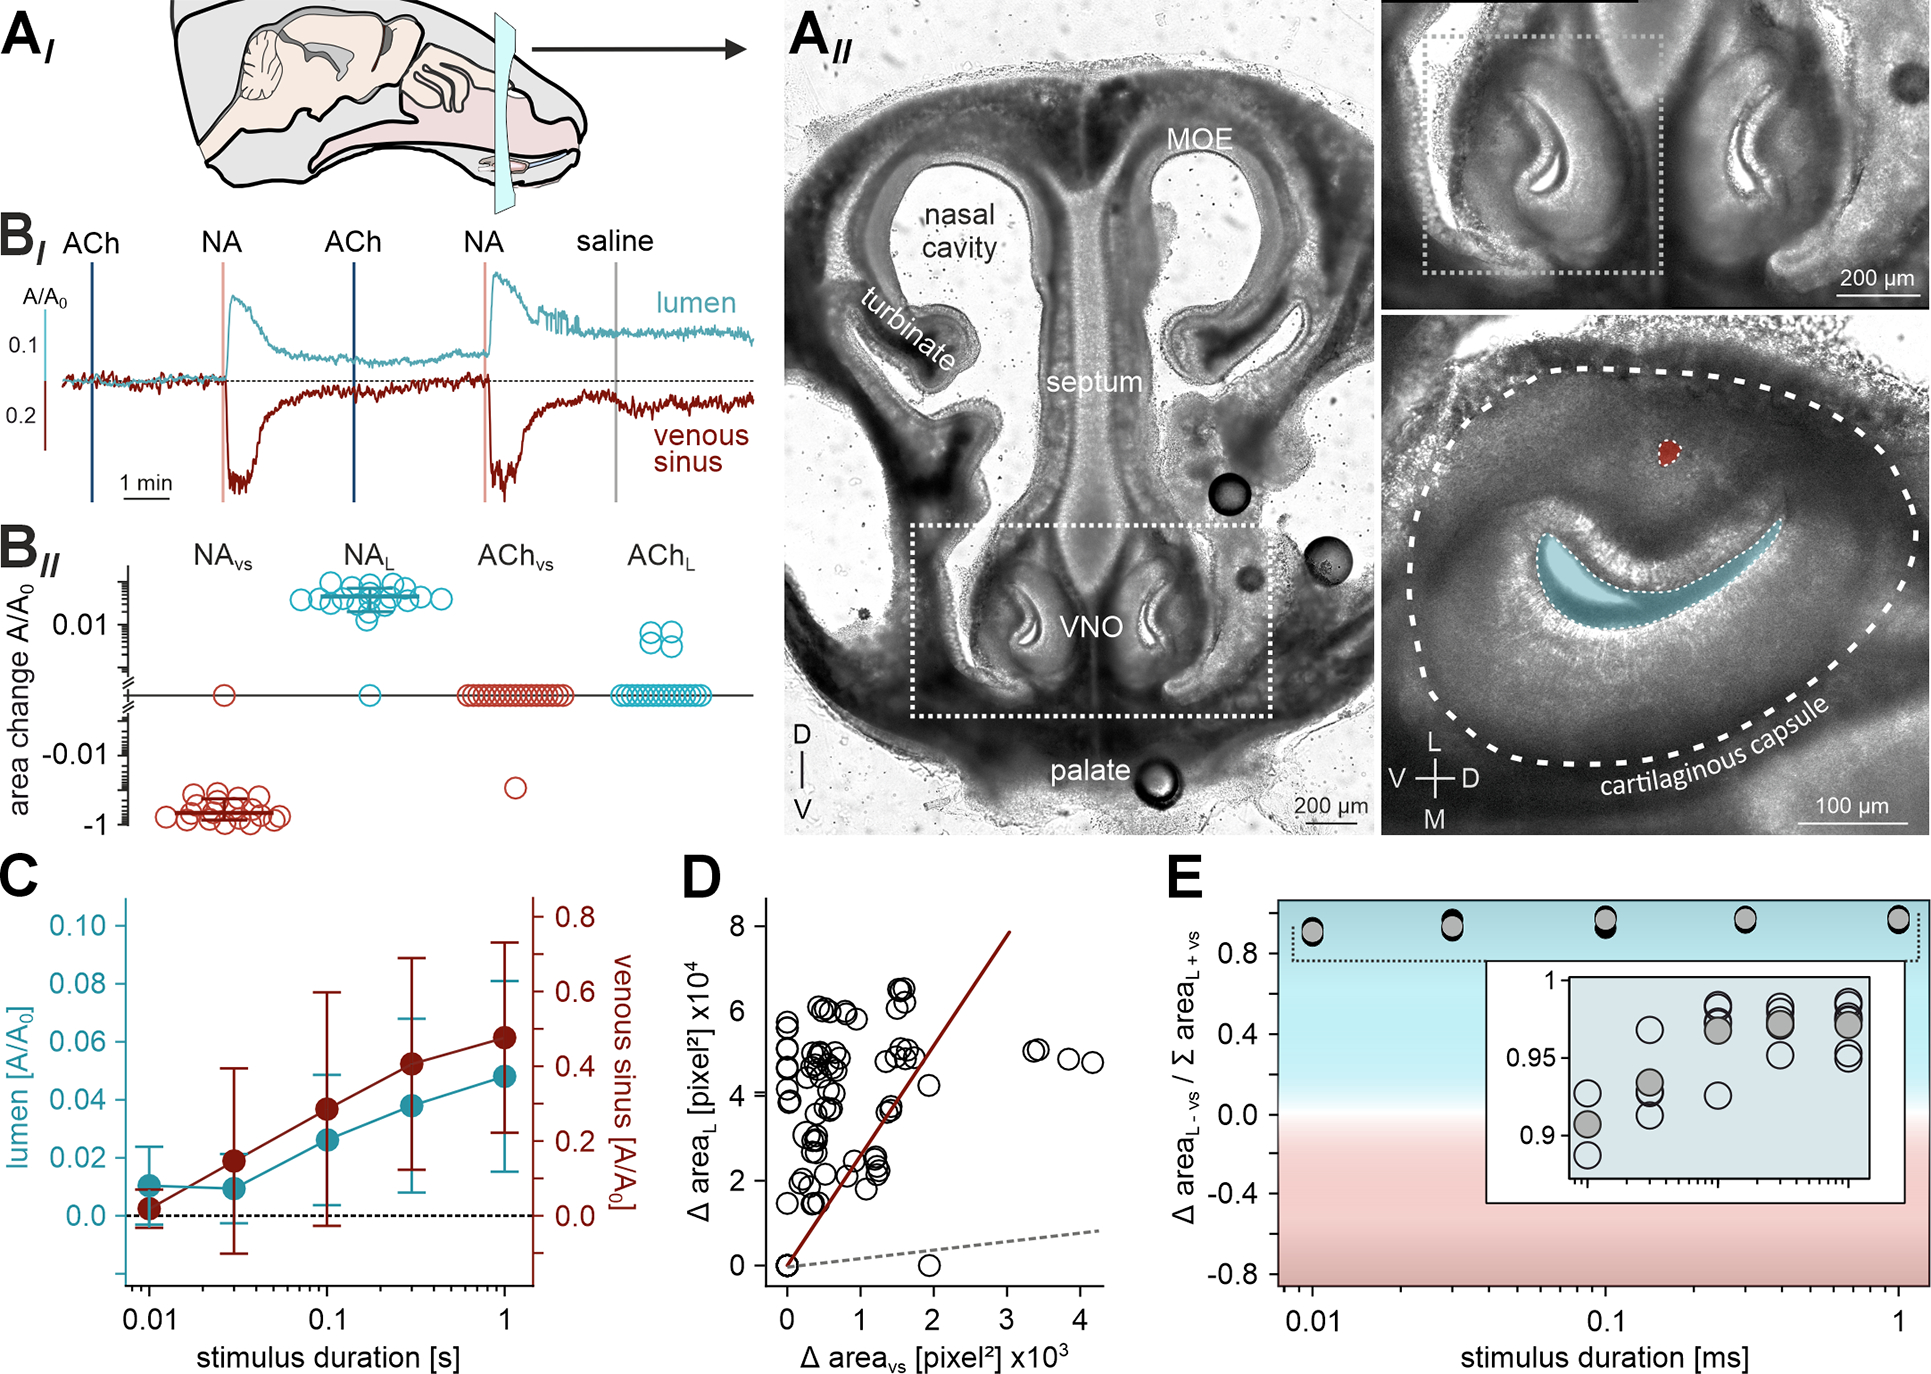
(AI) Schematic view of a mouse head and coronal section plane. (AII) Transmitted light image of an acute coronal slice (250 μm thick) of the mouse rostral skull at postnatal day 6. The VNO is delimited by the dashed white boxes and shown at a higher magnification on the right. Bottom, right: The VNO cartilaginous capsule (dashed line), venous sinus (red), and lumen (blue) are indicated. D, dorsal; L, lateral; M, medial; MOE, main olfactory epithelium; V, ventral. (BI) Representative original traces illustrate relative area changes (A/A0) of the lumen (top; blue) and venous sinus (bottom; red) upon repeated alternating stimulation with ACh and NA (100 μM, 0.5 s each; vertical lines) as well as saline control. (BII) Quantification of data exemplified in (BI). Logarithmic dot plot (including mean ± SD for NA effects) summarizing peak constrictions / expansions from 10 acute slice experiments. (C) Stimulus duration - response curves depict relative area changes (A/A0; n = 8; mean ± SD) of lumen (blue) and venous sinus (red) as a function of NA exposure duration (100 μM, 10 ms - 1 s). (D) Scatter plot quantifying absolute changes in lumen versus sinus area upon NA stimulation. Regression line (red; correlation coefficient r = 0.37 (p < 0.001)) is shown in comparison to the dashed gray line of identity. Data points correspond to experimental paradigms exemplified in both (BI) and (C). (E) Area bias index compares the relative contributions of lumen versus sinus movements, plotted as a function of NA exposure duration (C). Index is calculated from absolute peak area changes according to (lumen − sinus) / (lumen + sinus). Note that lumen expansion substantially exceeds the decrease in sinus area. See also Video S4.
In the intact VNO, adrenergic stimulation triggers substantial expansion of luminal volume
Until today, given its secluded location, direct monitoring of VNO mechanics has remained unreported. Accordingly, we not only lack a mechanistic understanding of vomeronasal pumping 6, but we also miss basic information on VNO lumen dimensions, expansion capacity, or luminal fluid volume. To address this issue, we employed OCT for non-invasive imaging of VNO anatomy and mechanics in fresh post-mortem specimen (Figures 7 & S7). 3D tomography (Figure 7A; Video S5) provided insights into the organ’s intricate anatomy, and allowed reconstruction of the vomeronasal sinus, lumen and duct (Figures 7BIII & S7BIV). The blind-ended lumen extends longitudinally over approximately 2 mm and constitutes about 8% of the total VNO volume (Figure 7C). Under presumed resting conditions, the luminal fluid volume is ~85 nl. For the most part, both overall tissue and lumen volume increase linearly along the anterior-to-posterior direction. However, in the posterior part, the lumen ‘twists’ towards the ventral aspect and its volume decreases again (Figure S7A). Notably, the vomeronasal ducts open rostro-laterally into the anterior ventral recess of the nasal cavity (Figure S7B&C; Video S6).
Figure 7 |. In the intact VNO, adrenergic stimulation triggers substantial expansion of luminal volume.
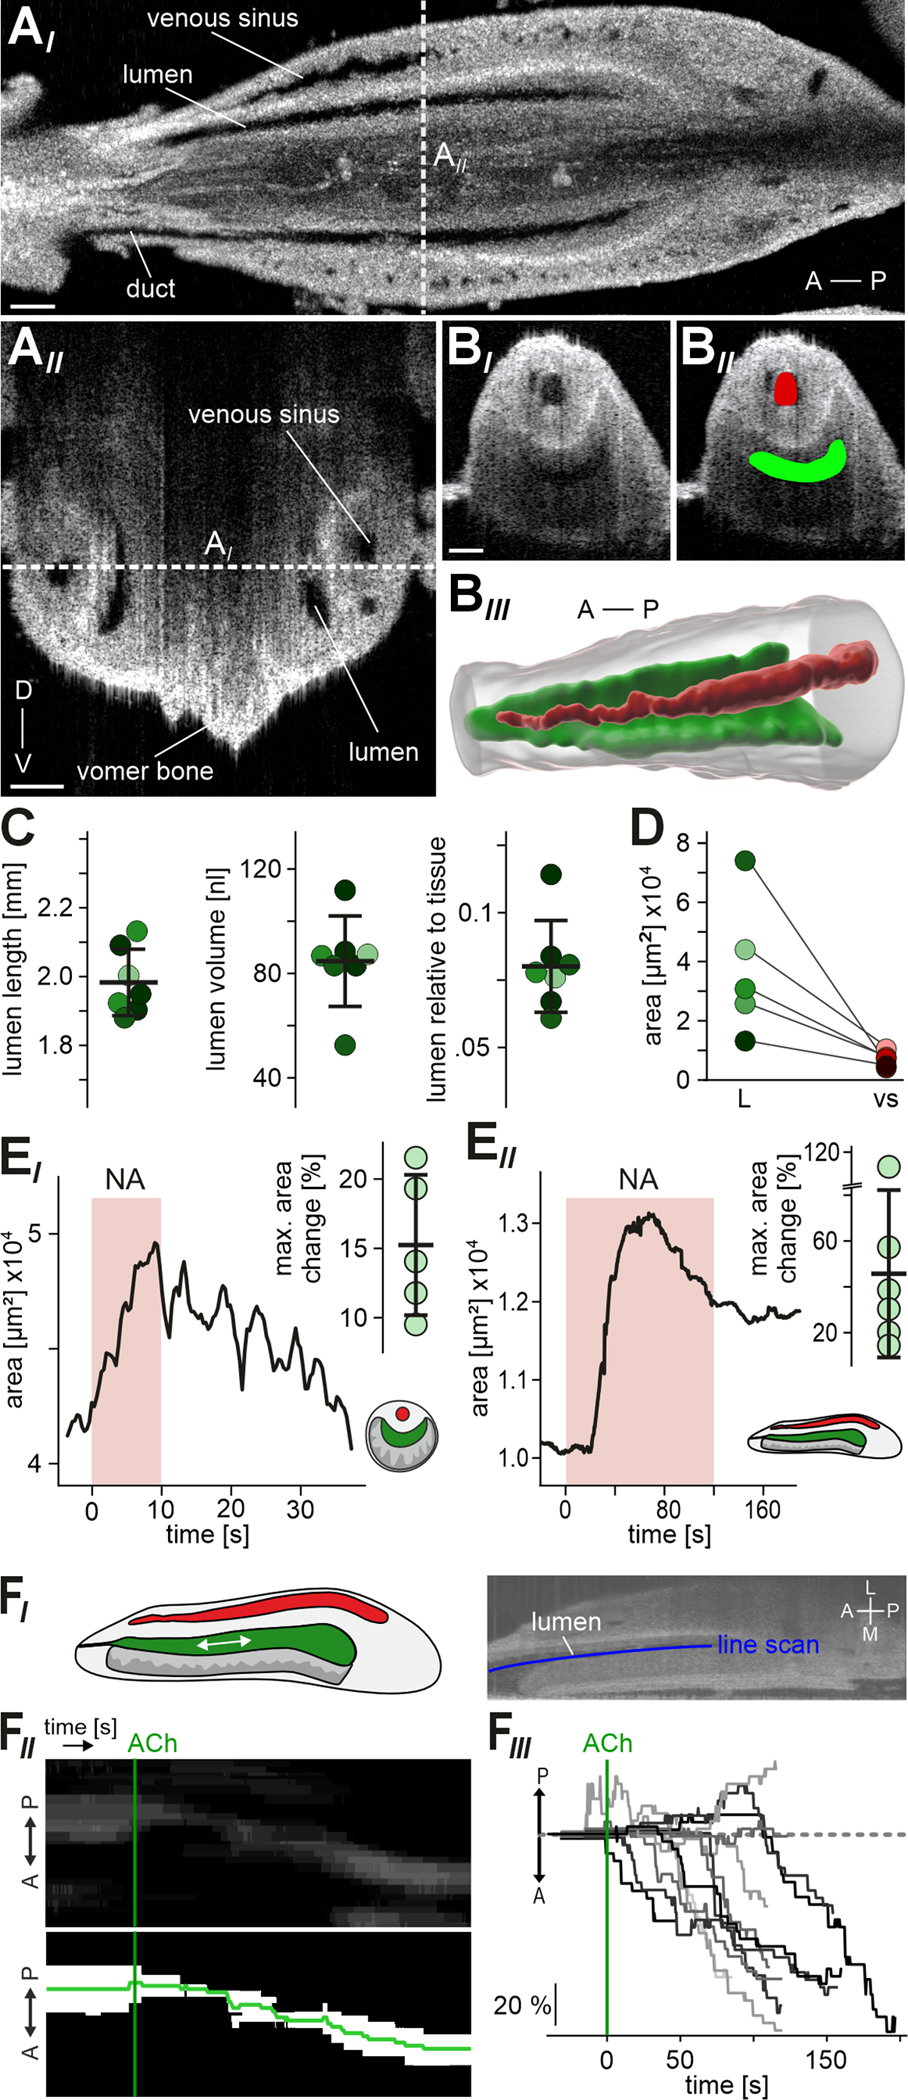
(A) OCT provides real-time non-invasive insights into VNO anatomy. (AI) Representative horizontal optical section of an intact mouse VNO recorded via 3D tomography within the skull immediately after euthanasia. Venous sinus, vomeronasal lumen and duct are indicated. Dashed white vertical line indicates the optical section plane shown in (AII). (AII) Coronal optical section. Dashed white horizontal line indicates the optical section plane shown in (AI). A, anterior; D, dorsal; P, posterior; V, ventral. (BI) Fast 2D tomography of a coronal optical section, with manually curated Labkit pixel classification masks ((BII); see STAR Methods) of venous sinus (red) and lumen (green) for physiological measurements of area constriction / expansion (E). (BIII) Representative 3D reconstruction of the VNO soft tissue (transparent gray) including lateral sinus (red) and vomeronasal lumen (green). (C) Anatomical features of the VNO lumen in adult mice. Dot plots show data from 7 encapsulated VNO hemispheres (6 animals; shading code corresponding to Figure S7A). Black horizontal bars depict means ± SD. Lumen length (1.98 ± 0.97 mm), volume (84.67 ± 17.34 nl), and proportion relative to total soft tissue (8 ± 1.7 %) are shown. (D) Comparison of vomeronasal lumen and sinus area in coronal optical sections within the skull immediately after euthanasia (n = 5). Note that a relatively small sinus does not predict a large lumen (and vice versa). (E) 2D optical section measurements of VNO lumen area change in response to NA. (EI) Representative original trace and quantification showing lumen area over time in transverse optical sections. Brief perfusion of the encapsulated intact organ with NA (1 mM; 10 s) triggered transient expansion. Dot plot (inset) showing relative changes in transverse lumen area from 5 encapsulated VNOs. We observed average lumen expansion upon NA stimulation by 15.24 ± 5.06 % (black horizontal bars; means ± SD). (EII) Representative trace (lumen area versus time) and quantification illustrating lumen expansion and some relaxation in horizontal optical sections upon prolonged exposure to NA (500 μM; 120 s). Dot plot (inset) showing relative changes in horizontal lumen area from 6 encapsulated VNOs (36.5 ± 35 %; means ± SD). (F) ACh triggers luminal content movement in anterior direction. (FI) Schematic and representative OCT image illustrating the experimental paradigm. Line scans (blue) along the lumen longitudinal axis are used to generate kymograph representations of optical inhomogeneities within the lumen. (FII) Original kymograph and corresponding binary image depict fluid movement in anterior direction over time. Start of ACh perfusion (1 mM) as indicated (green vertical line). (F) Family of average kymograph traces (as indicated in (FII)) shows relative longitudinal displacement over time. Traces are aligned to the start of ACh perfusion (green vertical line). See also Figure S7 as well as Videos S5 - S7.
Fast 2D tomography in the transverse plane (Figure 7BI) enabled us to perform physiological experiments, analogous to previous recordings in coronal sections (Figure 6), but in the fully encapsulated intact organ. First, we noted that, in the presumed resting state, the relative sizes of the large sinus and the vomeronasal lumen are not tightly correlated (Figure 7D). Second, we asked whether and, if so, to which extent NA stimulation triggers VNO lumen expansion. External application of NA indeed induced transient expansion of the 2D luminal area. On average, we observed a NA-dependent increase in lumen area of ~15% (Figure 7EI). In horizontal optical sections, OCT revealed an even more pronounced increase in lumen area of ~37% (Figure 7EII). Given the artificial and unfavorable conditions of external stimulation, these results likely represent an underestimate of 3D luminal volume expansion in physiological settings. Nonetheless, our findings set a rough minimal boundary for fluid exchange during a single vomeronasal pump cycle. From a coarse calculation, approximating the lumen as a cylindrical structure, the observed changes in transverse and longitudinal area (15% and 37%, respectively) translate into volume expansion by approximately 81% (from ~85 nl to ~154 nl).
In one case, we accidentally removed part of the VNO capsule during dissection, breaking off the anterior medial part and the tip of the cartilaginous capsule. Here, upon ACh stimulation, we observed that fluid was expelled from the VNO lumen at its anterior opening (data not shown). This prompted us to investigate fluid movement in the VNO upon external ACh stimulation using horizontal plane OCT (Figure 7F). Whenever OCT images displayed optical inhomogeneities in the VNO lumen, we tracked these ‘objects’ of optical contrast as line scan kymographs along the lumen’s longitudinal axis (Figure 7FI & 7FII). In most cases (11 out of 13), we observed luminal content movement in anterior direction time-locked to ACh exposure (Figure 7FIII).
Together, OCT ex vivo imaging supports a revised concept of vomeronasal pump operation. NA and ACh function antagonistically by targeting topographically distinct SMC populations in the central and posterior cavernous tissue. Substantial NA-induced lumen expansion is counteracted by ACh-sensitive SMCs.
Discussion
The anatomical and physico-mechanical properties of sensory organs determine their individual functions. Accordingly, in the past, we have learned a great deal about the peripheral sensory structures that form the basis of the classical five senses in mammals 28. Much less basic information is available on more specialized vertebrate senses, such as electro-/magnetoreception or infrared vision 29–31. A prime example of a sensory structure still inadequately understood is the VNO. Its hidden anatomical location and limited accessibility have hampered efforts to study some of the most fundamental aspects of VNO function, including stimulus uptake and clearance. Here, we revisit the classical vasomotor pump hypothesis 8,9. We demonstrate that the VNO cavernous tissue harbors a dense network of SMCs, which display both structural and functional dichotomy. A large population of NA-sensitive SMCs mediates both radial contractions of the lateral cavernous tissue and longitudinal contractions of the posterior tissue, resulting in transverse as well as longitudinal lumen expansion. By contrast, cholinergic stimulation targets adluminal smooth muscle fibers that run parallel to the rostro-caudal VNO axis. Both antagonistic SMC types differ in Ca2+ mobilization patterns and excitation-contraction coupling kinetics. Together, our findings suggest a revised conceptual model of the mouse VNO pump and, accordingly, of vomeronasal sampling.
The surprisingly large share of SMCs, which is to a wide extent independent of the cavernous tissue vasculature, essentially turns the lateral VNO into a considerable muscle. Activated by NA, these abundant SMCs power a vomeronasal pump that can operate largely independent of classical vasomotor mechanisms. The increase in cytosolic [Ca2+] that drives activation of myosin light chain kinase and thus SMC contraction 32 requires external Ca2+ influx. Notably, this finding does not exclude a crucial role of sarcoplasmic reticulum Ca2+ stores 33. Several NA- or Ach-triggered cytosolic Ca2+ oscillators, such as lymphatic and airway SMCs, depend on external Ca2+ influx to charge up internal stores for each oscillatory cycle 33.
Repetitive NA stimulation did not mediate substantial potentiation or depression of contraction strength, indicating that the smooth muscle pump could run through numerous cycles without fatigue. The dose-response relationship we observed corresponds to many published reports of noradrenergic action on mammalian SMCs 34,35. As evident from recordings in neonates, a NA-sensitive contractile apparatus is present in the mouse VNO as early as P4. Our recordings also confirm that robust translation of mechanical force into lumen expansion requires circumferential stabilization of the VNO soft tissue by its cartilaginous capsule. Moreover, these experiments show that, while changes in sinus area are an informative proxy for relative contraction strength, lumen area gain is by far larger than the area loss in the sinus.
Using OCT, we provide non-invasive insight into VNO anatomy and mechanics. Several important findings emerge from these experiments. First, in contrast to a previous report 36, the vomeronasal lumen is clearly blind-ended. Second, under resting conditions, approximately 85 nl of mucous fluid reside in the VNO lumen. Third, by just exposing the outside of the VNO capsule to NA, we trigger an average 15% increase in transverse lumen area and an average 37% lumen area expansion in longitudinal direction. Most likely, these relative 2D values underestimate the expansion expected from concerted NA action upon sympathetic nerve activity in vivo. 3D tomography reveals that the VNO lumen is a somewhat cone-shaped structure that tapers towards the vomeronasal duct at its anterior end. Here, SMCs are less abundant and more restricted to the perivascular envelope, suggesting a gradual increase in transverse expansion force along the lumen’s longitudinal axis. This anatomy could enhance suction at the openings of the vomeronasal ducts. Intriguingly, we observed that the ducts open laterally into a pit-like indentation in the floor of the nasal cavity. It is tempting to speculate that this pit is normally filled with mucus, providing (i) a sink for dissolved vomeronasal stimuli, (ii) a reservoir of fluid to prevent suction of air, and maybe (iii) a mucus-air interface that could, similar to the mucus layer covering the main olfactory epithelium, allow capture of volatile stimuli via binding proteins 37.
Since parasympathetic fibers from the sphenopalatine ganglion had previously been reported in the VNO 12, we hypothesized that cholinergic stimulation might control SMC relaxation. Surprisingly, however, we observed that NA and ACh stimulate topographically distinct smooth muscle populations. The two SMC subsets not only differ in transmitter sensitivity and tissue topography, but also in Ca2+ signal kinetics and contractile function. In contrast to noradrenergic effects, ACh-induced contractions primarily result in anterograde mucus flow and, consequently, fluid expulsion. The underlying mechanism likely being a constriction of the VNO lumen along its longitudinal axis. Notably, as we also observed ACh-dependent Ca2+ signals in putative glandular tissue (data not shown), mucus expulsion could be enhanced by VNO secretory gland activity 16. The adluminal smooth muscle fibers are organized in bundles that run parallel to the lumen in rostro-caudal direction. This distinct pattern clearly separates the adluminal from the lateral SMCs. Together, adluminal ACh-sensitive SMCs are ideally suited to serve as antagonistic counterparts to the NA-responsive population during cycles of vomeronasal pumping.
Expression profiling and pharmacology identify Adra2a and/or Adra2c as well as Chrm3 as likely candidates to mediate noradrenergic and cholinergic SMC signals, respectively. While the five known muscarinic ACh receptors regulate numerous parasympathetic activities 38 their orthosteric ligand binding site is so conserved that no selective Chrm3 antagonists exist 26. Among other examples, Chrm3-mediated contraction has been reported in pulmonary SMCs where ACh acts with comparable dose dependence 39. Among α1- and α2-adrenoceptor subtypes, we found Adra1b, Adra2a and Adra2c expression in vomeronasal SMCs. Here, selective pharmacological tools are available 26. Combining yohimbine, a prototypical α2 antagonist 40, and doxazosin, which preferentially inhibits α1-adrenoceptors 41, identifies Adra2a and/or Adra2c as likely mediators of sympathetic signals.
Building on the above findings, we propose a revised conceptual framework for mouse vomeronasal pumping and, thus, stimulus sampling. In contrast to the prevailing view of a hemodynamic vasomotor pump, reminiscent of penile erectile tissue 7, we suggest that coordinated interplay of the two vomeronasal SMC subpopulations mediates cycles of NA-dependent lumen expansion and antagonistic ACh-triggered constriction (Video S7). These actions are likely driven by sympathetic fibers from the superior cervical ganglion and parasympathetic fibers from sphenopalatine ganglion, respectively 11–13. Alternatively, constant cholinergic tone could define a constricted baseline state of the VNO lumen and, as shown in Fig. 6, could accentuate the phasic nature of NA-mediated contraction–relaxation episodes (Video S7). Notably, our results do not rule out that passive refilling of venous VNO vessels upon SMC relaxation contributes to reinstatement of intraluminal pressure. Nor do we exclude that classical vasomotor constriction to some extent contributes to vomeronasal pumping. In species, such as rabbits or cows, that developed a lateral vascular network typical of erectile tissues 18,19, a mechanism of vasomotion-dependent filling and emptying of a vomeronasal “corpus cavernosum” could readily underlie pumping. In other species such as horses and cats, where the VNO opens into the nasopalatine duct, the flehmen reaction aids pumping 42. The obvious advantage of an additional antagonistic SMC type is expedited luminal fluid exchange. If merely based on SMC relaxation and/or secretory activity of glands, fluid expulsion would be relatively slow, especially since the mouse VNO lacks helicine arteries, which in penile tissue direct the routing of blood flow under autonomous control 43. The model we propose is conceptually similar to many antagonistic smooth muscle systems that evolved in vertebrates 44, including pupil diameter modulation where iris sphincter and dilatory pupil muscles are controlled by the parasympathetic and sympathetic nervous systems, respectively. There, changes in the activity of noradrenergic and cholinergic circuitry correlate with pupil dilation state 45.
While our findings refine the mechanistic basis of vomeronasal stimulus uptake, several open questions remain at this stage. For one, we still lack a quantitative picture of the actual fluid exchange rate during VNO sampling. Moreover, the pathways that orchestrate noradrenergic and cholinergic interplay in vomeronasal pumping need to be explored. Opto- or pharmacogenetic intervention, an obvious next experimental step, awaits identification of genetic markers that would allow selective targeting of vomeronasal SMCs or, alternatively, those (para)sympathetic fibers that target these specific smooth muscle population(s). The advent of spatial omics technologies 46 promises to accelerate discovery in this area. Nonetheless, our study provides a novel mechanistic perspective on sensory sampling by the vomeronasal system and, thus, advances our understanding of this crucial, yet still somewhat enigmatic sensory system.
STAR Methods
RESOURCE AVAILABILITY
Lead contact
Further information and requests for resources and reagents should be directed to and will be fulfilled by the lead contact, Marc Spehr (m.spehr@sensorik.rwth-aachen.de).
Materials availability
This study did not generate new unique reagents.
Data and code availability
All data reported in this paper will be shared by the lead contact upon request.
This paper does not report original code.
Any additional information required to reanalyze the data reported in this paper is available from the lead contact upon request.
EXPERIMENTAL MODEL AND STUDY PARTICIPANT DETAILS
Animals
All animal procedures were approved by local authorities and in compliance with both European Union legislation (Directive 2010/63/EU) and recommendations by the Federation of European Laboratory Animal Science Associations (FELASA). When possible, mice were housed in littermate groups of both sexes (room temperature (RT); 12:12 h light-dark cycle; food and water available ad libitum). If not stated otherwise, experiments used adult (>12 weeks) males. Mice were killed by CO2 asphyxiation and decapitation using sharp surgical scissors. We used C57BL/6J mice (Charles River Laboratories, Sulzfeld, Germany; RRID: IMSR_JAX:000664) as well as offspring from crossing either SMMHC-CreERT2 (RRID: IMSR_JAX:019079) 21 mice with Ai95D (RRID: IMSR_JAX:028865) 47 mice. To induce SMC-specific GCaMP6f expression in double-positive adult male offspring, we administered tamoxifen (75 mg kg−1 body weight; dissolved in corn oil (20 mg ml−1)) via daily intraperitoneal injections for five consecutive days. Mice were closely monitored for any adverse reactions to treatment. For fluorescence imaging of tdTomato-labeled (nor)adrenergic and cholinergic nerve fibers in the VNO we used offspring from crossing either TH-Cre 1 (RRID: IMSR_JAX:008601) 48 mice or ChAT-IRES-Cre (Δneo) (RRID: IMSR_JAX:031661) 49, respectively, with Ai14 (RRID: IMSR_JAX:007914) 50 mice. These animals were housed, bred, and crossed at Harvard Medical School (Boston, MA). All animal husbandry and procedures followed the ethical guidelines outlined in the NIH Guide for the Care and Use of Laboratory Animals (https://grants.nih.gov/grants/olaw/guide-for-the-care-and-use-of-laboratory-animals.pdf), and all protocols were approved by the institutional animal care and use committee (IACUC) at Harvard Medical School.
METHOD DETAILS
Chemicals and solutions
The following solutions were used:
(S1) 4-(2-Hydroxyethyl)piperazine-1-ethanesulfonic acid (HEPES) buffered extracellular solution containing (in mM) 145 NaCl, 5 KCl, 1 CaCl2, 1 MgCl2, 10 HEPES; pH = 7.3 (adjusted with NaOH); osmolarity = 300 mOsm (adjusted with glucose).
(S2) Oxygenated (95% O2, 5% CO2) extracellular solution containing (in mM) 120 NaCl, 25 NaHCO3, 5 KCl, 1 CaCl2, 1 MgSO4, 5 N,N-bis(2-hydroxyethyl)-2-aminoethanesulfonic acid (BES); pH = 7.3 (NaOH); 300 mOsm (glucose).
(S3) HEPES-buffered extracellular low Ca2+ solution containing (in mM) 135 NaCl, 5 KCl, 10 NaOH, 1 MgCl2, 10 HEPES; pH = 7.3 (NaOH); osmolarity = 300 mOsm (glucose); [Ca2+]free = ~10 nM (1 mM EGTA, 0.1 mM CaCl2).
(S4) Oxygenated (95% O2, 5% CO2) extracellular low Ca2+ solution containing (in mM) 110 NaCl, 25 NaHCO3, 5 KCl, 1 MgSO4, 5 BES; pH = 7.3; 300 mOsm (glucose); [Ca2+]free = ~10 nM (1 mM EGTA, 0.1 mM CaCl2).
Free Ca2+ concentrations were calculated using WEBMAXCLITE v1.15 (RRID:SCR_000459). If not stated otherwise, chemicals were purchased from Sigma (Schnelldorf, Germany). Acetylcholine / noradrenaline / yohimbine / doxazosin was purchased from Tocris Bioscience (Bristol, UK). Final solvent concentrations were ≤0.1%.
Stimulation
For acute VNO slice recordings, vibratome sections (see below) were transferred to a recording chamber (Luigs & Neumann), positioned with stainless-steel anchors, and visualized using an upright fixed-stage video-microscope (DM LSFA, DM6000FS or DM6FS, Leica Microsystems) equipped for infrared-optimized differential interference contrast and epi-fluorescence imaging. Slices were continuously superfused with oxygenated S2 (~3 ml/min, gravity flow, 25°C).
For focal stimulation solutions and agents were applied from air pressure-driven reservoirs via an 8-in-1 Ø 250 μm multi-barrel ‘perfusion pencil’ (AutoMate Scientific; Berkeley, CA). Changes in focal superfusion 51 were software-controlled and synchronized with data acquisition by TTL input to 12 V DC solenoid valves using a TIB 14S digital output trigger interface (HEKA Elektronik, Lambrecht/Pfalz, Germany). Throughout experiments, constant S1 flow was maintained to avoid mechanical / motion artifacts from switching valves. Low Ca2+ solutions (S3 & S4) as well as solutions containing yohimbine or doxazosin were applied simultaneously via both the bath [0.5 μM (doxazosin), 1 μM (yohimbine) in S2) and perfusion pencil (1 μM (doxazosin), 2 μM (yohimbine) in S1]. Incubation in low Ca2+ and/or drug solutions depended on a visible physiological response (Ca2+ transient and/or contraction) upon administration of a positive control stimulus (100 μM NA). Low Ca2+ and/or drug solution preincubation lasted 5 or 10 min (no difference observed). We routinely switched between control valves (S1 versus S1) during experiments to control for mechanical / motion artifacts.
Slice preparation
Acute VNO slices from adult mice were prepared as previously described 52,53 with minor modifications. Briefly, mice were euthanized by brief exposure to a CO2 atmosphere, cervical dislocation and decapitation with sharp surgical scissors. The lower jaw and palate were rapidly removed. The VNO was dissected, embedded in 5% low-gelling temperature agarose (VWR International, Erlangen, Germany), placed in ice-cold oxygenated S2, and coronal (150 μm) or horizontal (250 μm) slices were cut on a VT1000S vibrating microtome (0.15 mm/s, 73 Hz; RRID:SCR_016495; Leica Biosystems, Nussloch, Germany). Slices were transferred to a submerged, chilled, and oxygenated storage chamber with circulating S2 until use. Sections from male animals that either show conditional and inducible GCaMP6f expression in SMCs (SMMHC-CreERT2 x Ai95D mice) or were bulk loaded with Cal-520/AM (C57BL/6J mice) were protected from light to avoid bleaching of the fluorophore.
For preparation of acute coronal VNO slices that retain the cartilaginous capsule, we used neonatal / juvenile mice at postnatal days 4 – 7. Slices of the entire anterior skull were prepared as described 27,54. Briefly, pups of either sex were sacrificed by decapitation. The lower jaw, skin, eyes, muscles, and fat were removed from the skull. Next, incisors and soft palate were removed. Using sharp surgical scissors, the skull was cut posterior to the eye sockets. Next, the anterior part of the head was washed in ice-cold S1 and embedded in low-melting agarose (5%), ensuring no air bubbles remained in the nasal cavities. Tissue slices were cut coronally (250 μm) or horizontally (300 μm) on a VT1000S vibratome (0.125 mm/s, 65 Hz; RRID:SCR_016495; Leica Biosystems) and stored in cooled oxygenated S2 until use.
Fluorescence Ca2+ imaging
We performed Ca2+ imaging experiments in acute coronal VNO sections from adult male GCaMP6f-positive mice (SMMHC-CreERT2 x Ai95D), 2–5 weeks after the initial tamoxifen injection. All animals had previously been used for in vivo measurements of seminiferous tubule contractions in the testis 20. During these experiments, vital signs (heartbeat, blood oxygen level, breathing rhythm) were closely monitored. Directly after in vivo experiments were terminated, VNO slices were prepared as described. VNO slices were transferred to a recording chamber (Luigs & Neumann) and imaged with an upright fixed-stage microscope (Leica DM6000FS) equipped for live-cell fluorescence imaging with a Leica EL6000 lamp (Leica Microsystems), a motorized fast-change filter wheel illumination system for multi-wavelength excitation (Leica Microsystems), a CCD camera (DFC365 FX, Leica), and Leica LAS X imaging software. Changes in cytosolic Ca2+ were monitored over time at 2.5 Hz frame rate, using appropriate filters (excitation: BP 470/40, dichroic: 495, suppression: BP 535/70).
For parallel recordings of SMC intracellular Ca2+ signals and vomeronasal contractions, we installed a custom-built reflective shield beneath the recording chamber for parallel monitoring of fluorescence and reflected light, according to previously published protocols 20. At 2.2 and 2.5 Hz imaging cycles, respectively, we thus recorded fluorescence images and a ‘pseudo-brightfield’ reflected light image that allowed quasi simultaneous analysis of Ca2+ and tissue movement.
For Ca2+ imaging in acute horizontal slices from adult animals, slices were bulk loaded with Cal-520/AM (5 μM; in S2 including 0.1 % Pluronic F-127) for 90 min at 37 °C. Slices were visualized using HCX APO L 10x/0.30 W U-V-I and HCX IRAP0 L 25x/0.95 W water-immersion objectives (Leica Microsystems) with or without 0.35x ‘magnification’. For Ca2+-sensitive dye excitation, we used a stabilized DC light source (X-Cite 200 DC, Lumen Dynamics) and appropriate fluorescence filters (excitation: BP 470/40, dichroic: 495, suppression: BP 535/70, Chroma Technology). Images were captured at 9.1 Hz frame rate by a Prime BSI back-illuminated sCMOS camera (Teledyne Photometrics, Tucson, AZ) controlled by MetaMorph 7.10 software (Molecular Devices, San Jose, CA; RRID:SCR_002368).
Contractility recordings
Recordings in acute slices from adult mice.
Acute slices were prepared as described above. After slices were transferred from the chilled storage chamber to the constantly superfused (S2; RT) recording chamber, a 10 min settling period ensured that slices acclimatize to RT. Slices were visualized using an HCX APO L20x/0.50 W U-V-I water-immersion objective (Leica Microsystems) and digital time-lapse videos were recorded at 2.5 Hz frame rate. When several experiments were done in the same sample, inter-recording intervals were at least 5 min.
Recordings in acute sections from neonatal / juvenile mice.
Acute slices were visualized using an HCX APO L63x/0.90 W U-V-I CS2 water-immersion objective (Leica Microsystems) at 0.35x ‘magnification’. Images were generated using infrared-optimized differential interference contrast and captured using MetaMorph 7.10 software with a Prime BSI back-illuminated sCMOS camera at 2 Hz frame rate. Only one VNO per slice was investigated. Recordings of spontaneous contractions (10 min) were recorded prior to any stimulation. When a slice was challenged with multiple stimulation paradigms, we ensured 15 min inter-recording intervals. In general, the sequence of experimental paradigms was routinely randomized between slices.
Ex vivo whole-mount VNO recordings from adult mice.
VNOs were dissected as described above and the cartilaginous capsule was removed. Samples were then placed with their medial sides down in a petri dish (Ø = 35 mm) that was mounted inside a custom-built 3D-printed measurement chamber. VNOs were constantly superfused (S2; RT). VNO contractions were visualized using a MacroFluo Z16 APO A system (Leica Microsystems) equipped with a PLANAPO 1.0x / WD 97 mm objective. Digital time-lapse videos were captured with a DFC 365FX CCD camera or an ORCA-FLASH4.0 sCMOS camera at a 3 Hz frame rate. Experiments lasted 16 min, and we performed two experiments per VNO with 10 min inter-recording intervals. NA and ACh were sequentially administered in a pseudo-randomized fashion.
Optical coherence tomography
For non-invasive imaging of the intact VNO, we performed spectral domain optical coherence tomography (SD-OCT), a method based on optical path length difference detection that generates contrast if structures differ in refractive index and light absorption. For 2-/3-dimensional SD-OCT recordings, we used a Telesto 1 imaging system (Thorlabs, Dachau, Germany) at a central wavelength of 1,300 nm, with penetration depths up to 2.5 mm, axial resolution up to 6.5 μm / 4.9 μm (air / water) at a scan rate of 5.5 kHz, and lateral resolution of 13 μm. Image acquisition was controlled by ThorImage®OCT (Thorlabs) software. We either measured the VNO after isolating the encapsulated organ with the vomer bone still attached, or we imaged the VNO directly post-mortem inside the head without dissection. For the latter recordings, we placed the euthanized mice on their back within a custom-built 3D-printed mount, fixed the upper jaw position with wires, and dislocated the lower jaw caudally. Next, the soft palate was removed and parts of jawbones blocking optical access to the VNO were abraded with a dental drill. For recordings from isolated, yet still encapsulated VNOs, we either fixed the organs in large dishes (S2; RT) at the stump of the vomer bone with a crocodile clamp, or we placed them in a custom build chamber. Here, VNOs were placed medial (i.e., septal) side down on transparent foil in 1% low melting point agarose. After hardening, samples were turned 180° to image through the foil. Stimuli (NA) were administered (i) via a perfusion pencil (Ø = 250 μm; AutoMate Scientific) or a cannula (Ø = 1 mm) in S2, (ii) by pipetting a few drops of stimulus solution directly after removal / suction of S2, or (iii) bath exchange of S2 with stimulus solution.
Histology and immunochemistry
For cryosectioning, VNOs were isolated as described above. The encapsulated organs were fixed with 4% (w/v) paraformaldehyde (PFA) in PBS−/− (10 mM, pH 7.4; ~16 h; 4°C), decalcified (1 h; 0.5 M EDTA), and subsequently cryoprotected in PBS−/− containing 30% sucrose (≥72 h; 4°C). Samples were then embedded in Tissue Freezing Medium (Leica Biosystems), sectioned at 30 μm on a Leica CM3050 cryostat (object / chamber temperature: −20 °C / −22 °C; RRID:SCR_018061; Leica Biosystems), mounted on Superfrost Plus slides (Menzel, Braunschweig, Germany), and stored at −20°C.
Coronal or longitudinal VNO cryosections were immunostained against the endothelial marker CD31, the presynaptic vesicle protein synaptophysin, α-smooth muscle actin and/or filamentous actin. For blocking and permeabilization, sections were incubated (1 h; RT) in PBS−/− containing Triton X-100 (0.5%) / goat serum (10%) / BSA (1%). After rinsing in washing solution (WS; PBS−/−,1% BSA; 2 × 5 min), sections were incubated with (i) anti-CD31 antibody (1:100 in WS; 12 h; 4 °C; cat# 557355, BD Biosciences), (ii) anti-synaptophysin antibody (1:100 in WS; 16 h; 4 °C; cat# 36406; Cell Signaling), (iii) FITC-conjugated monoclonal anti-actin, α-smooth muscle antibody (1:500 in WS; 1 h; RT; α-SMA-FITC, cat # F3777, MilliporeSigma), and/or (iv) SPY555-actin (1 h; RT; cat# SC202; Spirochrome). Excess antibodies were removed by washing (5 × 10 min; WS). Secondary antibody stainings were performed as required [goat anti-rat IgG – Alexa Fluor 633, 1:10,000 in WS, 1 h; RT (CD31) or goat anti- rabbit IgG – Alexa Fluor 633, 1:1000 in WS, 1 h; RT (synaptophysin)]. For nuclear counterstaining, sections were then incubated in WS containing DAPI or DRAQ5 (1:1000; 10 min; RT; Thermo Fisher Scientific). Slides were subsequently mounted with Fluoromount™ aqueous mounting medium (cat# F4680–25ML, Sigma-Aldrich) and stored at 4 °C until image acquisition. Sections stained with SPY555-actinwere mounted with medium suitable for superresolution microscopy (ProLong™ Diamond Antifade Mountant; ThermoFisher).
Fluorescent images were taken using an inverted confocal microscope (TCS SP8 DLS, Leica Microsystems) equipped with a 20x / 0.75 NA glycerol immersion objective (HC PL APO; Leica Microsystems). Fluorescence lifetime imaging was performed with a Leica TCS SP8 STED microscope, equipped with a 93x / 1.30 NA glycerol immersion objective (HC PL APO CS2; Leica Microsystems) using FALCON (FAst Lifetime CONtrast) mode. For STED measurements of SPY555-actin, we combined a pulsed (80 MHz) white light excitation laser with a pulsed 775 nm depletion laser. To control for non-specific staining, experiments in which the primary antibody was omitted were routinely performed in parallel with each procedure. Digital images were uniformly adjusted for brightness and contrast by histogram adjustment in LAS X software (Leica Microsystems).
Gene expression analysis
Single-cell RNA sequencing (scRNA-seq) data was obtained from a previously published data set (10x Genomics Chromium Platform) 25. Briefly, data were acquired from dissociated VNO cells from 5 male C57BL/6J mice at postnatal day 60. Libraries were sequenced on a NovaSeq 6000 instrument (Illumina). Fastq files (generated using Illumina bcl2fastq) were processed using 10x Genomics Cell Ranger analytical pipeline (v4.0.0) and mouse mm10 reference.
Quality control (QC), clustering, and downstream analysis were performed using the Seurat [3.2.3] package in R. QC was based on number of genes and percentage of mitochondrial genes. We used the median absolute deviation to choose an upper limit for number of genes. All cells that expressed >6,665 genes, <750 genes, >50,000 RNA, and >10% mitochondrial genes were not included in analysis. After filtering, data from 14,360 cells were included for clustering and analysis. We used SCTransform based normalization and selected the top 3,000 highly variable genes across the population to perform principal component analysis. The first 40 principal components were used for cell clustering, which was visualized using UMAP. We identified cell types based on known gene expression as previously shown 25. We removed cluster 8 from the UMAP as it showed gene expression profiles of multiple cell types.
QUANTIFICATION AND STATISTICAL ANALYSIS
Data analysis
All data were obtained from independent experiments performed on at least three days. Individual numbers of slices / experiments (n) are denoted in the respective figures and/or captions. If not stated otherwise, results are presented as means ± SD. Statistical analyses were performed using unpaired Mann-Whitney-U test or one-way ANOVA with Tukey’s HSD post hoc test (as dictated by data distribution and experimental design). Tests and corresponding p-values that report statistical significance (≤0.05) are individually specified in captions. Data were analyzed offline using either custom-written code in MATLAB (RRID:SCR_001622; The MathWorks, Natick, MA) or functions in IGOR Pro 8 (RRID:SCR_000325; WaveMetrics), Excel 2019 (Microsoft, Seattle, WA), or Imaris 9 (RRID: SCR_007370; Bitplane). Dose-response curves were fitted with the Hill-equation.
Analysis of relative contraction strength in acute VNO slices –
In both adult and juvenile VNO slices, contractions were visualized either by reflected light microscopy (during quasis-imultaneous Ca2+ imaging) or transmitted light differential interference contrast microscopy, respectively, depending on experimental design. Relative contraction strength was determined by changes in the area occupied by the large lateral venous sinus. For each experiment, the resting state venous sinus was outlined as a region-of-interest (ROI) and the position of each ROI pixel was tracked frame-by-frame throughout the time-lapse recordings by employing custom-written MATLAB code for movement correction and contraction analysis that we previously published 20 and that is publicly available (https://github.com/rwth-lfb/Fleck_Kenzler_et_al). Briefly, each frame was registered to their respective first image frame at time point 𝑡0, using the registration algorithm from 55 (implementation in 56), resulting in stabilized recordings without movement. Changes in venous sinus area (A) were then calculated relative to a baseline value (A0) that represents the mean area over the initial 70 frames of each recording.
Next, to determine and quantify stimulus-dependent contractions, we used custom-written MATLAB code for event / peak detection upon exposure to NA or ACh. To be counted as a contraction the relative change in venous sinus area (A/A0) needs to fulfill both of the following two criteria: (i) area change values must exceed a threshold that is the average baseline before stimulation (calculated from 30 frames preceding stimulation) plus thrice the baseline standard deviation (A/A0contract > A/A0baseline + 3 × SDbaseline); (ii) at least nine consecutive data points must exceed this threshold (effectively excluding small spontaneous contractions or artifacts). Area change amplitudes were calculated by subtracting A/A0 baseline values from the mean of the three consecutive peak values.
Analysis of SMC Ca2+ signals in acute VNO slices –
Fluorescence time-lapse recordings were corrected for movement as described above. After offset subtraction (background ROI) bleaching correction (monoexponential baseline fits), Ca2+-dependent changes in GCaMP6f intensity were measured as the normalized fluorescence signal ΔF/F0 (or ΔF/F), with (i) F0 corresponding to the average baseline fluorescence during the initial 70 frames of each recording, and (ii) ΔF corresponding to the difference between the fluorescence intensity in a given frame and F0. ΔF/F event / peak detection was performed as described above.
Analysis of OCT recordings –
OCT data was processed and analyzed in Imaris 9.9 & 10 (Bitplane), ImageJ, and MATLAB. Time series of horizontal optical sections were preprocessed with DeepInterpolation, a machine learning general-purpose denoising algorithm to eliminate random noise in imaging data 57. Using the Labkit 58 and trainable Weka Segmentation 59 plugins for machine learning pixel classification, we generated masks on each frame representing the luminal area and the lateral soft tissue of the VNO. After manual curation, these masks were used to reconstruct and measure the corresponding areas / volumes. In rare cases when parts of the lumen were not discernable because of insufficient light penetration, area / volume values were extrapolated from average data.
To measure movement of luminal content upon ACh stimulation we selected OCT time-lapse recordings of horizontal optical sections, which displayed areas of contrast inhomogeneity in the VNO lumen. Line scans along the lumen’s longitudinal axis were used to generate kymographs and track luminal movement in anterior or posterior direction. Regions of sufficient contrast were included in our analysis (i) if they were discernable at / around the time of ACh exposure, and (ii) if they were tracked until the end of the experiment. After subsequent binarization of kymograph traces we calculated average line traces for each track to visualize luminal content movement along the anterior-posterior axis.
Movement analysis in whole-mount ex vivo VNO preparations –
Macroscopic digital video recordings of VNO movement were analyzed manually frame-by-frame in ImageJ. Only contractions triggered upon first-time exposure to chemical stimulation (NA / ACh) were included. First, VNO size along its longitudinal (x) and transversal (y) axes was measured in pixels under resting conditions. Along its longitudinal axis, we considered an anterior, an intermediate, and a posterior part for analysis. For each of these three sections, horizontal and vertical lines of essentially the same length were drawn into each frame to track clearly identifiable anatomical landmarks (e.g., at the anterior tip). Next, the x- and y-positions of the center points of these tracking lines were recorded. Shifts in tracking point coordinates were expressed relative to the initial VNO size measurements and plotted as percentage of movement in longitudinal (x) and transversal (y) direction.
Next, to quantify stimulus-dependent contractions, we used custom-written MATLAB code for event / peak detection upon exposure to NA or ACh as described above, with few modifications: (i) to determine baseline values and their standard deviations from tracking point position, data from the initial 100 video frames was analyzed; and (ii) thresholds were calculated as baseline + 2 × SD. Resulting peak values were manually curated by the experimenter according to their observations from the corresponding videos. Rise time of contractions are calculated as the time between 20% and 80% of the peak amplitude.
Analysis of VNO smooth muscle fiber orientation –
Fluorescence lifetime imaging microscopy was used to distinguish / classify more lateral and rather circumferential fibers from those running longitudinally and close to the lumen. First, fluorescence lifetimes for all pixels are depicted in a phasor plot. Circular ROIs are then drawn around the two centroids of lifetime distributions to assign each pixel to either a green or a red channel. Fibers in each channel were then reconstructed as filamentous structures using the semi-automatic filament tracing tool in Imaris. Filaments shorter than 2 μm were discarded. Using Imaris, fiber orientation angles are calculated by, first, drawing a straight line from each fibers’ starting to endpoint and, second, by calculating the resulting angle to the x-axis. Fiber straightness is expressed as the quotient of the shortest linear distance between a fiber’s starting and endpoint and its actual length.
Analysis of single SMC movement trajectories in acute horizontal VNO slices –
Time-lapse image sequences were analyzed in Fiji using the TrackMate plugin. Analysis was restricted to cavernous tissue areas in the central VNO. Automated detection of individual SMCs and corresponding ROI generation was based on fluorescent “spot” diameter estimates of 10 μm and 7 μm for NA-sensitive and ACh-sensitive SMCs, respectively. ROI center positions were then tracked over time. Only cells / ROIs that showed (i) Ca2+ transients upon stimulation and (ii) continuously tracked trajectories over the (post-)stimulation period were included in analysis. Using custom Python scripts frame-by-frame shifts in x- and y-coordinates were summed and used to calculate displacement angles.
Analysis of presynaptic marker immunolocalization in VNO sections –
Immunofluorescence staining of longitudinal VNO cryosections against the presynaptic marker protein synaptophysin was analyzed using Imaris 9 (Bitplane). Sections were prepared from genetically modified mice expressing tdTomato in either (nor)adrenergic (TH-Cre 1 x Ai14), or cholinergic (ChAT-IRES-Cre x Ai14) nerve fibers. Overlap of tdTomato-labeled fibers with synaptophysin puncta was assessed using the Imaris colocalization tool. Then, a colocalization mask was generated, and putative presynaptic boutons (either noradrenergic or cholinergic) were flagged as colocalization objects. For topographical mapping of presynaptic boutons, we created to reference objects outlining the lumen and the space lateral to the VNO, respectively, as demarcations of the lateral and luminal borders. Next, for each colocalization object, we determined the shortest distances to the lateral and luminal borders. Relative luminal distance was then calculated as the absolute luminal distance divided by the sum of absolute distances to (i) lumen and (ii) lateral border.
Supplementary Material
Video S1: Noradrenaline triggers Ca2+ transients and concomitant smooth muscle contractions in large areas of the lateral VNO cavernous tissue. Related to Figure 2. Time-lapse GCaMP6f fluorescence microscopy and quasi-simultaneous reflective light imaging of an acute coronal VNO section from a from SMMHC-CreERT2 × Ai95D mouse challenged consecutively with brief focal NA ‘puffs’ (300 / 1000 μM). Seen are robust NA-dependent Ca2+ transients in large areas of the lateral cavernous tissue, which coincide with pronounced contractile motion of the lateral VNO. Lumen and large venous sinus as indicated. 20 × video replay speed.
Video S2: Distinct topography of NA- versus ACh-sensitive SMCs in horizontal VNO slices. Related to Figure 5. Time-lapse fluorescence imaging of the lateral (first half of video) and the posterior (second half of video) cavernous tissue in acute horizontal VNO sections loaded with the Ca2+-sensitive dye Cal520/AM. Successive stimulations with NA (100 μM) and ACh (100 μM) trigger robust Ca2+ signals in topographically distinct SMC populations. Fields-of-view are indicated as dashed rectangles in the schematic. 10 × video replay speed.
Video S3: Noradrenaline and acetylcholine trigger contractions of the intact decapsulated VNO. Related to Figure 5. Time-lapse brightfield macroscopic recordings of VNO movement in response to transient whole-organ exposure to NA (100 μM; first sequence) or ACh (100 μM; second sequence). Without stabilization by the cartilaginous capsule, NA-induced contractions manifest as both small longitudinal constrictions and more substantial transversal tightening. Lateral venous sinus and stimulus perfusion as indicated. Note the NA-dependent VNO torsion and concomitant constriction of the venous sinus as evidenced by blood movement. 40 × video replay speed.
Video S4: Noradrenaline triggers smooth muscle contractions and parallel lumen expansion in the neonatal VNO. Related to Figure 6. When stabilized by its cartilaginous capsule, time-lapse differential interference contrast imaging of acute coronal (first sequence) and acute horizontal (second sequence) VNO sections demonstrates robust, NA (100 μM) triggered contractions of the lateral VNO cavernous tissue that are paralleled by expansion of the vomeronasal lumen. Cartilaginous capsule, sensory epithelium, cavernous tissue, lumen and large venous sinus as indicated. 15 × video replay speed (repetition at 45 × replay speed for clarity).
Video S5: OCT allows 3D reconstruction of the mouse VNO. Related to Figure 7. In fresh post-mortem tissue, OCT enables non-invasive imaging of VNO anatomy (left hemisphere of a representative sample) and reconstruction of the vomeronasal capsule, soft tissue, lumen, and large venous sinus.
Video S6: OCT imaging of the intact bilateral mouse VNO. Related to Figures 7 and S7. In fresh post-mortem tissue, 2D OCT optical sections demonstrate the anatomy of the vomeronasal lumen, venous sinus, and duct. Notably, the vomeronasal ducts open rostro-laterally into the anterior ventral recess of the nasal cavity.
Video S7: 3D model of a revised conceptual framework for mouse vomeronasal pumping and stimulus sampling. Related to Figures 7 and S7. Animation is based on 3D reconstructions from OCT measurements (as shown in Figure 7B). NA-sensitive and ACh-sensitive smooth muscle fibers are distinguished by color. Model depicts a cycle of NA-dependent lumen expansion and antagonistic ACh-triggered constriction. A third dynamic sequence indicates that NA-induced contraction‒relaxation episodes are more pronounced and considerably faster when constant cholinergic tone defines a constricted baseline state of the VNO lumen.</SI_Caption>
Key resources table.
| REAGENT or RESOURCE | SOURCE | IDENTIFIER |
|---|---|---|
| Antibodies | ||
| Mouse monoclonal anti-α-smooth muscle actin – FITC (α-SMA-FITC) | Millipore Sigma | Cat#F3777; RRID: AB_476977 |
| Rat monoclonal anti-CD31 | BD Biosciences | Cat#557355; RRID: AB_396660 |
| Rabbit monoclonal anti-synaptophysin | Cell Signaling Technology | Cat#36406 |
| Goat polyclonal anti-rabbit IgG – Alexa Fluor 633 | Thermo Fisher | Cat#A-21070 |
| Goat polyclonal anti-rat IgG – Alexa Fluor 633 | Thermo Fisher | Cat#A-21094 |
| Chemicals, peptides, and recombinant proteins | ||
| DAPI stain | Thermo Fisher | Cat#D1306; RRID: AB_2629482 |
| DRAQ5 stain | Thermo Fisher | Cat#65–0880-96; RRID: AB_2869620 |
| SPY555-actin | Spirochrome | Cat#SC202 |
| Acetylcholine chloride | Sigma Aldrich | Cat#A6625 |
| L-Noradrenaline-bitartrate salt monohydrate (noradrenaline) | Sigma Aldrich | Cat#A9512 |
| Yohimbine | Sigma Aldrich | Cat#Y3125–1G |
| Doxazosin | Sigma Aldrich | Cat#D9815–50MG |
| Cal-520™ AM | AAT Bioquest | Cat#ABD-21130 |
| Deposited data | ||
| scRNA-seq VNO data | Katreddi et al.25 | GEO: GSE190330 |
| Experimental models: Organisms/strains | ||
| Mouse: C57BL/6J | Charles River Laboratories | RRID: IMSR_JAX:000664 |
| Mouse: B6.FVB-Tg(Myh11-icre/ERT2)1Soff/J (SMMHC-iCreERT2) | The Jackson Laboratory | RRID: IMSR_JAX:019079 |
| Mouse: B6J.Cg-Gt(ROSA)26Sortm95.1(CAG-GCaMP6f)Hze/MwarJ (Ai95D) | The Jackson Laboratory | RRID: IMSR_JAX:028865 |
| Mouse: B6.Cg-Gt(ROSA)26Sortm14(CAG-tdTomato)Hze/J (Ai14) | The Jackson Laboratory | RRID: IMSR_JAX:007914 |
| Mouse: B6.Cg-7630403G23RikTg(Th-cre)1Tmd/J (TH-Cre 1) | The Jackson Laboratory | RRID: IMSR_JAX:008601 |
| Mouse: B6.129S-Chattm1(cre)Lowl/MwarJ (ChAT-IRES-Cre (Δneo)) | The Jackson Laboratory | RRID: IMSR_JAX:031661 |
| Software and algorithms | ||
| LAS X | Leica Microsystems | RRID: SCR_013673 |
| Blender | https://www.blender.org | RRID: SCR_008606 |
| Igor Pro 8 & 9 | WaveMetrics | RRID: SCR_000325 |
| Imaris 9 & 10 | Bitplane | RRID: SCR_007370 |
| MetaMorph 7.10 | Molecular Devices | RRID: SCR_002368 |
| Movement / contraction analysis (custom-written MATLAB code) | Fleck et al.20 | https://github.com/rwth-lfb/Fleck_Kenzler_et_al |
| DeepInterpolation (Matlab implementation) | Lecoq et al.57 | |
| Trainable Weka Segmentation (Fiji plugin) | Arganda-Carreras et al.59 | |
| Labkit (Fiji plugin) | Arzt et al.58 | |
| Matlab 2019a-2023a | MathWorks Inc. | RRID: SCR_001622 |
| WEBMAXCLITE v1.15 | https://somapp.ucdmc.ucdavis.edu/pharmacology/bers/maxchelator/webmaxc/webmaxclite115.htm | RRID: SCR_000459 |
Highlights.
large parts of the lateral and posterior mouse VNO are built by smooth muscle
two types of muscle fibers display distinct topography, structure, and function
noradrenaline triggers lumen expansion, whereas acetylcholine acts antagonistically
our findings suggest a revised conceptual model of vomeronasal sampling
Acknowledgements
This work was funded by the Deutsche Forschungsgemeinschaft (DFG, German Research Foundation; 368482240/GRK2416 (MS), 233509121 (DM)), the Volkswagen Foundation (MS, I/83533), NIDCD (R01 DC017149 (PEF)), NICHD (R01 HD097331 (PEF)), and the German academic scholarship foundation (RD). MS is a Lichtenberg Professor of the Volkswagen Foundation. The work was supported by the facility for 3D Super Resolution (3DSR), a core facility of RWTH Aachen University. We thank Corinna Engelhardt, Jessica von Bongartz, and Stefanie Kurth (RWTH Aachen University) for assistance, Jeroen Kalkman (Delft University of Technology) for support and helpful discussions regarding OCT imaging, and all members of the Spehr laboratory for discussions.
Footnotes
Declaration of interests
The authors declare no competing interests.
Publisher's Disclaimer: This is a PDF file of an unedited manuscript that has been accepted for publication. As a service to our customers we are providing this early version of the manuscript. The manuscript will undergo copyediting, typesetting, and review of the resulting proof before it is published in its final form. Please note that during the production process errors may be discovered which could affect the content, and all legal disclaimers that apply to the journal pertain.
References
- 1.Baden T, Euler T, and Berens P (2020). Understanding the retinal basis of vision across species. Nat. Rev. Neurosci. 21, 5–20. 10.1038/s41583-019-0242-1. [DOI] [PubMed] [Google Scholar]
- 2.Hudspeth AJ (2014). Integrating the active process of hair cells with cochlear function. Nat. Rev. Neurosci. 15. 10.1038/nrn3786. [DOI] [PubMed] [Google Scholar]
- 3.Shepherd GM (2012). Neurogastronomy: How the Brain Creates Flavor and Why It Matters (Columbia University Press; ). [Google Scholar]
- 4.Jacobson L, Trotier D, and Døving KB (1998). Anatomical description of a new organ in the nose of domesticated animals by Ludvig Jacobson (1813). Chem. Senses 23, 743–754. 10.1093/chemse/23.6.743. [DOI] [PubMed] [Google Scholar]
- 5.Halpern M, and Martinez-Marcos A (2003). Structure and function of the vomeronasal system: an update. Prog. Neurobiol. 70, 245–318. 10.1016/S0301-0082(03)00103-5. [DOI] [PubMed] [Google Scholar]
- 6.Mohrhardt J, Nagel M, Fleck D, Ben-Shaul Y, and Spehr M (2018). Signal detection and coding in the accessory olfactory system. Chem. Senses 43, 667–695. 10.1093/chemse/bjy061. [DOI] [PMC free article] [PubMed] [Google Scholar]
- 7.Tirindelli R (2021). Coding of pheromones by vomeronasal receptors. Cell Tissue Res. 1. 10.1007/s00441-020-03376-6. [DOI] [PubMed] [Google Scholar]
- 8.Eccles R (1982). Autonomic innervation of the vomeronasal organ of the cat. Physiol. Behav. 28, 1011–1015. 10.1016/0031-9384(82)90168-8. [DOI] [PubMed] [Google Scholar]
- 9.Meredith M, and O’Connell RJ (1979). Efferent control of stimulus access to the hamster vomeronasal organ. J. Physiol. 286, 301–316. [DOI] [PMC free article] [PubMed] [Google Scholar]
- 10.Herzfeld P (1888). Ueber das Jacobson’sche Organ des Menschen und der Säugetiere. Zool. Jahrb. Abt. F. Anat. u. Ontog. d. Tiere 3, 151–554. [Google Scholar]
- 11.Meredith M, Marques DM, O’Connell RJ, and Stern FL (1980). Vomeronasal Pump: Significance for Male Hamster Sexual Behavior. Science 207, 1224–1226. [DOI] [PubMed] [Google Scholar]
- 12.Meredith M (1994). Chronic recording of vomeronasal pump activation in awake behaving hamsters. Physiol. Behav. 56, 345–354. 10.1016/0031-9384(94)90205-4. [DOI] [PubMed] [Google Scholar]
- 13.Ben-Shaul Y, Katz LC, Mooney R, and Dulac C (2010). In vivo vomeronasal stimulation reveals sensory encoding of conspecific and allospecific cues by the mouse accessory olfactory bulb. Proc. Natl. Acad. Sci. 107, 5172–5177. 10.1073/pnas.0915147107. [DOI] [PMC free article] [PubMed] [Google Scholar]
- 14.Cantó Soler MV, and Suburo AM (1998). Innervation of blood vessels in the vomeronasal complex of the rat. Brain Res. 811, 47–56. 10.1016/S0006-8993(98)00923-8. [DOI] [PubMed] [Google Scholar]
- 15.Oshima A, Kojima T, Dejima K, Hisa Y, Kasai H, and Nemoto T (2005). Two-photon microscopic analysis of acetylcholine-induced mucus secretion in guinea pig nasal glands. Cell Calcium 37, 349–357. 10.1016/j.ceca.2004.12.003. [DOI] [PubMed] [Google Scholar]
- 16.Tirindelli R, Dibattista M, Pifferi S, and Menini A (2009). From Pheromones to Behavior. Physiol. Rev. 89, 921–956. 10.1152/physrev.00037.2008. [DOI] [PubMed] [Google Scholar]
- 17.Bland KP, and Cottrell DF (1989). The nervous control of intraluminal pressure in the vomeronasal organ of the domestic ram. Q. J. Exp. Physiol. 74, 813–824. 10.1113/expphysiol.1989.sp003351. [DOI] [PubMed] [Google Scholar]
- 18.Salazar I, Sánchez-Quinteiro P, Alemañ N, and Prieto D (2008). Anatomical, immnunohistochemical and physiological characteristics of the vomeronasal vessels in cows and their possible role in vomeronasal reception. J. Anat. 212, 686–696. 10.1111/j.1469-7580.2008.00889.x. [DOI] [PMC free article] [PubMed] [Google Scholar]
- 19.Villamayor PR, Cifuentes JM, Fdz.-de-Troconiz P, and Sanchez-Quinteiro P (2018). Morphological and immunohistochemical study of the rabbit vomeronasal organ. J. Anat. 233, 814–827. 10.1111/joa.12884. [DOI] [PMC free article] [PubMed] [Google Scholar]
- 20.Fleck D, Kenzler L, Mundt N, Strauch M, Uesaka N, Moosmann R, Bruentgens F, Missel A, Mayerhofer A, Merhof D, et al. (2021). ATP activation of peritubular cells drives testicular sperm transport. Elife 10, 1–30. 10.7554/eLife.62885. [DOI] [PMC free article] [PubMed] [Google Scholar]
- 21.Wirth A, Benyó Z, Lukasova M, Leutgeb B, Wettschureck N, Gorbey S, Orsy P, Horváth B, Maser-Gluth C, Greiner E, et al. (2008). G12-G13-LARG-mediated signaling in vascular smooth muscle is required for salt-induced hypertension. Nat. Med. 14, 64–68. 10.1038/nm1666. [DOI] [PubMed] [Google Scholar]
- 22.Manno C, Tammineni E, Figueroa L, Oropeza-Almazán Y, and Rios E (2022). A novel method for determining murine skeletal muscle fiber type using autofluorescence lifetimes. J. Gen. Physiol. 154. 10.1085/jgp.202213143. [DOI] [PMC free article] [PubMed] [Google Scholar]
- 23.García DI, Lanigan P, Webb M, West TG, Requejo-Isidro J, Auksorius E, Dunsby C, Neil M, French P, and Ferenczi MA (2007). Fluorescence Lifetime Imaging to Detect Actomyosin States in Mammalian Muscle Sarcomeres. Biophys. J. 93, 2091–2101. 10.1529/biophysj.106.096479. [DOI] [PMC free article] [PubMed] [Google Scholar]
- 24.Malacrida L, Ranjit S, Jameson DM, and Gratton E (2021). The Phasor Plot: A Universal Circle to Advance Fluorescence Lifetime Analysis and Interpretation. Annu. Rev. Biophys. 50, 575–593. 10.1146/annurev-biophys-062920-063631. [DOI] [PubMed] [Google Scholar]
- 25.Katreddi RR, Taroc EZM, Hicks SM, Lin JM, Liu S, Xiang M, and Forni PE (2022). Notch signaling determines cell-fate specification of the two main types of vomeronasal neurons of rodents. Development 149. 10.1242/dev.200448. [DOI] [PMC free article] [PubMed] [Google Scholar]
- 26.Alexander SPH, Christopoulos A, Davenport AP, Kelly E, Mathie A, Peters JA, Veale EL, Armstrong JF, Faccenda E, Harding SD, et al. (2021). THE CONCISE GUIDE TO PHARMACOLOGY 2021/22: G protein-coupled receptors. Br. J. Pharmacol. 178, S27–S156. 10.1111/bph.15538. [DOI] [PubMed] [Google Scholar]
- 27.Spehr M, Kelliher KR, Li X-H, Boehm T, Leinders-Zufall T, and Zufall F (2006). Essential role of the main olfactory system in social recognition of major histocompatibility complex peptide ligands. J. Neurosci. 26, 1961–1970. 10.1523/JNEUROSCI.4939-05.2006. [DOI] [PMC free article] [PubMed] [Google Scholar]
- 28.Luo L (2020). Principles of Neurobiology 1st ed. Luo L, ed. (Garland Science; ) 10.1201/9781003053972. [DOI] [Google Scholar]
- 29.Mouritsen H (2018). Long-distance navigation and magnetoreception in migratory animals. Nature 558, 50–59. 10.1038/s41586-018-0176-1. [DOI] [PubMed] [Google Scholar]
- 30.Gracheva EO, Ingolia NT, Kelly YM, Cordero-Morales JF, Hollopeter G, Chesler AT, Sánchez EE, Perez JC, Weissman JS, and Julius D (2010). Molecular basis of infrared detection by snakes. Nature 464, 1006–1011. 10.1038/nature08943. [DOI] [PMC free article] [PubMed] [Google Scholar]
- 31.Bellono NW, Leitch DB, and Julius D (2017). Molecular basis of ancestral vertebrate electroreception. Nature 543, 391–396. 10.1038/nature21401. [DOI] [PMC free article] [PubMed] [Google Scholar]
- 32.Hill-Eubanks DC, Werner ME, Heppner TJ, and Nelson MT (2011). Calcium signaling in smooth muscle. Cold Spring Harb Perspect Biol 3, a004549. 10.1016/B978-0-12-374145-5.00127-3. [DOI] [PMC free article] [PubMed] [Google Scholar]
- 33.Berridge MJ (2008). Smooth muscle cell calcium activation mechanisms. J. Physiol. 586, 5047–5061. 10.1113/jphysiol.2008.160440. [DOI] [PMC free article] [PubMed] [Google Scholar]
- 34.Kopf PG, Phelps LE, Schupbach CD, Johnson AK, and Peuler JD (2018). Differential effects of long-term slow-pressor and subpressor angiotensin II on contractile and relaxant reactivity of resistance versus conductance arteries. Physiol. Rep. 6, e13623. 10.14814/phy2.13623. [DOI] [PMC free article] [PubMed] [Google Scholar]
- 35.Britto-Júnior J, Lima AT, Campos R, Gião AA, Mendes GD, Ferreira-Novaes Silva LP, Fregonesi A, Pupo AS, Antunes E, and De Nucci G (2023). 6-Nitrodopamine potentiates contractions of rat isolated vas deferens induced by noradrenaline, adrenaline, dopamine and electric field stimulation. Naunyn. Schmiedebergs. Arch. Pharmacol. 10.1007/s00210-023-02478-6. [DOI] [PubMed] [Google Scholar]
- 36.Levy DR, Sofer Y, Brumfeld V, Zilkha N, and Kimchi T (2020). The Nasopalatine Ducts Are Required for Proper Pheromone Signaling in Mice. Front. Neurosci. 14, 1–12. 10.3389/fnins.2020.585323. [DOI] [PMC free article] [PubMed] [Google Scholar]
- 37.Pelosi P, and Knoll W (2022). Odorant‐binding proteins of mammals. Biol. Rev. 97, 20–44. 10.1111/brv.12787. [DOI] [PubMed] [Google Scholar]
- 38.Caulfield MP, and Birdsall NJ (1998). International Union of Pharmacology. XVII. Classification of muscarinic acetylcholine receptors. Pharmacol. Rev. 50, 279–290. [PubMed] [Google Scholar]
- 39.Fryer AD, and Jacoby DB (1998). Muscarinic Receptors and Control of Airway Smooth Muscle. Am. J. Respir. Crit. Care Med. 158, S154–S160. 10.1164/ajrccm.158.supplement_2.13tac120. [DOI] [PubMed] [Google Scholar]
- 40.Jabir NR, Firoz CK, Zughaibi TA, Alsaadi MA, Abuzenadah AM, Al-Asmari AI, Alsaieedi A, Ahmed BA, Ramu AK, and Tabrez S (2022). A literature perspective on the pharmacological applications of yohimbine. Ann. Med. 54, 2849–2863. 10.1080/07853890.2022.2131330. [DOI] [PMC free article] [PubMed] [Google Scholar]
- 41.Hancock AA, Buckner SA, Brune ME, Katwala S, Milicic I, Ireland LM, Morse PA, Knepper SM, Meyer MD, Chapple CR, et al. (1998). Pharmacological characterization of A-131701, a novel α1-adrenoceptor antagonist selective for α1A- and α1D-compared to α1B-adrenoceptors. Drug Dev. Res. 44, 140–162. 10.1002/(SICI)1098-2299(199808)44:4<140::AID-DDR2>3.0.CO;2-R. [DOI] [Google Scholar]
- 42.Hart B (1987). Stimulus and hormonal determinants of flehmen behavior in cats. Horm. Behav. 21, 44–52. 10.1016/0018-506X(87)90029-8. [DOI] [PubMed] [Google Scholar]
- 43.Iwanaga T, and Nio-Kobayashi J (2020). Unique blood vasculature and innervation in the cavernous tissue of murine vomeronasal organs. Biomed. Res. 41, 243–251. [DOI] [PubMed] [Google Scholar]
- 44.Cieri RL (2019). Pulmonary Smooth Muscle in Vertebrates: A Comparative Review of Structure and Function. Integr. Comp. Biol 59, 10–28. 10.1093/icb/icz002. [DOI] [PubMed] [Google Scholar]
- 45.Reimer J, McGinley MJ, Liu Y, Rodenkirch C, Wang Q, McCormick DA, and Tolias AS (2016). Pupil fluctuations track rapid changes in adrenergic and cholinergic activity in cortex. Nat. Commun. 7, 13289. 10.1038/ncomms13289. [DOI] [PMC free article] [PubMed] [Google Scholar]
- 46.Bressan D, Battistoni G, and Hannon GJ (2023). The dawn of spatial omics. Science (80-. ). 381. 10.1126/science.abq4964. [DOI] [PMC free article] [PubMed] [Google Scholar]
- 47.Madisen L, Garner AR, Shimaoka D, Chuong AS, Klapoetke NC, Li L, van der Bourg A, Niino Y, Egolf L, Monetti C, et al. (2015). Transgenic Mice for Intersectional Targeting of Neural Sensors and Effectors with High Specificity and Performance. Neuron 85, 942–958. 10.1016/j.neuron.2015.02.022. [DOI] [PMC free article] [PubMed] [Google Scholar]
- 48.Savitt JM, Jang SS, Mu W, Dawson VL, and Dawson TM (2005). Bcl-x is required for proper development of the mouse substantia nigra. J. Neurosci. Off. J. Soc. Neurosci. 25, 6721–6728. 10.1523/JNEUROSCI.0760-05.2005. [DOI] [PMC free article] [PubMed] [Google Scholar]
- 49.Rossi J, Balthasar N, Olson D, Scott M, Berglund E, Lee CE, Choi MJ, Lauzon D, Lowell BB, and Elmquist JK (2011). Melanocortin-4 receptors expressed by cholinergic neurons regulate energy balance and glucose homeostasis. Cell Metab. 13, 195–204. 10.1016/j.cmet.2011.01.010. [DOI] [PMC free article] [PubMed] [Google Scholar]
- 50.Madisen L, Zwingman TA, Sunkin SM, Oh SW, Zariwala HA, Gu H, Ng LL, Palmiter RD, Hawrylycz MJ, Jones AR, et al. (2010). A robust and high-throughput Cre reporting and characterization system for the whole mouse brain. Nat. Neurosci. 13, 133–140. 10.1038/nn.2467. [DOI] [PMC free article] [PubMed] [Google Scholar]
- 51.Veitinger S, Veitinger T, Cainarca S, Fluegge D, Engelhardt CH, Lohmer S, Hatt H, Corazza S, Spehr J, Neuhaus EM, et al. (2011). Purinergic signalling mobilizes mitochondrial Ca2+ in mouse Sertoli cells. J. Physiol. 589, 5033–5055. 10.1113/jphysiol.2011.216309. [DOI] [PMC free article] [PubMed] [Google Scholar]
- 52.Hagendorf S, Fluegge D, Engelhardt CH, and Spehr M (2009). Homeostatic control of sensory output in basal vomeronasal neurons: activity-dependent expression of ether-à-go-go-related gene potassium channels. J. Neurosci. 29, 206–221. 10.1523/JNEUROSCI.3656-08.2009. [DOI] [PMC free article] [PubMed] [Google Scholar]
- 53.Cichy A, Ackels T, Tsitoura C, Kahan A, Gronloh N, Söchtig M, Engelhardt CH, Ben-Shaul Y, Müller F, Spehr J, et al. (2015). Extracellular pH Regulates Excitability of Vomeronasal Sensory Neurons. J. Neurosci. 35, 4025–4039. 10.1523/JNEUROSCI.2593-14.2015. [DOI] [PMC free article] [PubMed] [Google Scholar]
- 54.Ferrero DM, Lemon JK, Fluegge D, Pashkovski SL, Korzan WJ, Datta SR, Spehr M, Fendt M, and Liberles SD (2011). Detection and avoidance of a carnivore odor by prey. Proc. Natl. Acad. Sci. U. S. A. 108, 11235–11240. 10.1073/pnas.1103317108. [DOI] [PMC free article] [PubMed] [Google Scholar]
- 55.Liu C, Yuen J, and Torralba A (2015). Sift flow: Dense correspondence across scenes and its applications. Dense Image Corresp. Comput. Vis, 15–49. 10.1007/978-3-319-23048-1_2. [DOI] [PubMed] [Google Scholar]
- 56.Evangelidis G (2013). Iat: A matlab toolbox for image alignment. sites.google.com/site/imagealignment. https://sites.google.com/site/imagealignment/download.
- 57.Lecoq J, Oliver M, Siegle JH, Orlova N, Ledochowitsch P, and Koch C (2021). Removing independent noise in systems neuroscience data using DeepInterpolation. Nat. Methods 18, 1401–1408. 10.1038/s41592-021-01285-2. [DOI] [PMC free article] [PubMed] [Google Scholar]
- 58.Arzt M, Deschamps J, Schmied C, Pietzsch T, Schmidt D, Tomancak P, Haase R, and Jug F (2022). LABKIT: Labeling and Segmentation Toolkit for Big Image Data. Front. Comput. Sci. 4, 1–12. 10.3389/fcomp.2022.777728. [DOI] [Google Scholar]
- 59.Arganda-Carreras I, Kaynig V, Rueden C, Eliceiri KW, Schindelin J, Cardona A, and Sebastian Seung H (2017). Trainable Weka Segmentation: a machine learning tool for microscopy pixel classification. Bioinformatics 33, 2424–2426. 10.1093/bioinformatics/btx180. [DOI] [PubMed] [Google Scholar]
Associated Data
This section collects any data citations, data availability statements, or supplementary materials included in this article.
Supplementary Materials
Video S1: Noradrenaline triggers Ca2+ transients and concomitant smooth muscle contractions in large areas of the lateral VNO cavernous tissue. Related to Figure 2. Time-lapse GCaMP6f fluorescence microscopy and quasi-simultaneous reflective light imaging of an acute coronal VNO section from a from SMMHC-CreERT2 × Ai95D mouse challenged consecutively with brief focal NA ‘puffs’ (300 / 1000 μM). Seen are robust NA-dependent Ca2+ transients in large areas of the lateral cavernous tissue, which coincide with pronounced contractile motion of the lateral VNO. Lumen and large venous sinus as indicated. 20 × video replay speed.
Video S2: Distinct topography of NA- versus ACh-sensitive SMCs in horizontal VNO slices. Related to Figure 5. Time-lapse fluorescence imaging of the lateral (first half of video) and the posterior (second half of video) cavernous tissue in acute horizontal VNO sections loaded with the Ca2+-sensitive dye Cal520/AM. Successive stimulations with NA (100 μM) and ACh (100 μM) trigger robust Ca2+ signals in topographically distinct SMC populations. Fields-of-view are indicated as dashed rectangles in the schematic. 10 × video replay speed.
Video S3: Noradrenaline and acetylcholine trigger contractions of the intact decapsulated VNO. Related to Figure 5. Time-lapse brightfield macroscopic recordings of VNO movement in response to transient whole-organ exposure to NA (100 μM; first sequence) or ACh (100 μM; second sequence). Without stabilization by the cartilaginous capsule, NA-induced contractions manifest as both small longitudinal constrictions and more substantial transversal tightening. Lateral venous sinus and stimulus perfusion as indicated. Note the NA-dependent VNO torsion and concomitant constriction of the venous sinus as evidenced by blood movement. 40 × video replay speed.
Video S4: Noradrenaline triggers smooth muscle contractions and parallel lumen expansion in the neonatal VNO. Related to Figure 6. When stabilized by its cartilaginous capsule, time-lapse differential interference contrast imaging of acute coronal (first sequence) and acute horizontal (second sequence) VNO sections demonstrates robust, NA (100 μM) triggered contractions of the lateral VNO cavernous tissue that are paralleled by expansion of the vomeronasal lumen. Cartilaginous capsule, sensory epithelium, cavernous tissue, lumen and large venous sinus as indicated. 15 × video replay speed (repetition at 45 × replay speed for clarity).
Video S5: OCT allows 3D reconstruction of the mouse VNO. Related to Figure 7. In fresh post-mortem tissue, OCT enables non-invasive imaging of VNO anatomy (left hemisphere of a representative sample) and reconstruction of the vomeronasal capsule, soft tissue, lumen, and large venous sinus.
Video S6: OCT imaging of the intact bilateral mouse VNO. Related to Figures 7 and S7. In fresh post-mortem tissue, 2D OCT optical sections demonstrate the anatomy of the vomeronasal lumen, venous sinus, and duct. Notably, the vomeronasal ducts open rostro-laterally into the anterior ventral recess of the nasal cavity.
Video S7: 3D model of a revised conceptual framework for mouse vomeronasal pumping and stimulus sampling. Related to Figures 7 and S7. Animation is based on 3D reconstructions from OCT measurements (as shown in Figure 7B). NA-sensitive and ACh-sensitive smooth muscle fibers are distinguished by color. Model depicts a cycle of NA-dependent lumen expansion and antagonistic ACh-triggered constriction. A third dynamic sequence indicates that NA-induced contraction‒relaxation episodes are more pronounced and considerably faster when constant cholinergic tone defines a constricted baseline state of the VNO lumen.</SI_Caption>
Data Availability Statement
All data reported in this paper will be shared by the lead contact upon request.
This paper does not report original code.
Any additional information required to reanalyze the data reported in this paper is available from the lead contact upon request.