

Abstract
Aims
Acute myocardial infarction (AMI) is a cardiovascular disease with high morbidity and mortality. We collected patients with AMI from the Medical Information Mart for Intensive Care IV (v2.0) database and explored the association between serum albumin‐corrected anion gap (ACAG) level and mortality in patients with AMI.
Methods and results
Data of adult patients with AMI were collected. According to the 360 day prognosis, patients were divided into survival and non‐survival groups. Based on the ACAG level, patients were then divided into normal and high ACAG groups. Cox hazard proportional models and restricted cubic splines (RCSs) were used to investigate the correlation between ACAG and mortality. Kaplan–Meier curves were created to compare the cumulative survival rates between the high and normal ACAG groups. The receiver operating characteristic (ROC) curve was used to analyse the predictive value of ACAG for the prognosis of patients with AMI. Sensitivity and subgroup analyses were conducted to revalidate the results. Finally, 1783 patients were included. Elevated ACAG (>20 mmol/L) was significantly associated with 30 and 360 day mortality (P < 0.001). Adjusted for multiple confounding factors, the Cox proportional hazard analysis showed that elevated ACAG (>20 mmol/L) was an independent risk factor of increased all‐cause mortality in patients with AMI (hazard ratio 1.423, 95% confidence interval 1.206–1.678, P < 0.001). RCS analysis further showed that there was a non‐linear trend relationship between ACAG and the risk of all‐cause mortality at 30 and 360 days (χ 2 = 10.750, P = 0.013; χ 2 = 13.960, P = 0.003). Kaplan–Meier survival curves showed that the 30 and 360 day cumulative survival rates of patients with AMI were significantly lower (log‐rank test, χ 2 = 98.880, P < 0.001; χ 2 = 105.440, P < 0.001) in the high ACAG group. ROC curve analysis showed that the area under the curve (AUC) of ACAG was 0.651, while the AUC of anion gap (AG) was 0.609, indicating that ACAG had a higher predictive value for 360 day mortality than AG. When combined with Sequential Organ Failure Assessment score, the predictive performance of ACAG for 360 day mortality was better, with an AUC of 0.699. Sensitivity and subgroup analyses were conducted suggesting the stability of our results.
Conclusions
Elevated serum ACAG (≥20 mmol/L) is an independent risk factor for short‐term and long‐term mortality in critically ill patients with AMI, and it may assist clinicians and nurses identifying high‐risk patients.
Keywords: Albumin‐corrected anion gap, Acute myocardial infarction, Mortality, Prognosis, MIMIC‐IV
Introduction
Acute myocardial infarction (AMI) is a cardiovascular disease, usually caused by blockage of coronary arteries. Because of its high morbidity and mortality, it has been widely concerned. 1 , 2 , 3 , 4 In 2017, according to statistics, 695 000 people in the United States experienced AMI, and 325 000 got AMI for the second time. 5 Although early treatment with reperfusion and medical therapy has improved the prognosis of AMI patients over the past 30 years, its mortality remains high. 6 Therefore, early identification and accurate judgement of the prognosis of patients with AMI are particularly urgent, but this is full of challenges and is often affected by unavoidable factors.
Many prognostic indicators for patients with AMI have been discovered, such as troponin, high‐sensitivity C‐reactive protein (hs‐CRP), plasma tissue factor (PTF), and neutrophil‐to‐lymphocyte (N/L) ratio; however, their value is still debatable. 7 , 8 , 9 , 10 , 11 The limitations of those indicators in prognosis research are noteworthy. For instance, studies involving hs‐CRP showed that hs‐CRP was a significant independent risk factor for in‐hospital outcomes in patients with AMI, 7 , 11 but the long‐time outcomes remained less explored. Similarly, investigations into PTF activity have predominantly concentrated on its correlation with ventricular remodelling, omitting comprehensive analyses of mortality. 10 The study focusing on the N/L ratio specifically targeted elderly patients, which differs from our study involving adult patients aged over 18 years. 8 Additionally, high‐sensitivity troponin measurements, although sensitive in detecting myocardial injury, exhibit limited specificity for AMI. Elevated levels of troponin can manifest in various medical conditions, including other heart diseases, kidney disorders, infections, inflammation, and trauma. 7 Therefore, we are dedicated to researching fast and efficient indicators for predicting the prognosis of patients with AMI. The anion gap (AG) is a commonly used biochemical marker in clinical acid–base balance assessment. Studies have shown that AG can not only assess the severity of the disease but also predict the prognosis of patients. 12 , 13 , 14 However, AG is not a fixed value and can be influenced by various factors, including changes in albumin levels. 15 In consideration of these factors, the albumin‐corrected AG (ACAG) has emerged. ACAG is a novel biochemical marker designed to correct AG, aiming to more accurately reflect the presence of unmeasured anions. 15 Some scholars have proposed that ACAG is more suitable for intensive care unit (ICU) patients because of the hypoalbuminaemia in those patients. As a new type of serological index, ACAG has been reported to be associated with the prognosis and severity of some diseases, such as sepsis, 16 disseminated intravascular coagulation, 17 and kidney disease. 18 However, studies on the correlation between ACAG and the prognosis of patients with AMI have not been reported. Therefore, we collected patients with AMI from the Medical Information Mart for Intensive Care IV (MIMIC‐IV, v2.0) 19 and explored the association between serum ACAG level and prognosis so as to detect high‐risk patients early.
Materials and methods
Study population and data extraction
We extracted the data on adult patients diagnosed with AMI (ICD‐9 and ICD‐10 codes of 410%, 121%, and 122%) by the Structured Query Language (SQL) in the MIMIC‐IV database from 2008 to 2019, which was approved by the institutional review boards of Beth Israel Deaconess Medical Center and the Massachusetts Institute of Technology, and one of the authors was authorized to have access to the database (ID number: 42303155). We designed and conducted this study in accordance with the relevant guidelines and regulations (Declaration of Helsinki).
Exclusion criteria include the following: (i) ICU length of stay <24 h, (ii) repeat admission to ICU, and (iii) missing key data such as AG and ACAG.
Clinical data included age, sex, Sequential Organ Failure Assessment (SOFA) score, comorbidities, AG, albumin, ACAG, white blood cell (WBC) count, red blood cell (RBC) count, platelet count, RBC distribution width (RDW), blood urea nitrogen (BUN), serum creatinine, aspartate aminotransferase (AST), alanine aminotransferase (ALT), prothrombin time (PT), blood glucose, serum sodium, serum chorine, serum total serum calcium, serum potassium, serum phosphorus, and the proportion of receiving renal replacement therapy (RRT), mechanical ventilation (MV), intra‐aortic balloon counterpulsation (IABP), defibrillation, furosemide, norepinephrine, and dopamine. The aforementioned comorbidities include hypotension, diabetes, congestive heart failure, atrial fibrillation (AF), chronic kidney disease (CKD), chronic pulmonary disease, cancer, cerebrovascular disease, rheumatic disease, cardiac arrest (CA), cardiogenic shock, ventricular fibrillation (VF), acute kidney injury (AKI), and acute pancreatitis. The clinical data collected were all the first test results after ICU admission. Meanwhile, the collection time points of laboratory parameters in our study was consistent with the MIMIC official website, defining the first day upon ICU admission as the period spanning the first 6 h before ICU admission through the initial 24 h after ICU admission.
AG, like other laboratory indicators, was directly extracted from the MIMIC database, which was different from previous literature, 20 where AG was calculated using indicators such as sodium, chloride, and bicarbonate. The direct acquisition of AG in this study avoids confounding factors caused by these indicators not being measured at the same time point.
Groups and endpoints
According to the 360 day prognosis, all patients were divided into survival group (n = 1067) and non‐survival group (n = 716). Based on the previous literature, 18 , 21 , 22 the ACAG calculation formula was as follows: ACAG = AG + [4.4 − ALB (g/dL)] × 2.5. At the same time, according to the first serum ACAG level of patients admitted to the ICU, the patients were divided into normal ACAG group (12–20 mmol/L, n = 993) and high ACAG group (>20 mmol/L, n = 790).
The endpoints of the study were 30, 90, and 360 day all‐cause mortality.
Statistical analysis
Continuous data followed a normal distribution. It would be expressed as mean ± standard deviation (. The t‐test was used for comparison between groups. If it did not conform to the normal distribution, it was expressed as the median (inter‐quartile range) (IQR) with the Mann–Whitney U test for comparison between groups. Categorical variables were represented by composition ratio (%), and the method of χ 2 test was adopted.
Least absolute shrinkage and selection operator (LASSO) regression analysis was used to screen the variables associated with the 360 day prognosis, and the Cox hazard proportional models of the correlation between ACAG and 30, 90, and 360 day mortality were established. The results were presented as hazard ratios (HRs) and 95% confidence intervals (CIs).
In Cox regression analysis, no covariates were adjusted in Model 1. Model 2 adjusted for age, BUN, potassium, RBC, RDW, PT, and SOFA score. Based on Model 2, another nine variables in Model 3 were adjusted including CA, cardiogenic shock, AKI, cerebrovascular disease, chronic pulmonary disease, malignant tumour, and the proportion of receiving IABP, norepinephrine, and defibrillation.
Restricted cubic spline (RCS) analyses were adopted to further clarify the relationship between ACAG and the risk of 30, 90, and 360 day all‐cause mortality. Kaplan–Meier curves were created, and log‐rank tests were used to compare the 30, 90, and 360 day cumulative survival rates between the high ACAG group and the normal ACAG group.
The receiver operating characteristic (ROC) curves were used to compare the predictive value of different indicators (AG, ACAG, and SOFA score) for 360 day mortality. Subgroup analysis was performed to further verify whether the association between ACAG and 360 day mortality was affected by the following factors: age (≥70 or <70 years), sex (female or male), hypertension (yes or no), diabetes (yes or no), congestive heart failure (yes or no), CKD (yes or no), VF (yes or no), CA (yes or no), AKI (yes or no), MV (yes or no), RRT (yes or no), IABP (yes or no), defibrillation (yes or no), furosemide (yes or no), dobutamine (yes or no), and norepinephrine (yes or no).
Two sensitivity analyses were conducted to revalidate the results. First, patients with non‐ST‐segment elevation myocardial infarction (NSTEMI) were excluded, and a sensitivity analysis was also conducted. Second, considering the impact of old myocardial infarction (MI) on the results, we excluded patients with old MI and performed another sensitivity analysis.
Stata 14.0 and R 4.2.0 were used for data analysis, and P < 0.05 was considered statistically significant.
Results
Participants and characteristic
A total of 13 007 patients with AMI were diagnosed. Among them, 5242 AMI patients were admitted to the ICU. After excluding 782 patients whose ICU stay was <24 h, 4460 cases were left. The number of patients without ACAG and with ACAG was 2677 and 1783, respectively. Comparison of basic information between the patients with and without ACAG was shown in Supporting Information, Table S1 . As shown in Figure 1 , from a pool of over 70 000 individuals in the MIMIC database, we initially screened 53 569 patients who were admitted for the first time, of which there were 5242 patients with AMI. Finally, 1783 patients who met the requirements were included in this study. The demographic and clinical characteristics of the survival and non‐survival groups by 360 day mortality were compared in Table 1 . Among the 1783 participants, males accounted for 59%, with an average age of 71.60 ± 13.62 years old. The non‐survival group exhibited elevated levels (P < 0.05) in SOFA score, AG, ACAG, WBC, RDW, BUN, creatinine, AST, PT, blood glucose, serum potassium, serum phosphorus, as well as an increased proportion of malignant tumors. Additionally, a higher likelihood of receiving treatments such as RRT, defibrillation, epinephrine, and dobutamine was observed (P < 0.05) However, the levels of albumin, RBC, platelet, as well as the proportions of patients receiving MV, IABP and furosemide in the non‐survival group were lower. Also, the incidence of comorbidites, including hypertension, diabetes, congestive heart failure, AF, CKD, chronic lung disease, cerebrovascular disease, cardiogenic shock, and AKI was lower in the non‐survival group (all P < 0.05), as shown in Table 1 .
Figure 1.

The flowchart of patients screening. ACAG, albumin‐corrected anion gap; AMI, acute myocardial infarction; ICU, intensive care unit; MIMIC‐IV, Medical Information Mart for Intensive Care IV.
Table 1.
Baseline characteristics of enrolled patients between the two groups
| Variables |
All participants (n = 1783) |
Survival group (n = 1067) |
Non‐survival group (n = 716) |
t/Z/χ 2 | P value |
|---|---|---|---|---|---|
| Age (years) | 71.60 ± 13.62 | 68.75 ± 13.57 | 75.84 ± 12.57 | −11.129 | <0.001 |
| Sex, male, n (%) | 1052 (59.00) | 647 (60.64) | 405 (56.56) | 2.939 | 0.086 |
| SOFA score | 6.72 ± 4.32 | 5.60 ± 3.89 | 8.39 ± 4.40 | −14.066 | <0.001 |
| AG (mmol/L) | 17.73 ± 5.32 | 16.99 ± 5.10 | 18.82 ± 5.46 | −7.240 | <0.001 |
| Albumin (g/L) | 3.34 ± 0.63 | 3.45 ± 0.60 | 3.18 ± 0.64 | 9.066 | <0.001 |
| ACAG (mmol/L) | 20.37 ± 5.45 | 19.37 ± 5.16 | 21.87 ± 5.55 | −9.764 | <0.001 |
| WBC (× 109/L) | 12.10 (8.70, 16.60) | 11.80 (8.60, 15.80) | 12.70 (8.90, 18.00) | −3.253 | 0.001 |
| RBC (× 1012/L) | 3.75 ± 0.85 | 3.86 ± 0.83 | 3.58 ± 0.85 | 6.713 | <0.001 |
| Platelet (× 109/L) | 211 (158, 279) | 215 (164, 277) | 205.5 (144.5, 281.5) | 2.428 | 0.015 |
| RDW (%) | 14.95 ± 2.28 | 14.50 ± 2.08 | 15.62 ± 2.41 | −10.497 | <0.001 |
| BUN (mg/dL) | 9.26 (6.05, 16.02) | 7.83 (5.70, 13.17) | 12.10 (7.83, 19.22) | −10.799 | <0.001 |
| Creatinine (μmol/L) | 114.92 (79.56, 185.64) | 97.24 (79.56, 159.12) | 141.44 (97.24, 221.00) | −9.304 | <0.001 |
| AST (U/L) | 57.50 (33.00, 139.00) | 55.00 (31.00, 128.00) | 65.00 (35.50, 155.00) | −3.465 | <0.001 |
| ALT (U/L) | 33.00 (19.00, 72.00) | 33.00 (19.00, 65.00) | 33.00 (19.00, 84.00) | −1.302 | 0.193 |
| PT (seconds) | 13.60 (12.20, 16.10) | 13.10 (11.90, 15.00) | 14.50 (12.70, 18.60) | −9.564 | <0.001 |
| Glucose (mmol/L) | 8.33 (6.50, 11.67) | 8.17 (6.44, 11.28) | 8.67 (6.56, 12.19) | −1.723 | <0.001 |
| Serum sodium (mmol/L) | 137.78 ± 5.57 | 137.74 ± 4.96 | 137.84 ± 6.38 | −0.395 | 0.693 |
| Serum chlorine (mmol/L) | 101.95 ± 6.74 | 102.19 ± 6.30 | 101.59 ± 7.34 | 1.850 | 0.065 |
| Serum potassium (mmol/L) | 4.50 ± 1.01 | 4.38 ± 0.91 | 4.68 ± 1.11 | −6.243 | <0.001 |
| Serum calcium (mg/L) | 2.10 ± 0.23 | 2.10 ± 0.22 | 2.09 ± 0.25 | 0.593 | 0.553 |
| Serum phosphorus (mmol/L) | 1.35 ± 0.57 | 1.27 ± 0.55 | 1.48 ± 0.58 | −7.966 | <0.001 |
| Treatments, n (%) | |||||
| RRT | 212 (11.89) | 92 (8.08) | 120 (16.76) | 27.083 | <0.001 |
| MV | 1121 (62.87) | 619 (58.01) | 502 (70.11) | 26.868 | <0.001 |
| IABP | 263 (14.75) | 185 (17.34) | 78 (10.89) | 14.152 | <0.001 |
| Defibrillation | 79 (4.43) | 32 (3.00) | 47 (6.56) | 12.862 | <0.001 |
| Furosemide | 1045 (58.61) | 599 (56.14) | 446 (62.29) | 6.684 | 0.01 |
| Norepinephrine | 684 (38.36) | 310 (29.05) | 374 (52.23) | 97.375 | <0.001 |
| Dobutamine | 118 (6.62) | 49 (4.59) | 69 (9.64) | 17.643 | <0.001 |
| Comorbidities, n (%) | |||||
| Hypertension | 656 (36.79) | 427 (40.02) | 229 (31.98) | 11.897 | 0.001 |
| Diabetes | 721 (40.44) | 406 (38.05) | 315 (43.99) | 6.285 | 0.012 |
| Congestive heart failure | 1021 (57.26) | 572 (53.61) | 449 (62.71) | 14.503 | <0.001 |
| AF | 665 (37.30) | 346 (32.43) | 319 (44.55) | 26.939 | <0.001 |
| CKD | 562 (31.52) | 282 (26.43) | 280 (39.11) | 31.909 | <0.001 |
| Chronic pulmonary disease | 464 (26.02) | 243 (22.77) | 221 (30.87) | 14.573 | <0.001 |
| Malignant tumour | 190 (10.66) | 65 (6.09) | 125 (17.46) | 58.143 | <0.001 |
| Cerebrovascular disease | 296 (26.60) | 154 (14.43) | 142 (19.83) | 9.02 | 0.003 |
| Rheumatic disease | 77 (4.32) | 48 (4.50) | 29 (4.05) | 0.208 | 0.648 |
| CA | 151 (8.47) | 54 (5.06) | 97 (13.55) | 39.810 | <0.001 |
| Cardiogenic shock | 372 (20.86) | 175 (16.40) | 197 (27.51) | 32.049 | <0.001 |
| VF | 103 (5.78) | 56 (5.25) | 47 (6.56) | 1.363 | 0.243 |
| AKI | 1261 (70.72) | 684 (64.10) | 577 (64.10) | 56.214 | <0.001 |
| Acute pancreatitis | 30 (1.68) | 17 (1.59) | 13 (1.82) | 0.128 | 0.720 |
| ICU LOS (days) | 3.12 (1.92, 5.79) | 2.92 (1.87, 5.25) | 3.65 (2.05, 6.59) | −4.289 | <0.001 |
ACAG, albumin‐corrected anion gap; AF, atrial fibrillation; AG, anion gap; AKI, acute kidney disease; ALT, alanine aminotransferase; AST, aspartate aminotransferase; BUN, blood urea nitrogen; CA, cardiac arrest; CKD, chronic kidney disease; IABP, intra‐aortic balloon counterpulsation; ICU, intensive care unit; LOS, length of stay; MV, mechanical ventilation; PT, prothrombin time; RBC, red blood cell; RDW, red blood cell distribution width; RRT, renal replacement therapy; SOFA, Sequential Organ Failure Assessment; VF, ventricular fibrillation; WBC, white blood cell.
Association between albumin‐corrected anion gap and all‐cause mortality
As shown in Table 2 , the 30, 90, and 360 day all‐cause mortality of the included patients was 24.34%, 30.83%, and 40.16%, respectively. Elevated ACAG (>20 mmol/L) was significantly associated with 30 day mortality (35.57%, χ 2 = 97.114, P < 0.001) and as was ACAG with 90 and 360 day mortality (42.27%, χ 2 = 97.631, P < 0.001; 52.66%, χ 2 = 92.248, P < 0.001).
Table 2.
All‐cause mortality in patients with AMI between the two groups
| Group | 30 day mortality | χ 2 | P value | 90 day mortality | χ 2 | P value | 360 day mortality | χ 2 | P value | |||
|---|---|---|---|---|---|---|---|---|---|---|---|---|
|
Survivors (n = 1349) |
Non‐survivors (n = 434) |
Survivors (n = 1244) |
Non‐survivors (n = 539) |
Survivors (n = 1067) |
Non‐survivors (n = 716) |
|||||||
| Normal ACAG | 840 (84.59) | 153 (15.41) | 788 (79.36) | 205 (20.64) | 693 (69.79) | 300 (30.21) | ||||||
| High ACAG | 509 (64.43) | 281 (35.57) | 97.114 | <0.001 | 456 (57.72) | 334 (42.27) | 97.631 | <0.001 | 374 (47.34) | 416 (52.66) | 92.248 | <0.001 |
ACAG, albumin‐corrected anion gap; AMI, acute myocardial infarction.
Taking the 360 day prognosis as the dependent variable and the 41 variables in Table 1 as the independent variables, LASSO regression analysis with cross‐validation method was performed, and λ = 0.020 was calculated. Consequently, 17 variables were screened out, including age, SOFA score, ACAG, RBC, RDW, BUN, PT, serum potassium, CA, cardiogenic shock, AKI, cerebrovascular disease, chronic pulmonary disease, malignant tumour, IABP, norepinephrine, and defibrillation, as shown in Figure 2 .
Figure 2.
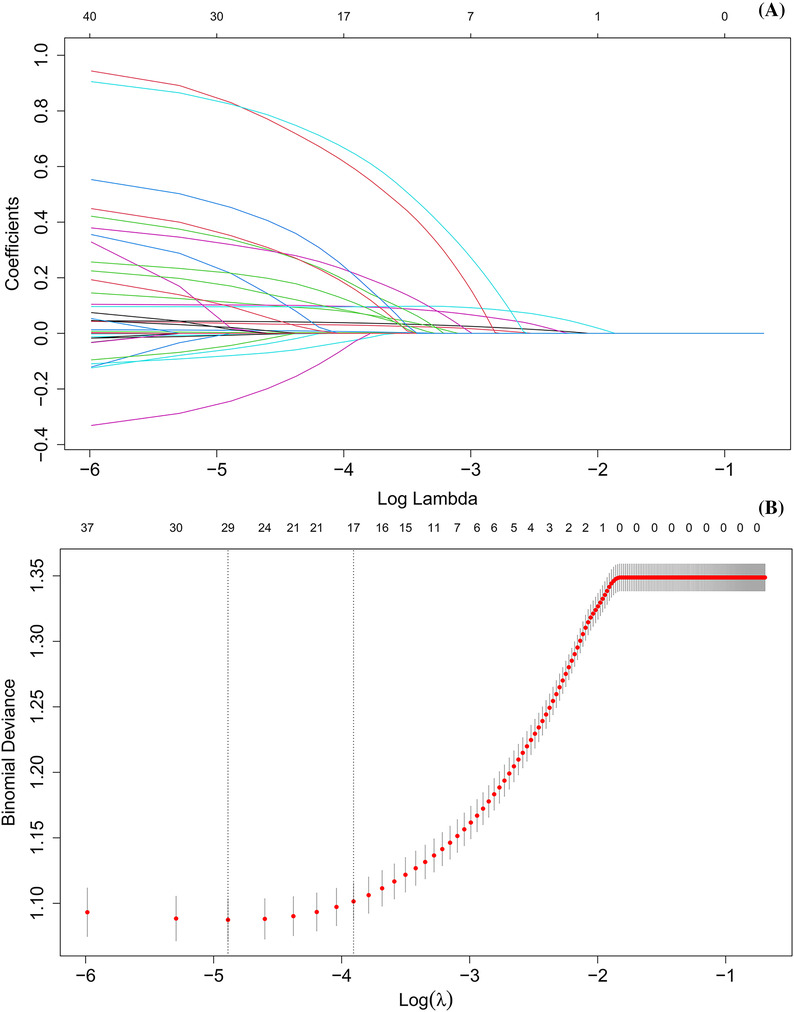
(A) Selection process of prognostic variables of acute myocardial infarction by least absolute shrinkage and selection operator regression. (B) Selection process of the value of lambda by cross‐validation.
The 17 variables obtained above were included in the Cox regression analysis, and the results are shown in Table 3 . Model 1 showed that, compared with the normal ACAG group, the HR (95% CI) of 360 day all‐cause mortality for the high ACAG group was 2.133 (1.838–2.475), indicating that ACAG > 20 mmol/L was associated with increased 360 day all‐cause mortality in patients with AMI. Meanwhile, Model 3 adjusted for multiple confounding factors, including the incidence of CA, cardiogenic shock, AKI, cerebrovascular disease, chronic pulmonary disease, and malignant tumour and the proportion of patients receiving IABP, norepinephrine, and defibrillation. The Cox proportional hazard analysis showed that the HR (95% CI) of 360 day all‐cause mortality was 1.423 (1.206–1.678) and concluded that the elevated ACAG (>20 mmol/L) was an independent risk factor of increased 360 day all‐cause mortality in patients with AMI. The relationship between ACAG and 30 and 90 day mortality was also consistent.
Table 3.
Cox proportional hazard analysis of all‐cause mortality in patients with AMI between the two groups
| Variable | Model 1 | Model 2 | Model 3 | ||||||
|---|---|---|---|---|---|---|---|---|---|
| HR | 95% CI | P value | HR | 95% CI | P value | HR | 95% CI | P value | |
| 30 day mortality | |||||||||
| ACAG 12–20 | 1 | 1 | 1 | ||||||
| ACAG > 20 | 2.601 | 2.136–3.168 | <0.001 | 1.626 | 1.308–2.022 | <0.001 | 1.593 | 1.282–1.980 | <0.001 |
| 90 day mortality | |||||||||
| ACAG 12–20 | 1 | 1 | 1.272–1.872 | 1 | |||||
| ACAG > 20 | 2.384 | 2.003–2.837 | <0.001 | 1.543 | <0.001 | 1.494 | 1.233–1.812 | <0.001 | |
| 360 day mortality | |||||||||
| ACAG 12–20 | 1 | 1 | 1 | ||||||
| ACAG > 20 | 2.133 | 1.838–2.475 | <0.001 | 1.472 | 1.248–1.737 | <0.001 | 1.423 | 1.206–1.678 | <0.001 |
ACAG, albumin‐corrected anion gap; AKI, acute kidney disease; AMI, acute myocardial infarction; BUN, blood urea nitrogen; CA, cardiac arrest; CI, confidence interval; HR, hazard ratio; IABP, intra‐aortic balloon counterpulsation; PT, prothrombin time; RBC, red blood cell; RDW, red blood cell distribution width; SOFA, Sequential Organ Failure Assessment.
Model 1: no covariates were adjusted. Model 2: adjusted for age, BUN, potassium, RBC, RDW, PT, and SOFA score. Model 3: based on Model 2 and adjusted for the incidence of CA, cardiogenic shock, AKI, cerebrovascular disease, chronic pulmonary disease, and malignant tumour and the proportion of receiving IABP, norepinephrine, and defibrillation.
Non‐linear association between albumin‐corrected anion gap and all‐cause mortality
RCS analyses further showed that there was a non‐linear trend relationship between ACAG and the risk of all‐cause mortality at 30 and 360 days in patients with AMI (χ 2 = 10.750, P = 0.013; χ 2 = 13.960, P = 0.003). With the increase of ACAG, the risk of all‐cause mortality of those patients during the 30 and 360 day hospitalization also increased, and the increase rate gradually slowed down and became relatively stable in a high level, as shown in Figure 3 . The correlation between ACAG and 90 day mortality had similar results (χ 2 = 15.18, P = 0.001) as shown in Supporting Information, Figure S1 .
Figure 3.

Restricted cubic spline analysis of the relationship between albumin‐corrected anion gap (ACAG) and the risk of (A) 30 and (B) 360 day all‐cause mortality in patients with acute myocardial infarction. CI, confidence interval; HR, hazard ratio.
Kaplan–Meier survival curve
Kaplan–Meier survival curves in Figure 4 showed that compared with the normal ACAG group, the 30 and 360 day cumulative survival rate of patients with AMI was significantly lower (log‐rank test, χ 2 = 98.880, P < 0.001; χ 2 = 105.440, P < 0.001) in the high ACAG group. Also, the result of 90 day Kaplan–Meier survival analysis was also similar (χ 2 = 103.010, P < 0.001), as shown in Supporting Information, Figure S2 .
Figure 4.

Kaplan–Meier survival curve of (A) 30 and (B) 360 day cumulative survival rate for the normal and high albumin‐corrected anion gap (ACAG) groups.
Receiver operating characteristic curve analysis
ROC curve analysis showed that the area under the curve (AUC) of ACAG was 0.651, with a sensitivity of 0.528 and a specificity of 0.631. In comparison, for AG, the AUC was 0.609, with a sensitivity of 0.566 and a specificity of 0.671. The results indicated that ACAG had a higher predictive value for 360 day mortality compared with AG. When combined with SOFA score, which was frequently used in ICU to assess the prognosis, the predictive value of ACAG for 360 day mortality was better, with an AUC of 0.699, as shown in Supporting Information, Figure S3 and Table S2 .
Sensitivity analysis and subgroup analysis
For the purpose of certifying the stability of the results, we conducted two sensitivity analyses. First, we excluded patients with NSTEMI (n = 488), and finally, 1295 patients were enrolled. Meanwhile, in order to exclude the interference from a previous MI diagnosis, we excluded 209 patients, and 1574 patients were included. The results were all statistically significant through the sensitivity analyses, suggesting the stability of our results, as shown in Supporting Information, Tables S3 and S4 .
In addition, the subgroup analysis in Figure 5 further tested the stability of the results, showing that there was an interaction between congestive heart failure, RRT, and ACAG level on 360 day all‐cause mortality (P = 0.045 and P = 0.003 for interaction, respectively). In subgroups of not receiving RRT or with congestive heart failure, elevated ACAG was associated with worse prognosis (all P < 0.05 for interaction). No significant interactions were observed in other subgroups (P for interaction >0.05).
Figure 5.

The subgroup analysis between albumin‐corrected anion gap and 360 day all‐cause mortality. CI, confidence interval; HR, hazard ratio; IABP, intra‐aortic balloon counterpulsation.
Discussion
This study found that serum ACAG was higher in the survival group than in the non‐survival group. Elevated ACAG (>20 mmol/L) was significantly associated with 30, 90, and 360 day mortality. Cox regression analysis showed that elevated ACAG (>20 mmol/L) was an independent risk factor of increased 30, 90, and 360 day all‐cause mortality in patients with AMI. RCS analysis further suggested that there was a non‐linear trend relationship between ACAG and the risk of all‐cause mortality at 360 days in patients with AMI, and the correlation between ACAG and 30 and 90 day mortality had similar results. Kaplan–Meier survival analysis drawn the conclusion that, compared with the normal ACAG group, the 30, 90, and 360 day cumulative survival rates of patients with AMI in the high ACAG group were significantly lower. ROC curve analyses showed that ACAG had a higher predictive value for 360 day mortality compared with AG. When combined with the SOFA score, the predictive performance for 360 day mortality was even better. Sensitivity analysis and subgroup analysis further confirmed the stability of the results of this study. Therefore, more attention should be paid to the AMI patients with high ACAG at ICU admission.
Critically ill patients with AMI were typically accompanied by anaerobic cellular respiration and severe inflammatory reactions. Anaerobic respiration and the pentose phosphate pathway increase the concentration of lactate and carbon dioxide in the body, leading to acidosis and, in severe cases, even death. 23 Therefore, the search for indicators to early identify patients with AMI becomes particularly important. Many scholars have explored the risk factors for the prognosis of AMI.
Lactate is a compound produced during anaerobic metabolism, primarily in tissues when oxygen supply is limited or insufficient. Elevated levels of lactic acid, known as lactic acidosis, can be caused by various conditions such as sepsis, shock, tissue hypoxia, and certain medications. Lactate serves as a marker for tissue hypoxia and cellular stress, typically associated with poor oxygen delivery or utilization. It can provide information about the severity of underlying diseases and is used as a prognostic marker in critically ill patients. 24 However, lactate is currently used as a marker of acid accumulation and hypoperfusion in MI. It may be influenced by factors such as drugs, liver function, kidney function, and intense exercise.
AG is the difference between plasma anion concentration and cation concentration. It is used to evaluate acid–base balance and electrolyte disturbances. Furthermore, in comparison with traditional markers such as base excess, arterial blood pH, and lactate, AG is directly calculated from peripheral blood ions and is not affected by respiratory function. 25 As a serological biomarker, AG has been shown to be correlated with the prognosis of different diseases. Some researchers have proposed that elevated AG in critically ill patients with cardiogenic shock was found to be associated with a higher risk of 30, 90, and 365 day all‐cause mortality. 25 Chen et al. found that elevated AG was associated with an increased risk of in‐hospital mortality (HR 1.64, 95% CI 1.21–2.08, P < 0.001). 12 Meanwhile, studies have suggested that there was a correlation between AG and the prognosis of surgical patients. 26 , 27 Recently, a study conducted on unselected adult patients suggested that higher levels of serum AG were positively associated with all‐cause mortality. 28 Furthermore, an increase in serum AG levels is correlated with an increased risk of patient mortality. It seems that AG is a highly promising indicator. However, most ICU patients are commonly accompanied by hypoalbuminaemia. AG is susceptible to false‐negative results due to the influence of the charge carried by albumin. Therefore, some scholars have proposed that ACAG is more suitable for ICU patients. 15 Therefore, numerous researchers have conducted extensive studies on ACAG. As early as 2013, researchers discovered the ACAG parameter and began studying its potential, and finally, they found that ACAG could be easily obtained in emergency situations and served as a useful parameter for predicting the return of spontaneous circulation in patients with cardiopulmonary arrest. 29 Later, as research progresses, one study indicated that ACAG had the highest predictive value for in‐hospital mortality of intensive care patients with sepsis, which is better than albumin and AG. 16 Li et al. conducted a study on 344 patients with acute pancreatitis and found that higher ACAG was independently associated with higher in‐hospital mortality in patients with acute pancreatitis. 30 The study conducted by Zhong et al. on critically ill patients with AKI undergoing continuous RRT (CRRT) demonstrated a significant correlation between higher ACAG levels (>20 mmol/L) at the initiation of CRRT and all‐cause mortality in the ICU. 18 A recent study has indicated that elevated ACAG levels are associated with an increased risk of all‐cause mortality during hospitalization in patients with CA. It may serve as an independent risk factor for poor prognosis in those patients. 22 A study similar to our research got the conclusion that ACAG and 30 day all‐cause mortality had a non‐linear relationship, and ACAG had better predictive value in predicting 30 day all‐cause mortality of patients with AMI than the AG. 20 The final inclusion of this article encompassed 2160 eligible patients. The differences in the number of included individuals between our study and this article may be attributed to variations in data collection periods and methods for obtaining AG. Furthermore, in addition to investigating the impact of ACAG on short‐term mortality, our study also explored the relationship between ACAG and long‐term mortality. The results provided clinicians and nurses with evidence for early identification of high‐risk AMI patients with poor prognosis.
This study investigated, for the first time, the relationship between ACAG and the short‐term and long‐term prognosis in patients with AMI. The results of our study were reliable with a large sample size. Additionally, this study provided a reference value for ACAG, which could assist clinicians and nurses in identifying high‐risk patients. However, there are several limitations. This study was a retrospective analysis, and ACAG data were collected as single‐time measurements without dynamic tracking. Therefore, future prospective studies are needed to compensate for the limitations of this study.
Conclusions
In conclusion, elevated serum ACAG (≥20 mmol/L) is an independent risk factor for short‐term and long‐term mortality in critically ill patients with AMI, and it may assist clinicians and nurses identifying high‐risk patients.
Conflict of interest
None declared.
Funding
This work was supported by the Science and Technology Program of Huzhou (2022GY20).
Supporting information
Table S1. Baseline characteristics between the patients with ACAG and without ACAG.
Table S2. Information of ROC curves.
Table S3. Sensitivity analysis between the two groups excluding patients with non‐ST‐segment elevation myocardial infarction.
Table S4. Sensitivity analysis between the two groups excluding patients with old myocardial infarction.
Figure S1. RCS analysis of the relationship between ACAG and the risk of 90‐day all‐cause mortality in patients with AMI.
Figure S2. Kaplan–Meier survival curve of 90‐day cumulative survival rate for the normal and high ACAG groups.
Figure S3. ROC curves evaluating the predictive value of ACAG for 360‐day mortality.
Sheng, H. , Lu, J. , Zhong, L. , Hu, B. , Sun, X. , and Dong, H. (2024) The correlation between albumin‐corrected anion gap and prognosis in patients with acute myocardial infarction. ESC Heart Failure, 11: 826–836. 10.1002/ehf2.14639.
References
- 1. Anderson JL, Morrow DA. Acute myocardial infarction. N Engl J Med 2017;376:2053‐2064. doi: 10.1056/NEJMra1606915 [DOI] [PubMed] [Google Scholar]
- 2. Choi Y, Lee KY, Kim SH, Kim KA, Hwang BH, Choo EH, et al. Predictors for early cardiac death after discharge from successfully treated acute myocardial infarction. Front Med (Lausanne) 2023;10:1165400. doi: 10.3389/fmed.2023.1165400 [DOI] [PMC free article] [PubMed] [Google Scholar]
- 3. Dreyer RP, Arakaki A, Raparelli V, Murphy TE, Tsang SW, D'Onofrio G, et al. Young women with acute myocardial infarction: Risk prediction model for 1‐year hospital readmission. CJC Open 2023;5:335‐344. doi: 10.1016/j.cjco.2022.12.004 [DOI] [PMC free article] [PubMed] [Google Scholar]
- 4. Ismail SR, Mohammad MSF, Butterworth AS, Chowdhury R, Danesh J, di Angelantonio E, et al. Risk factors of secondary cardiovascular events in a multi‐ethnic Asian population with acute myocardial infarction: A retrospective cohort study from Malaysia. J Cardiovasc Dev Dis 2023;10:10. doi: 10.3390/jcdd10060250 [DOI] [PMC free article] [PubMed] [Google Scholar]
- 5. Benjamin EJ, Blaha MJ, Chiuve SE, Cushman M, das S, Deo R, et al. Heart disease and stroke statistics—2017 update: A report from the American Heart Association. Circulation 2017;135:e146‐e603. doi: 10.1161/CIR.0000000000000485 [DOI] [PMC free article] [PubMed] [Google Scholar]
- 6. Wang C, Pei YY, Ma YH, Ma XL, Liu ZW, Zhu JH, et al. Risk factors for acute kidney injury in patients with acute myocardial infarction. Chin Med J (Engl) 2019;132:1660‐1665. doi: 10.1097/CM9.0000000000000293 [DOI] [PMC free article] [PubMed] [Google Scholar]
- 7. Berezin AE, Berezin AA. Adverse cardiac remodelling after acute myocardial infarction: Old and new biomarkers. Dis Markers 2020;2020:1215802. doi: 10.1155/2020/1215802 [DOI] [PMC free article] [PubMed] [Google Scholar]
- 8. Chen Y, Chen S, Han Y, Xu Q, Zhao X. Neutrophil‐to‐lymphocyte ratio and platelet‐to‐lymphocyte ratio are important indicators for predicting in‐hospital death in elderly AMI patients. J Inflamm Res 2023;16:2051‐2061. doi: 10.2147/JIR.S411086 [DOI] [PMC free article] [PubMed] [Google Scholar]
- 9. McCord J, Aurora L, Lindahl B, Giannitsis E, Calle‐Muller C, Nowak R, et al. Symptoms predictive of acute myocardial infarction in the troponin era: Analysis from the TRAPID‐AMI study. Crit Pathw Cardiol 2019;18:10‐15. doi: 10.1097/HPC.0000000000000163 [DOI] [PubMed] [Google Scholar]
- 10. Lim XC, Yatim S, Chong SY, et al. Plasma tissue factor coagulation activity in post‐acute myocardial infarction patients. Front Endocrinol (Lausanne) 2022;13:1008329. doi: 10.3389/fendo.2022.1008329 [DOI] [PMC free article] [PubMed] [Google Scholar]
- 11. Lin XL, Sun HX, Li FQ, Zhao JY, Zhao DH, Liu JH, et al. Admission high‐sensitivity C‐reactive protein levels improve the Grace risk score prediction on in‐hospital outcomes in acute myocardial infarction patients. Clin Cardiol 2022;45:282‐290. doi: 10.1002/clc.23749 [DOI] [PMC free article] [PubMed] [Google Scholar]
- 12. Chen J, Dai C, Yang Y, Wang Y, Zeng R, Li B, Liu Q The association between anion gap and in‐hospital mortality of post‐cardiac arrest patients: A retrospective study. Sci Rep 2022; 12:7405. 1 10.1038/s41598-022-11081-3 [DOI] [PMC free article] [PubMed] [Google Scholar]
- 13. Chen Q, Chen Q, Li L, Lin X, Chang SI, Li Y, et al. Serum anion gap on admission predicts intensive care unit mortality in patients with aortic aneurysm. Exp Ther Med 2018;16:1766‐1777. doi: 10.3892/etm.2018.6391 [DOI] [PMC free article] [PubMed] [Google Scholar]
- 14. Gong F, Zhou Q, Gui C, Huang S, Qin Z. The relationship between the serum anion gap and all‐cause mortality in acute pancreatitis: An analysis of the MIMIC‐III database. Int J Gen Med 2021;14:531‐538. doi: 10.2147/IJGM.S293340 [DOI] [PMC free article] [PubMed] [Google Scholar]
- 15. Hatherill M, Waggie Z, Purves L, Reynolds L, Argent A. Correction of the anion gap for albumin in order to detect occult tissue anions in shock. Arch Dis Child 2002;87:526‐529. doi: 10.1136/adc.87.6.526 [DOI] [PMC free article] [PubMed] [Google Scholar]
- 16. Hu T, Zhang Z, Jiang Y. Albumin corrected anion gap for predicting in‐hospital mortality among intensive care patients with sepsis: A retrospective propensity score matching analysis. Clin Chim Acta 2021;521:272‐277. doi: 10.1016/j.cca.2021.07.021 [DOI] [PubMed] [Google Scholar]
- 17. Hu B, Cao J, Hu Y, Qin Z, Wang J. The association between serum anion gap and all‐cause mortality in disseminated intravascular coagulation patients: A retrospective analysis. Int J Gen Med 2021;14:4535‐4544. doi: 10.2147/IJGM.S318334 [DOI] [PMC free article] [PubMed] [Google Scholar]
- 18. Zhong L, Xie B, Ji XW, Yang XH. The association between albumin corrected anion gap and ICU mortality in acute kidney injury patients requiring continuous renal replacement therapy. Intern Emerg Med 2022;17:2315‐2322. doi: 10.1007/s11739-022-03093-8 [DOI] [PMC free article] [PubMed] [Google Scholar]
- 19. Goldberger AL, Amaral LA, Glass L, Hausdorff JM, Ivanov PC, Mark RG, et al. PhysioBank, PhysioToolkit, and PhysioNet: components of a new research resource for complex physiologic signals. Circulation 2000;101:E215‐20. doi: 10.1161/01.CIR.101.23.e215Circulation [DOI] [PubMed] [Google Scholar]
- 20. Jian L, Zhang Z, Zhou Q, Duan X, Xu H, Ge L. Association between albumin corrected anion gap and 30‐day all‐cause mortality of critically ill patients with acute myocardial infarction: A retrospective analysis based on the MIMIC‐IV database. BMC Cardiovasc Disord 2023;23:211. doi: 10.1186/s12872-023-03200-3 [DOI] [PMC free article] [PubMed] [Google Scholar]
- 21. He X, Liao X, Xie Z, Jiang C, Kang Y. Albumin corrected anion gap is an independent risk factor for long‐term mortality of patients with sepsis. Zhonghua Wei Zhong Bing Ji Jiu Yi Xue 2017;29:117‐121. doi: 10.3760/cma.j.issn.2095-4352.2017.02.005 [DOI] [PubMed] [Google Scholar]
- 22. Hu B, Zhong L, Yuan M, Min J, Ye L, Lu J, et al. Elevated albumin corrected anion gap is associated with poor in‐hospital prognosis in patients with cardiac arrest: A retrospective study based on MIMIC‐IV database. Front Cardiovasc Med 2023;10:1099003. doi: 10.3389/fcvm.2023.1099003 [DOI] [PMC free article] [PubMed] [Google Scholar]
- 23. Nagasaka A, Mogi C, Ono H, Nishi T, Horii Y, Ohba Y, et al. The proton‐sensing G protein‐coupled receptor T‐cell death‐associated gene 8 (TDAG8) shows cardioprotective effects against myocardial infarction. Sci Rep 2017;7:7812. doi: 10.1038/s41598-017-07573-2 [DOI] [PMC free article] [PubMed] [Google Scholar]
- 24. Seker YC, Bozan O, Sam E, Topacoglu H, Kalkan A. The role of the serum lactate level at the first admission to the emergency department in predicting mortality. Am J Emerg Med 2021;45:495‐500. doi: 10.1016/j.ajem.2020.09.088 [DOI] [PubMed] [Google Scholar]
- 25. Zhang T, Wang J, Li X. Association between anion gap and mortality in critically ill patients with cardiogenic shock. Int J Gen Med 2021;14:4765‐4773. doi: 10.2147/IJGM.S329150 [DOI] [PMC free article] [PubMed] [Google Scholar]
- 26. Xie K, Zheng C, Wang GM, Diao YF, Luo C, Wang E, et al. Association between delta anion gap and hospital mortality for patients in cardiothoracic surgery recovery unit: A retrospective cohort study. BMC Surg 2022;22:186. doi: 10.1186/s12893-022-01625-9 [DOI] [PMC free article] [PubMed] [Google Scholar]
- 27. Zhao D, Li Y, Huang J, Zheng Z, Zhang XX, Liu Y, et al. Association of serum anion gap and risk of long‐term mortality in patients following coronary artery bypass grafting: A propensity score matching study. J Card Surg 2022;37:4906‐4918. doi: 10.1111/jocs.17167 [DOI] [PubMed] [Google Scholar]
- 28. Ji X, Peng S. The association between serum anion gap and all‐cause mortality of unselected adult patients: A retrospective cohort study of >20,000 patients. J Clin Lab Anal 2023;37:e24818. doi: 10.1002/jcla.24818 [DOI] [PMC free article] [PubMed] [Google Scholar]
- 29. Hagiwara S, Oshima K, Furukawa K, Nakamura T, Ohyama Y, Tamura JI. The significance of albumin corrected anion gap in patients with cardiopulmonary arrest. Ann Thorac Cardiovasc Surg 2013;19:283‐288. doi: 10.5761/atcs.oa.12.01942 [DOI] [PubMed] [Google Scholar]
- 30. Li P, Shi L, Yan X, Wang L, Wan D, Zhang Z, et al. Albumin corrected anion gap and the risk of in‐hospital mortality in patients with acute pancreatitis: A retrospective cohort study. J Inflamm Res 2023;16:2415‐2422. doi: 10.2147/JIR.S412860 [DOI] [PMC free article] [PubMed] [Google Scholar]
Associated Data
This section collects any data citations, data availability statements, or supplementary materials included in this article.
Supplementary Materials
Table S1. Baseline characteristics between the patients with ACAG and without ACAG.
Table S2. Information of ROC curves.
Table S3. Sensitivity analysis between the two groups excluding patients with non‐ST‐segment elevation myocardial infarction.
Table S4. Sensitivity analysis between the two groups excluding patients with old myocardial infarction.
Figure S1. RCS analysis of the relationship between ACAG and the risk of 90‐day all‐cause mortality in patients with AMI.
Figure S2. Kaplan–Meier survival curve of 90‐day cumulative survival rate for the normal and high ACAG groups.
Figure S3. ROC curves evaluating the predictive value of ACAG for 360‐day mortality.