

Abstract
Problem/Condition:
In 2009, before passage of the 2010 Patient Protection and Affordable Care Act (ACA), approximately 20% of women aged 18–64 years had no health insurance coverage. In addition, many women experienced transitions in coverage around the time of pregnancy. Having no health insurance coverage or experiencing gaps or shifts in coverage can be a barrier to receiving preventive health services and treatment for health problems that could affect pregnancy and newborn health. With the passage of ACA, women who were previously uninsured or had insurance that provided inadequate coverage might have better access to health services and better coverage, including additional preventive services with no cost sharing. Because certain elements of ACA (e.g., no lifetime dollar limits, dependent coverage to age 26, and provision of preventive services without cost sharing) were implemented as early as September 2010, data from 2009 can be used as a baseline to measure the incremental impact of ACA on the continuity of health care coverage for women around the time of pregnancy.
Reporting Period Covered:
2009.
Description of System:
The Pregnancy Risk Assessment Monitoring System (PRAMS) is an ongoing state- and population-based surveillance system designed to monitor selected maternal behaviors and experiences that occur before, during, and shortly after pregnancy among women who deliver live-born infants in selected U.S. states and New York City, New York. PRAMS uses mixed-mode data collection, in which up to three self-administered surveys are mailed to a sample of mothers, and those who do not respond are contacted for telephone interviews. Self-reported survey data are linked to birth certificate data and weighted for sample design, nonresponse, and noncoverage. Annual PRAMS data sets are created and used to produce statewide estimates of preconception and perinatal health behaviors and experiences in selected states and New York City.
This report summarizes data from 29 states that conducted PRAMS in 2009, before the passage of ACA, and achieved an overall weighted response rate of ≥65%. Data on the prevalence of health insurance coverage stability (stable coverage, unstable coverage, and uninsured) across three time periods (the month before pregnancy, during pregnancy, and at the time of delivery) are reported by state and selected maternal characteristics. Women with stable coverage had the same type of health insurance (private or Medicaid) for all three time periods. Women with unstable coverage experienced a change in health insurance coverage between any of the three time periods. This includes movement from having no insurance coverage to gaining coverage, movement from one type of coverage to another, and loss of coverage. Women in the uninsured group had no insurance coverage during any of the three time periods. Estimates for health insurance stability across the three time periods and estimates of coverage during each time period are presented by state. Patterns of movement between the different types of health insurance coverage among women with unstable coverage are described by state and selected maternal characteristics.
Results:
In 2009, 30.1% of women who had a live birth experienced changes in health insurance coverage in the period between the month before pregnancy and the time of delivery, either because they lacked coverage at some point or because they moved between different types of coverage. Most women had stable coverage across the three time periods, reporting either private coverage (52.8%) or Medicaid coverage (16.1%) throughout. A small percentage of women (1.1%) reported having no health insurance coverage at any point.
Overall, Medicaid coverage increased from 16.6% in the month before pregnancy to 43.9% at delivery. Private coverage decreased from 59.9% in the month before pregnancy to 54.6% at delivery. The percentage of women who were uninsured decreased from 23.4% in the month before pregnancy to 1.5% at the time of delivery.
Among those who experienced changes in coverage, 74.4% reported having no insurance the month before pregnancy, 23.9% reported having private insurance, and 1.8% reported having Medicaid. Among those who started out uninsured before pregnancy, 70.2% reported Medicaid coverage, and 4.1% reported private coverage at the time of delivery. Among those who started out with private coverage, 21.3% reported Medicaid coverage at delivery, and 1.4% reported being uninsured. As a result of these transitions in health insurance coverage, 92.4% of all women who experienced a change in health insurance around the time of pregnancy reported Medicaid coverage at delivery. No women with unstable coverage who started out without insurance in the month before pregnancy reported being uninsured at the time of delivery.
Women who reported unstable coverage were more likely to be young (aged <35 years), be a minority (black, Hispanic, or American Indian/Alaska Native), have a high school education or less, be unmarried, have incomes ≤200% of the federal poverty level (FPL), or have an unintended pregnancy compared with women with stable private coverage. Compared with women with stable Medicaid coverage, women with unstable coverage were more likely to be Hispanic but less likely to be teenagers (aged ≤19 years), be black, have a high school education or less, have incomes ≤200% of the FPL, or have an unintended pregnancy. Women with unstable coverage were more likely than women in either stable coverage group (private or Medicaid) to report entering prenatal care after the first trimester.
Interpretation:
In 2009, nearly one third of women reported lacking health insurance or transitioning between types of health insurance coverage around the time of pregnancy. The majority of women who changed health insurance status obtained coverage for prenatal care, delivery, or both through Medicaid. Health insurance coverage during pregnancy can help facilitate access to health care and allow for the identification and treatment of health-related issues; however, prenatal coverage might be too late to prevent the consequences of preexisting conditions and preconception exposures that could affect maternal and infant health. Continuous access to health insurance and health care for women of reproductive age could improve maternal and infant health by providing the opportunity to manage or treat conditions that are present before and between pregnancies.
Public Health Action:
PRAMS data can be used to identify patterns of health insurance coverage among women around the time of pregnancy. Removing barriers to obtaining health insurance for women who lack coverage, particularly before pregnancy, could improve the health of women and their infants. The findings in this report can be used by public health professionals, policy analysts, and others to monitor health insurance coverage for women around the time of pregnancy. In particular, 2009 state-specific data can serve as baseline information to assess and monitor changes in health insurance coverage since the passage of ACA.
Introduction
In 2009, before passage of the Patient Protection and Affordable Care Act (ACA), approximately 20% of women aged 18–64 years the United States did not have health insurance (1). Some women in the United States have faced challenges obtaining or maintaining health insurance for numerous reasons, including being dependents on the employer plans of others, being employed part time, and having difficulties purchasing insurance in the individual market because of high premiums or restrictions related to health conditions (e.g., pregnancy or chronic medical problems) (2,3). Young women, minority women, and low-income women are among the groups most likely to lack health insurance (4–8).
Lack of health insurance is associated with delaying or forgoing preventive health services and other medical care, particularly among young adults and racial/ethnic minorities (9,10). Delays in accessing preventive health services and needed treatment services can lead to issues as serious as disproportionately high morbidity and mortality rates among the uninsured for certain types of cancer, chronic diseases, or other conditions (10–13). For women of reproductive age, lack of health insurance, either sustained or temporary, can be a barrier to receiving regular health care, including preventive services and might limit opportunities to identify, manage, or treat health conditions that put women at risk for poor maternal and infant outcomes during pregnancy (14). For example, women with certain chronic conditions (e.g., diabetes, hypertension, obesity, thyroid problems, and metabolic and endocrine syndromes) and infectious diseases (e.g., sexually transmitted diseases, including HIV) can have poor birth outcomes if the conditions are unidentified or unmanaged (14–21).
The majority of pregnant women in the United States attend some prenatal care visits (22–24). Women who have chronic health conditions or are at risk for pregnancy complications might have frequent contact with health care professionals during pregnancy (25,26). Therefore, pregnancy provides an opportunity for a woman to engage with health care systems, obtain care that can identify health problems, and receive any needed services to improve both maternal and infant health. Once pregnant, many low-income women who might have been uninsured become eligible for Medicaid, the major public funder of prenatal care and delivery services for women in the United States (27,28). Medicaid also pays for the delivery of infants to women who might not have been eligible for prenatal care through Medicaid but who receive emergency coverage at the time of delivery. However, for many states without Medicaid waivers in place, Medicaid coverage ends 60 days after delivery. This causes many low-income women to become uninsured again, leading to a cycle in which they move in and out of insurance coverage, a process called churning (29). Lack of insurance in the postpartum period, which might be the interconception period for women who become pregnant again, can present another barrier to achieving optimal health before pregnancy and might lead to missed opportunities to prevent poor infant outcomes, especially for women who experienced previous pregnancy complications (14).
Churning (29–34) tends to occur at transition points defined by insurance policies (private or public), such as reaching adulthood and no longer being covered by a parent’s insurance plan or getting married or divorced and obtaining or losing insurance coverage under a spouse’s plan. Churning also occurs when employment status changes and persons gain or lose coverage from an employer; when health status changes, such as when a person experiences a new disability and becomes eligible for Medicaid; or when persons reach retirement age and qualify for Medicare (10,13,32–34). Women in particular have been vulnerable to churning between different types of insurance coverage (2,3,35,36).
Ensuring comprehensive health insurance coverage and quality care for all women of reproductive age is critical to improving women’s health and infant birth outcomes. The widely varying nature of health care coverage for women in the United States has been well documented (2,3,10,13,33). CDC recommendations to improve preconception health and health care emphasize the need for women to have access to health care (14). In particular, around the time of pregnancy, women’s health could be improved by managing chronic conditions and providing counseling on prescription drug exposures and folic acid use (14). In addition, ACA includes provisions aimed at improving the quality of care, as well as at increasing the number of women with insurance coverage of higher quality and fewer restrictions than that previously available (37–40). In response, states have been implementing changes in health insurance coverage in different ways following passage of ACA (41). This report summarizes 2009 data from the Pregnancy Risk Assessment Monitoring System (PRAMS) (42) regarding patterns of health insurance coverage around the time of pregnancy among women with live-born infants. Because the state-specific data were collected before the implementation of ACA, the findings in this report can be used by public health professionals, policy analysts, and others as a baseline to monitor and compare health insurance coverage trends in this population after the passage of ACA.
Methods
To assess patterns of health insurance coverage around the time of pregnancy among women with live-born infants, CDC analyzed 2009 weighted PRAMS data from 29 states. Respondents were asked whether they had any health insurance plan (referred to interchangeably as health insurance coverage, insurance coverage, or insurance in this report) during three different periods asked about on the PRAMS survey (Box). First, prevalence estimates for health insurance stability were calculated overall, as well as by state. Overall and state prevalence estimates also are presented for health insurance coverage during each time period. Second, the characteristics of the women experiencing changes in coverage around the time of pregnancy are described. Finally, patterns of coverage among women who experienced shifts in coverage are presented.
BOX. Pregnancy Risk Assessment Monitoring System insurance questions, 2009 (phase 6).
Questions
During the month before you got pregnant with your new baby, were you covered by any of these health insurance plans? Check all that apply.
Did any of these health insurance plans help you pay for your prenatal care? Check all that apply.
Did any of these health insurance plans help you pay for the delivery of your new baby? Check all that apply.
Response Options for All Three Questions
Health insurance from your job or the job of your husband, partner, or parents
Health insurance that you or someone else paid for (not from a job)
Medicaid (or state Medicaid name)
TRICARE or other military health care
State-specific option (e.g., Indian Health Service or tribal)
State-specific option (State name for indigent care)
State-specific option (State Children’s Health Insurance Plan or Children’s Health Insurance Plan program name)
Other sources: Please tell us.
I did not have any health insurance before I got pregnant/to help pay for my prenatal care/to help pay for my delivery.
Project Description
PRAMS, initiated in 1987, is an ongoing state- and population-based surveillance system designed to monitor selected self-reported maternal behaviors and experiences that occur before, during, and after pregnancy among women who deliver a live-born infant. The PRAMS project is administered by CDC through a cooperative agreement with state health departments. Collectively, PRAMS data represent approximately 78% of all live births in the United States (Figure). Additional details about the PRAMS methods have been described elsewhere (42).
FIGURE.
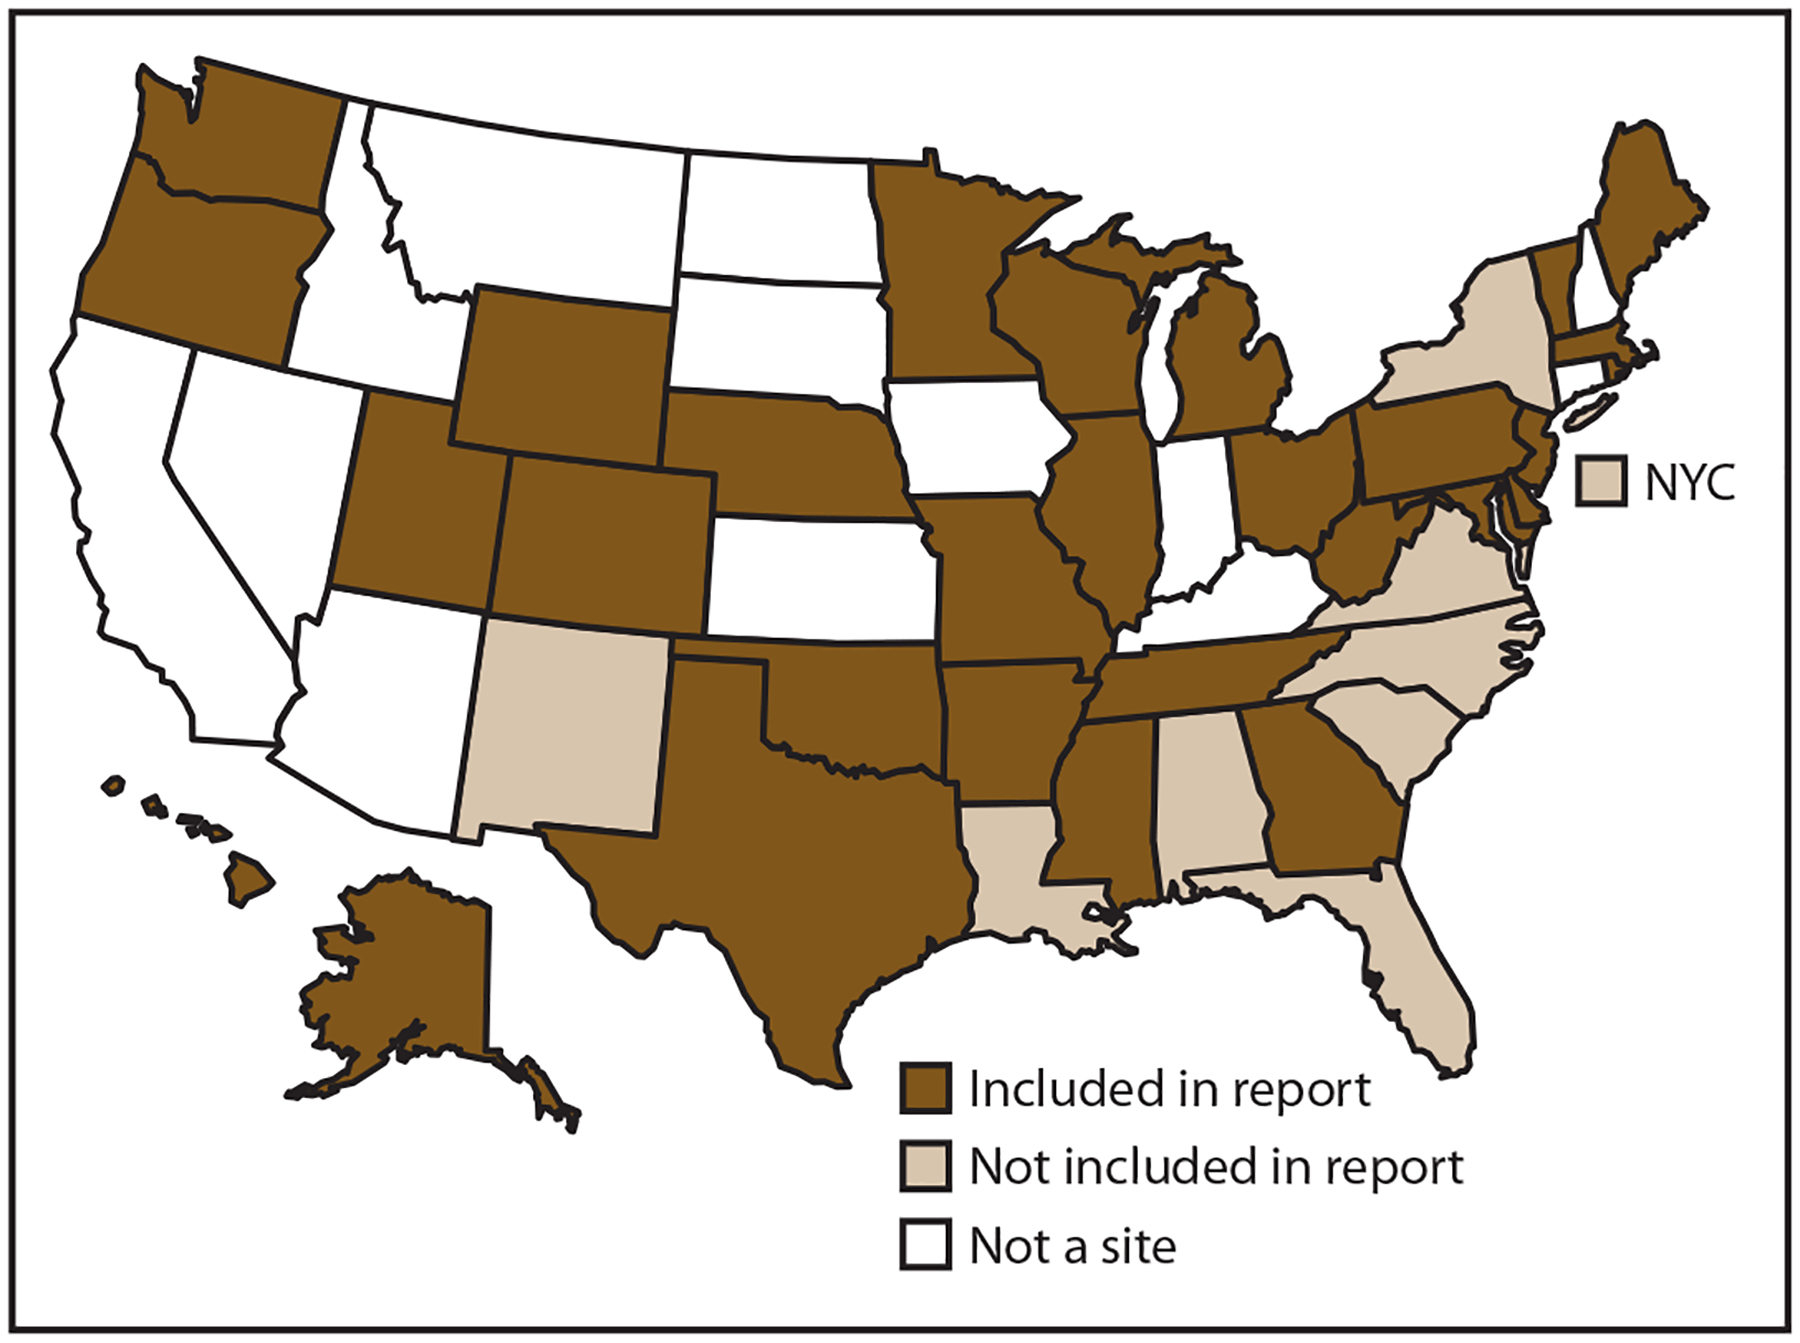
Pregnancy Risk Assessment Monitoring System sites, 2009
Data Collection
Using a standardized PRAMS data collection method, all participating health departments select, from birth certificate records, a monthly stratified random sample of 75–300 women who recently gave birth to a live infant. PRAMS has no maternal age restriction; women of all ages are eligible for sampling. PRAMS uses mixed-mode data collection, in which up to three self-administered surveys are mailed to mothers in the sample, and those who do not respond receive as many as 15 follow-up phone call attempts to complete a telephone interview. The first survey is usually mailed 2–3 months after the delivery of a live infant to allow for collection of information about postpartum maternal and infant experiences. To minimize recall bias, efforts to contact women end at 9 months postpartum. Survey data are linked to selected birth certificate data and weighted for sample design, nonresponse, and noncoverage.
This report includes PRAMS data from 29 states that collected data in 2009 and achieved a weighted response rate of at least 65%: Alaska, Arkansas, Colorado, Delaware, Georgia, Hawaii, Illinois, Maine, Maryland, Massachusetts, Michigan, Minnesota, Mississippi, Missouri, Nebraska, New Jersey, Ohio, Oklahoma, Oregon, Pennsylvania, Rhode Island, Tennessee, Texas, Utah, Vermont, Washington, West Virginia, Wisconsin, and Wyoming. To minimize nonresponse bias, CDC PRAMS has established the minimum weighted response rate required for state data to be included in published results. This cut off is used to ensure reasonable representation of the population of interest. The weighted response rate indicates the proportion of women sampled who completed a survey, adjusted for sample design. PRAMS participating sites that did not meet the 65% response rate threshold in 2009 (eight states and New York City, New York) are not included in this analysis (Figure).
Data Analysis
The PRAMS questionnaire implemented in 2009 asked about health insurance coverage during three time periods: the month before pregnancy, during pregnancy for prenatal care, and at the time of delivery. The format of each question was the same for each time period assessed, and women were allowed to select multiple responses regarding their coverage in each period (Box) (43). Women self-reported their insurance coverage and determined what they considered to be the month before pregnancy, prenatal care, and delivery. Women who reported that they were enrolled in Medicaid or selected a state-named Medicaid program (e.g., RIte Care in Rhode Island) were categorized in the Medicaid group. Women who reported private insurance coverage for a given period alone or in combination with any other kind of insurance (including Medicaid), were categorized with the private insurance group (44). Women who reported TRICARE or other military insurance were included with the private insurance group. Similar to the classification used by the National Health Interview Survey (NHIS), women who reported only Indian Health Service (IHS) were included with the uninsured group (45). Alaska was an exception to this categorization because the IHS response option on the Alaska survey included the state-specific Alaska Native Health Service and Native regional health corporation programs. Women who responded to this option were considered to have coverage from a state-specific program.
The PRAMS survey in the 29 selected states in 2009 had 40,388 respondents. This report is restricted to women who provided a response to each of the three insurance questions. Women who left any of the three questions unanswered, as well as women who reported coverage only from a state-specific non-Medicaid program or only selected the “other” write-in response option, were excluded (n = 3,584; 8.9%). In addition, women who reported Medicaid coverage for prenatal care but no coverage for delivery were excluded, as were women who reported patterns of movement across the three time periods for which there were <10 respondents (n = 94; <1%). The final sample size was 36,710.
Maternal characteristics obtained from birth certificate included age, race/ethnicity, education level, marital status, parity, and place of infant birth (delivery location). Maternal race/ethnicity is presented as a combined variable categorized as non-Hispanic white, non-Hispanic black, American Indian or Alaska Native, non-Hispanic other, and Hispanic (of any race). (Non-Hispanic white, non-Hispanic black, and non-Hispanic other are referred to as white, black, and other, respectively, in this report.) Delivery location was categorized as a hospital if it was listed on the birth certificate as a hospital, birthing center, clinic, or doctor’s office. Federal poverty level (FPL) was calculated based on the 2009 standards (46) and categorized as ≤200% of the FPL and >200% of the FPL. The data on timing of entry into prenatal care and pregnancy intention were self-reported on the PRAMS questionnaire. Initiation of prenatal care was considered to be in the first trimester if the respondent reported her first prenatal visit during the first 3 months of pregnancy (or <13 weeks’ gestation). Pregnancy intention was classified as intended if the respondent reported she wanted to be pregnant then or sooner and was classified as unintended if she reported she wanted to be pregnant later or not at all.
All estimates in this report were calculated using weighted PRAMS data, whereas the sample size presented is unweighted. Estimates based on fewer than five persons are not presented. Insurance coverage was classified into four categories: stable private coverage, stable Medicaid coverage, changing or unstable coverage, and uninsured. The unstable category (n = 10,845) includes women who reported a change in health insurance coverage between any of three time periods (the month before pregnancy, during pregnancy, or at the time of delivery). This includes gaining or losing coverage or switching between types of coverage. Conversely, the stable groups (stable private, n = 19,073; stable Medicaid coverage, n = 6,448) were defined as having uninterrupted private insurance coverage or Medicaid coverage, respectively, across all three time periods. The uninsured group (n = 344) included those who had no health insurance across all three time periods.
Weighted data were pooled from 29 states; prevalence estimates and 95% confidence intervals (CIs) overall and by state were calculated for each of the four insurance categories, as were estimates for each of the three time periods. Patterns of movement between different types of health insurance coverage also are reported, with prevalence estimates and 95% CIs.
The patterns of movement between different types of insurance coverage among the subset of women who experienced unstable coverage was further examined. Prevalence estimates by state and selected maternal characteristics were calculated for movement between different types of coverage on the basis of reported insurance status before pregnancy and insurance status at delivery (e.g., no insurance before pregnancy to Medicaid at delivery or no insurance before pregnancy to private insurance at delivery). Multinomial logistic regression was used to assess the odds of having different insurance coverage status by selected maternal characteristics. In the modeling process, stepwise regression was used, controlling for age and race, with significance set at p<0.05. Adjusted odds ratios and associated CIs were calculated. All analyses were conducted using statistical software to account for the complex sampling design used by PRAMS (47).
Results
Health Insurance Coverage Stability Overall and by State
Aggregated data from 29 PRAMS states indicate that just over half of the women (52.8%) had private health insurance throughout the entire time period (stable private coverage), ranging from 69.5% in Minnesota to 31.6% in Mississippi. Overall, 16.1% of women had Medicaid coverage across all time periods (stable Medicaid coverage), with state-specific estimates ranging from 5.3% in Utah to 30.5% in Maine. Approximately one third of women with a recent live birth (30.1%) experienced unstable health insurance coverage around the time of pregnancy. The prevalence of having unstable insurance varied by state, ranging from 13.4% in Massachusetts to 47.7% in Mississippi. Only 1.1% of women had no insurance coverage at any point around the time of pregnancy; state-specific variation ranged from 0.3% in West Virginia to 2.9% in Wyoming (Table 1).
TABLE 1.
Prevalence of women with stable health insurance coverage, unstable health insurance coverage, or no health insurance coverage from the month before pregnancy to the time of delivery, by state — Pregnancy Risk Assessment Monitoring System, 29 states, 2009
| Stable coverage | |||||||||||||
|---|---|---|---|---|---|---|---|---|---|---|---|---|---|
| Private | Medicaid | Unstable coverage | Uninsured | ||||||||||
| State | Total* | No. | %† | (95% CI) | No. | % | (95% CI) | No. | % | (95% CI) | No. | % | (95% CI) |
| Total | 36,710 | 19,073 | 52.8 | (51.9–53.6) | 6,448 | 16.1 | (15.4–16.7) | 10,845 | 30.1 | (29.2–30.9) | 344 | 1.1 | (0.9–1.3) |
| Alaska | 1,025 | 558 | 57.2 | (53.6–60.7) | 166 | 15.1 | (12.6–17.6) | 280 | 25.6 | (22.4–28.8) | 21 | 2.2 | (1.1–3.3) |
| Arkansas | 1,009 | 392 | 43.1 | (39.0–47.2) | 149 | 13.6 | (10.7–16.5) | 445 | 41.1 | (37.0–45.1) | 23 | 2.3 | (1.2–3.3) |
| Colorado | 1,766 | 1,029 | 59.3 | (56.1–62.6) | 182 | 10.8 | (8.6–13.0) | 543 | 29.2 | (26.2–32.2) | 12 | 0.7 | (0.1–1.3) |
| Delaware | 944 | 540 | 56.5 | (53.3–59.8) | 231 | 25.2 | (22.3–28.0) | 165 | 17.3 | (14.8–19.8) | 8 | 1.0 | (0.3–1.6) |
| Georgia | 780 | 337 | 42.1 | (37.1–47.1) | 137 | 17.2 | (13.3–21.1) | 296 | 38.2 | (33.2–43.3) | 10 | 2.5 | (0.7–4.3) |
| Hawaii | 1,507 | 949 | 64.4 | (61.3–67.5) | 283 | 18.9 | (16.4–21.4) | 267 | 16.3 | (14.0–18.7) | 8 | 0.4 | (0.1–0.7) |
| Illinois | 1,480 | 730 | 47.6 | (44.9–50.3) | 322 | 23.2 | (20.9–25.6) | 419 | 28.5 | (26.0–31.0) | 9 | 0.6 | (0.2–1.1) |
| Maine | 1,042 | 530 | 50.0 | (46.5–53.6) | 303 | 30.5 | (27.2–33.9) | 203 | 19.0 | (16.2–21.8) | 6 | 0.4 | (0.0–0.8) |
| Maryland | 1,401 | 1,024 | 67.9 | (64.1–71.8) | 103 | 7.5 | (5.3–9.7) | 261 | 23.0 | (19.5–26.5) | 13 | 1.5 | (0.4–2.6) |
| Massachusetts | 1,242 | 699 | 62.8 | (59.3–66.2) | 363 | 23.8 | (20.9–26.7) | 179 | 13.4 | (10.9–16.0) | —§ | — | — |
| Michigan | 1,535 | 704 | 52.1 | (49.2–55.1) | 413 | 20.5 | (18.1–22.8) | 414 | 27.1 | (24.5–29.8) | — | — | — |
| Minnesota | 1,211 | 773 | 69.5 | (66.6–72.3) | 211 | 12.5 | (10.5–14.6) | 219 | 17.5 | (15.1–19.9) | 8 | 0.5 | (0.1–0.9) |
| Mississippi | 1,278 | 386 | 31.6 | (28.5–34.8) | 264 | 19.7 | (17.0–22.4) | 613 | 47.7 | (44.3–51.1) | 15 | 1.0 | (0.3–1.7) |
| Missouri | 1,319 | 696 | 51.8 | (48.6–55.1) | 161 | 12.8 | (10.5–15.0) | 443 | 34.1 | (31.0–37.2) | 19 | 1.3 | (0.6–1.9) |
| Nebraska | 1,736 | 850 | 57.1 | (54.6–59.7) | 250 | 10.2 | (8.7–11.6) | 627 | 32.2 | (29.7–34.7) | 9 | 0.5 | (0.1–0.8) |
| New Jersey | 1,275 | 843 | 67.9 | (65.3–70.5) | 197 | 14.3 | (12.2–16.3) | 230 | 17.4 | (15.2–19.6) | — | — | — |
| Ohio | 1,318 | 642 | 54.2 | (50.6–57.8) | 352 | 20.6 | (17.7–23.6) | 312 | 24.0 | (20.8–27.3) | 12 | 1.1 | (0.3–2.0) |
| Oklahoma | 1,988 | 846 | 40.5 | (36.9–44.1) | 271 | 14.6 | (11.8–17.4) | 849 | 43.7 | (40.0–47.4) | 22 | 1.2 | (0.4–2.0) |
| Oregon | 1,535 | 717 | 54.3 | (50.5–58.0) | 232 | 10.7 | (8.6–12.9) | 572 | 34.6 | (31.0–38.2) | 14 | 0.4 | (0.0–0.8) |
| Pennsylvania | 969 | 642 | 61.9 | (58.3–65.5) | 141 | 16.1 | (13.3–18.9) | 169 | 19.7 | (16.7–22.7) | 17 | 2.3 | (1.1–3.5) |
| Rhode Island | 1,210 | 665 | 55.2 | (52.0–58.4) | 240 | 20.2 | (17.5–22.9) | 304 | 24.5 | (21.7–27.3) | — | — | — |
| Tennessee | 654 | 284 | 44.2 | (39.2–49.2) | 184 | 25.3 | (20.9–29.7) | 182 | 30.0 | (25.3–34.6) | — | — | — |
| Texas | 1,315 | 603 | 44.4 | (41.3–47.5) | 157 | 11.7 | (9.5–13.9) | 540 | 42.8 | (39.5–46.1) | 15 | 1.1 | (0.5–1.8) |
| Utah | 1,501 | 940 | 68.1 | (65.7–70.5) | 93 | 5.3 | (4.1–6.5) | 440 | 24.9 | (22.6–27.1) | 28 | 1.7 | (1.0–2.4) |
| Vermont | 935 | 555 | 59.3 | (56.1–62.6) | 187 | 20.2 | (17.5–23.0) | 189 | 20.0 | (17.3–22.6) | — | — | — |
| Washington | 1,467 | 698 | 55.3 | (52.0–58.6) | 233 | 13.1 | (10.8–15.5) | 525 | 31.0 | (27.9–34.0) | 11 | 0.6 | (0.1–1.1) |
| West Virginia | 1,517 | 553 | 39.6 | (36.5–42.6) | 319 | 20.3 | (17.8–22.8) | 638 | 39.9 | (36.8–42.9) | 7 | 0.3 | (0.0–0.6) |
| Wisconsin | 899 | 464 | 60.3 | (56.8–63.9) | 215 | 19.0 | (16.1–21.8) | 210 | 19.3 | (16.4–22.2) | 10 | 1.4 | (0.4–2.4) |
| Wyoming | 852 | 424 | 52.6 | (48.6–56.5) | 89 | 8.5 | (6.4–10.7) | 311 | 36.0 | (32.1–39.8) | 28 | 2.9 | (1.7–4.2) |
| Median | NA | NA | 55.2 | NA | NA | 16.1 | NA | NA | 27.1 | NA | NA | 0.7 | NA |
| Minimum | NA | NA | 31.6 | NA | NA | 5.3 | NA | NA | 13.4 | NA | NA | 0.3 | NA |
| Maximum | NA | NA | 69.5 | NA | NA | 30.5 | NA | NA | 47.7 | NA | NA | 2.9 | NA |
Abbreviations: CI = confidence interval; NA = not applicable.
Unweighted sample size.
Weighted percentage.
Estimates not presented for cell sizes of five or fewer.
Health Insurance by Time Period
Insurance coverage was examined overall and by state at each of the three time periods presented in the analysis: the month before pregnancy, during pregnancy, and at delivery.
Month Before Pregnancy
Based on the estimates of all states combined, during the month before pregnancy, 76.6% of women had some type of health insurance (59.9% reported private and 16.6% reported Medicaid), and 23.4% of women reported having no health insurance in the month before pregnancy. Coverage varied by state. Private coverage ranged from 45.3% in Mississippi to 74.6% in Utah; Medicaid coverage ranged from 5.8% in Utah to 31.5% in Maine; and the prevalence of being uninsured in the month before pregnancy ranged from 6.1% in Massachusetts to 36.2% in Oklahoma (Table 2).
TABLE 2.
Prevalence of women with any health insurance, private health insurance, Medicaid, or no insurance the month before pregnancy, by state — Pregnancy Risk Assessment Monitoring System, 29 states, 2009
| Any | Private | Medicaid | None | ||||||||||
|---|---|---|---|---|---|---|---|---|---|---|---|---|---|
| State | Total* | No. | %† | (95% CI) | No. | % | (95% CI) | No. | % | (95% CI) | No. | % | (95% CI) |
| Total | 36,710 | 28,523 | 76.6 | (75.8–77.4) | 21,826 | 59.9 | (59.1–60.8) | 6,697 | 16.6 | (16.0–17.3) | 8,187 | 23.4 | (22.6–24.2) |
| Alaska | 1,025 | 796 | 78.3 | (75.2–81.4) | 618 | 62.5 | (59.0–66.0) | 178 | 15.8 | (13.3–18.3) | 229 | 21.7 | (18.6–24.8) |
| Arkansas | 1,009 | 634 | 66.3 | (62.4–70.1) | 480 | 51.8 | (47.7–56.0) | 154 | 14.4 | (11.4–17.4) | 375 | 33.7 | (29.9–37.6) |
| Colorado | 1,766 | 1,332 | 77.3 | (74.6–80.1) | 1,142 | 66.3 | (63.1–69.4) | 190 | 11.1 | (8.9–13.2) | 434 | 22.7 | (19.9–25.4) |
| Delaware | 944 | 840 | 89.1 | (87.1–91.1) | 603 | 63.2 | (60.1–66.4) | 237 | 25.9 | (23.0–28.8) | 104 | 10.9 | (8.9–12.9) |
| Georgia | 780 | 554 | 69.8 | (64.9–74.6) | 415 | 52.6 | (47.4–57.7) | 139 | 17.2 | (13.3–21.1) | 226 | 30.2 | (25.4–35.1) |
| Hawaii | 1,507 | 1,381 | 92.3 | (90.6–94.0) | 1,087 | 72.5 | (69.6–75.4) | 294 | 19.8 | (17.2–22.4) | 126 | 7.7 | (6.0–9.4) |
| Illinois | 1,480 | 1,149 | 77.4 | (75.1–79.7) | 821 | 53.8 | (51.0–56.5) | 328 | 23.6 | (21.2–26.0) | 331 | 22.6 | (20.3–24.9) |
| Maine | 1,042 | 893 | 86.6 | (84.2–89.1) | 582 | 55.2 | (51.6–58.7) | 311 | 31.5 | (28.1–34.8) | 149 | 13.4 | (10.9–15.8) |
| Maryland | 1,401 | 1,206 | 80.7 | (77.3–84.0) | 1,099 | 73.0 | (69.3–76.7) | 107 | 7.7 | (5.4–9.9) | 195 | 19.3 | (16.0–22.7) |
| Massachusetts | 1,242 | 1,148 | 93.9 | (92.2–95.5) | 768 | 68.8 | (65.6–72.0) | 380 | 25.1 | (22.1–28.1) | 94 | 6.1 | (4.5–7.8) |
| Michigan | 1,535 | 1,267 | 81.1 | (78.8–83.5) | 836 | 59.8 | (56.9–62.7) | 431 | 21.3 | (19.0–23.7) | 268 | 18.9 | (16.5–21.2) |
| Minnesota | 1,211 | 1,050 | 87.1 | (84.9–89.2) | 826 | 73.7 | (71.0–76.5) | 224 | 13.3 | (11.2–15.4) | 161 | 12.9 | (10.8–15.1) |
| Mississippi | 1,278 | 840 | 65.4 | (62.1–68.6) | 570 | 45.3 | (41.9–48.6) | 270 | 20.1 | (17.4–22.8) | 438 | 34.6 | (31.4–37.9) |
| Missouri | 1,319 | 958 | 72.3 | (69.4–75.2) | 793 | 59.0 | (55.8–62.3) | 165 | 13.2 | (10.9–15.6) | 361 | 27.7 | (24.8–30.6) |
| Nebraska | 1,736 | 1,281 | 76.8 | (74.6–79.0) | 1,019 | 66.2 | (63.7–68.6) | 262 | 10.6 | (9.2–12.1) | 455 | 23.2 | (21.0–25.4) |
| New Jersey | 1,275 | 1,103 | 86.7 | (84.8–88.7) | 902 | 72.2 | (69.7–74.7) | 201 | 14.5 | (12.5–16.5) | 172 | 13.3 | (11.3–15.2) |
| Ohio | 1,318 | 1,120 | 83.0 | (80.1–85.9) | 755 | 61.7 | (58.2–65.3) | 365 | 21.3 | (18.3–24.2) | 198 | 17.0 | (14.1–19.9) |
| Oklahoma | 1,988 | 1,292 | 63.8 | (60.1–67.4) | 1,014 | 48.7 | (45.0–52.4) | 278 | 15.0 | (12.2–17.9) | 696 | 36.2 | (32.6–39.9) |
| Oregon | 1,535 | 1,084 | 72.9 | (69.6–76.2) | 840 | 61.7 | (58.2–65.3) | 244 | 11.1 | (8.9–13.3) | 451 | 27.1 | (23.8–30.4) |
| Pennsylvania | 969 | 828 | 83.6 | (80.8–86.4) | 684 | 67.1 | (63.6–70.6) | 144 | 16.5 | (13.6–19.3) | 141 | 16.4 | (13.6–19.2) |
| Rhode Island | 1,210 | 1,012 | 84.3 | (81.9–86.7) | 756 | 62.7 | (59.5–65.8) | 256 | 21.6 | (18.8–24.4) | 198 | 15.7 | (13.3–18.1) |
| Tennessee | 654 | 528 | 79.4 | (75.3–83.6) | 339 | 52.8 | (47.8–57.9) | 189 | 26.6 | (22.1–31.1) | 126 | 20.6 | (16.4–24.7) |
| Texas | 1,315 | 879 | 64.0 | (60.8–67.3) | 716 | 51.9 | (48.7–55.0) | 163 | 12.2 | (9.9–14.4) | 436 | 36.0 | (32.7–39.2) |
| Utah | 1,501 | 1,145 | 80.5 | (78.5–82.5) | 1,043 | 74.6 | (72.4–76.8) | 102 | 5.8 | (4.6–7.1) | 356 | 19.5 | (17.5–21.5) |
| Vermont | 935 | 808 | 85.9 | (83.5–88.2) | 613 | 65.0 | (61.8–68.2) | 195 | 20.9 | (18.1–23.6) | 127 | 14.1 | (11.8–16.5) |
| Washington | 1,467 | 1,054 | 76.3 | (73.5–79.0) | 810 | 62.6 | (59.4–65.7) | 244 | 13.7 | (11.3–16.1) | 413 | 23.7 | (21.0–26.5) |
| West Virginia | 1,517 | 998 | 68.4 | (65.5–71.3) | 670 | 47.5 | (44.4–50.7) | 328 | 20.9 | (18.3–23.4) | 519 | 31.6 | (28.7–34.5) |
| Wisconsin | 899 | 744 | 86.1 | (83.6–88.6) | 520 | 66.4 | (63.0–69.8) | 224 | 19.7 | (16.8–22.6) | 155 | 13.9 | (11.4–16.4) |
| Wyoming | 852 | 599 | 72.6 | (69.1–76.0) | 505 | 63.5 | (59.8–67.2) | 94 | 9.0 | (6.9–11.2) | 253 | 27.4 | (24.0–30.9) |
| Median | NA | NA | 79.4 | NA | NA | 62.6 | NA | NA | 16.5 | NA | NA | 20.6 | NA |
| Minimum | NA | NA | 63.8 | NA | NA | 45.3 | NA | NA | 5.8 | NA | NA | 6.1 | NA |
| Maximum | NA | NA | 93.9 | NA | NA | 74.6 | NA | NA | 31.5 | NA | NA | 36.2 | NA |
Abbreviations: CI = confidence interval; NA = not applicable.
Unweighted sample size.
Weighted percentage.
During Pregnancy
Prenatal Care
Overall, nearly all women (97.0%) had health insurance coverage during pregnancy to pay for prenatal care, with 56.9% of women reporting private coverage and 40.1% reporting Medicaid. Three percent (3.0%) of women reported no health insurance for prenatal care. The prevalence of private coverage for prenatal care ranged from 36.6% in Mississippi to 73.0% in Minnesota. The prevalence of Medicaid coverage for prenatal care ranged from 19.8% in Utah to 60.2% in Mississippi. The prevalence of no health insurance for prenatal care ranged from 0.6% in Massachusetts to 8.5% in Georgia (Table 3).
TABLE 3.
Prevalence of women with any health insurance, private health insurance, Medicaid, or no insurance during pregnancy, by state — Pregnancy Risk Assessment Monitoring System, 29 states, 2009
| Any | Private | Medicaid | None | ||||||||||
|---|---|---|---|---|---|---|---|---|---|---|---|---|---|
| State | Total* | No. | %† | (95% CI) | No. | % | (95% CI) | No. | % | (95% CI) | No. | % | (95% CI) |
| Total | 36,710 | 35,663 | 97.0 | (96.7–97.4) | 20,695 | 56.9 | (56.1–57.8) | 14,968 | 40.1 | (39.2–40.9) | 1,047 | 3.0 | (2.6–3.4) |
| Alaska | 1,025 | 993 | 97.1 | (95.9–98.3) | 615 | 62.5 | (59.0–66.0) | 378 | 34.6 | (31.2–38.1) | 32 | 2.9 | (1.7–4.1) |
| Arkansas | 1,009 | 967 | 95.5 | (93.8–97.1) | 434 | 46.7 | (42.6–50.8) | 533 | 48.8 | (44.6–52.9) | 42 | 4.5 | (2.9–6.2) |
| Colorado | 1,766 | 1,661 | 94.3 | (92.7–95.8) | 1,096 | 63.1 | (59.9–66.3) | 565 | 31.2 | (28.1–34.3) | 105 | 5.7 | (4.2–7.3) |
| Delaware | 944 | 918 | 97.0 | (95.9–98.2) | 565 | 59.3 | (56.1–62.5) | 353 | 37.7 | (34.6–40.9) | 26 | 3.0 | (1.8–4.1) |
| Georgia | 780 | 730 | 91.5 | (88.4–94.7) | 368 | 45.3 | (40.2–50.3) | 362 | 46.2 | (41.1–51.3) | 50 | 8.5 | (5.3–11.6) |
| Hawaii | 1,507 | 1,482 | 98.6 | (97.9–99.3) | 1,052 | 70.9 | (68.0–73.8) | 430 | 27.7 | (24.9–30.6) | 25 | 1.4 | (0.7–2.1) |
| Illinois | 1,480 | 1,464 | 99.0 | (98.4–99.5) | 775 | 50.7 | (48.0–53.4) | 689 | 48.2 | (45.5–51.0) | 16 | 1.0 | (0.5–1.6) |
| Maine | 1,042 | 1,028 | 98.9 | (98.2–99.7) | 571 | 53.8 | (50.2–57.3) | 457 | 45.1 | (41.6–48.7) | 14 | 1.1 | (0.3–1.8) |
| Maryland | 1,401 | 1,366 | 95.4 | (93.6–97.2) | 1,072 | 71.0 | (67.2–74.8) | 294 | 24.4 | (20.8–28.0) | 35 | 4.6 | (2.8–6.4) |
| Massachusetts | 1,242 | 1,235 | 99.4 | (98.8–100.0) | 756 | 67.4 | (64.1–70.6) | 479 | 32.1 | (28.8–35.3) | 7 | 0.6 | (0.0–1.2) |
| Michigan | 1,535 | 1,521 | 98.9 | (98.2–99.5) | 794 | 57.1 | (54.2–60.0) | 727 | 41.8 | (38.9–44.7) | 14 | 1.1 | (0.5–1.8) |
| Minnesota | 1,211 | 1,194 | 98.9 | (98.3–99.5) | 817 | 73.0 | (70.2–75.8) | 377 | 25.9 | (23.2–28.6) | 17 | 1.1 | (0.5–1.7) |
| Mississippi | 1,278 | 1,237 | 96.8 | (95.6–98.0) | 447 | 36.6 | (33.3–39.9) | 790 | 60.2 | (56.8–63.5) | 41 | 3.2 | (2.0–4.4) |
| Missouri | 1,319 | 1,294 | 98.2 | (97.3–99.0) | 741 | 55.2 | (51.9–58.4) | 553 | 43.0 | (39.8–46.2) | 25 | 1.8 | (1.0–2.7) |
| Nebraska | 1,736 | 1,701 | 98.0 | (97.3–98.8) | 942 | 62.6 | (60.1–65.0) | 759 | 35.5 | (33.0–37.9) | 35 | 2.0 | (1.2–2.7) |
| New Jersey | 1,275 | 1,258 | 98.7 | (98.1–99.4) | 888 | 71.2 | (68.7–73.7) | 370 | 27.5 | (25.1–30.0) | 17 | 1.3 | (0.6–1.9) |
| Ohio | 1,318 | 1,295 | 98.1 | (97.1–99.1) | 709 | 59.7 | (56.1–63.3) | 586 | 38.4 | (34.8–41.9) | 23 | 1.9 | (0.9–2.9) |
| Oklahoma | 1,988 | 1,929 | 96.6 | (95.2–97.9) | 924 | 44.2 | (40.6–47.9) | 1,005 | 52.3 | (48.6–56.0) | 59 | 3.4 | (2.1–4.8) |
| Oregon | 1,535 | 1,476 | 97.8 | (97.1–98.5) | 791 | 58.8 | (55.2–62.4) | 685 | 39.0 | (35.4–42.6) | 59 | 2.2 | (1.5–2.9) |
| Pennsylvania | 969 | 939 | 96.4 | (94.9–97.8) | 677 | 65.8 | (62.3–69.3) | 262 | 30.6 | (27.1–34.0) | 30 | 3.6 | (2.2–5.1) |
| Rhode Island | 1,210 | 1,203 | 99.4 | (99.0–99.9) | 737 | 60.9 | (57.8–64.1) | 466 | 38.5 | (35.4–41.6) | 7 | 0.6 | (0.1–1.0) |
| Tennessee | 654 | 643 | 97.6 | (96.0–99.3) | 307 | 48.5 | (43.5–53.5) | 336 | 49.1 | (44.1–54.2) | 11 | 2.4 | (0.7–4.0) |
| Texas | 1,315 | 1,270 | 96.4 | (95.1–97.6) | 656 | 48.8 | (45.6–52.0) | 614 | 47.6 | (44.3–50.8) | 45 | 3.6 | (2.4–4.9) |
| Utah | 1,501 | 1,350 | 92.5 | (91.3–93.8) | 1,020 | 72.7 | (70.5–75.0) | 330 | 19.8 | (17.6–21.9) | 151 | 7.5 | (6.2–8.7) |
| Vermont | 935 | 923 | 98.7 | (97.9–99.5) | 594 | 63.0 | (59.7–66.2) | 329 | 35.7 | (32.5–38.9) | 12 | 1.3 | (0.5–2.1) |
| Washington | 1,467 | 1,435 | 98.8 | (98.2–99.4) | 757 | 60.3 | (57.1–63.5) | 678 | 38.5 | (35.3–41.7) | 32 | 1.2 | (0.6–1.8) |
| West Virginia | 1,517 | 1,500 | 99.0 | (98.3–99.6) | 610 | 44.3 | (41.2–47.4) | 890 | 54.7 | (51.6–57.8) | 17 | 1.0 | (0.4–1.7) |
| Wisconsin | 899 | 880 | 97.7 | (96.4–98.9) | 500 | 64.6 | (61.1–68.0) | 380 | 33.1 | (29.7–36.5) | 19 | 2.3 | (1.1–3.6) |
| Wyoming | 852 | 771 | 91.6 | (89.7–93.6) | 480 | 58.9 | (55.0–62.8) | 291 | 32.7 | (29.0–36.5) | 81 | 8.4 | (6.4–10.3) |
| Median | NA | NA | 97.8 | NA | NA | 59.7 | NA | NA | 38.4 | NA | NA | 2.2 | NA |
| Minimum | NA | NA | 91.5 | NA | NA | 36.6 | NA | NA | 19.8 | NA | NA | 0.6 | NA |
| Maximum | NA | NA | 99.4 | NA | NA | 73.0 | NA | NA | 60.2 | NA | NA | 8.5 | NA |
Abbreviations: CI = confidence interval; NA = not applicable.
Unweighted sample size.
Weighted percentage.
Delivery
Overall, almost all women (98.5%) reported having health insurance coverage to pay for delivery, with 54.6% of women reporting private health insurance coverage, 43.9% reporting Medicaid coverage, and 1.5% reporting no insurance. The prevalence of private coverage for delivery ranged from 33.6% in Mississippi to 71.5% in Minnesota. The prevalence of Medicaid coverage at delivery ranged from 26.7% in Utah to 64.8% in Mississippi. The prevalence of having no insurance at the time of delivery ranged from 0.6% in Michigan, Minnesota, and Washington to 5.4% in Wyoming (Table 4).
TABLE 4.
Prevalence of women with any health insurance, private health insurance, Medicaid, or no insurance at delivery, by state — Pregnancy Risk Assessment Monitoring System, 29 states, 2009
| ` | Any | Private | Medicaid | None | |||||||||
|---|---|---|---|---|---|---|---|---|---|---|---|---|---|
| State | Total* | No. | %† | (95% CI) | No. | % | (95% CI) | No. | % | (95% CI) | No. | % | (95% CI) |
| Total | 36,710 | 36,196 | 98.5 | (98.3–98.7) | 19,843 | 54.6 | (53.8–55.5) | 16,353 | 43.9 | (43.0–44.7) | 514 | 1.5 | (1.3–1.7) |
| Alaska | 1,025 | 1,003 | 97.7 | (96.5–98.8) | 592 | 60.0 | (56.5–63.6) | 411 | 37.6 | (34.2–41.1) | 22 | 2.3 | (1.2–3.5) |
| Arkansas | 1,009 | 974 | 96.4 | (95.0–97.8) | 413 | 45.5 | (41.4–49.6) | 561 | 50.9 | (46.8–55.0) | 35 | 3.6 | (2.2–5.0) |
| Colorado | 1,766 | 1,729 | 97.9 | (97.0–98.9) | 1,066 | 61.1 | (57.9–64.4) | 663 | 36.8 | (33.6–40.0) | 37 | 2.1 | (1.1–3.0) |
| Delaware | 944 | 934 | 98.8 | (98.0–99.5) | 547 | 57.3 | (54.0–60.5) | 387 | 41.5 | (38.3–44.7) | 10 | 1.2 | (0.5–2.0) |
| Georgia | 780 | 767 | 97.0 | (95.1–98.9) | 350 | 43.7 | (38.7–48.7) | 417 | 53.3 | (48.3–58.4) | 13 | 3.0 | (1.1–4.9) |
| Hawaii | 1,507 | 1,488 | 98.8 | (98.2–99.5) | 985 | 66.2 | (63.2–69.3) | 503 | 32.6 | (29.6–35.6) | 19 | 1.2 | (0.5–1.8) |
| Illinois | 1,480 | 1,470 | 99.3 | (98.8–99.7) | 749 | 48.9 | (46.2–51.6) | 721 | 50.3 | (47.6–53.1) | 10 | 0.7 | (0.3–1.2) |
| Maine | 1,042 | 1,033 | 99.3 | (98.7–99.9) | 550 | 52.0 | (48.4–55.5) | 483 | 47.3 | (43.8–50.8) | 9 | 0.7 | (0.1–1.3) |
| Maryland | 1,401 | 1,387 | 98.4 | (97.3–99.5) | 1,044 | 69.0 | (65.1–72.8) | 343 | 29.5 | (25.7–33.2) | 14 | 1.6 | (0.5–2.7) |
| Massachusetts | 1,242 | 1,240 | 99.9 | (99.8–100.0) | 726 | 64.4 | (61.0–67.8) | 514 | 35.5 | (32.1–38.9) | —§ | — | — |
| Michigan | 1,535 | 1,525 | 99.4 | (99.0–99.8) | 741 | 54.6 | (51.7–57.5) | 784 | 44.8 | (41.9–47.7) | 10 | 0.6 | (0.2–1.0) |
| Minnesota | 1,211 | 1,200 | 99.4 | (98.9–99.8) | 796 | 71.5 | (68.7–74.3) | 404 | 27.9 | (25.1–30.7) | 11 | 0.6 | (0.2–1.1) |
| Mississippi | 1,278 | 1,258 | 98.4 | (97.5–99.3) | 405 | 33.6 | (30.4–36.8) | 853 | 64.8 | (61.5–68.0) | 20 | 1.6 | (0.7–2.5) |
| Missouri | 1,319 | 1,296 | 98.5 | (97.9–99.2) | 717 | 53.4 | (50.2–56.7) | 579 | 45.1 | (41.9–48.3) | 23 | 1.5 | (0.8–2.1) |
| Nebraska | 1,736 | 1,711 | 98.2 | (97.5–99.0) | 898 | 60.2 | (57.6–62.7) | 813 | 38.1 | (35.6–40.6) | 25 | 1.8 | (1.0–2.5) |
| New Jersey | 1,275 | 1,266 | 99.3 | (98.8–99.8) | 866 | 69.5 | (66.9–72.0) | 400 | 29.8 | (27.3–32.4) | 9 | 0.7 | (0.2–1.2) |
| Ohio | 1,318 | 1,301 | 98.3 | (97.2–99.3) | 667 | 56.1 | (52.5–59.7) | 634 | 42.2 | (38.6–45.8) | 17 | 1.7 | (0.7–2.8) |
| Oklahoma | 1,988 | 1,952 | 97.5 | (96.3–98.7) | 880 | 42.1 | (38.5–45.8) | 1,072 | 55.4 | (51.7–59.1) | 36 | 2.5 | (1.3–3.7) |
| Oregon | 1,535 | 1,519 | 99.3 | (98.7–99.9) | 752 | 56.0 | (52.3–59.7) | 767 | 43.4 | (39.7–47.1) | 16 | 0.7 | (0.1–1.3) |
| Pennsylvania | 969 | 949 | 97.4 | (96.2–98.7) | 660 | 63.7 | (60.1–67.2) | 289 | 33.8 | (30.2–37.3) | 20 | 2.6 | (1.3–3.8) |
| Rhode Island | 1,210 | 1,208 | 99.9 | (99.7–100.0) | 697 | 57.8 | (54.6–60.9) | 511 | 42.1 | (39.0–45.3) | — | — | — |
| Tennessee | 654 | 650 | 99.5 | (98.7–100.0) | 287 | 44.6 | (39.7–49.6) | 363 | 54.8 | (49.8–59.8) | — | — | — |
| Texas | 1,315 | 1,293 | 98.3 | (97.5–99.1) | 632 | 46.6 | (43.4–49.8) | 661 | 51.7 | (48.6–54.8) | 22 | 1.7 | (0.9–2.5) |
| Utah | 1,501 | 1,462 | 97.7 | (96.8–98.5) | 983 | 70.9 | (68.6–73.2) | 479 | 26.7 | (24.5–29.0) | 39 | 2.3 | (1.5–3.2) |
| Vermont | 935 | 928 | 99.1 | (98.4–99.8) | 574 | 61.4 | (58.1–64.6) | 354 | 37.7 | (34.5–41.0) | 7 | 0.9 | (0.2–1.6) |
| Washington | 1,467 | 1,455 | 99.4 | (98.8–99.9) | 735 | 57.5 | (54.3–60.8) | 720 | 41.8 | (38.6–45.1) | 12 | 0.6 | (0.1–1.2) |
| West Virginia | 1,517 | 1,503 | 99.3 | (98.8–99.8) | 587 | 42.5 | (39.4–45.6) | 916 | 56.8 | (53.7–59.9) | 14 | 0.7 | (0.2–1.2) |
| Wisconsin | 899 | 888 | 98.4 | (97.4–99.5) | 485 | 62.5 | (58.9–66.0) | 403 | 36.0 | (32.5–39.5) | 11 | 1.6 | (0.5–2.6) |
| Wyoming | 852 | 807 | 94.6 | (92.8–96.4) | 459 | 56.8 | (52.9–60.7) | 348 | 37.8 | (43.0–44.7) | 45 | 5.4 | (3.6–7.2) |
| Median | NA | NA | 98.5 | NA | NA | 57.3 | NA | NA | 41.8 | NA | NA | 1.5 | NA |
| Minimum | NA | NA | 94.6 | NA | NA | 33.6 | NA | NA | 26.7 | NA | NA | 0.6 | NA |
| Maximum | NA | NA | 99.9 | NA | NA | 71.5 | NA | NA | 64.8 | NA | NA | 5.4 | NA |
Abbreviations: CI = confidence interval; NA = not applicable.
Unweighted sample size.
Weighted percentage.
Estimates not presented for cell sizes of five or fewer.
Health Insurance Coverage Stability by Maternal Characteristics
The demographic and other characteristics of women varied among the different insurance coverage groups. For example, teenagers (those aged ≤19 years) and young adults (those aged 20–25 years) contributed a relatively high percentage to the unstable and stable Medicaid groups. Although 9.9% of the total population was teenagers, they accounted for 24.4% of the stable Medicaid group and 14.3% of the unstable group; 28.7% of the total population was women aged 20–25 years, who accounted for 40.0% of the stable Medicaid group and 44.0% of the unstable group. Hispanic women comprised 17.8% of the total population but accounted for 30.0% of the unstable group and 28.1% of the uninsured. Women with more than a high school education comprised 56.8% of the total population and accounted for 79.9% of the stable private group. Unmarried women comprised 38.6% of the total population but 60.9% of the unstable group. Women with incomes ≤200% FPL made up 49.5% of the total population but accounted for 83.8% of the unstable group and 60.9% of the uninsured group. Women who entered prenatal care after the first trimester comprised 18.0% of the total population but accounted for 32.2% of the unstable group and 45.5% of the uninsured group (Table 5).
TABLE 5.
Prevalence of women with stable health insurance coverage, unstable health insurance coverage, or no health insurance coverage from the month before pregnancy to the time of delivery, by selected maternal characteristics — Pregnancy Risk Assessment Monitoring System, 29 states,* 2009
| Stable coverage | |||||||||||||||||||
|---|---|---|---|---|---|---|---|---|---|---|---|---|---|---|---|---|---|---|---|
| Total | Private | Medicaid | Unstable coverage | Uninsured | |||||||||||||||
| Characteristic | No.† | %§ | (95% CI) | No. | % | (95% CI) | AOR¶ | (95% CI) | No. | % | (95% CI) | AOR** | (95% CI) | No. | % | (95% CI) | No. | % | (95% CI) |
| Overall | 36,710 | 100.0 | NA | 19,073 | 52.7 | (51.9–53.6) | NA | NA | 6,448 | 16.1 | (15.4–16.7) | NA | NA | 10,845 | 30.1 | (29.2–30.9) | 344 | 1.1 | (0.9–1.3) |
| Age (yrs) | |||||||||||||||||||
| ≤19 | 3,542 | 9.9 | (9.3–10.5) | 617 | 3.2 | (2.7–3.6) | 1.0 | (0.7–1.4) | 1,421 | 24.4 | (22.3–26.4) | 3.5 | (2.5–4.8) | 1,486 | 14.3 | (13.0–15.6) | 18 | 4.4 | (1.0–7.8) |
| 20–25 | 10,635 | 28.7 | (27.9–29.5) | 3,240 | 16.4 | (15.5–17.3) | 0.4 | (0.3–0.5) | 2,548 | 40.0 | (37.7–42.2) | 1.3 | (1.0–1.6) | 4,729 | 44.0 | (42.2–45.8) | 118 | 34.8 | (25.6–44.0) |
| 26–34 | 16,990 | 47.7 | (46.8–48.6) | 11,118 | 61.2 | (60.1–62.3) | 0.8 | (0.7–1.0) | 2,009 | 29.6 | (27.6–31.6) | 1.1 | (0.9–1.5) | 3,696 | 33.6 | (31.9–35.3) | 167 | 48.1 | (38.4–57.8) |
| ≥35 | 5,541 | 13.7 | (13.1–14.3) | 4,097 | 19.3 | (18.4–20.2) | Ref. | Ref. | 469 | 6.1 | (5.1–7.0) | Ref. | Ref. | 934 | 8.1 | (7.0–9.1) | 41 | 12.7 | (6.8–18.6) |
| Race/Ethnicity | |||||||||||||||||||
| White, non-Hispanic | 20,432 | 61.4 | (60.8–62.0) | 12,792 | 74.8 | (74.0–75.5) | Ref. | Ref. | 2,446 | 42.8 | (41.2–44.4) | Ref. | Ref. | 5,000 | 47.9 | (46.7–49.1) | 194 | 61.8 | (55.7–67.8) |
| Black, non-Hispanic | 5,883 | 14.0 | (13.6–14.5) | 1,824 | 8.0 | (7.5–8.5) | 0.9 | (0.7–1.0) | 2,040 | 30.1 | (28.7–31.6) | 1.8 | (1.6–2.2) | 1,991 | 16.4 | (15.5–17.3) | 28 | 4.5 | (3.2–5.7) |
| Hispanic | 5,029 | 17.8 | (17.3–18.2) | 1,461 | 9.5 | (9.1–9.9) | 0.5 | (0.4–0.6) | 1,086 | 21.5 | (20.4–22.5) | 0.6 | (0.5–0.7) | 2,409 | 30.0 | (29.0–31.0) | 73 | 28.1 | (21.3–35.0) |
| American Indian/Alaska Native | 1,162 | 0.7 | (0.7–0.8) | 301 | 0.3 | (0.3–0.4) | 0.4 | (0.3–0.7) | 344 | 1.2 | (1.0–1.4) | 0.9 | (0.7–1.3) | 489 | 1.1 | (0.9–1.3) | 28 | 2.3 | (1.1–3.6) |
| Other | 3,958 | 6.0 | (5.7–6.4) | 2,567 | 7.5 | (7.0–7.9) | 0.9 | (0.7–1.1) | 496 | 4.4 | (3.7–5.1) | 1.3 | (1.0–1.7) | 875 | 4.5 | (3.9–5.1) | 20 | 3.3 | (0.1–6.5) |
| Education | |||||||||||||||||||
| <High school | 5,624 | 15.7 | (15.0–16.4) | 703 | 3.7 | (3.2–4.2) | 0.3 | (0.3–0.4) | 2,201 | 36.7 | (34.5–38.9) | 1.8 | (1.5–2.2) | 2,603 | 24.8 | (23.2–26.4) | 117 | 43.7 | (35.9–51.4) |
| High school | 9,995 | 27.4 | (26.6–28.3) | 3,157 | 16.4 | (15.5–17.3) | 0.5 | (0.4–0.6) | 2,645 | 41.0 | (38.8–43.3) | 1.4 | (1.2–1.6) | 4,116 | 39.8 | (38.0–41.6) | 77 | 21.2 | (13.3–29.1) |
| >High school | 20,630 | 56.8 | (56.0–57.7) | 14,998 | 79.9 | (78.9–80.9) | Ref. | Ref. | 1,522 | 22.3 | (20.6–24.0) | Ref. | Ref. | 3,967 | 35.4 | (33.8–37.1) | 143 | 35.1 | (28.0–42.3) |
| Marital status | |||||||||||||||||||
| Married | 22,364 | 61.4 | (60.5–62.3) | 16,080 | 84.9 | (84.0–85.8) | Ref. | Ref. | 1,627 | 25.0 | (23.1–26.9) | Ref. | Ref. | 4,416 | 39.1 | (37.4–40.9) | 241 | 73.4 | (65.1–81.7) |
| Not married | 14,316 | 38.6 | (37.7–39.5) | 2,983 | 15.1 | (14.2–16.0) | 0.3 | (0.3–0.4) | 4,819 | 75.0 | (73.1–76.9) | 1.7 | (1.4–1.9) | 6,412 | 60.9 | (59.1–62.6) | 102 | 26.6 | (18.3–34.9) |
| Federal poverty level | |||||||||||||||||||
| ≤200% | 17,510 | 49.5 | (48.6–50.4) | 3,615 | 18.0 | (17.1–18.9) | 0.1 | (0.1–0.1) | 5,437 | 94.8 | (93.7–95.9) | 2.3 | (1.8–3.0) | 8,279 | 83.8 | (82.5–85.1) | 179 | 60.9 | (53.0–68.8) |
| >200% | 16,765 | 50.5 | (49.6–51.4) | 14,720 | 82.0 | (81.1–82.9) | Ref. | Ref. | 282 | 5.2 | (4.1–6.3) | Ref. | Ref. | 1,637 | 16.2 | (14.9–17.5) | 126 | 39.1 | (31.2–47.0) |
| Prenatal care initiation | |||||||||||||||||||
| First trimester | 29,688 | 82.0 | (81.2–82.7) | 17,302 | 93.0 | (92.4–93.6) | Ref. | Ref. | 4,625 | 73.6 | (71.6–75.7) | Ref. | Ref. | 7,577 | 67.8 | (66.1–69.6) | 184 | 54.5 | (45.4–63.5) |
| Later | 6,370 | 18.0 | (17.3–18.8) | 1,546 | 7.0 | (6.4–7.6) | 0.4 | (0.3–0.5) | 1,631 | 26.4 | (24.3–28.4) | 0.6 | (0.5–0.7) | 3,041 | 32.2 | (30.4–33.9) | 152 | 45.5 | (36.5–54.6) |
| Delivery location | |||||||||||||||||||
| Hospital | 36,482 | 99.4 | (99.3–99.5) | 18,996 | 99.5 | (99.3–99.7) | Ref. | Ref. | 6,426 | 99.9 | (99.9–100.0) | Ref. | Ref. | 10,771 | 99.5 | (99.3–99.7) | 289 | 82.9 | (78.3–87.6) |
| Residence | 208 | 0.6 | (0.5–0.7) | 71 | 0.5 | (0.3–0.7) | 0.4 | (0.2–1.1) | 17 | 0.1 | (0.0–0.1) | 0.2 | (0.1–0.5) | 65 | 0.5 | (0.3–0.7) | 55 | 17.1 | (12.4–21.7) |
| Parity | |||||||||||||||||||
| Primiparous | 15,546 | 41.3 | (40.4–42.2) | 8,404 | 42.3 | (41.2–43.5) | Ref. | Ref. | 1,923 | 30.1 | (28.0–32.2) | Ref. | Ref. | 5,111 | 45.9 | (44.1–47.7) | 108 | 31.1 | (22.2–40.0) |
| Multiparous | 21,068 | 58.7 | (57.8–59.6) | 10,595 | 57.7 | (56.5–58.8) | 1.1 | (1.0–1.3) | 4,501 | 69.9 | (67.8–72.0) | 3.6 | (3.0–4.3) | 5,678 | 54.1 | (52.3–55.9) | 235 | 68.9 | (60.0–77.8) |
| Pregnancy intention | |||||||||||||||||||
| Intended | 20,608 | 56.4 | (55.5–57.3) | 13,413 | 70.4 | (69.3–71.5) | Ref. | Ref. | 2,396 | 36.8 | (34.6–39.0) | Ref. | Ref. | 4,626 | 42.2 | (40.4–44.0) | 173 | 55.6 | (46.1–65.0) |
| Unintended | 15,473 | 43.6 | (42.7–44.5) | 5,375 | 29.6 | (28.5–30.7) | 0.8 | (0.7–0.9) | 3,910 | 63.2 | (61.0–65.4) | 1.0 | (0.8–1.1) | 6,027 | 57.8 | (56.0–59.6) | 161 | 44.4 | (35.0–53.9) |
Abbreviations: AOR = adjusted odds ratio; CI = confidence interval; NA = not applicable; Ref. = reference.
Alaska, Arkansas, Colorado, Delaware, Georgia, Hawaii, Illinois, Maine, Maryland, Massachusetts, Michigan, Minnesota, Mississippi, Missouri, Nebraska, New Jersey, Ohio, Oklahoma, Oregon, Pennsylvania, Rhode Island, Tennessee, Texas, Utah, Vermont, Washington, West Virginia, Wisconsin, and Wyoming.
Unweighted sample size.
Weighted percentage.
AOR comparing characteristics of women with stable private coverage with those with unstable coverage.
AOR comparing characteristics of women with stable Medicaid coverage with those with unstable coverage.
Multivariable modeling of the aggregated data from the 29 PRAMS states (Table 5) was used to compare women in the unstable group with those in the stable private group and those in the stable Medicaid group. Results indicated that women with the following characteristics had lower odds of having stable private coverage than unstable coverage: women who were younger (i.e., aged 20–25 years compared with ≥35 years), were Hispanic or American Indian/Alaska Native (AI/AN) compared with white, had a high school education or less compared with greater than high school education, were unmarried compared with married, had incomes ≤200% of the FPL compared with >200% of the FPL, or experienced an unintended pregnancy compared with an intended pregnancy.
Women with the following characteristics had higher odds of reporting stable Medicaid coverage than unstable coverage: women who were aged ≤19 years compared with those aged ≥35 years, who were black compared with white, who had a high school education or less compared with greater than high school education, who were unmarried compared with married, who had incomes ≤200% of the FPL compared with >200% of the FPL, or who were multiparous. Women who were Hispanic compared with white were the only group with higher odds of experiencing unstable coverage than stable Medicaid coverage. Women who entered prenatal care after the first trimester compared with entering in the first trimester had higher odds of being in the unstable group than either of the stable coverage groups (private or Medicaid) (Table 5).
Patterns of Movement Among Women with Unstable Health Insurance
Overall, the unstable group (n = 10,845) was primarily composed of women who started out uninsured in the month before pregnancy (74.4%), followed by those who had private insurance in the month before pregnancy (23.9%) and a small percentage of women who reported Medicaid in the month before pregnancy (1.8%). At time of delivery, most women in this unstable group had shifted to Medicaid (92.4%). Some women moved to private insurance (6.2%), and a small percentage became uninsured (1.4%) (Table 6). Patterns of movement, or churning, among this group of women with unstable health insurance were examined in more detail based on the type of insurance reported the month before pregnancy and the type reported at the time of delivery.
TABLE 6.
Prevalence of movement between different types of health insurance coverage among women with unstable coverage, by type of coverage the month before pregnancy and type of coverage at delivery — Pregnancy Risk Assessment Monitoring System, 29 states,* 2009
| Insurance at delivery | ||||||||||||
|---|---|---|---|---|---|---|---|---|---|---|---|---|
| Insurance before pregnancy | Private | Medicaid | Uninsured | Total | ||||||||
| No.† | %§ | (95% CI) | No. | % | (95% CI) | No. | % | (95% CI) | No. | % | (95% CI) | |
| Private | 136 | 1.1 | (0.8–1.5) | 2,447 | 21.3 | (19.9–22.7) | 170 | 1.4 | (1.0–1.8) | 2,753 | 23.9 | (22.4–25.3) |
| Medicaid | 148 | 1.0 | (0.7–1.2) | 101 | 0.8 | (0.4–1.1) | 0.0 | 0.0 | (0.0–0.0) | 249 | 1.8 | (1.3–2.2) |
| Uninsured | 486 | 4.1 | (3.4–4.8) | 7,357 | 70.2 | (68.7–71.8) | 0.0 | 0.0 | (0.0–0.0) | 7,843 | 74.4 | (72.9–75.8) |
| Total | 770 | 6.2 | (5.4–7.1) | 9,905 | 92.4 | (91.5–93.2) | 170 | 1.4 | (1.0-1.8) | 10,845 | 100.0 | (100.0–100.0) |
Abbreviation: CI = confidence interval.
Alaska, Arkansas, Colorado, Delaware, Georgia, Hawaii, Illinois, Maine, Maryland, Massachusetts, Michigan, Minnesota, Mississippi, Missouri, Nebraska, New Jersey, Ohio, Oklahoma, Oregon, Pennsylvania, Rhode Island, Tennessee, Texas, Utah, Vermont, Washington, West Virginia, Wisconsin, and Wyoming.
Unweighted sample size.
Weighted percentage.
Overall and by State
Uninsured Before Pregnancy
Among women who experienced unstable health insurance coverage around the time of pregnancy, the most common pattern of movement was from being uninsured before pregnancy to having Medicaid at delivery (n = 7,357). This shift accounted for 70.2% of all women with unstable coverage (Table 6) and for 94.5% of the women who started out with no insurance in the month before pregnancy (Table 7). Among women who were uninsured in the month before pregnancy, the prevalence of moving to Medicaid coverage by the time of delivery varied by state, ranging from 83.6% in Hawaii to 98.7% in Tennessee (Table 7).
TABLE 7.
Prevalence of private health insurance coverage or Medicaid coverage at time of delivery among women with unstable coverage who were uninsured the month before pregnancy, by state — Pregnancy Risk Assessment Monitoring System, 29 states, 2009
| Insurance at delivery | ||||||
|---|---|---|---|---|---|---|
| Private | Medicaid | |||||
| State | No.* | %† | (95% CI) | No. | % | (95% CI) |
| Total (n = 7,843) | 486 | 5.5 | (4.6–6.5) | 7,357 | 94.5 | (93.5–95.3) |
| Alaska | 25 | 12.3 | (6.6–18.1) | 183 | 87.7 | (81.9–93.4) |
| Arkansas | 14 | 3.5 | (0.9–6.0) | 338 | 96.5 | (94.0–99.1) |
| Colorado | 27 | 7.2 | (3.6–10.7) | 395 | 92.8 | (89.3–96.4) |
| Delaware | —§ | — | — | 94 | 97.6 | (94.3–100.0) |
| Georgia | 9 | 4.4 | (0.5–8.4) | 207 | 95.6 | (91.6–99.5) |
| Hawaii | 23 | 16.4 | (7.9–24.9) | 95 | 83.6 | (75.1–92.1) |
| Illinois | 9 | 2.9 | (0.9–4.8) | 313 | 97.1 | (95.2–99.1) |
| Maine | 15 | 10.1 | (4.1–16.2) | 128 | 89.9 | (83.8–95.9) |
| Maryland | 12 | 2.4 | (0.1–4.7) | 170 | 97.6 | (95.3–99.9) |
| Massachusetts | 10 | 8.0 | (1.3–14.6) | 83 | 92.0 | (85.4–98.7) |
| Michigan | 19 | 7.0 | (3.4–10.6) | 245 | 93.0 | (89.4–96.6) |
| Minnesota | 12 | 10.2 | (4.2–16.2) | 141 | 89.8 | (83.8–95.8) |
| Mississippi | 10 | 3.3 | (1.1–5.6) | 413 | 96.7 | (94.4–98.9) |
| Missouri | 16 | 3.7 | (1.5–5.9) | 326 | 96.3 | (94.1–98.5) |
| Nebraska | 27 | 9.0 | (5.3–12.6) | 419 | 91.0 | (87.4–94.7) |
| New Jersey | 20 | 10.2 | (5.6–14.8) | 147 | 89.8 | (85.2–94.4) |
| Ohio | 13 | 8.7 | (3.4–14.0) | 173 | 91.3 | (86.0–96.6) |
| Oklahoma | 24 | 3.5 | (1.3–5.8) | 650 | 96.5 | (94.2–98.7) |
| Oregon | 25 | 5.8 | (2.1–9.5) | 412 | 94.2 | (90.5–97.9) |
| Pennsylvania | 15 | 10.2 | (4.5–15.8) | 109 | 89.8 | (84.2–95.5) |
| Rhode Island | 15 | 6.0 | (1.9–10.1) | 182 | 94.0 | (89.9–98.1) |
| Tennessee | — | — | — | 121 | 98.7 | (96.2–100.0) |
| Texas | 18 | 4.3 | (1.8–6.8) | 403 | 95.7 | (93.2–98.2) |
| Utah | 31 | 12.2 | (7.7–16.7) | 297 | 87.8 | (83.3–92.3) |
| Vermont | 8 | 7.1 | (2.1–12.1) | 115 | 92.9 | (87.9–97.9) |
| Washington | 22 | 6.9 | (3.2–10.7) | 380 | 93.1 | (89.3–96.8) |
| West Virginia | 25 | 7.5 | (4.5–10.6) | 487 | 92.5 | (89.4–95.5) |
| Wisconsin | 12 | 8.8 | (3.0–14.7) | 133 | 91.2 | (85.3–97.0) |
| Wyoming | 27 | 12.6 | (7.5–17.7) | 198 | 87.4 | (82.3–92.5) |
Abbreviation: CI = confidence interval.
Unweighted sample size.
Weighted percentage.
Estimates not presented for cell sizes of five or fewer.
The remaining 5.5% of women who started out uninsured before pregnancy reported private coverage at time of delivery. The prevalence of moving from no coverage to private coverage ranged from 2.4% in Maryland to 16.4% in Hawaii (Table 7). No women with unstable coverage who started out without insurance in the month before pregnancy reported being uninsured at the time of delivery.
Private Insurance Before Pregnancy
The second most common type of movement among women who experienced unstable coverage was from private insurance during the month before pregnancy to Medicaid coverage at delivery (n = 2,447). This shift accounted for 21.3% of all women with unstable coverage (Table 6) and for 89.4% of 2,753 women who started out with private coverage (Table 8). Among women with unstable coverage, the prevalence of moving from private insurance before pregnancy to Medicaid at delivery ranged from 70.3% in Wyoming to 98.1% in Tennessee (Table 8). Numbers for movement from private insurance before pregnancy to private insurance or no insurance coverage at delivery were insufficient to report by state.
TABLE 8.
Prevalence of Medicaid coverage at time of delivery among women with unstable coverage who had private health insurance coverage the month before pregnancy, by state — Pregnancy Risk Assessment Monitoring System, 29 states, 2009
| Medicaid insurance at delivery | |||
|---|---|---|---|
| State | No.* | %† | (95% CI) |
| Total (n = 2,753) | 2,447 | 89.4 | (87.3–91.5) |
| Alaska | 54 | 93.6 | (86.4–100.0) |
| Arkansas | 71 | 74.8 | (62.3–87.2) |
| Colorado | 82 | 78.5 | (68.4–88.7) |
| Delaware | 60 | 95.6 | (90.2–100.0) |
| Georgia | 73 | 92.1 | (83.5–100.0) |
| Hawaii | 120 | 86.3 | (78.1–94.5) |
| Illinois | 85 | 92.3 | (85.9–98.7) |
| Maine | 49 | 94.0 | (86.0–100.0) |
| Maryland | 69 | 89.4 | (77.5–100.0) |
| Massachusetts | 62 | 94.0 | (87.7–100.0) |
| Michigan | 117 | 88.8 | (82.0–95.5) |
| Minnesota | 47 | 90.5 | (81.4–99.6) |
| Mississippi | 175 | 92.8 | (87.8–97.8) |
| Missouri | 90 | 93.7 | (87.5–99.8) |
| Nebraska | 140 | 78.7 | (70.8–86.5) |
| New Jersey | 54 | 93.5 | (86.6–100.0) |
| Ohio | 105 | 91.4 | (82.9–99.9) |
| Oklahoma | 146 | 80.8 | (70.4–91.2) |
| Oregon | 113 | 94.9 | (88.6–100.0) |
| Pennsylvania | 39 | 94.9 | (88.5–100.0) |
| Rhode Island | 86 | 94.6 | (88.9–100.0) |
| Tennessee | 54 | 98.1 | (94.2–100.0) |
| Texas | 97 | 83.5 | (75.1–92.0) |
| Utah | 86 | 85.9 | (78.4–93.5) |
| Vermont | 51 | 82.3 | (70.1–94.5) |
| Washington | 104 | 97.1 | (94.8–99.4) |
| West Virginia | 109 | 93.7 | (88.1–99.3) |
| Wisconsin | 51 | 89.4 | (79.0–99.8) |
| Wyoming | 58 | 70.3 | (57.9–82.7) |
Abbreviation: CI = confidence interval.
Unweighted sample size.
Weighted percentage.
Medicaid Before Pregnancy
A small group of women, 1.8% of all women in the unstable group (n = 249), started with Medicaid in the month before pregnancy (Table 6). Among these women, 54.9% reported private coverage at delivery, 40.5% reported Medicaid coverage at delivery, and none reported being uninsured at delivery. Sample sizes were too small to provide reliable estimates by state.
By Maternal Characteristics
Uninsured Before Pregnancy
Among women who moved from no insurance before pregnancy to private insurance at delivery, the majority were aged 20–34 years, were white, had more than a high school education, were married, had incomes ≤200% of the FPL, entered prenatal care in the first trimester, were multiparous, or reported an unintended pregnancy. In contrast, among women who were uninsured in the month before pregnancy and reported Medicaid coverage at delivery, the majority were young (aged ≤25 years), were non-white (black, Hispanic, AI/AN, or other), had a high school education or less, or were unmarried (Table 9).
TABLE 9.
Prevalence of private insurance or Medicaid coverage at delivery among women with unstable insurance who were uninsured the month before pregnancy, by selected maternal characteristics — Pregnancy Risk Assessment Monitoring System, 29 states,* 2009
| Insurance at delivery | ||||||||
|---|---|---|---|---|---|---|---|---|
| Private | Medicaid | |||||||
| Characteristic | No.† | %§ | (95% CI) | No. | % | (95% CI) | AOR¶ | (95% CI) |
| Age (yrs) | ||||||||
| ≤19 | 30 | 3.8 | (1.5–6.1) | 822 | 12.4 | (10.9–14.0) | —** | —** |
| 20–25 | 200 | 39.8 | (30.9–48.7) | 3,418 | 46.3 | (44.1–48.6) | —** | —** |
| 26–34 | 211 | 48.7 | (39.6–57.8) | 2,496 | 33.4 | (31.3–35.5) | —** | —** |
| ≥35 | 45 | 7.7 | (4.2–11.2) | 621 | 7.9 | (6.6–9.1) | —** | —** |
| Race/Ethnicity | ||||||||
| White, non-Hispanic | 286 | 60.4 | (55.0–65.7) | 3,344 | 44.5 | (43.2–45.9) | Ref. | Ref. |
| Black, non-Hispanic | 50 | 10.4 | (6.4–14.5) | 1,208 | 14.8 | (13.7–15.8) | 1.2 | (0.7–2.3) |
| Hispanic | 73 | 21.6 | (18.0–25.1) | 1,900 | 35.4 | (34.2–36.6) | 1.3 | (0.7–2.7) |
| American Indian/Alaska Native | 15 | 0.4 | (0.3–0.4) | 352 | 1.2 | (0.9–1.4) | 3.6 | (1.7–7.8) |
| Other | 63 | 7.2 | (3.8–10.6) | 505 | 4.0 | (3.3–4.7) | 1.0 | (0.6–2.0) |
| Education | ||||||||
| <High school | 37 | 8.6 | (4.0–13.1) | 1,973 | 27.5 | (25.5–29.5) | 3.4 | (1.6–7.2) |
| High school | 155 | 26.1 | (18.6–33.5) | 2,946 | 42.9 | (40.6–45.2) | 3.0 | (1.9–4.7) |
| >High school | 285 | 65.4 | (57.2–73.5) | 2,336 | 29.6 | (27.8–31.5) | Ref. | Ref. |
| Marital status | ||||||||
| Married | 355 | 72.4 | (64.6–80.2) | 2,852 | 37.4 | (35.3–39.6) | Ref. | Ref. |
| Not married | 131 | 27.6 | (19.8–35.4) | 4,494 | 62.6 | (60.4–64.7) | 4.1 | (2.7–6.2) |
| Federal poverty level | ||||||||
| ≤200% | 247 | 55.0 | (45.5–64.6) | 6,023 | 89.8 | (88.4–91.1) | 5.6 | (3.7–8.5) |
| >200% | 206 | 45.0 | (35.4–54.5) | 711 | 10.2 | (8.9–11.6) | Ref. | Ref. |
| Prenatal care initiation | ||||||||
| First trimester | 342 | 71.5 | (63.4–79.7) | 4,971 | 64.1 | (61.9–66.4) | —** | —** |
| Later | 135 | 28.5 | (20.3–36.6) | 2,233 | 35.9 | (33.6–38.1) | —** | —** |
| Delivery location | ||||||||
| Hospital | 486 | 100.0 | (100.0–100.0) | 7,328 | 99.7 | (99.5–100.0) | —†† | —†† |
| Residence | —§§ | —§§ | —§§ | 22 | 0.3 | (0.0–0.5) | —†† | —†† |
| Parity | ||||||||
| Primiparous | 246 | 48.0 | (40.2–55.7) | 3,294 | 43.2 | (41.0–45.4) | —** | —** |
| Multiparous | 238 | 52.0 | (44.3–59.8) | 4,025 | 56.8 | (54.6–59.0) | —** | —** |
| Pregnancy intention | ||||||||
| Intended | 220 | 46.3 | (38.1–54.6) | 3,179 | 42.6 | (40.4–44.8) | Ref. | Ref. |
| Unintended | 252 | 53.7 | (45.4–61.9) | 4,050 | 57.4 | (55.2–59.6) | 0.7 | (0.4–1.0) |
Abbreviations: AOR = adjusted odds ratio; CI = confidence interval; Ref. = reference.
Alaska, Arkansas, Colorado, Delaware, Georgia, Hawaii, Illinois, Maine, Maryland, Massachusetts, Michigan, Minnesota, Mississippi, Missouri, Nebraska, New Jersey, Ohio, Oklahoma, Oregon, Pennsylvania, Rhode Island, Tennessee, Texas, Utah, Vermont, Washington, West Virginia, Wisconsin, and Wyoming.
Unweighted sample size.
Weighted percentage.
AOR comparing characteristics of women with Medicaid coverage at delivery with those with private coverage at delivery, among those who were uninsured before pregnancy.
AOR not presented because findings were not significant in the unadjusted and adjusted models.
Estimates unreliable because of small cell size.
Estimates not presented for cell sizes of five or fewer.
Multinomial logistic regression was used to assess differences in maternal characteristics among the women who had private insurance and women who had Medicaid at delivery among those who were uninsured in the month before pregnancy. Women who were AI/AN compared with white, had a high school education or less compared with more than a high school education, were unmarried compared with married, or had incomes ≤200% FPL compared with >200% of the FPL had higher odds of reporting Medicaid coverage at the time of delivery than private insurance at delivery. No difference was found in the odds of reporting an unintended pregnancy (Table 9).
Private Insurance Before Pregnancy
Among women who started with private insurance before pregnancy, the most common pattern of movement was moving to Medicaid at delivery. Nearly two thirds (61.3%) of these women were aged ≤25 years, and more than half (55.4%) were white, followed by 22.3% black and 16.7% Hispanic. Almost half (45.4%) had more than a high school education, nearly two thirds were unmarried (64.8%), approximately three fourths (74.2%) had incomes ≤200% of the FPL, and 77.8% entered prenatal care in the first trimester. In addition, over half of the women were primiparous (55.7%) and 62% of the women reported an unintended pregnancy (Table 10).
TABLE 10.
Prevalence of private health insurance, Medicaid, or no health insurance at delivery among women with unstable insurance who had private insurance before pregnancy, by selected maternal characteristics — Pregnancy Risk Assessment Monitoring System, 29 states,* 2009
| Private | Medicaid | Uninsured | |||||||||||
|---|---|---|---|---|---|---|---|---|---|---|---|---|---|
| Characteristic | No.† | %§ | (95% CI) | AOR¶ | (95% CI) | No. | % | (95% CI) | AOR** | (95% CI) | No. | % | (95% CI) |
| Age (yrs) | |||||||||||||
| ≤19 | 31 | 18.2 | (9.8–26.7) | 3.5 | (0.6–19.6) | 546 | 22.1 | (19.0–25.1) | 7.2 | (1.7–30.6) | 13 | 3.8 | (1.2–6.3) |
| 20–25 | 35 | 27.6 | (15.1–40.1) | 1.1 | (0.3–4.1) | 934 | 39.2 | (35.6–42.8) | 3.8 | (1.4–10.3) | 45 | 27.8 | (14.9–40.8) |
| 26–34 | 45 | 32.7 | (19.7–45.6) | 0.9 | (0.3–3.3) | 767 | 31.3 | (27.9–34.6) | 2.6 | (1.0–6.3) | 85 | 46.4 | (33.4–59.4) |
| ≥35 | 25 | 21.5 | (15.2–27.9) | Ref. | Ref. | 200 | 7.5 | (5.5–9.5) | Ref. | Ref. | 27 | 22.0 | (12.2–31.7) |
| Race/Ethnicity | |||||||||||||
| White, non- Hispanic | 50 | 40.4 | (27.0–53.7) | Ref. | Ref. | 1,125 | 55.4 | (52.5–58.3) | Ref. | Ref. | 115 | 75.2 | (64.6–85.8) |
| Black, non- Hispanic | 34 | 26.3 | (19.9–32.8) | 10.4 | (2.8–37.9) | 619 | 22.3 | (20.1–24.4) | 5.2 | (2.0–14.0) | 12 | 5.6 | (4.0–7.2) |
| Hispanic | 19 | 17.7 | (11.5–23.8) | 8.4 | (1.6–45.9) | 355 | 16.7 | (14.3–19.0) | 5.8 | (1.9–17.6) | 13 | 4.0 | (2.0–6.0) |
| American Indian/Alaska Native | 8 | 2.0 | (0.6–3.3) | 0.4 | (0.1–2.1) | 89 | 0.9 | (0.5–1.2) | 0.1 | (0.0–0.3) | 11 | 4.8 | (1.3–8.2) |
| Other | 23 | 13.6 | (2.8–24.5) | 3.2 | (0.7–15.5) | 240 | 4.8 | (3.5–6.0) | 0.8 | (0.2–2.6) | 16 | 10.4 | (0.5–20.3) |
| Education | |||||||||||||
| <High school | 30 | 21.3 | (6.9–35.7) | —†† | —†† | 462 | 18.7 | (15.8–21.6) | —†† | —†† | 14 | 5.0 | (3.2–6.7) |
| High school | 37 | 26.7 | (12.5–41.0) | —†† | —†† | 869 | 35.9 | (32.3–39.5) | —†† | —†† | 36 | 14.4 | (10.0–18.9) |
| >High school | 66 | 52.0 | (38.8–65.1) | —†† | —†† | 1,080 | 45.4 | (41.7–49.0) | —†† | —†† | 116 | 80.6 | (75.8–85.4) |
| Marital status | |||||||||||||
| Married | 68 | 45.6 | (32.2–58.9) | Ref. | Ref. | 906 | 35.2 | (31.9–38.5) | Ref. | Ref. | 131 | 81.5 | (72.7–90.2) |
| Not married | 67 | 54.4 | (41.1–67.8) | 2.3 | (0.9–6.0) | 1,537 | 64.8 | (61.5–68.1) | 3.1 | (1.4–6.6) | 39 | 18.5 | (9.8–27.3) |
| Federal poverty level | |||||||||||||
| ≤200% | 65 | 59.4 | (46.7–72.0) | 1.7 | (0.7–4.3) | 1,697 | 74.2 | (70.9–77.5) | 3.3 | (1.7–6.2) | 57 | 36.3 | (25.7–47.0) |
| >200% | 53 | 40.6 | (28.0–53.3) | Ref. | Ref. | 536 | 25.8 | (22.5–29.1) | Ref. | Ref. | 100 | 63.7 | (53.0–74.3) |
| Prenatal care initiation | |||||||||||||
| First trimester | 97 | 69.3 | (56.7–81.8) | —†† | —†† | 1,846 | 77.8 | (74.9–80.7) | —†† | —†† | 143 | 82.6 | (70.7–94.5) |
| Later | 37 | 30.7 | (18.2–43.3) | —†† | —†† | 552 | 22.2 | (19.3–25.1) | —†† | —†† | 23 | 17.4 | (5.5–29.3) |
| Delivery location | |||||||||||||
| Hospital | 135 | 99.9 | (99.8–100.0) | —§§ | —§§ | 2,435 | 99.6 | (99.3–99.9) | —§§ | —§§ | 139 | 84.2 | (75.8–92.7) |
| Residence | —¶¶ | —¶¶ | —¶¶ | —§§ | —§§ | 11 | 0.4 | (0.1–0.7) | —§§ | —§§ | 30 | 15.8 | (7.3–24.2) |
| Parity | |||||||||||||
| Primiparous | 64 | 42.8 | (33.8–51.8) | —†† | —†† | 1,353 | 55.7 | (52.0–59.3) | —†† | —†† | 72 | 42.9 | (31.3–54.6) |
| Multiparous | 70 | 57.2 | (48.2–66.2) | —†† | —†† | 1,086 | 44.3 | (40.7–48.0) | —†† | —†† | 94 | 57.1 | (45.6–68.7) |
| Pregnancy intention | |||||||||||||
| Intended | 62 | 58.3 | (50.4–66.2) | —†† | —†† | 956 | 38.0 | (34.5–41.6) | —†† | —†† | 95 | 60.0 | (48.0–72.0) |
| Unintended | 73 | 41.7 | (33.8–49.6) | —†† | —†† | 1,450 | 62.0 | (58.4–65.5) | —†† | —†† | 71 | 40.0 | (28.0–52.0) |
Abbreviations: AOR = adjusted odds ratio; CI = confidence interval; Ref. = reference.
Alaska, Arkansas, Colorado, Delaware, Georgia, Hawaii, Illinois, Maine, Maryland, Massachusetts, Michigan, Minnesota, Mississippi, Missouri, Nebraska, New Jersey, Ohio, Oklahoma, Oregon, Pennsylvania, Rhode Island, Tennessee, Texas, Utah, Vermont, Washington, West Virginia, Wisconsin, and Wyoming.
Unweighted sample size.
Weighted percentage.
AOR comparing characteristics of women who had private coverage at delivery compared with those who were uninsured, among those who started out with private coverage before pregnancy.
AOR comparing characteristics of women who had Medicaid coverage at delivery compared with those who were uninsured, among those who started out with private coverage before pregnancy.
AOR not presented because findings were not significant in the unadjusted and adjusted models.
Estimates unreliable because of small cell size.
Estimates not presented for cell size of five or fewer.
A small percentage (1.1%) of women who started out with private insurance in the month before pregnancy returned to private insurance at delivery (Table 6). Most of these women were aged ≥26 years (54.2%) and reported an intended pregnancy (58.3%) but were otherwise similar to the group reporting Medicaid at delivery: the majority were unmarried (54.4%), had more than a high school education (52.0%), and had received first trimester prenatal care (69.3%) (Table 10).
Another small group of women who started with private insurance in the month before pregnancy reported no insurance at delivery (1.4%–Table 6). Most of these women were aged ≥26 years (68.4%), were white (75.2%), had more than a high school education (80.6%), were married (81.5%), had incomes >200% of the FPL (63.7%), had received first trimester prenatal care (82.6%), were multiparous (57.1%), and reported intended pregnancies (60.0%). Among women who moved from private insurance before pregnancy to no insurance at delivery, 15.8% gave birth at a residence rather than a medical facility (Table 10).
To understand differences among women who ended up uninsured rather than with private insurance or Medicaid coverage, multinomial logistic regression was used. Characteristics of women who started with private insurance but had no insurance at delivery were different from those who started with private insurance and ended up either back on private insurance or with Medicaid at delivery. Women who were aged ≤25 years compared with those aged ≥35 years, were black or Hispanic compared with white, were unmarried compared with married, or had incomes ≤200% FPL compared with >200% of FPL had higher odds of reporting Medicaid insurance at delivery than no insurance; however, AI/AN women had lower odds of reporting Medicaid insurance than no insurance at delivery. Black or Hispanic women compared with white were more likely to report private insurance than no insurance at delivery (Table 10).
Medicaid Before Pregnancy
A small percentage of women (1.0%) moved from Medicaid in the month before pregnancy to private insurance at delivery (Table 6). Of these women, 63.4% were aged ≤25 years, 61.9% were white, 21.5% were black, 44.8% had more than a high school education, 72.3% had incomes ≤200% FPL, 83.9% reported first trimester prenatal care, 67.5% were multiparous, and 58.0% reported an unintended pregnancy. Among women who had Medicaid before pregnancy, experienced instability, and returned to Medicaid coverage at delivery, 69.6% were aged ≤25 years (30.5% aged ≤19 years), 45.3% were Hispanic, 85.7% had a high school education or less, 71.2% were unmarried, 96.9% had incomes ≤200% of the FPL, 57.4% were multiparous, and 56.8% reported an unintended pregnancy. Because of small sample sizes, a regression analysis was not conducted to examine difference among these groups (Table 11).
TABLE 11.
Prevalence of private insurance or Medicaid at delivery among women with unstable insurance who had Medicaid coverage the month before pregnancy, by selected maternal characteristics — Pregnancy Risk Assessment Monitoring System, 29 states,* 2009
| Insurance at delivery | ||||||
|---|---|---|---|---|---|---|
| Private | Medicaid | |||||
| Characteristics | No.† | %§ | (95% CI) | No. | % | (95% CI) |
| Age (yrs) | ||||||
| ≤19 | 21 | 16.3 | (10.1–22.4) | 23 | 30.5 | (1.9–59.1) |
| 20–25 | 58 | 47.1 | (35.2–58.9) | 39 | 39.1 | (10.5–67.8) |
| 26–34 | 58 | 31.1 | (20.9–41.3) | 34 | 26.5 | (13.8–39.1) |
| ≥35 | 11 | 5.6 | (0.4–10.7) | —¶ | — | — |
| Race/Ethnicity | ||||||
| White, non-Hispanic | 65 | 61.9 | (53.1–70.6) | 15 | 20.3 | (7.8–32.8) |
| Black, non-Hispanic | 36 | 21.5 | (15.9–27.2) | 32 | 29.0 | (17.5–40.6) |
| Hispanic | 16 | 6.6 | (4.9–8.3) | 33 | 45.3 | (41.1–49.4) |
| American Indian/Alaska Native | 9 | 1.2 | (1.0–1.5) | 9 | 1.6 | (1.3–2.0) |
| Other | 20 | 8.8 | (1.7–15.9) | 8 | 3.7 | (1.2–6.3) |
| Education | ||||||
| <High school | 39 | 30.1 | (23.9–36.3) | 48 | 67.0 | (56.2–77.8) |
| High school | 47 | 25.2 | (13.3–37.0) | 27 | 18.7 | (13.3–24.1) |
| >High school | 61 | 44.8 | (32.0–57.6) | 23 | 14.3 | (4.7–23.8) |
| Marital status | ||||||
| Married | 70 | 46.0 | (37.0–54.9) | 34 | 28.8 | (17.9–39.7) |
| Not married | 78 | 54.0 | (45.1–63.0) | 66 | 71.2 | (60.3–82.1) |
| Federal poverty level | ||||||
| ≤200% | 109 | 72.3 | (59.7–84.8) | 81 | 96.9 | (93.2–100.0) |
| >200% | 25 | 27.7 | (15.2–40.3) | 6 | 3.1 | (0.0–6.8) |
| Prenatal care initiation | ||||||
| First trimester | 117 | 83.9 | (75.6–92.2) | 61 | 57.6 | (25.7–89.5) |
| Later | 26 | 16.1 | (7.8–24.4) | 35 | 42.4 | (10.5–74.3) |
| Delivery location | ||||||
| Hospital | 147 | 100.0 | (100.0–100.0) | 101 | 100.0 | (100.0–100.0) |
| Residence | — | — | — | — | — | — |
| Parity | ||||||
| Primiparous | 44 | 32.5 | (23.8–41.1) | 38 | 42.6 | (13.9–71.4) |
| Multiparous | 103 | 67.5 | (58.9–76.2) | 62 | 57.4 | (28.6–86.1) |
| Pregnancy intention | ||||||
| Intended | 70 | 42.0 | (33.6–50.3) | 44 | 43.2 | (14.2–72.3) |
| Unintended | 74 | 58.0 | (49.7–66.4) | 57 | 56.8 | (27.7–85.8) |
Abbreviation: CI = confidence interval.
Alaska, Arkansas, Colorado, Delaware, Georgia, Hawaii, Illinois, Maine, Maryland, Massachusetts, Michigan, Minnesota, Mississippi, Missouri, Nebraska, New Jersey, Ohio, Oklahoma, Oregon, Pennsylvania, Rhode Island, Tennessee, Texas, Utah, Vermont, Washington, West Virginia, Wisconsin, and Wyoming.
Unweighted sample size.
Weighted percentage.
Estimates not presented for cell sizes of five or fewer.
Discussion
Overall, nearly one third of women who delivered a live infant in 2009 (the year before passage of ACA) experienced changes in health insurance coverage around the time of pregnancy. Women in the changing (i.e., unstable) insurance group were different both from those who reported stable private insurance and those who reported stable Medicaid coverage. These findings suggest that women in the unstable group might be working or otherwise have incomes too high to qualify for Medicaid but too low to purchase private insurance if they do not have it through an employer, a spouse, a partner, or a parent (48,49). Overall, levels of any health insurance increased from 76.6% in the month before pregnancy to nearly 100% for prenatal care and delivery. When patterns of movement, or churning, were examined, the most common pattern was from being uninsured in the month before pregnancy to having Medicaid coverage at the time of delivery. Moving from private insurance before pregnancy to Medicaid coverage for delivery was the next most common. A small percentage of women reported other patterns of movement, such as moving from no insurance to private insurance or from private insurance to no insurance by the time of delivery.
The estimate of the percentage of women who were uninsured in the month before pregnancy (23.4%) is similar to findings from other surveys. Data from the 2008 Kaiser Family Foundation Women’s Health Survey reported that 24% of women surveyed were uninsured at the time of the survey or had been uninsured at some point within the last year (50). Data from the 2009 U.S. Census Bureau and the U.S. Bureau of Labor Statistic’s Current Population Survey (CPS) show that 20% of women aged 18–64 years were uninsured (1). Specifically, CPS estimated that a range of 21% to 29% of women aged 18–44 years were uninsured in 2009 (5). CDC’s NHIS data indicated that that 17.3% of women aged 18–64 years were uninsured in 2008, a percentage that remained unchanged from estimates in 2004 (8).
The 2008 Kaiser Women’s Health Survey reported estimates for private health insurance coverage that were slightly higher than those in this report for private insurance (61%) and lower than the estimates for Medicaid coverage (10%) among women aged 18–64 years (50). According to NHIS 2009 data for young adults aged 19–25 years, 53% reported private insurance and 15% public coverage. CPS 2009 estimates for private insurance coverage were 57% for young adults aged 18–24 years, 61% for those aged 25–34 years, and 70% for those aged 35–44 years (5). Medicaid coverage was 15% among those aged 18–24 years, 10% among those aged 25–34 years, and 9% among those aged 35–44 years, all similar to the estimates in this report among women of reproductive age who recently had a live birth.
Self-reported data were collected on women’s health insurance coverage status the month before pregnancy, during pregnancy for prenatal care, and at the time of the delivery for live-born infants in 2009, before the passage of ACA. Change in pregnancy status was a key transition point both for public and private plans before ACA. At that time, pregnant women who met certain eligibility requirements could qualify for maternity care services (prenatal and delivery) through Medicaid. In 2009, the minimum income threshold for Medicaid eligibility among pregnant women was 133% of the FPL, with flexibility to increase the requirement on a state-by-state basis (51). In 2009, only two PRAMS states in this report had a minimum eligibility threshold of 133% of the FPL (Utah and Wyoming). Two states had minimum eligibility ranging from 133% to 185% (Alaska and West Virginia), and most set the threshold from 185% to 200% of the FPL (Arkansas, Colorado, Delaware, Georgia, Hawaii, Illinois, Maine, Massachusetts, Michigan, Mississippi, Missouri, Nebraska, New Jersey, Ohio, Oklahoma, Oregon, Pennsylvania, Texas, Vermont, and Washington). The other five PRAMS states had income thresholds ranging from 250% to 300% of the FPL (Maryland, Minnesota, Rhode Island, Tennessee, and Wisconsin) (51).
Because many low-income women become eligible for Medicaid once they are pregnant, it is not surprising that the most common pattern of coverage movement found in this report was a change from being uninsured before pregnancy to having Medicaid coverage by the time of delivery. Specifically, among women who had unstable insurance, 70.2% experienced this transition; this pattern occurred in all states, regardless of the income eligibility threshold in each state. An explanation of the state-level differences in movement from no insurance before pregnancy to Medicaid at the time of delivery requires further investigation and might reflect the demographic composition of each state or the variation in state Medicaid policies (52).
The second most common type of movement was from private insurance in the month before pregnancy to Medicaid at the time of delivery. In 2009, some private health insurance plans did not include coverage for maternity services or did not cover prenatal care or hospital delivery for dependents (i.e., teenage daughters) (35,53). For women purchasing insurance, adding prenatal and delivery coverage might have been either too expensive or extremely difficult because pregnancy was considered a preexisting condition for which coverage was not available (3,35). Furthermore, even for women with coverage for maternity services through private plans, high deductibles and out-of-pocket costs also presented financial barriers (3). This might explain the reason that a substantial proportion of women (21.3%) who had unstable coverage moved from private insurance in the month before pregnancy to Medicaid by the time of delivery. Financial barriers also might be the reason that only 4.1% of women who had no insurance in the month before pregnancy obtained private insurance by the time of delivery.
Other uncommon patterns of movement might have been associated with individual situations rather than the public or private health insurance policy. A small percentage of women (1.0% of those in the unstable insurance group) started with Medicaid before pregnancy and had private insurance at delivery. These women might have secured a new job and been able to obtain private coverage through an employer or might have gotten married and been able to obtain private coverage through a spouse or partner. Another small group of women (1.1% of the unstable group) started out with private insurance and ended up with private insurance but experienced some type of change in health insurance for prenatal care. Similarly, a small percentage of women (0.8% of the unstable group) reported starting and ending with Medicaid but having different insurance coverage status during pregnancy. These might be unique situations or might reflect reporting errors about type of health insurance during prenatal care (54).
Women who had no health insurance coverage at any of the three time periods comprised a small percentage of the overall population (1.1%). In addition, a small group (1.4% of the unstable group) started off with private insurance but ended up without coverage at the time of delivery. Together, these women comprised 1.5% of the overall population. Demographically, women who had no coverage at any point shared characteristics both with the stable private group (approximately half were aged ≥26 years, were white, were married, and reported an intended pregnancy), as well as the stable Medicaid group (approximately two thirds had lower education levels, had lower incomes, and were multiparous). The most striking difference between the uninsured group and the other groups (unstable, stable private, and stable Medicaid) was the high percentage of women who experienced late entry into prenatal care (45.5% among the uninsured vs. 32.2%, 7.0%, and 26.4%, respectively) and out-of-hospital births (17.1% among the uninsured vs. 0.5%, 0.5%, and 0.1%, respectively).
Women who started with private insurance and ended up without insurance at the time of delivery had characteristics that were similar to women with stable private coverage. This group also had a high percentage of births occurring at a residence (15.8% among women with unstable insurance who started off with private coverage). These women might have had a private insurance plan that included prenatal care coverage but did not cover out-of-hospital births, and they might have paid the cost of the residential delivery out of pocket (55). Although this might be the explanation for the 15.8% of women who had home births, it does not explain the 84.2% of women who had hospital births and who started out with private insurance in the month before pregnancy but were uninsured at the time of delivery. Differences in Medicaid eligibility thresholds by state might be one explanation; however, state-level sample sizes for this pattern of movement were too small to analyze.
The patterns of unstable health insurance coverage around the time of pregnancy that occurred in 2009 were virtually identical to the patterns reported in a study using 1996–1999 PRAMS data (44). The analysis of PRAMS data from nine states found that 32%–35% of women experienced transitions in insurance coverage from the month before pregnancy to the time of delivery, a finding very similar to the 30% found in this report using pooled data from an additional 20 states. In addition, that study also found that the most common form of movement was from no insurance before pregnancy to Medicaid coverage at delivery (range among states: 13%–32%), followed by movement from private insurance to Medicaid coverage (range: 3%–10%). Twenty years later, a similar phenomenon is occurring: in the years since that study, PRAMS data have consistently shown lack of coverage during the prepregnancy period and nearly universal levels of coverage for prenatal care and delivery (24,56).
These baseline data collected from PRAMS in 2009 before the major policy shift that occurred with the passage of ACA in March 2010 can be used to assess the impact of the legislation on patterns of insurance coverage for women around the time of pregnancy. ACA includes provisions both to address challenges for women attempting to purchase private insurance on the individual market and provisions to address lack of coverage for low-income, nonpregnant adults (37,57). For example, in September 2010, several early market reforms for consumer protections were passed under ACA, including no lifetime dollar limits, dependent coverage to age 26, and provision of preventive services without cost-sharing (41). Another opportunity for potential improvement in insurance coverage as part of ACA includes the attempt to improve access and affordability of health insurance through market reforms and the Health Insurance Marketplace, a marketplace for individuals and small businesses to purchase more affordable insurance. Since 2014, all new individual health plans, whether inside or outside the marketplace, and all small- and large-group health plans, have been prohibited from charging higher premiums based on sex and from denying coverage based on preexisting conditions such as chronic medical problems and pregnancy (37,38).
The second opportunity for improvement in insurance coverage stability is through the expansion of Medicaid eligibility. Under ACA, states have the option to expand eligibility for Medicaid to include all persons with incomes up to 138% percent of the FPL and receive enhanced federal support to pay for the expansion (41). In states that elect to expand coverage, low-income women could benefit from continuous access to health care and preventive health services not just once they are pregnant but before and after pregnancy as well (29). This type of continuous coverage would be an important advancement for maternal and infant health and has been recommended previously (14). At the time of this report, 29 states and the District of Columbia had decided to move forward with Medicaid expansions (58).
As implementation of health care reform moves forward, the impact of state Medicaid expansions and other provisions of ACA might affect patterns of health insurance coverage for women. For example, if the factors that discouraged some women from using private insurance and moving into Medicaid coverage in 2009 once they became pregnant (e.g., exclusion of maternity coverage as a benefit from individual plans) are mitigated through ACA, the percentage of pregnant women who shift from private coverage to Medicaid might decrease. As a state-based surveillance system, PRAMS data can be used to assess changes in women’s health insurance coverage around the time of pregnancy at the state level. Future studies might use the 2009 data in this report as a baseline measure when assessing differences in the implementation of ACA as it relates to coverage for pregnancy services.
Limitations
The findings in this report are subject to at least three limitations. First, because PRAMS data are not available from all states, the results of this report are not generalizable to the entire United States. Second, the information on insurance coverage status was self-reported by the PRAMS respondents several months after delivery; the majority of women responded within 3–6 months after delivery. Therefore, some women might not have been able to recall their insurance coverage. In addition, some of the women might not have been aware of the type of coverage they had, particularly if they qualified for emergency Medicaid only at delivery. However, previous studies comparing the PRAMS survey data to birth certificate and medical records data report high correlation in terms of accurately reporting Medicaid coverage at delivery (59,60). Finally, broad categories were used for insurance coverage; specifically, women with military insurance coverage were categorized as part of the private insurance group, and women reporting IHS coverage were categorized as part of the uninsured group. On the questionnaire, women who selected the IHS insurance response might be reporting either receipt of services at an IHS facility or receipt of contract health service funding from IHS, the latter of which is most similar to being uninsured (61).
Conclusion
One of the goals of PRAMS is to provide state-level data on women’s health before, during, and shortly after pregnancy that can be used by health agencies, researchers, and policy makers to monitor trends in health indicators and identify priorities for public health action. PRAMS data have been used to gain support for a wide range of programs and initiatives aimed at improving the health of women and infants around the time of pregnancy (62). This report highlights findings from 2009 PRAMS data on health insurance coverage among women who delivered live infants before passage of ACA. With the passage of the ACA in 2010, women who were previously uninsured or had insurance that did not provide adequate coverage might experience better access to health services and better coverage. Changes in health insurance patterns after passage of ACA can be assessed and monitored using PRAMS state-specific baseline estimates from 2009.
Acknowledgments
Anjali Gupta, PhD, and the PRAMS working group: Alabama: Izza Afgan, MPH; Alaska: Kathy Perham-Hester, MS, MPH; Arkansas: Mary McGehee, PhD; Colorado: Alyson Shupe, PhD; Connecticut: Jennifer Morin, MPH; Delaware: George Yocher, MS; Florida: Avalon Adams-Thames, MPH; Georgia: Chinelo Ogbuanu, MD, PhD; Hawaii: Emily Roberson, MPH; Illinois: Theresa Sandidge, MA; Iowa: Sarah Mauch, MPH; Louisiana: Amy Zapata, MPH; Maine: Tom Patenaude, MPH; Maryland: Diana Cheng, MD; Massachusetts: Emily Lu, MPH; Michigan: Cristin Larder, MS; Minnesota: Judy Punyko, PhD; Mississippi: Brenda Hughes, MPPA; Missouri: Venkata Garikapaty, PhD; Montana: JoAnn Dotson; Nebraska: Brenda Coufal; New Hampshire: David J. Laflamme, PhD; New Jersey: Lakota Kruse, MD; New Mexico: Eirian Coronado, MA; New York State: Anne Radigan-Garcia; New York City, New York: Candace Mulready-Ward, MPH; North Carolina: Kathleen Jones-Vessey, MS; North Dakota: Sandra Anseth; Ohio: Connie Geidenberger PhD; Oklahoma: Alicia Lincoln, MSW, MSPH; Oregon: Kenneth Rosenberg, MD; Pennsylvania: Tony Norwood; Rhode Island: Sam Viner-Brown, PhD; South Carolina: Mike Smith, MSPH; Texas: Rochelle Kingsley, MPH; Tennessee: David Law, PhD; Utah: Lynsey Gammon, MPH; Vermont: Peggy Brozicevic; Virginia: Marilyn Wenner; Washington: Linda Lohdefinck; West Virginia: Melissa Baker, MA; Wisconsin: Katherine Kvale, PhD; Wyoming: Amy Spieker, MPH; CDC PRAMS Team, Applied Sciences Branch, Division of Reproductive Health.
References
- 1.The Henry J. Kaiser Family Foundation. Women’s health policy: women’s health insurance coverage fact sheet. Washington, DC: The Henry J. Kaiser Family Foundation; 2010. Available at http://kff.org/womens-health-policy/fact-sheet/womens-health-insurance-coverage-fact-sheet. [Google Scholar]
- 2.Glied S, Jack K, Rachlin J. Women’s health insurance coverage 1980–2005. Womens Health Issues 2008;18:7–16. [DOI] [PubMed] [Google Scholar]
- 3.Robertson R, Collins SR. Women at risk: why increasing numbers of women are failing to get the health care they need and how the Affordable Care Act will help. New York, NY: The Commonwealth Fund; 2011. Available at http://www.commonwealthfund.org/publications/issue-briefs/2011/may/women-at-risk. [PubMed] [Google Scholar]
- 4.The Henry J. Kaiser Family Foundation. Examining racial and ethnic disparities at the state level. Putting women’s health care disparities on the map. Washington, DC: The Henry J. Kaiser Family Foundation; 2009. [Google Scholar]
- 5.DeNavas-Walt C, Proctor BD, Smith JC. Income, poverty, and health insurance coverage in the United States 2012. Washington DC: US Census Bureau; 2013. Available at http://www.census.gov. [Google Scholar]
- 6.Callahan ST, Cooper WO. Uninsurance and health care access among young adults in the United States. Pediatrics 2005;116:88–95. [DOI] [PubMed] [Google Scholar]
- 7.Bloom B, Cohen RA. Young adults seeking medical care: do race and ethnicity matter? NCHS Data Brief, No. 55 Hyattsville, MD: National Center for Health Statistics; 2011. [PubMed] [Google Scholar]
- 8.Moonesinghe R, Zhu J, Truman BI. Health insurance coverage—United States, 2004 and 2008. MMWR Suppl 2011;60(Suppl):35–7. [PubMed] [Google Scholar]
- 9.Fox JB, Richards CL. Vital signs: health insurance coverage and health care utilization—United States, 2006–2009 and January–March 2010. MMWR Morb Mortal Wkly Rep 2010;59:1448–54. [PubMed] [Google Scholar]
- 10.Institute of Medicine. America’s uninsured crisis: consequences for health and health care. Washington, DC: The National Academies Press; 2009. Available at http://www.iom.edu/Reports/2009/Americas-Uninsured-Crisis-Consequences-for-Health-and-Health-Care.aspx. [PubMed] [Google Scholar]
- 11.McWilliams JM. Health consequences of uninsurance among adults in the United States: recent evidence and implications. Milbank Q 2009;87:443–94. [DOI] [PMC free article] [PubMed] [Google Scholar]
- 12.Ahluwalia IB, Bolen J, Garvin B. Health insurance coverage and use of selected preventive services by working-age women, BRFSS, 2006. J Womens Health (Larchmt) 2007;16:935–40. [DOI] [PubMed] [Google Scholar]
- 13.Institute of Medicine. A shared destiny: community effects of uninsurance. Washington, DC: The National Academies Press; 2003. Available at https://www.iom.edu/~/media/Files/Report%20Files/2003/A-Shared-Destiny-Community-Effects-of-Uninsurance/Uninsured4final.pdf. [PubMed] [Google Scholar]
- 14.Johnson K, Posner SF, Biermann J, et al. Recommendations to improve preconception health and health care—United States. A report of the CDC/ATSDR preconception care work group and the select panel on preconception care. MMWR Recomm Rep 2006;55(RR-6). [PubMed] [Google Scholar]
- 15.Korenbrot CC, Steinberg A, Bender C, Newberry S. Preconception care: a systematic review. Matern Child Health J 2002;6:75–88. [DOI] [PubMed] [Google Scholar]
- 16.Roland JM, Murphy HR, Ball V, Northcote-Wright J, Temple RC. The pregnancies of women with Type 2 diabetes: poor outcomes but opportunities for improvement. Diabet Med 2005;22:1774–7. [DOI] [PubMed] [Google Scholar]
- 17.Roberts JM, Pearson G, Cutler J, Lindheimer M; NHLBI Working Group on Research on Hypertension During Pregnancy. Summary of the NHLBI Working Group on Research on Hypertension During Pregnancy. Hypertension 2003;41:437–45. [DOI] [PubMed] [Google Scholar]
- 18.McTigue KM, Harris R, Hemphill B, et al. Screening and interventions for obesity in adults: summary of the evidence for the U.S. Preventive Services Task Force. Ann Intern Med 2003;139:933–49. [DOI] [PubMed] [Google Scholar]
- 19.American College of Obstetricians and Gynecologists. ACOG Practice Bulletin. Clinical management guidelines for obstetrician-gynecologists. Thyroid disease in pregnancy. Obstet Gynecol 2002;100:387–96. [DOI] [PubMed] [Google Scholar]
- 20.Barrett C, Richens A. Epilepsy and pregnancy: Report of an Epilepsy Research Foundation Workshop. Epilepsy Res 2003;52:147–87. [DOI] [PubMed] [Google Scholar]
- 21.US Preventive Services Task Force. Screening for syphilis infection in pregnancy: U.S. Preventive Services Task Force reaffirmation recommendation statement. Ann Intern Med 2009;150:705–9. [DOI] [PubMed] [Google Scholar]
- 22.Markus AR, Rosenbaum S. The role of Medicaid in promoting access to high-quality, high-value maternity care. Womens Health Issues 2010;20(Suppl):S67–78. [DOI] [PubMed] [Google Scholar]
- 23.Rosenberg D, Handler A, Rankin KM, Zimbeck M, Adams EK. Prenatal care initiation among very low-income women in the aftermath of welfare reform: does pre-pregnancy Medicaid coverage make a difference? Matern Child Health J 2007;11:11–7. [DOI] [PubMed] [Google Scholar]
- 24.CDC. Pregnancy Risk Assessment Monitoring System: PRAMStat. US Department of Health and Human Services, CDC; 2014. Available at http://www.cdc.gov/prams. [Google Scholar]
- 25.Lauderdale DS, Vanderweele TJ, Siddique J, Lantos JD. Prenatal care utilization in excess of recommended levels: trends from 1985 to 2004. Med Care Res Rev 2010;67:609–22. [DOI] [PubMed] [Google Scholar]
- 26.Magriples U, Kershaw TS, Rising SS, Massey Z, Ickovics JR. Prenatal health care beyond the obstetrics service: utilization and predictors of unscheduled care. Am J Obstet Gynecol 2008;198:75.e1–7. [DOI] [PMC free article] [PubMed] [Google Scholar]
- 27.Institute of Medicine. Reducing the odds: preventing perinatal transmission of HIV in the United States. Washington, DC: National Academies Press; 1999. Available at http://www.nap.edu/catalog/6307/reducing-the-odds-preventing-perinatal-transmission-of-hiv-in-the. [PubMed] [Google Scholar]
- 28.Centers for Medicare and Medicaid Services. Health Insurance Marketplace. Pregnant women: health coverage if you’re pregnant or plan to get pregnant. Washington, DC: Centers for Medicare and Medicaid Services, US Department of Health and Human Services; 2015. Available at https://www.healthcare.gov/what-if-im-pregnant-or-plan-to-get-pregnant. [Google Scholar]
- 29.Short PF, Graefe DR, Schoen C. Task Force on the Future of Health Insurance, Issue Brief. Churn, churn, churn: how instability of health insurance shapes America’s uninsured problem. New York, NY: The Commonwealth Fund; 2003. Available at http://www.commonwealthfund.org/~/media/files/publications/issue-brief/2003/nov/churn--churn--churn--how-instability-of-health-insurance-shapes-americas-uninsured-problem/short_churn_688-pdf.pdf. [PubMed] [Google Scholar]
- 30.Czajka JL. Analysis of Children’s Health Insurance Patterns: findings from the SIPP. Washington, DC: Mathematica Policy Research; 1999. Available at http://aspe.hhs.gov/health/reports/Sippchip/sippchip.pdf. [Google Scholar]
- 31.Salganicoff A, An J. Making the most of Medicaid: promoting the health of women and infants with preconception care. Womens Health Issues 2008;18(Suppl):S41–6. [DOI] [PubMed] [Google Scholar]
- 32.Sommers BD. Loss of health insurance among non-elderly adults in Medicaid. J Gen Intern Med 2009;24:1–7. [DOI] [PMC free article] [PubMed] [Google Scholar]
- 33.Schoen C, DesRoches C. Uninsured and unstably insured: the importance of continuous insurance coverage. Health Serv Res 2000;35:187–206. [PMC free article] [PubMed] [Google Scholar]
- 34.Peters HE, Simon K, Taber JR. Marital disruption and health insurance. Demography 2014;51:1397–421; Epub ahead of print. [DOI] [PubMed] [Google Scholar]
- 35.Garrett D Turning to fairness: insurance discrimination against women today and how the Affordable Care Act can help. Washington, DC: National Women’s Law Center; 2012. Available at http://www.nwlc.org/resource/report-turning-fairness-insurance-discrimination-against-women-today-and-affordable-care-ac. [Google Scholar]
- 36.Rosenbaum S. Women and health insurance: implications for financing preconception health. Womens Health Issues 2008;18(Suppl):S26–35. [DOI] [PubMed] [Google Scholar]
- 37.Sakala CUS. health care reform legislation offers major new gains to childbearing women and newborns. Birth 2010;37:337–40. [DOI] [PubMed] [Google Scholar]
- 38.Johnson KA. Women’s health and health reform: implications of the Patient Protection and Affordable Care Act. Curr Opin Obstet Gynecol 2010;22:492–7. [DOI] [PubMed] [Google Scholar]
- 39.Saleeby E, Brindis CD. Women, reproductive health, and health reform. JAMA 2011;306:1256–7. [DOI] [PubMed] [Google Scholar]
- 40.Sonfield A, Pollack HA. The Affordable Care Act and reproductive health: potential gains and serious challenges. J Health Polit Policy Law 2013;38:373–91. [DOI] [PubMed] [Google Scholar]
- 41.Keith K, Lucia KW. Implementing the Affordable Care Act: the state of the states. New York, NY: The Commonwealth Fund; 2014. Available at http://www.commonwealthfund.org/~/media/Files/Publications/Fund%20Report/2014/Jan/1727_Keith_implementing_ACA_state_of_states.pdf. [Google Scholar]
- 42.Shulman HB, Gilbert BC, Msphbrenda CG, Lansky A. The Pregnancy Risk Assessment Monitoring System (PRAMS): current methods and evaluation of 2001 response rates. Public Health Rep 2006;121:74–83. [DOI] [PMC free article] [PubMed] [Google Scholar]
- 43.CDC. Pregnancy Risk Assessment Monitoring System questionnaire. Atlanta, GA: CDC, US Department of Health and Human Services. Available at http://www.cdc.gov/prams. [Google Scholar]
- 44.Adams EK, Gavin NI, Handler A, Manning W, Raskind-Hood C. Transitions in insurance coverage from before pregnancy through delivery in nine states, 1996–1999. Health Aff (Millwood) 2003;22:219–29. [DOI] [PubMed] [Google Scholar]
- 45.Adams PF, Kirzinger WK, Martinez ME. Summary health statistics for the U.S. populations: National Health Interview Survey, 2012. Vital Health Stat 2013;10(259). [PubMed] [Google Scholar]
- 46.US Department of Health and Human Services. The 2009 federal poverty guidelines. Fed Regist 2009;74:4199–201. [Google Scholar]
- 47.SAS Institute. Base SAS 9.3 procedures guide, 2nd ed. Cary, NC: SAS Institute; 2012. [Google Scholar]
- 48.Ahluwalia IB, Bolen J, Pearson WS, Link M, Garvin W, Mokdad A. State and metropolitan variation in lack of health insurance among working-age adults, Behavioral Risk Factor Surveillance System, 2006. Public Health Rep 2009;124:34–41. [DOI] [PMC free article] [PubMed] [Google Scholar]
- 49.Fronstin P Employee Benefit Issue Research Institute (EBRI) Brief No. 376. Sources of health insurance and characteristics of the uninsured: analysis of the March 2012 Current Population Survey. Washington, DC: Employee Benefit Issue Research Institute; 2012. Available at http://www.ebri.org/pdf/briefspdf/EBRI_IB_09-2012_No376_Sources.pdf. [Google Scholar]
- 50.Ranji U, Salganicoff A. Women’s health care chartbook: key findings from the Kaiser Women’s Health Survey. Washington, DC: The Henry J. Kaiser Family Foundation; 2011. Available at http://kff.org/womens-health-policy/report/womens-health-care-chartbook-key-findings-from. [Google Scholar]
- 51.Ross DC, Marks C. Challenges of providing health coverage for children and parents in a recession: a 50 state update on eligibility rules, enrollment and renewal procedures, and cost-sharing practices in Medicaid and SCHIP in 2009. Washington, DC: The Henry J. Kaiser Family Foundation, Kaiser Commission on Medicaid and the Uninsured; 2009. Available at http://kff.org/medicaid/report/challenges-of-providing-health-coverage-for-children. [Google Scholar]
- 52.Sommers BD, Epstein AM. Medicaid expansion—the soft underbelly of health care reform? N Engl J Med 2010;363:2085–7. [DOI] [PubMed] [Google Scholar]
- 53.Andrews M Some plans deny pregnancy coverage for dependent children. Menlo Park, CA: Kaiser Health News; 2012. Available at http://khn.org/news/under-26-pregnancy-coverage-michelle-andrews-080712. [Google Scholar]
- 54.Nelson DE, Thompson BL, Davenport NJ, Penaloza LJ. What people really know about their health insurance: a comparison of information obtained from individuals and their insurers. Am J Public Health 2000;90:924–8. [DOI] [PMC free article] [PubMed] [Google Scholar]
- 55.Pray L; Board on Children, Youth, and Families. Institute of Medicine. An update on research issues in the assessment of birth settings—workshop summary. Washington, DC: National Academies Press; 2013. Available at http://www.iom.edu/Reports/2013/An-Update-on-Research-Issues-in-the-Assessment-of-Birth-Settings.aspx. [PubMed] [Google Scholar]
- 56.Ahluwalia IB, Harrison L, D’Angelo D, Morrow B. PRAMS Team. Medicaid coverage before pregnancy: Pregnancy Risk Assessment and Monitoring System (PRAMS). J Womens Health (Larchmt) 2009;18:431–4. [DOI] [PubMed] [Google Scholar]
- 57.Shaffer ER. The Affordable Care Act: the value of systemic disruption. Am J Public Health 2013;103:969–72. [DOI] [PMC free article] [PubMed] [Google Scholar]
- 58.The Henry J. Kaiser Family Foundation. Status of state action on the Medicaid expansion decision. Washington, DC: The Henry J. Kaiser Family Foundation; 2015. Available at http://kff.org/health-reform/state-indicator/state-activity-around-expanding-medicaid-under-the-affordable-care-act. [Google Scholar]
- 59.Dietz P, Bombard J, Mulready-Ward C, et al. Validation of self-reported maternal and infant health indicators in the Pregnancy Risk Assessment Monitoring System. Matern Child Health J 2014;18:2489–98; Epub ahead of print. [DOI] [PMC free article] [PubMed] [Google Scholar]
- 60.Martin JA, Wilson EC, Osterman MJ, Saadi EW, Sutton SR, Hamilton BE. Assessing the quality of medical and health data from the 2003 birth certificate revision: results from two states. Natl Vital Stat Rep 2013;62:1–19. [PubMed] [Google Scholar]
- 61.Indian Health Services. Contract Health Services Program. Rockville, MD: Indian Health Services. Available at http://www.ihs.gov/forpatients/chs. [Google Scholar]
- 62.CDC. PRAMS data to action success stories. US Department of Health and Human Services, CDC; 2013. Available at http://www.cdc.gov/prams/dta-successstories.html. [Google Scholar]