

Summary
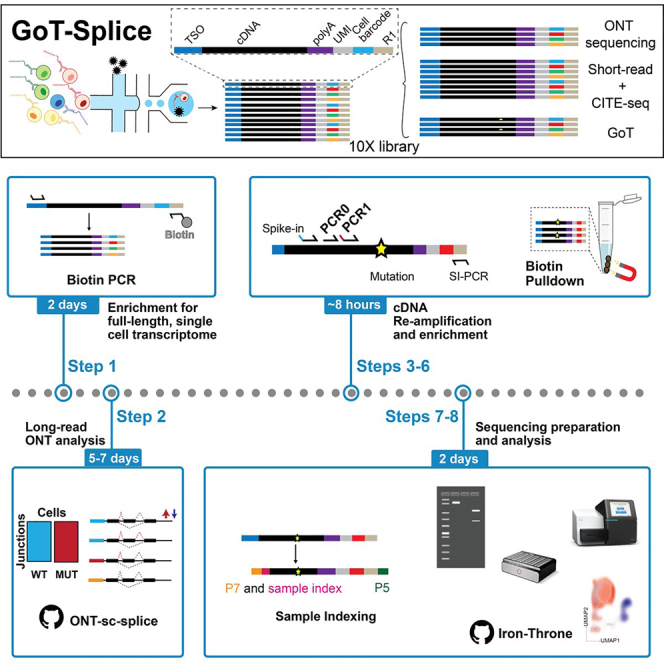
Studying RNA splicing factor mutations is challenging due to difficulties in distinguishing wild-type and mutant cells within complex human tissues and inaccuracies associated with reconstructing splicing signals from short-read sequencing data. Here, we present Genotyping of Transcriptomes (GoT)-Splice, a protocol that overcomes these limitations by combining GoT with enhanced long-read single-cell transcriptome and cell-surface proteomics profiling. We describe steps for long-read library preparation and analysis, followed by cDNA re-amplification, enrichment of mutation of interest, sample indexing, and GoT library preparation.
For complete details on the use and execution of this protocol, please refer to Cortés-López et al.1
Subject areas: Single Cell, Genomics, Sequencing, RNA-seq, Molecular Biology, Gene Expression
Graphical abstract
Highlights
-
•
GoT-Splice profiles single-cell genotype, expression, surface markers, and splicing
-
•
ONT-sc-Splice quantifies splicing junctions for comparative cell analysis
-
•
Re-amplification of 10× library cDNA, followed by sequential PCRs
-
•
Pull-down of the target locus and indexing of the sample for sequencing
Publisher’s note: Undertaking any experimental protocol requires adherence to local institutional guidelines for laboratory safety and ethics.
Studying RNA splicing factor mutations is challenging due to difficulties in distinguishing wild-type and mutant cells within complex human tissues and inaccuracies associated with reconstructing splicing signals from short-read sequencing data. Here, we present Genotyping of Transcriptomes (GoT)-Splice, a protocol that overcomes these limitations by combining GoT with enhanced long-read single-cell transcriptome and cell-surface proteomics profiling. We describe steps for long-read library preparation and analysis, followed by cDNA re-amplification, enrichment of mutation of interest, sample indexing, and GoT library preparation.
Before you begin
Timing: 2–3 days (for step 1)
This document presents an extension of the established 10× Genomics single-cell RNA-seq (scRNA-seq) technology, designed to be compatible with both single-cell 3′ and 5′ gene expression libraries. Typically, during scRNA-seq library preparation, about 25% of the produced full-length cDNA is allocated for gene expression library construction, while the remaining cDNA is stored at −20°C for long-term storage and potential future uses.
For optimal cDNA library storage conditions, it is advisable to consult 10× Genomics' guidelines. They provide detailed recommendations on how to preserve the quality of your final libraries, including appropriate temperature settings and durations. You can find this information on their official support page: https://kb.10xgenomics.com/hc/en-us/articles/360000940492-How-long-can-final-libraries-be-stored-at-20-C-.
The GoT-Splice protocol starting material is a fraction of the previously stored cDNA to amplify specific targets of interest.
GoT-Splice, as performed by Cortés-López et al.,1 consists of four components.
-
1.10× Genomics scRNA-seq short-read libraries.
-
a.As mentioned above, approximately 25% of the full-length cDNA is processed to generate single-cell 3′ or 5′ gene expression libraries.
-
b.These libraries are the final product of either the 10× Genomics Chromium Next GEM Single Cell 3′ Kit or the Chromium Next GEM Single Cell 5ʹ Kit. No alterations to the 10× Genomics protocol are necessary, except for Step 2.3 of both the 3′ and 5′ kits (cDNA Cleanup – SPRIselect step; see Chromium Single Cell 3′ Reagent Kits User Guide), where the supernatant is saved. This supernatant contains the surface antibody tags (for the CITE library); see point #2 below). Store the supernatant at 4°C for up to 72 h or at −20°C for long-term storage.
-
a.
-
2.CITE-seq libraries.
-
a.As mentioned above, the supernatant from Step 2.3 of either the Chromium Next GEM Single Cell 3′ Kit or the Chromium Next GEM Single Cell 5ʹ Kit protocol will be processed to generate a CITE-seq library. The DNA in the supernatant is enriched using SPRI beads (1.8× concentration, following the protocol mentioned below at the “cDNA Re-amplification from 10× library” step 2.1).
-
b.The enriched DNA from the supernatant will then be sample-indexed, and the libraries can be quickly visualized on a 2% agarose gel to confirm the presence of CITE-seq libraries (with approximately 200 bp bands expected).
-
c.For detailed instructions on CITE-seq library construction and sample indexing, please consult the CITE-seq protocol, available at https://citeseq.files.wordpress.com/2019/02/cite-seq_190213.pdf.
-
d.We recommend using the universal antibody panels (TotalSeq-C Human Universal Cocktail for the 5′ kit or TotalSeq-A Human Universal Cocktail for the 3′ kit) provided by BioLegend.
-
a.
When selecting a population of interest via flow cytometry using specific antibodies, it is crucial to verify that the flow cytometry antibodies and the CITE-seq antibodies do not bind to the same epitope on the antigen. If they do, it is recommended to select an alternative flow cytometry antibody for the target population (e.g., different antibody clone number).
-
3.Long-read library (ONT).
-
a.For long-read library construction, please consult the updated protocols provided by ONT, which can be found at https://nanoporetech.com/protocols_singlecell.
-
b.For higher throughput in GoT-Splice libraries, we recommend using the PromethION.
-
c.We generally recommend a biotin enrichment of the full-length cDNA to reduce amplification and sequencing of cDNA artifacts in 10× Genomics cDNA products.
-
d.We recommend starting with at least 10 ng of full-length cDNA prepared using 10× Genomics Next GEM Single Cell RNA Kits (approximately 2–4 μL).
-
a.
Detailed, step-by-step protocol to generate long-read library is described in the “Step-by-step” section 1.
-
4.
GoT library preparation.
Detailed, step-by-step protocol to generate GoT library is described in the “Step-by-step” section 2.
Optimization 1: Design and Validate Target-specific primers
The ability to capture the desired RNA target is directly related to the careful design of target-specific primers that amplify the desired amplicons.
-
5.Considerations for Primer Design:
-
a.Relation to Transcript Structure: It is imperative to assess the mutation’s relative position concerning the overall transcript structure. See points 5b and 5c below and Figure 1.
-
b.The mutation of interest should be strategically positioned 300–700 nucleotides [nt] away from the 3′ terminal end of the mRNA transcript, specifically measured from the polyA sequence. See Figure 1.
-
c.For 5′ gene expression libraries, the optimal capture of the mutation occurs when it is situated within 300–700 nt from the 5′ terminal end, measured from the first base of the 5′ UTR. See Figure 1.
-
a.
-
6.Amplification Strategy for GoT:
-
a.A hemi-nested polymerase chain reaction (PCR) will be performed to enrich the mutation site in the library.
-
b.Amplification based on expression levels:
-
i.For targets with high expression levels (expression levels as high as those of housekeeping genes [e.g., GAPDH, ACTB; Figure 2]): A single round of PCR, designated PCR1, suffices.
-
ii.For targets with moderate to low expression levels compared to housekeeping genes (e.g., CALR1, SF3B1 or DNTM3A, JAK2, respectively; Figure 2): A locus-specific spike-in primer upstream/downstream (based on the kit used) can be used to amplify the targeted transcript during the cDNA amplification step. Also, preliminary PCR round (PCR0) followed by a nested PCR round, designated PCR1, is required for adequate amplification.
-
i.
-
a.
-
7.Software Recommendations for Primer Design:
- a.
-
b.Primer Specifications:
-
i.Forward primer (3′ kit) & reverse primer (5′ kit): These should typically span 17–23 nt and target sequences either upstream or downstream from the mutation site (see Figure 1). The recommended melting temperature is in the range of 60°C–63°C with an optimal GC content of 50–55% (target regions high in GC content [> 70%] will show decrease efficiency for this protocol).
-
ii.Nested GoT Primer: The forward primer for the 3′ kit and the reverse primer for the 5′ kit should cover the mutation site within 90 nt inclusive of the primer sequence itself.
-
iii.The ideal final PCR product should be between 300–700 nt.
-
i.
-
8.
Primer Testing Protocol:
Figure 1.

Strategy for the design of cDNA Spike-in and GoT Primers applicable to both the 5′ and 3′ 10× Genomics single-cell RNA-sequencing kits
Figure 2.

Illustrative examples of genes categorized by expression levels: JAK2 and DNMT3A with low expression, CALR and SF3B1 with medium expression, and GAPDH and ACTB with high expression
The expression data across various cell groups, measured in Transcripts Per Million Reads (TPMs), is sourced from the Human Protein Atlas: version 23.0
We recommend testing the designed primers using the residual 10× full-length cDNA leftovers to ascertain primer specificity. This should be followed by Sanger sequencing to confirm that the GoT target-specific PCR indeed encompass the mutation site.
We also strongly advise users to conduct several pilot and optimization experiments to determine the precise number of PCR cycles needed for effective amplification of the target of interest for their specific cell type and/or sample. This determination can be made by using leftover cDNA from a related disease or cell-type population of interest before using cDNA patient samples. For example, in the case of profiling blood disorders, a normal bone marrow sample or peripheral blood from the same type of malignancy would serve as an appropriate control for these preliminary tests.
We have provided in the key resources table examples of primers that have been optimized for PCR0 and PCR1 steps targeting the SF3B1 K700E mutation site in human samples, with the corresponding gel results displayed in Figure 3.
Note: For detailed visual guidance on the primer locations, refer to Figure 1.
CRITICAL: If your target is expressed at a low level, you can enhance its representation by adding a locus-specific primer (Spike-in) during the cDNA amplification step (refer to Figure 1). While this is recommended, it is not mandatory (refer to troubleshooting 1). Additionally, it is advisable to assess the expression of the target gene in advance, using either single-cell RNA sequencing (scRNA-seq) or bulk RNA-seq data that has been previously generated for the specific cell type or tissue of interest.
Figure 3.

Example of SF3B1 GoT library amplification from cDNA (Lane 1), after PCR0 (lane 2), PCR1 (lane 3) and Sample index PCR (lane 4) on 2% agarose gel
Key resources table
| REAGENT or RESOURCE | SOURCE | IDENTIFIER |
|---|---|---|
| Antibodies | ||
| TotalSeq-C Human Universal Cocktail, V1.0 (for 5′ kit – 1 vial reconstituted in 25 μL and added to 0.5 million cells – according to the manufacturer’s instruction) | BioLegend | 399905 |
| TotalSeq-A Human Universal Cocktail, V1.0 (for 3′ kit – 1 vial reconstituted in 25 μL and added to 0.5 million cells – according to the manufacturer’s instruction) | BioLegend | 399907 |
| Critical commercial assays | ||
| KAPA HiFi HotStart ReadyMix | Roche | KK2601 |
| LongAmp Taq 2× Master Mix | New England Biolabs | M0287S |
| Chromium Next GEM Single Cell 3′ Library & Gel Bead Kit v3.1 | 10× Genomics | 1000268 |
| Chromium Next GEM Single Cell 5′ Library & Gel Bead Kit v2 | 10× Genomics | 1000265 |
| Ligation Sequencing Kit | Oxford Nanopore Technology | SQK-LSK114 |
| SPRI beads | Beckman Coulter Life Sciences | B23317 |
| Buffer EB | QIAGEN | ID: 19086 |
| M-270 streptavidin beads | Thermo Fisher Scientific | 65305 |
| M-280 streptavidin beads | Thermo Fisher Scientific | 11205D |
| SSPE buffer | Thermo Fisher Scientific | 15591043 |
| Bioanalyzer DNA high sensitivity kit | Agilent | 5067-4626 |
| Qubit 4 fluorometer | Thermo Fisher Scientific | Q33238 |
| PhiX control v3 | Illumina | FC-110-3001 |
| Deposited data | ||
| Single-cell raw (FASTQ) and processed (gene matrix counts, barcodes, features, and isoform junction counts) datasets generated using this protocol | Cortés-López et al.1 | GEO: GSE204845 EGA: EGAS00001007402 |
| Oligonucleotides (standard desalting) | ||
| Reverse primer (partial read 1): 5′ - NNNCTACACGACGCTCTTCCGATCT - 3′ |
N/A | |
| Reverse primer (partial read 1, biotinylated): /5Biosg/AAAAACTACACGACGCTCTTCCGATCT-3′ |
N/A | |
| Forward primer (partial TSO): 5′ - NNNAAGCAGTGGTATCAACGCAGAG - 3′ |
N/A | |
| Forward primer (targeted loci specific for PCR0): 5′ - loci specific primer sequence - 3′ e.g., for SF3B1 K700E: 5′-GATCCTCGTGGTCATT GAACCGC-3′ |
N/A | |
| Forward primer (targeted loci PCR1) with 5′ biotinylated handle: 5′ - CACCCGAGAATTCCA - loci specific primer sequence - 3′ e.g., for SF3B1 K700E: 5′-CACCCGAGAATTCCAG GCTACTATGATCTCTACCATGAGACCTG-3′ |
N/A | |
| Reverse primer (SI-PCR): 5′ - AATGATACGGCGAC CACCGAGATCTACACTCTTTCCCTAC ACGACGCTC - 3′ |
N/A | |
| RPI-x indexing primer (P7 generic primer with 8 nts for barcode): 5′ - CAAGCAGAAGACGGCATACG AGAT - xxxxxxxx - GTGACTGGAGT TCCTTGGCACCCGAGAATTCCA - 3′ |
N/A | |
| P5_generic primer: 5′ - AATGATACGGCGACC ACCGAGATCTACAC - 3′ |
N/A | |
| Software and algorithms | ||
| FastQC | Simon, Andrew6 | http://www.bioinformatics.babraham.ac.uk/projects/fastqc/ |
| Benchling | https://www.benchling.com/2 | https://www.benchling.com/ |
| Primer3 | Untergasser et al.,5 Koressaar et al.,4 Koressaar and Remm3 | https://primer3.ut.ee/ |
| SiCeLoRe | Lebrigand et al.7 | https://github.com/ucagenomix/sicelore |
| LeafCutter | Li et al.8 | https://davidaknowles.github.io/leafcutter/ |
| IronThrone | Nam et al.9 | https://doi.org/10.5281/zenodo.6828974; https://github.com/landau-lab/GoT-IronThrone |
| ONT-sc-Splice | Cortés-López et al.1 | https://doi.org/10.5281/zenodo.8084364; https://github.com/landau-lab/ONT-sc-splice |
| Cell Ranger | https://github.com/10XGenomics/cellranger | |
| minimap2 | Heng Li10 | https://github.com/lh3/minimap2/releases/tag/v2.17 |
| STAR | Dobin et al.11 | https://github.com/alexdobin/STAR |
Step-by-step method details
The following step-by-step protocol outlines the procedures for preparing and analyzing long-read libraries using ONT and GoT elements of the GoT-Splice method. The ONT process is covered in Section 1: "Long-read (ONT) library preparation and analysis", while Section 2:"GoT library preparation and analysis" details the GoT component. For additional components of the method, please refer to the comprehensive protocols mentioned previously in the "before you begin" section.
Long-read (ONT) library preparation and analysis
-
1.Enrichment for full-length, single cell transcriptome.
-
a.Biotin PCR.
-
i.Set up the following PCR reaction with Partial Read 1 (biotinylated) and Partial TSO primers (primer sequences are provided in the key resources table).PCR reaction master mix
Reagent Amount LongAmp Taq 2× Master Mix (NEB) 25 μL 10 μM primer 1 - Partial Read 1 (biotinylated) 2.5 μL 10 μM primer 2 - Partial TSO 2.5 μL Full-length cDNA library [from 10× Genomics, ∼10 ng] x μL ddH2O 20-x μL Total 50 μL PCR cycling conditionsSteps Temperature Time Cycles Initial Denaturation 94°C 3 min 1 Denaturation 94°C 15 s 6 cycles Annealing 60°C 15 s Extension 65°C 6 min Final extension 65°C 6 min 1 Hold 4°C Forever -
ii.Purify the cDNA using a 0.8× SPRI (following the protocol mentioned below at the “cDNA Re-amplification from 10× library” step 2.1) and elute in 20 μL of MQ water.
-
iii.Expect a cDNA yield of over 120 ng (by Qubit). If the yield is less than 120 ng, use 20 ng (instead of 10 ng) of full-length cDNA library from 10× Genomics as input to PCR.
-
i.
-
b.Streptavidin beads pull-down and on-bead PCR.
-
i.In a 1.5 mL microcentrifuge tube, wash 15 μL M-270 streptavidin beads (Thermo Fisher) three times with 200 μL 1× SSPE buffer. Incubate for 30 s each time at 23°C–25°C, before placing the tube on a magnetic stand to remove the supernatant.
-
ii.Resuspend the beads in 10 μL of 5× SSPE.
-
iii.Dilute the amplified cDNA (no more than 200 ng) in 40 μL of MQ water. Add 10 μL of the pre-washed M-270 beads (from point b). The total volume is now 50 μL.
-
iv.Incubate at 23°C–25°C for 15 min.
-
v.Place the microcentrifuge tube on a magnetic stand to pull down the beads. Measure the DNA concentration in the liquid phase with Qubit. Expect a significant portion of cDNA (above 90% of the input cDNA) to be bound to the beads.
-
vi.Wash the beads twice with 200 μL of 1× SSPE by either flicking or gentle pipetting.
-
vii.Wash the beads once with 200 μL of 10 mM Tris-HCl (pH 8.0).
-
viii.Resuspend the beads in 10 μL of MQ water.
-
ix.Set up on-bead PCR with Partial Read 1 and Partial TSO primers.PCR reaction master mix
Reagent Amount LongAmp Taq 2× Master Mix (NEB) 25 μL 10 μM primer 1 - Partial Read 1 2.5 μL 10 μM primer 2 - Partial TSO 2.5 μL cDNA library on beads 10 μL ddH2O 10 μL Total 50 μL PCR cycling conditionsSteps Temperature Time Cycles Initial Denaturation 94°C 3 min 1 Denaturation 94°C 15 s 3 cycles Annealing 60°C 15 s Extension 65°C 6 min Final extension 65°C 6 min 1 Hold 4°C Forever -
x.Pipette to mix the reactions and place the reaction tubes on a magnet stand.
-
xi.Collect the supernatant that contains the enriched, full-length cDNA library.
-
xii.Purify the cDNA using 0.8× SPRI and elute in 20 μL of MQ water. Expect cDNA yield over 100 ng. If the yield is less than 100 ng, increase the PCR by 1–2 cycles.
-
xiii.Proceed with sequencing using ONT’s the most recent SQK-LSK114 library prep kit.Note: In our initial GoT-Splice experiments,1 we employed the SQK-LSK110 kit designed for R9.4.1 flow cells. However, with the introduction of R10.4.1 flow cells, the SQK-LSK114 library preparation kits are now the preferred option, offering improved long-read accuracy.CRITICAL: If the quality of the cDNA is suboptimal, the GoT-Splice protocol may not succeed. It is recommended for users employing full-length cDNA that has been frozen for over six months for GoT-Splice to evaluate the cDNA samples with a Bioanalyzer to confirm their quality. For optimal cDNA library storage conditions, it is advisable to consult 10× Genomics' guidelines. They provide detailed recommendations on how to preserve the quality of your final libraries, including appropriate temperature settings and durations. You can find this information on their official support page: https://kb.10xgenomics.com/hc/en-us/articles/360000940492-How-long-can-final-libraries-be-stored-at-20-C-.
-
i.
-
a.
-
2.
Long-read ONT analysis.
The analysis of the GoT-Splice libraries is conducted using the ONT-sc-Splice pipeline: https://github.com/landau-lab/ONT-sc-Splice.
The ONT-sc-Splice pipeline facilitates the identification of differentially spliced transcripts in single cells using long-read data. It comprises three primary steps which are summarized below: cell barcode/UMI identification in long-reads, junction calling, and differential transcript usage analysis.
Prior to analyzing long-read data, it is necessary to pre-process the short-read transcriptome files to identify the sample-specific single-cell barcodes. This initial step can be carried out using established protocols such as Cell Ranger (https://github.com/10XGenomics/cellranger). It is worth noting that recent updates to SiCeLoRe7 have introduced the ability to independently identify barcodes without short reads and to handle the processing of 5′ ONT libraries.-
a.Cell Barcode/UMI calling in long-reads: Initiate by processing the long-read .fastq files through SiCeLoRe7 according to their provided user guidelines (https://github.com/ucagenomix/sicelore). The SiCeLoRe7 pipeline performs the following primary functions:
-
i.Reads are scanned for polyA and their corresponding ONT adapters. This first step ensures the removal of common sequencing artefacts.
-
ii.Reads are then mapped to the genome reference using minimap2.10Note: During this phase, it is also advised to employ a junction reference .bed file, which enhances the mapping accuracy for spliced reads. Such a reference file can be derived from the .bed file produced by STAR11 alignment of short-read RNA-seq from a control sample that closely matches the cell composition/condition of the single-cell dataset being studied. For instance, in the case of SF3B1 mutation (Cortés-López et al.1), bulk CD34+ cells were utilized as a normal control. Alternatively, the .bed file can be generated using a standard .gtf reference of the same genome of interest, processed with `paftools gff2bed`.
-
iii.Cell barcodes and UMIs are identified within each read.Note: The cell barcodes determined from the short-read files are utilized as references to locate corresponding barcodes in the long-reads.CRITICAL: Regulate the maximum number of errors permitted when matching cell barcodes; the standard allowance is usually up to two errors.
-
iv.Consensus sequencing generation. This process consolidates reads that originate from the same molecule, as determined by a shared UMI, which enhances the accuracy of long-read quantification.
-
i.
-
b.Junction calling: Use the consensus BAM output from SiCeLoRe7 as input for junction calling.
-
i.Generate the annotation reference files:Note: For a custom genome file, use the LeafCutter8 function `gtf2leafcutter.pl()` for reference file generation. For those using the hg38 human genome, we provide a set of reference files under: https://github.com/landau-lab/ONT-sc-splice/blob/main/junction_annotation/annotation_reference
-
ii.Process the tagged BAM files, which include tags for cell barcodes (BC) and collapsed UMIs (U8), to identify intron junctions for each cell, using a method akin to LeafCutter.8>python count_introns_ONT.py \<path to bam output from SiCeLoRe> \<path to output file>
-
iii.Construct a metadata table and assign cluster IDs. In this procedure, junction information is added to the count matrix. Also, unique cluster IDs are assigned to junctions that share the same 5′ or 3′ end, representing alternatively spliced groups.Note: The outcome will be a count matrix with each row corresponding to a junction and each column representing a cell. Additionally, the output includes a metadata file which contains detailed junction information such as gene name, transcript ID, and chromosomal coordinates.>Rscript junc_calling_script.R \<path to output folder> \<sample_ID> \<path to annotation_reference>
-
i.
-
c.Junction annotations: Utilize a .gtf reference file to classify each 5′ and 3′ ends of the introns as either canonical or alternative. This classification facilitates further categorization into exon skipping, or alternative 3′ or 5′ splice events.
-
i.Use the `new_annotator_with_skipping.py` script to annotate the junctions detected in the sample.>python new_annotator_with_skipping.py \<path to junction calling outputs> \<input datafile (output from previous step)> \<bed file output from intron junction calling> \<output file name>Note: To streamline the junction annotation process, we provide a shell script example in the pipeline GitHub repository, and the corresponding running command below. Please note that executing this step may require up to 200 GB of memory for standard samples with more than 9,000 cells.>sbatch junction_annotation/junc_calling_pipeline.w.exon.skip.sh \--output_location <path to junction calling outputs> \--input_bam <path to bam output from SiCeLoRe> \--sample <sample_ID> \--scripts_dir <path to junction annotation folder in GoT splice repo>CRITICAL: The script, by default, does not generate novel annotation files. Should there be a need to create novel annotation files, additional parameters will be required, including:--make_refs: creates new annotation files--refs_dir: Path to the directory to output the reference files.--leafcutter_dir: Path to the leafcutter directory.--gtf: Path to the input GTF fileThe corresponding variation is shown below.>sbatch junction_annotation/junc_calling_pipeline.w.exon.skip.sh \--output_location <path to junction calling outputs> \--input_bam <path to bam output from SiCeLoRe> \--sample <sample_ID> \--scripts_dir <path to junction annotation folder in GoT splice repo> \--make_refs true \--refs_dir <path to directory to output the reference files> \--leafcutter_dir <path to leafcutter> \--gtf <path to input gtf file>
-
i.
-
d.Differential transcript usage (DTU). To quantify the DTU between genotypes (e.g., SF3B1 wild type [WT] vs. SF3B1 mutant [MUT]):
-
i.Assess the genotype status for mutations of interest (e.g., SF3B1 K700E) using the IronThrone pipeline (https://github.com/landau-lab/GoT-IronThrone). Utilize the amplicon GoT library generated in the second part of this protocol. Output a table containing the cell barcodes and corresponding genotypes (WT or MUT).
-
ii.Split junction clusters based on their cluster IDs using the `split_clusters_v2` script.Note: Junctions with coverage lower than 5 reads are excluded, though this threshold can be adjusted using the `--min_reads` parameter.
-
iii.Conduct genotype permutations using the `--npermute` argument, with a recommended minimum of 100,000 permutations.
-
i.
-
a.
Note: This will allow the calculation of an odds ratio for each junction across each permutation, which then will be compared to the original odds ratio for that specific junction, determining the likelihood of the observed odds ratio being statistically significant.
This analysis is applicable to individual or combined samples. A comprehensive guide for both options is available on the ONT-sc-splice GitHub page.
To compare MUT and WT cells within each sample for DTU, further categorizing by cell type is necessary. This analysis mirrors the previous step, with a crucial difference: permutations are conducted both within each sample and within each specific cell type of interest. Similarly, the analysis can be conducted on individual samples or by combining multiple samples.
The result of the DTU analysis will be a table displaying DTU for both canonical and alternative splicing events. This table will also include the log odds ratio for each junction, as well as the aggregate number of reads observed across mutant MUT and WT cell types.
For comprehensive guidance on each of these steps, please consult the following publicly accessible GitHub repositories:
ONT-sc-Splice pipeline: https://github.com/landau-lab/ONT-sc-splice.
IronThrone pipeline for genotype assessment: https://github.com/landau-lab/GoT-IronThrone.
We additionally provide a run example which can be found at https://github.com/landau-lab/ONT-sc-splice/tree/main/minimal_example. Processing this dataset in 10 separate batches typically requires around 90 min for each comparison conducted (such as WT versus MUT or a specific cell type comparison), with a memory usage of approximately 200 MB for each batch.
As these pipelines are frequently updated, users should refer to the GitHub repositories for the latest versions. Users are encouraged to contribute by posting issues and analytical queries within the GitHub repositories.
GoT library preparation and analysis
-
3.cDNA Re-amplification from 10× library.
-
a.To enrich your target of interest, particularly those that are lowly expressed, introduce a locus-specific primer during the cDNA amplification process.Note: Although this step is recommended, it is not mandatory. Should you decide to use it, add 1 μL of a 1 μM spike-in primer during the cDNA re-amplification stage, as detailed below. This primer is labeled as "Spike-in" in Figure 1. Please refer to “Optimization 1: Design and Validate Target-Specific Primers” section for primer design guidelines.Primers needed to re-amplify full-length cDNA:
-
i.Reverse primer (Partial Read 1): 5' - CTACACGACGCTCTTCCGATCT - 3'.
-
ii.Forward primer (Partial TSO [template switch oligo]): 5' - AAGCAGTGGTATCAACGCAGAG - 3'.PCR reaction master mix
Reagent Amount LongAmp Taq 2× Master Mix (NEB) 25 μL 10 μM primer 1 - Partial Read 1 2.5 μL 10 μM primer 2 - Partial TSO 2.5 μL 1 μM Spike-in primer (optional) 1 μL Full-length cDNA library 2–4 μL ddH2O 16–18 μL PCR cycling conditionsSteps Temperature Time Cycles Initial Denaturation 95°C 3 min 1 Denaturation 98°C 20 s 6 cycles Annealing 67°C 30 s Extension 72°C 1 min/kb Final extension 72°C 1.5 min/kb 1 Hold 4°C Forever Note: Perform SPRI purification of PCR products as follows:
-
i.
-
b.Vortex and resuspend the SPRIselect reagent.
-
c.Add 60 μL SPRIselect reagent (0.6×) to each sample and pipette mix 15× (pipette set to 150 μL).
-
d.Incubate for 5 min at 23°C–25°C.
-
e.Place on the magnet (High) until the solution clears.
-
f.Remove the supernatant.
-
g.Add 200 μL 80% ethanol to the pellet. Wait 30 s.
-
h.Remove the ethanol.
-
i.Repeat steps 7 and 8 for a total of 2 washes.
-
j.Centrifuge for 10 s at 300 x g and place on the magnet (Low).
-
k.Remove any remaining ethanol.
-
l.Air dry for 2 min. (DO NOT exceed 2 min as this will decrease elution efficiency).
-
m.Remove from the magnet.
-
n.Add 20.5 μL Buffer EB.
-
o.Pipette mix 15× (pipette set to 20 μL).
-
p.Incubate 2 min at 23°C–25°C.
-
q.Place the tube strip on the magnet (High) until the solution clears.
-
r.Transfer 20 μL sample (supernatant) to a new tube strip.
-
s.Check the quantity of cDNA by Qubit and the quality by running the samples on a Bioanalyzer before proceeding to the next step.
-
a.
-
4.
PCR0 (hemi-nested PCR): Enrichment of loci of interest.
This step aims to enrich the target loci. This step is not always necessary, but useful for loci with low abundance.-
a.Perform a pre-enrichment PCR from the re-amplified cDNA library mentioned above using the following primers:
-
i.Reverse primer (Partial Read 1): 5' - CTACACGACGCTCTTCCGATCT - 3'.
-
ii.Forward primer (targeted loci specific for PCR0): 5' - loci specific primer sequence - 3' (see key resources table for examples).CRITICAL: The forward primer should be located downstream of the Spike-in primer and upstream of the PCR1 primer, as described in Figure 1. If the region of interest is difficult to amplify (due to an AT-rich or GC-rich site) and a specific PCR0 primer cannot be identified during the design process, the user may use the Spike-in primer to complete the PCR0 step.PCR reaction master mix
Reagent Amount KAPA 2× ReadyMix 25 μL 10 μM forward primer 2.5 μL 10 μM reverse primer 2.5 μL Full length re-amplified cDNA library 4 μL ddH2O 16 μL PCR cycling conditionsSteps Temperature Time Cycles Initial Denaturation 95°C 3 min 1 Denaturation 98°C 20 s 10–15 cycles Annealing 65°C 30 s Extension 72°C 1 min Final extension 72°C 1 min 1 Hold 4°C Forever
-
i.
-
b.If desired, run 5% of the sample on E-gel/agarose gel to assess successful PCR product amplification.
-
c.Perform SPRI purification using 1.5× (as described above).
-
d.Resuspend in 20 μL of Buffer EB.
-
a.
-
5.PCR1 (hemi-nested PCR): Enrichment of loci of interest using biotinylated primers.
-
a.This hemi-nested PCR is to enrich the target loci using the following primers:
-
i.Forward primer (targeted loci PCR1) with 5′ biotinylated handle: 5' - CACCCGAGAATTCCA - loci specific primer sequence - 3′.
-
ii.Reverse primer (SI-PCR): 5' - AATGATACGGCGACCACCGAGATCTACACTCTTTCCCTACACGACGCTC - 3′.PCR reaction master mix
Reagent Amount KAPA 2× ReadyMix 25 μL 10 μM primer 1 – SI-PCR 2.5 μL 10 μM primer 2 – specific PCR1 - biotinylated 2.5 μL 100% of PCR0 product 20 μL If the user has decided to skip PCR0, use 4 μL of re-amplified cDNA in the PCR reaction master mix (instead of 100% of the PCR0 product) as described above, and make up the remaining volume with nuclease-free water.PCR cycling conditionsSteps Temperature Time Cycles Initial Denaturation 95°C 3 min 1 Denaturation 98°C 20 s 10–15 cycles Annealing 65°C 30 s Extension 72°C 1 min Final extension 72°C 1 min 1 Hold 4°C Forever
-
i.
-
b.If desired, run 5% of the sample on E-gel/agarose gel to assess successful PCR product amplification.
-
c.Perform SPRI purification using 1.5× (as described above).
-
d.Resuspend in 40 μL of Buffer EB.CRITICAL: The forward primer should be less than 90 nt away from the target mutation, so that it can be successfully read with scRNA-seq short-read sequencing. In the case of a 5′ kit, the reverse primer must be designed with the same biotinylated RPI-x handle (as shown in Figure 1).
-
a.
-
6.
Biotin Pull down.
This step aims to purify only the amplified PCR products. It helps to improve the purity of the product during the sample indexing PCR step (see below).-
a.Add 15 μL of streptavidin M-280 beads to each sample.
-
b.Place it in a magnet.
-
c.Wash beads three times with 1× SSPE buffer.
-
d.Take the tubes out from the magnet.
-
e.Resuspend the beads in a 5× SSPE buffer (10 μL per sample).
-
f.Add 10 μL of beads to 40 μL of SPRI’d sample (from PCR1).
-
g.Incubate at 23°C–25°C for 15 min.
-
h.Place it in a magnet.
-
i.Wash two times with 1× SSPE buffer.
-
j.Wash one time with 10 mM Tris HCl (pH 8.0).
-
k.Resuspend beads in 20 μL water.
-
a.
-
7.
Sample Indexing: On-bead PCR.
The following step allows the users to introduce a sample index in the GoT library, which might be useful for pooling multiple GoT libraries together for sequencing.-
a.Primers needed:
-
i.RPI-x indexing primer (with 8 nts for barcode): 5' - CAAGCAGAAGACGGCATACGAGAT - xxxxxxxx - GTGACTGGAGTTCCTTGGCACCCGAGAATTCCA - 3'.
-
ii.P5_generic primer: 5' - AATGATACGGCGACCACCGAGATCTACAC - 3′.Note: RPI-x primers are custom-ordered using the above sequences with the mentioned 8-nt barcode of interest. The RPI-x primer contains the P7 sequence, then the 8-nt index (xxxxxxxx) followed by the read 2 primer binding site. You can place your desired indices in place of the “x” nucleotides on the sequence above.CRITICAL: To ensure successful sequencing, it is crucial to verify that the barcodes of the samples intended for pooling are compatible and to avoid barcode clashing or insufficient barcode diversity. For additional information, please refer to the latest Illumina guidelines available at the following links: Illumina Index Adapters Pooling Guide and Illumina Library Preparation General Reference Material.PCR reaction master mix
Reagent Amount KAPA 2× ReadyMix 25 μL 10 μM primer 1 - P5_generic 2.5 μL 10 μM primer 2 - RPI-x indexing primer 2.5 μL Resuspended beads from biotin pull down 20 μL PCR cycling conditionsSteps Temperature Time Cycles Initial Denaturation 95°C 3 min 1 Denaturation 98°C 20 s 6 cycles Annealing 60°C 30 s Extension 72°C 1 min/kb Final extension 72°C 1.5 min/kb 1 Hold 4°C Forever
-
i.
-
b.Load 5% of the product on 2% agarose gel and confirm the presence of specific PCR amplification before cleaning up with SPRI beads (see Figure 3).
-
c.Perform SPRI purification using 1.5× (as described above).
-
d.Elute in 20 μL of Buffer EB and store at −20°C.
-
a.
-
8.
Sequencing library preparation.
Before sequencing, you can verify the presence of the GoT product by loading it onto an agarose gel, as exemplified in Figure 3.
Optional: For the first time, it recommended to send the final GoT product to Sanger sequencing to confirm the presence of the desired mutation before submitting the libraries for Illumina sequencing.
The GoT library can be pooled with the 10× short-read GEX and CITE-seq libraries for sequencing. Ideally, 5,000 reads per cell should be allocated for the GoT library, amounting to 50 million reads for 10,000 targeted cells.
When sequencing the GoT library independently, due to its low diversity, it is recommended to spike in Illumina PhiX control library (5%–10%) to the sequencing run.
Expected outcomes
After assessing the presence of the expected GoT amplicon product (Figure 3), we expect a GoT library with a concentration between 20–40 ng/μL.
For quality control, you can quantify the GoT libraries using Qubit. A library concentration above 40 ng/μL suggests over-amplification.
Conversely, a library concentration below 20 ng/μL could indicate low cell recovery or low target expression. Potential strategies to mitigate these issues are provided in the troubleshooting section.
After using Qubit, we suggest evaluating the quality of the library with the Bioanalyzer DNA high sensitivity kit. The concentration of GoT libraries should be adjusted to 1–5 ng/μL based on the Qubit reading before being loaded onto the Bioanalyzer chip, as shown in Figure 4.
Figure 4.

Example of a Bioanalyzer trace illustrating a high-quality final GoT library, featuring a primary product of 531 base pairs along with additional shorter isoforms of the target that were also amplified using this protocol
GoT analysis for genotype assessment
After Illumina sequencing and read demultiplexing, we should obtain paired FASTQ files labeled as R1 and R2 for the GoT library. The read configuration is the standard 10× Genomics configuration for Single Cell 3′ Gene Expression (v2/v3/v3.1) or Single Cell 5′ Gene Expression (v1/v1.1) libraries. Please refer to 10× Genomics sequencing requirements for single-cell 3’ (https://www.10xgenomics.com/support/single-cell-gene-expression/documentation/steps/sequencing/sequencing-requirements-for-single-cell-3) or 5’ (support/single-cell-immune-profiling/documentation/steps/sequencing/sequencing-requirements-for-single-cell-v-d-j" title="https://www.10xgenomics.com/support/single-cell-immune-profiling/documentation/steps/sequencing/sequencing-requirements-for-single-cell-v-d-j">https://www.10xgenomics.com/support/single-cell-immune-profiling/documentation/steps/sequencing/sequencing-requirements-for-single-cell-v-d-j) gene expression libraries.
R1 contains the cell barcode and UMI sequences, while R2 contains the expected gene of interest targeted sequences. Before processing the sample using the IronThrone pipeline (https://github.com/landau-lab/GoT-IronThrone), you can check for the presence of the mutation directly in the R2 of the Illumina FASTQ file using FastQC.6 We expect to see an overrepresentation of sequences that resemble either the wild-type (WT) or mutant (MUT) sequencing product, as shown in Figure 5.
Figure 5.

FastQC results showing the enrichment of sequences capturing the mutation of interest (SF3B1 c.2098A>G, WT = green, MUT = red)
For comprehensive guidance on each of step of the pipeline and necessary files needed to complete the genotype assessment, please consult the following publicly accessible GitHub repository: https://github.com/landau-lab/GoT-IronThrone.
Limitations
While GoT-Splice offers a powerful approach for simultaneously assessing multiple single-cell modalities, including genotype and splicing isoforms, it has some limitations. The percentage of cells that are successfully genotyped can vary due to factors outlined in the protocol. These factors include gene expression levels, mutation location, and the efficiency of the 10× Genomics capture. For instance, in the SF3B1 analysis conducted in Cortés-López et al., the percentage of genotyped cells ranged from approximately 20% to nearly 90% across individuals. Nevertheless, this protocol stands out compared to other methods that offer single cell genotyping capture but either lack mRNA capture or provide lower throughput without full-length isoform data.
Troubleshooting
Problem 1
My target mutation is not located close (i.e., beyond 700 nt) from the 3′ or 5′ of the mRNA transcript but the gene is highly expressed (related to “optimization 1: design and validate target-specific primers” step).
Potential solution
If the mutation is not within the expected region (within 700 nt), we recommend two strategies to overcome this.
-
•
Circ-GoT (Nam et al., 2019), which allows for re-amplification and brings the mutation site closer to the barcode region. However, this is a laborious 3-day protocol and does not perform well with low-expression targets.
-
•
Alternatively, we recommend amplifying the target using the GoT protocol above-described and sequencing the large product with long-read ONT, as conducted in Cortés-López et al. Please consult the updated protocols provided by ONT, which can be found at: https://nanoporetech.com/protocols_singlecell.
Problem 2
My target mutation is within 700 nt from the 3′ or 5′ end of the transcript, but the gene has low expression. I observed very faint bands after the recommended number of PCR cycles (related to “optimization 1: design and validate target-specific primers” step).
Potential solution
If the mutation is within the expected region (within 700 nt) and you observe a low concentration/intensity of bands or if the total concentration is less than 1 ng/μL (by Qubit), we recommend increasing by one or two cycles in the sample indexing step. Beyond that, we do not recommend increasing the PCR cycles, as you may simply be re-amplifying amplicons from the few cells that express the target gene.
Problem 3
I see non-specific bands other than my targets (related to step 8).
Potential solution
You may observe high molecular weight bands, which could be cDNA carry-over from the initial PCRs. This is normal. For non-specific low molecular weight bands, we recommend sending the GoT library for Sanger sequencing to confirm that a different isoform of the target is being amplified.
If Sanger sequencing confirms non-specific amplification, we suggest redesigning the primers to obtain only the targets of interest.
Lastly, if, even with different primers, you continue to see non-specific target amplification, we recommend performing a gel extraction of the target band of interest before sending it for Illumina or ONT sequencing.
Problem 4
I see larger bands other than my target (approximately double the size of my target band; related to step 8; Figure 6).
Figure 6.

Example of a Bioanalyzer trace showing an over-amplified GoT library, with prominent bands larger than the intended target, which are indicated within the green box
Potential solution
If you over-amplify the target, you might obtain a “bubble product”. In such cases, we recommend re-amplifying the product for two additional cycles using the sample indexing - on bead PCR program (as described above), which should resolve the issue. We also suggest amplifying the product within a concentration range of 10–30 ng/μL to prevent this problem. This should be optimized based on the targeted cell numbers and the gene of interest before starting the experiments.
Problem 5
We observed that the concentration of the GoT library measured by Qubit was satisfactory, but there were no products in the Bioanalyzer profile (related to step 8; Figure 7).
Figure 7.

Example of a Bioanalyzer trace that does not display the expected GoT library products, with the anticipated amplicon region marked by a green box, which is presumably the result of the poor quality of the starting cDNA material
Potential solution
We always recommend starting the GoT protocol with high-quality cDNA, as recommended by the 10× Genomics protocol (see the 10× protocol for full-length cDNA quality control). If the cDNA quality is not optimal, the GoT protocol may not succeed. We also suggest loading 5% of the final library product from the PCR onto a 2% agarose gel before SPRI cleanup to ensure you have the expected product (Figure 3).
Resource availability
Lead contact
Further information and requests for resources and reagents should be directed to and will be fulfilled by the lead contact, Federico Gaiti, federico.gaiti@uhn.ca.
Technical contact
Questions about the technical specifics of performing the protocol should be directed to the technical contacts, Saravanan Ganesan (sag4012@med.cornell.edu), Dan Landau (dlandau@nygenome.org), and Federico Gaiti (federico.gaiti@uhn.ca).
Materials availability
No new unique materials or reagents have been specifically generated for this protocol.
Data and code availability
Our original datasets and codes are available in our resource paper in Cell Stem Cell (please refer to Cortés-López et al.1), as well as in the key resources table of this manuscript.
The analysis of the GoT-Splice libraries is conducted using the ONT-sc-Splice pipeline, with details described on GitHub: https://doi.org/10.5281/zenodo.8084364.
Genotyping is assessed using the IronThrone pipeline, which is available on GitHub: https://doi.org/10.5281/zenodo.6828974.
Acknowledgments
The work was enabled by the Weill Cornell Flow Cytometry Core. S.G. is supported by the American Society of Hematology Scholar Award. F.G. is supported by the American Society of Hematology Scholar Award (200264-02), Princess Margaret Cancer Foundation, Ontario Institute for Cancer Research Investigator Award (IA-1-025), J.P. Bickell Foundation, Cancer Research Society (1050446), Gilead’s Research Scholars Program, Natural Sciences and Engineering Research Council of Canada (RGPIN-2023-05535), Canadian Cancer Society (708077), and the Canadian Institutes of Health Research (487894). D.A.L. is supported by the Burroughs Wellcome Fund Career Award for Medical Scientists, Valle Scholar Award, Leukemia Lymphoma Scholar Award, and the Mark Foundation Emerging Leader Award. This work was supported by the National Heart Lung and Blood Institute (R01HL157387-01A1), the National Cancer Institute (R01s CA242020, R01 CA251138, P50 254838, and R33 CA267219), the Edward P. Evans MDS Foundation, a Tri-Institutional Stem Cell Initiative Award, the National Institutes of Health Common Fund Somatic Mosaicism Across Human Tissues (1UG3NS132139-01), and the National Human Genome Research Institute, Center of Excellence in Genomic Science (RM1HG011014). This work received research support from Oxford Nanopore Technologies.
Author contributions
S.G., A.D.S., X.D., S.H., and A.G.H. performed the experiments. M.C.-L., P.C., A.G.H., and F.G. performed the analyses. S.G., M.C.-L., S.J., D.A.L., and F.G. wrote the manuscript. All authors reviewed and approved the final manuscript.
Declaration of interests
X.D., S.H., and S.J. are employees of Oxford Nanopore Technologies, Inc. and are shareholders and/or share option holders. D.A.L. has served as a consultant for AbbVie, AstraZeneca, and Illumina and is on the Scientific Advisory Board of Mission Bio, Pangea, Alethiomics, and C2i Genomics; D.A.L. has received prior research funding from BMS, 10× Genomics, Ultima Genomics, and Illumina unrelated to the current manuscript. F.G. serves as a consultant for S2 Genomics, Inc.
Contributor Information
Saravanan Ganesan, Email: sag4012@med.cornell.edu.
Dan A. Landau, Email: dlandau@nygenome.org.
Federico Gaiti, Email: federico.gaiti@uhn.ca.
References
- 1.Cortés-López M., Chamely P., Hawkins A.G., Stanley R.F., Swett A.D., Ganesan S., Mouhieddine T.H., Dai X., Kluegel L., Chen C., et al. Single-cell multi-omics defines the cell-type-specific impact of splicing aberrations in human hematopoietic clonal outgrowths. Cell Stem Cell. 2023;30:1262–1281.e8. doi: 10.1016/j.stem.2023.07.012. [DOI] [PMC free article] [PubMed] [Google Scholar]
- 2.Benchling [Biology Software] 2023. https://benchling.com Retrieved from.
- 3.Koressaar T., Remm M. Enhancements and modifications of primer design program Primer3. Bioinformatics. 2007;23:1289–1291. doi: 10.1093/bioinformatics/btm091. [DOI] [PubMed] [Google Scholar]
- 4.Kõressaar T., Lepamets M., Kaplinski L., Raime K., Andreson R., Remm M. Primer3_masker: integrating masking of template sequence with primer design software. Bioinformatics. 2018;34:1937–1938. doi: 10.1093/bioinformatics/bty036. [DOI] [PubMed] [Google Scholar]
- 5.Untergasser A., Cutcutache I., Koressaar T., Ye J., Faircloth B.C., Remm M., Rozen S.G. Primer3—new capabilities and interfaces. Nucleic Acids Res. 2012;40:e115. doi: 10.1093/nar/gks596. [DOI] [PMC free article] [PubMed] [Google Scholar]
- 6.Simon A. FastQC: a quality control tool for high throughput sequence data. 2010. http://www.bioinformatics.babraham.ac.uk/projects/fastqc Available online at:
- 7.Lebrigand K., Magnone V., Barbry P., Waldmann R. High throughput error corrected Nanopore single cell transcriptome sequencing. Nat. Commun. 2020;11:4025. doi: 10.1038/s41467-020-17800-6. [DOI] [PMC free article] [PubMed] [Google Scholar]
- 8.Li Y.I., Knowles D.A., Humphrey J., Barbeira A.N., Dickinson S.P., Im H.K., Pritchard J.K. Annotation-free quantification of RNA splicing using LeafCutter. Nat. Genet. 2018;50:151–158. doi: 10.1038/s41588-017-0004-9. [DOI] [PMC free article] [PubMed] [Google Scholar]
- 9.Nam A.S., Kim K.-T., Chaligne R., Izzo F., Ang C., Taylor J., Myers R.M., Abu-Zeinah G., Brand R., Omans N.D., et al. Somatic mutations and cell identity linked by Genotyping of Transcriptomes. Nature. 2019;571:355–360. doi: 10.1038/s41586-019-1367-0. [DOI] [PMC free article] [PubMed] [Google Scholar]
- 10.Li H. Minimap2: pairwise alignment for nucleotide sequences. Bioinformatics. 2018;34:3094–3100. doi: 10.1093/bioinformatics/bty191. [DOI] [PMC free article] [PubMed] [Google Scholar]
- 11.Dobin A., Davis C.A., Schlesinger F., Drenkow J., Zaleski C., Jha S., Batut P., Chaisson M., Gingeras T.R. STAR: ultrafast universal RNA-seq aligner. Bioinformatics. 2013;29:15–21. doi: 10.1093/bioinformatics/bts635. [DOI] [PMC free article] [PubMed] [Google Scholar]
Associated Data
This section collects any data citations, data availability statements, or supplementary materials included in this article.
Data Availability Statement
Our original datasets and codes are available in our resource paper in Cell Stem Cell (please refer to Cortés-López et al.1), as well as in the key resources table of this manuscript.
The analysis of the GoT-Splice libraries is conducted using the ONT-sc-Splice pipeline, with details described on GitHub: https://doi.org/10.5281/zenodo.8084364.
Genotyping is assessed using the IronThrone pipeline, which is available on GitHub: https://doi.org/10.5281/zenodo.6828974.