

Abstract
The relationship between sex‐specific blood biomarkers and memory changes in middle‐aged adults remains unclear. We aimed to investigate this relationship using the data from the Framingham Heart Study (FHS). We conducted association analysis, partial correlation analysis, and causal dose–response curves using blood biomarkers and other data from 793 middle‐aged participants (≤ 60 years) from the FHS Offspring Cohort. The results revealed associations of adiponectin and fasting blood glucose with midlife memory change, along with a U‐shaped relationship of high‐density lipoprotein cholesterol with memory change. No significant associations were found for the other blood biomarkers (e.g., amyloid beta protein 42) with memory change. To our knowledge, this is the first sex‐specific network analysis of blood biomarkers related to midlife memory change in a prospective cohort study. Our findings highlight the importance of targeting cardiometabolic risks and the need to validate midlife‐specific biomarkers that can accelerate the development of primary preventive strategies.
Keywords: association, blood biomarkers, memory decline, middle‐aged adults, sex difference
1. BACKGROUND
Dementia refers to a set of symptoms marked by a decline in cognitive abilities, including memory, language, reasoning, and everyday tasks. 1 Dementia can result from various causes, such as Alzheimer's disease (AD), vascular problems, traumatic brain injuries, and other health issues. 2 , 3 Dementias have a significant impact on millions of people worldwide, resulting in substantial costs for care. Although age is the most significant risk factor for dementia, it is widely believed that women face a higher risk for dementia. 4 , 5 Both men and women experience cognitive changes with age, but crucial differences exist in the biological mechanisms that underlie cognitive decline between the sexes. 6 Besides life expectancy, the sex disparity in dementia may also be influenced by multiple factors, such as socioeconomic risk factors, 7 inflammation, 8 reproductive markers, 9 and plasma amyloid beta protein 42 (Aβ42). 10 Therefore, it is critical to explore blood biomarkers that may have differing associations (e.g., directionality or magnitude) with cognitive changes between men and women to better understand the underlying mechanisms of dementia and develop effective interventions.
A previous study showed that the pathology of AD may begin decades before the onset of clinical symptoms, emphasizing the significance of understanding cognitive decline in middle age, possibly at the preclinical stage of the disease. 11 Studies have identified a link between risk factors during middle age and the risk of dementia in late life. 12 , 13 These risk factors include hypertension, 14 body mass index (BMI), 15 and low education. 16 This understanding is crucial for planning adequate care and initiating early therapeutic interventions, which may delay the onset of the disease or alleviate its symptoms. In recent years, researchers have discovered sex‐specific differences in many factors including lipids that are linked to cognitive changes in middle‐aged individuals. 17 Therefore, identifying risk factors and preclinical markers before the presymptomatic stage is critical for combating dementia. Such identification can help implement timely lifestyle changes and facilitate the discovery of new disease‐modifying targets. However, the role of sex in preclinical stage of dementia progression has not been well studied. Therefore, understanding the role of sex in cognitive changes in middle‐aged individuals is of utmost importance. 18
The present study uses the Offspring cohort of the Framingham Heart Study (FHS). This cohort has extensive longitudinal measures including demographics, blood biomarker data, and cardiovascular risk factors obtained during regular health exams and ancillary studies. 19 , 20 , 21 The objective of the study is to identify sex‐specific blood biomarkers associated with preclinical memory change in middle‐aged participants. We hypothesized that blood biomarkers were associated with memory change in a sex‐specific manner among middle‐aged participants. To test this hypothesis, we conducted sex‐stratified association analyses of memory change with multiple blood biomarkers.
2. METHODS
2.1. Study population
In 1972, the FHS Offspring cohort recruited 5124 participants who were the children of the Original cohort and the spouses of these children. 19 The Offspring participants have undergone a total of nine health examinations. For the statistical analyses in the present study, we selected the data of Offspring participants from health Exam 7, which took place between 1998 and 2001. This specific exam was chosen because it allowed for the simultaneous collection of demographic characteristics and multiple blood biomarkers. The dataset used for analysis consisted of a total of 3539 participants. Given that the age of 60 years has emerged as the commonly used threshold to differentiate middle age from the elderly population in many studies, 22 , 23 for the present study, we excluded 1928 participants who were > 60 years old. Subsequently, we excluded an additional 818 participants without a neuropsychological (NP) test at one of two consecutive tests. Finally, our study included 793 participants. Of note, none of these participants was diagnosed with dementia. All participants included in the study provided written informed consent, and the study protocols and consent forms were approved by the institutional review board at Boston University.
RESEARCH IN CONTEXT
Systematic review: We reviewed the literature using a database such as PubMed. It is critical to explore blood biomarkers that may have differing associations (e.g., directionality or magnitude) with memory change between men and women to better understand the underlying mechanisms of Alzheimer's disease and develop effective interventions.
Interpretation: Our study aimed to examine the association between certain blood biomarkers and midlife memory decline. The results underscore the significance of addressing cardiometabolic risks and the importance of validating midlife‐specific biomarkers to expedite the development of primary preventive strategies.
Future directions: Future studies include (1) to confirm causality and determine the potential for interventions to mitigate cognitive decline in middle‐aged adults and (2) to expand the study to other racial and ethnic groups.
2.2. Exposures
We analyzed multiple clinical and blood biomarkers linked to dementia risk, investigating their association with memory change. Sex was self‐reported by men and women. Cerebrovascular and metabolic markers included body mass index (BMI), 24 , 25 ventricular heart rate (HR), systolic blood pressure (SBP), diastolic systolic blood pressure (DBP), 26 and resistin; 27 glycemic variables—fasting blood glucose (FBG), fasting blood insulin (FBI), and hemoglobin A1C (HbA1c); 28 , 29 and lipid profile low‐density lipoprotein cholesterol (LDL), high‐density lipoprotein cholesterol (HDL), total cholesterol (TC). 30 , 31 We also included the two pathological biomarkers for AD, Aβ42 and Aβ40, in the plasma. 32 Immune and inflammatory biomarkers included C‐reactive protein (CRP), interleukin 6 (IL‐6) and 18 (IL‐18), and tumor necrosis factor alpha (TNF‐ɑ); 33 , 34 adiponectin; and fibrinogen. 35 , 36 The major genetic risk factor, apolipoprotein E (APOE), was also considered in our analyses. This study determined APOE genotype of participants using previously reported methods. 37 Based on ε4 status, we classified the participants into two groups: ε4+ group with genotypes ε3/ε4 and ε4/ε4, and ε4– group with genotypes ε2/ε2, ε2/ε3, and ε3/ε3. The study participants were categorized into three education groups: individuals with less than high school completion, high school graduates and/or some college, and individuals with college and/or graduate degrees.
2.3. Outcomes
The outcome of interest was the annualized memory change, which was assessed using longitudinal NP test measures. The FHS administered the baseline NP assessment to the Offspring participants in 1999. Most of the baseline NP assessment was conducted at Health Exam 7 exam. We aligned the baseline NP assessment with Exam 7 variables if the baseline assessment was evaluated within 2 years of Exam 7. Follow‐up NP tests were conducted every 2 to 6 years using consistent NP test administration and scoring procedures. 38 , 39 All participants were cognitively intact in the study. This study included six NP tests 40 including Wechsler Memory Scale (WMS) Logical Memory—Immediate Recall (LMi), Delayed Recall (LMd); WMS Paired Associate Learning—Immediate Recall (PASi), Delayed Recall (PASd); and WMS Visual Reproduction—Immediate Recall (VRi), Delayed Recall (VRd) that cover memory function. A total memory score was calculated by summing up individual NP tests. The annualized memory change was determined by dividing the change in the total score by the difference in age between the two neurocognitive assessments.
2.4. Statistical analyses
For traits with approximately normal distributions, a t test was used to compare the differences. For traits with skewed distributions, the Mann–Whitney U test was used. The chi‐square test was used to examine differences in the frequencies of binary variables. A linear regression model was used to estimate the sex‐specific association between the baseline blood biomarker and the annualized memory change. The model included sex (in the pooled sample), baseline age, and education as covariates. Besides these covariables, we additionally adjusted for APOE in the sensitivity analysis. The generalized propensity score (GPS) was used to construct the causal dose–response curves of annualized memory change with significantly associated blood biomarkers adjusting for age, sex, and education. 41 , 42 We conducted a partial correlation analysis to examine the relationship between each biomarker and the annualized memory change, accounting for the potential confounding effects of other blood biomarkers. Statistical analyses were conducted using R software (version 4.1.1) and Python (version 3.6.8) in this study. The predefined level of statistical significance for all tests was set at P < 0.05. We also calculated the adjusted P values using the false discovery rate (FDR) approach to consider multiple testing. 43
3. RESULTS
3.1. Baseline characteristics of participants
This study included a total of 793 FHS Offspring participants, with 55.5% being women, who were < 60 years old (Table 1). The mean age was similar between men and women (53 years), but women had lower education levels compared to men (P < 0.001). Men had a slightly lower Mini‐Mental State Examination (MMSE) score (29.1 vs. 29.3, P < 0.001) compared to women at baseline. The mean plasma levels of Aβ40, Aβ42, HbA1c, LDL, TNF‐ɑ, IL‐6, and resistin (P > 0.05) were similar in men and women. Women exhibited higher levels of HR, TC, HDL, fibrinogen, adiponectin, and CRP (P < 0.05). Conversely, men had higher levels of BMI, SBP, DBP, FBG, FBI, LDL, triglycerides, and IL‐18 (P < 0.05; Table 1).
TABLE 1.
Characteristics of the 793 FHS participants < 60 years old.
| Variable | Total sample (n = 793) | Women (n = 440) | Men (n = 353) | P value |
|---|---|---|---|---|
| Age, years | 52.6 (4.9) | 52.6 (4.8) | 52.7 (5.0) | 0.852 |
| Education, % | <0.001 | |||
| Less than high school | 9 (1.1%) | 2 (0.5%) | 7 (2.0%) | |
| High school/some college | 408 (51.5%) | 251 (57.0%) | 157 (44.5%) | |
| College or above | 376 (47.4%) | 187 (42.5%) | 189 (53.5%) | |
| APOE ε4+, % | 0.806 | |||
| Non‐carriers | 594 (78.2%) | 332 (78.5%) | 262 (77.7%) | |
| Carriers | 166 (21.8%) | 91 (21.5%) | 75 (22.3%) | |
| MMSE | 29.2 (1.1) | 29.3 (1.0) | 29.1 (1.2) | <0.001 |
| Plasma Aβ42, pg/mL | 42.9 (9.0) | 43.1 (8.8) | 42.5 (9.1) | 0.263 |
| Plasma Aβ40, pg/mL | 151.3 (29.9) | 152.3 (29.8) | 150.0 (30.0) | 0.308 |
| BMI, kg/m2 | 28.0 (5.6) | 27.5 (6.4) | 28.7 (4.4) | 0.004 |
| SBP, mmHg | 119.6 (15.0) | 118.3 (16.0) | 121.2 (13.6) | 0.004 |
| DBP, mmHg | 75.1 (9.3) | 73.4 (9.3) | 77.3 (9.0) | <0.001 |
| HR, beats/min | 64.8 (10.3) | 65.8 (9.8) | 63.6 (10.7) | 0.002 |
| Fasting blood glucose, mg/dL | 100.3 (23.7) | 96.7 (22.5) | 104.9 (24.5) | <0.001 |
| Fasting blood Insulin, pmol/mL | 88.6 (58.8) | 80.2 (55.0) | 99.0 (61.7) | <0.001 |
| HbA1c, % | 5.5 (0.9) | 5.4 (0.8) | 5.6 (1.0) | 0.121 |
| TC, mg/dL | 201.6 (37.3) | 205.6 (38.5) | 196.7 (35.4) | <0.001 |
| HDL, mg/dL | 53.7 (16.0) | 60.8 (15.7) | 44.8 (11.3) | <0.001 |
| LDL, mg/dL | 122.4 (33.3) | 120.8 (34.5) | 124.4 (31.4) | 0.138 |
| Triglycerides, mg/dL | 129.9 (89.3) | 119.0 (71.6) | 143.5 (106.2) | <0.001 |
| Adiponectin, ng/dL | 9.3 (5.7) | 11.3 (5.7) | 6.7 (4.3) | <0.001 |
| C‐reactive protein, mg/L | 3.4 (4.8) | 4.0 (4.8) | 2.7 (4.7) | <0.001 |
| Fibrinogen, mg/dL | 363.9 (69.6) | 373.7 (72.1) | 351.4 (64.3) | <0.001 |
| Interleukin 6, pg/mL | 3.5 (5.6) | 3.5 (5.1) | 3.5 (6.1) | 0.945 |
| Interleukin 18, pg/mL | 242.3 (110.1) | 217.6 (107.8) | 273.3 (105.1) | <0.001 |
| Resistin, ng/dL | 13.7 (6.6) | 13.6 (6.1) | 13.9 (7.1) | 0.626 |
| TNF‐ɑ, pg/mL | 1.3 (1.2) | 1.4 (1.5) | 1.2 (0.5) | 0.073 |
Notes: Mean (± standard deviation,) is presented for continuous variables and count (percentages) for categorical variables. APOE ε4+, carrier participants with the APOE ε3/ε4 and ε4/ε4 alleles, the ε4 non‐carrier participants with the APOE ε2/ε3, ε2/ε2, and ε3/ε3 alleles. All prevalent dementia cases were excluded at the baseline.
Abbreviations: APOE, apolipoprotein E; BMI, body mass index; DBP, diastolic blood pressure; FHS, Framingham Heart Study; HbA1c, hemoglobin A1c; HDL, high‐density lipoprotein; HR, ventricular heart rate; LDL, low‐density lipoprotein; MMSE, Mini‐Mental State Examination; SBP, systolic blood pressure; TC, total cholesterol; TNF‐ɑ, tumor necrosis factor alpha.
3.2. Association of education and APOE with annualized memory change
Participants with college or above degrees displayed a significant slower (or absence of) memory decline over time in the pooled sample (beta = 1.3060, P = 0.020). In contrast, we did not find a significant association between APOE ε4+ status and the annualized change in memory function (Table S1 in supporting information). Sex‐specific analyses revealed that men and women had similar memory changes across two APOE groups, while higher education levels displayed the slower memory decline in both men and women (Figure S1 in supporting information).
3.3. Association of blood biomarkers with annualized memory change
We first examined the associations between blood biomarkers and annualized memory change using a pooled sample of 793 participants (Table 2). Higher plasma levels of adiponectin (beta = 0.028, P = 0.008) and HDL (beta = 0.0085, P = 0.015) were significantly associated with a slower (or absence of) memory decline over time in the pooled sample. A higher FBG level (beta = −0.0048, P = 0.020) was significantly associated with a faster memory decline over time in the pooled sample. No other blood biomarkers showed significant associations with annualized function change (Table 2).
TABLE 2.
The association of biomarkers with annualized memory change.
| Total (n = 793) | Women (n = 440) | Men (n = 353) | |||||||
|---|---|---|---|---|---|---|---|---|---|
| Biomarker | Beta | SE | P value | Beta | SE | P value | Beta | SE | P value |
| Adiponectin, ng/dL | 0.0275 | 0.0103 | 0.008 | 0.0314 | 0.0128 | 0.015 | 0.0157 | 0.0179 | 0.382 |
| Amyloid ratio, Aβ42/Aβ40 | 0.2878 | 0.6883 | 0.676 | 0.4134 | 0.8635 | 0.632 | 0.0190 | 1.1668 | 0.987 |
| Aβ40, pg/mL | 0.0007 | 0.0016 | 0.687 | 0.0014 | 0.0022 | 0.526 | —0.0003 | 0.0024 | 0.909 |
| Aβ42, pg/mL | 0.0034 | 0.0054 | 0.536 | 0.0134 | 0.0076 | 0.080 | —0.0080 | 0.0078 | 0.304 |
| BMI, kg/m2 | 0.0032 | 0.0086 | 0.711 | 0.0000 | 0.0104 | 0.997 | 0.0123 | 0.0161 | 0.445 |
| LDL, mg/dL | —0.0003 | 0.0015 | 0.829 | —0.0018 | 0.0019 | 0.333 | 0.0018 | 0.0023 | 0.444 |
| CRP, mg/L | —0.0092 | 0.0101 | 0.364 | —0.0130 | 0.0139 | 0.350 | —0.0039 | 0.0150 | 0.795 |
| DBP, mmHg | 0.0016 | 0.0052 | 0.765 | 0.0013 | 0.0071 | 0.848 | 0.0019 | 0.0079 | 0.812 |
| FBG, mg/dL | —0.0048 | 0.0021 | 0.020 | —0.0088 | 0.0029 | 0.003 | —0.0005 | 0.0029 | 0.860 |
| Fibrinogen, mg/dL | —0.0007 | 0.0007 | 0.317 | —0.0010 | 0.0009 | 0.260 | —0.0002 | 0.0011 | 0.875 |
| HbA1c, % | —0.0833 | 0.0574 | 0.147 | —0.2045 | 0.0877 | 0.020 | 0.0255 | 0.0755 | 0.735 |
| HDL, mg/dL | 0.0085 | 0.0035 | 0.015 | 0.0085 | 0.0042 | 0.044 | 0.0083 | 0.0063 | 0.185 |
| Plasma Insulin, pmol/L | —0.0007 | 0.0008 | 0.391 | —0.0024 | 0.0012 | 0.048 | 0.0010 | 0.0012 | 0.407 |
| Interleukin 18, pg/mL | —0.0006 | 0.0005 | 0.188 | —0.0006 | 0.0006 | 0.319 | —0.0006 | 0.0007 | 0.400 |
| Interleukin 6, pg/mL | 0.0075 | 0.0086 | 0.385 | —0.0008 | 0.0130 | 0.951 | 0.0151 | 0.0115 | 0.192 |
| Resistin, ng/dL | —0.0049 | 0.0081 | 0.545 | —0.0122 | 0.0120 | 0.307 | 0.0020 | 0.0108 | 0.852 |
| SBP, mmHg | 0.0030 | 0.0033 | 0.363 | 0.0031 | 0.0043 | 0.460 | 0.0029 | 0.0053 | 0.593 |
| TC, mg/dL | 0.0004 | 0.0013 | 0.770 | —0.0006 | 0.0017 | 0.714 | 0.0020 | 0.0021 | 0.330 |
| TNF‐ɑ, pg/mL | —0.0465 | 0.0497 | 0.350 | —0.0569 | 0.0540 | 0.294 | 0.0977 | 0.1692 | 0.564 |
| Triglycerides, mg/dL | 0.0000 | 0.0005 | 0.943 | —0.0007 | 0.0009 | 0.442 | 0.0003 | 0.0007 | 0.609 |
| HR, beats/min | —0.0049 | 0.0048 | 0.306 | —0.0052 | 0.0069 | 0.451 | —0.0046 | 0.0067 | 0.491 |
Notes: Association analyses were performed between biomarkers and annualized memory change, adjusting for baseline age, education, and baseline memory function score.
The P values below 0.05 have been highlighted in bold.
Abbreviations: Aβ, amyloid beta; BMI, body mass index; CRP, C‐reactive protein; DBP, systolic blood pressure; FBG, fasting blood glucose; HbA1c, hemoglobin A1c; HDL, high‐density lipoprotein; HR, ventricular heart rate; LDL, low‐density lipoprotein; SBP, systolic blood pressure; TC, total cholesterol; TNF‐ɑ, tumor necrosis factor alpha.
When FBG levels increased, memory function showed an overall declining trend, stabilizing within the range of 100 to 160 mg/dL (Figure 1). For adiponectin, higher levels were associated with a protective effect on memory function. As for HDL, we observed a U‐shaped relationship between HDL levels and memory change. Memory decline was associated with both high levels (> 90 mg/dL) and predominantly low levels (< 41 mg/dL) of HDL (Figure 1).
FIGURE 1.
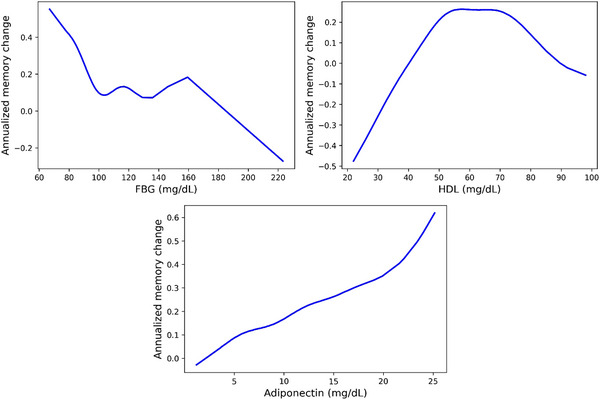
Casual dose‐response curves of FBG, HDL, and adiponectin with annualized memory change. The x axis represents the values of biomarkers. The y axis represents the annualized memory change, where a higher value indicates a slower memory decline. FBG, fasting blood glucose; HDL, high‐density lipoprotein
3.4. Sex‐specific association of blood biomarkers with annualized memory change
For women, higher adiponectin (beta = 0.031, P = 0.015) and HDL (beta = 0.0085, P = 0.044) levels were significantly associated with a slower (or absence of) memory decline over time, while a higher FBG level (beta = −0.0088, P = 0.003) was significantly associated with a faster memory decline over time. These trends were similar in pooled sample analyses. However, the three markers were not significantly associated with annualized memory change in men (adiponectin: beta = 0.016, P = 0.38; FBG: beta = −0.0005, P = 0.86; HDL: beta = 0.0083, P = 0.19) although the directionalities were consistent. Two markers showed significant associations with memory change in women but not in pooled or men‐only samples: higher HbA1c (beta = −0.20, P = 0.020) and plasma insulin (beta = −0.0024, P = 0.048) levels were significantly associated with a faster memory decline over time (Table 2, Figure 2). None of the rest of the biomarkers showed a significant association with annualized memory decline (Table 2).
FIGURE 2.
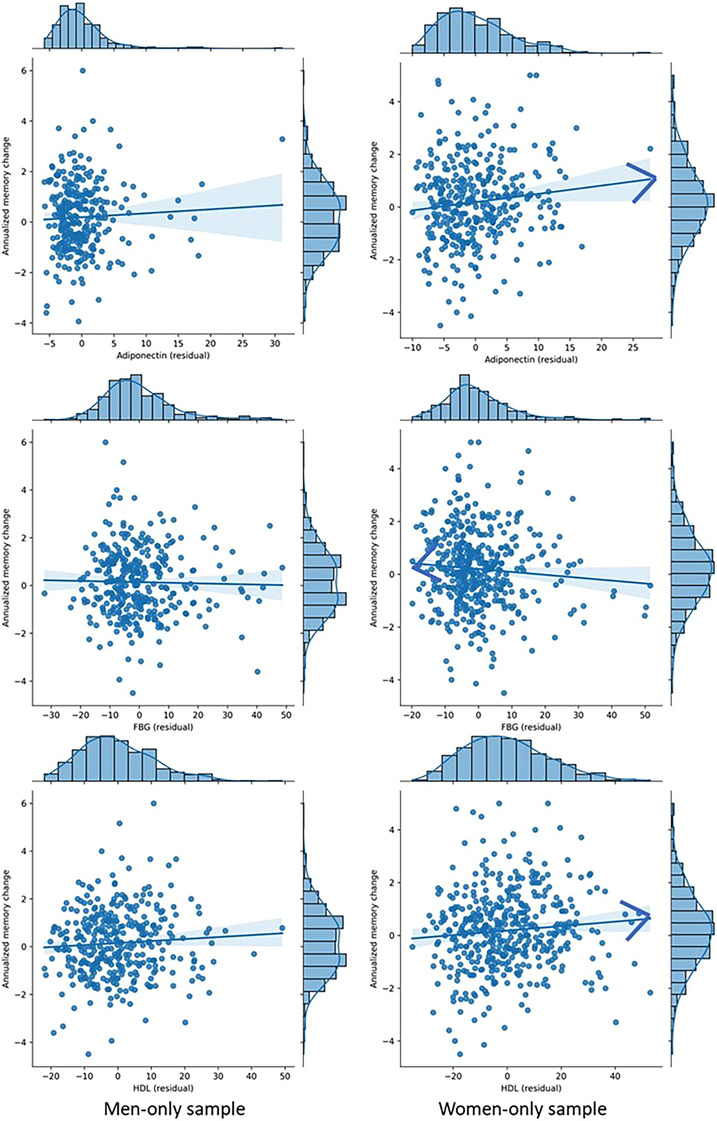
Three key biomarkers that impact memory change in a sex‐specific way. FBG, fasting blood glucose; HDL, high‐density lipoprotein
We performed sensitivity analyses by adjusting for APOE (Table S2 in supporting information). The results showed a consistent association for adiponectin in the main analysis in pooled samples. However, in women, we did not find significant associations of HDL and HbA1c with annualized memory change. Plasma insulin and FPG were not significantly associated with a faster memory decline over time in pooled or sex‐stratified samples.
We constructed partial correlation network analysis (Figure 3). In the pooled samples, adiponectin, FBG, and Hba1c show significant correlations with annualized memory change, with absolute partial correlation coefficients > 0.05. Specifically, adiponectin and Hba1c exhibit a positive partial correlation, indicating a potential protective effect on memory function. However, in men, IL‐6, TNF‐α, and Hba1c displayed a positive partial correlation with annualized memory changes, while Aβ42, CRP, FBG, HR, and IL‐18 show a negative partial correlation. In women, BMI and adiponectin demonstrate a positive partial correlation with annualized changes in memory function, suggesting a potential beneficial effect. Conversely, IL‐6 and FBG display a negative partial correlation, indicating a potential detrimental effect on memory function. The findings from association analyses also supported the findings from partial correlation analyses, as adiponectin and FBG showed consistent correlations with memory change. It is worth noting that we observed several unconnected nodes in the network, including SBP, DBP, and HDL, indicating these biomarkers had no significant partial correlations with annualized memory changes when controlling for all the other biomarkers.
FIGURE 3.
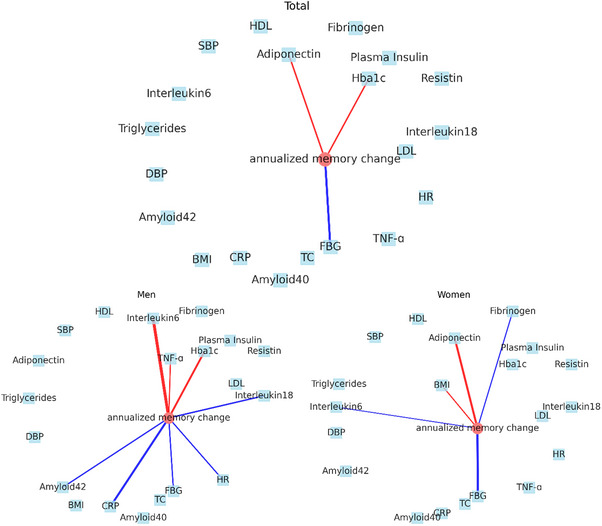
Partial correlation network of all biomarkers and annualized memory change in pooled samples, men, and women. Each biomarker is represented as a node in the graph. Nodes with absolute partial correlation coefficients above 0.05 are connected by edges. Blue edges indicate negative partial correlation coefficients, while red edges indicate positive partial correlation coefficients. BMI, body mass index; CRP, C‐reactive protein; DBP, diastolic blood pressure; FBG, fasting blood glucose; HbA1c, hemoglobin A1c; HDL, high‐density lipoprotein; HR, ventricular heart rate; LDL, low‐density lipoprotein; SBP, systolic blood pressure; TC, total cholesterol; TNF‐ɑ, tumor necrosis factor alpha
4. DISCUSSION
Studying the sex‐specific associations between blood biomarkers and memory change in a middle‐aged population will offer valuable insights into the etiology of dementia and aid in the development of prevention and treatment strategies. To the best of our knowledge, this study is among the early investigations to explore the sex‐specific associations between various blood biomarkers and memory change in middle‐aged adults. Several significant associations between blood biomarkers and memory decline were observed.
There has been growing focus and research interest in the examination of cognitive changes in relation to sex differences. In our previous study, which used data from older participants (≥ 60 years) in the prospective FHS, we found evidence of distinct impacts of two reproductive risks on cognitive decline. 9 Moreover, we observed that lower levels of plasma Aβ increased the risk for incident AD, and this effect was independent of reproductive risks. Additionally, our previous research indicates that both early‐life and later‐life pathological factors may play a role in the potential sex differences observed in the development of AD. 10 These studies focusing on elderly populations have already demonstrated the presence of sex differences. Therefore, exploring sex differences in middle‐aged populations in this study will provide a valuable complement to further understand sex differences across the lifespan.
Adiponectin, a hormone secreted by adipose tissue, is implicated in various physiological processes, including glucose regulation and inflammation. 44 Its role in cognitive functions, including memory function, has been investigated in a previous study. 45 However, the relationship between adiponectin and memory function has been inconsistent across studies, with some reporting positive associations, 46 , 47 and others finding negative associations. 48 , 49 Our study supports a negative association between adiponectin and memory function in middle‐aged participants, as we observed a slower (or absence of) memory decline over time associated with higher levels of adiponectin.
Aβ42 is a peptide produced during the metabolism of amyloid precursor protein and is a crucial pathological feature of AD. 50 In our previous study, we observed that lower plasma Aβ42 levels showed strong value for predicting memory decline in women compared to men in individuals aged ≥ 60. 10 However, in the middle‐aged population in the current study, we did not observe a consistent finding. This suggests that the relationship between Aβ42 and cognitive functions may vary across different age groups. The observed cognitive decline is likely attributable to several causes. While preclinical AD might be one of the reasons, cardiovascular disease or stroke, vascular dementia, and cognitive decline associated with conditions such as diabetes mellitus could also contribute to the observed cognitive decline.
Higher levels of FBG were associated with a faster memory decline in both the pooled sample and women, consistent with previous research showing elevated blood glucose levels as a risk factor for cognitive decline. 51 This finding underscores the importance of maintaining healthy blood glucose levels to prevent cognitive decline in midlife. In addition, it is worth noting that higher FBG level may be indicative of other underlying health problems, such as insulin resistance, obesity, or hypertension, which could contribute to cognitive decline. Therefore, future research should investigate the potential role of these factors in the association between FBG level and memory function. Furthermore, our study presents a sex‐specific relationship between two key metabolic markers, HbA1c and plasma insulin levels. In women, higher levels of these markers are associated with a faster memory decline over time. This negative association indicates that elevated blood sugar and insulin resistance, markers of poor metabolic health, are linked to cognitive decline. The fact that these associations were significant in women but not in men or the pooled sample suggests a sex‐specific vulnerability in women to the cognitive impacts of dysregulated glucose and insulin metabolism. This could be due to a variety of factors, including hormonal differences 52 and different responses to insulin resistance between men and women. 53
Previous research has demonstrated that HDL is a protective factor against cognitive decline. 54 Our study reveals a U‐shaped relationship between HDL and changes in memory function during middle age, which is consistent with the findings from recent studies. 55 , 56 This may be attributed to the non‐linear relationship between HDL and the risk of cardiovascular disease. 57 , 58 , 59 HDL is recognized for its role in the reverse cholesterol transport pathway. At an appropriate level, HDL removes cholesterol from cells in peripheral tissues, including foam cells within atherosclerotic plaques, playing an essential role in potentially reducing atherosclerotic plaque formation, and thus reducing the risk for cardiovascular diseases. 60 , 61 Improved cerebral perfusion might result from this process, possibly protecting against cognitive decline by ensuring a steady supply of blood to the brain. 62 In addition, HDL may facilitate Aβ clearance, and thus promote neuronal health. 63 On the other hand, a very high HDL level may increase the risk of heart disease and death, 58 , 59 which may potentially be attributed to the diverse functionalities of HDL particles that are related to antioxidant, anti‐inflammatory, and antiatherogenic properties. Moreover, HDL levels and metabolism are also influenced by estrogen, 64 , 65 which undergoes drastic changes in middle‐aged women. Estrogen has been recognized for its neuroprotective properties, and its potential interaction with HDL introduces another layer of complexity. Recent research has suggested that estrogen may collaborate with HDL to promote and sustain cognitive function. 66 This interaction could involve various mechanisms, including the modulation of cholesterol metabolism and the enhancement of neuronal membrane integrity. Previous research has suggested that individuals who do not carry the APOE ε4 allele may benefit from increased lipid availability, which could act as a protective mechanism for neuronal membranes. 67 This enhanced lipid supply appears to compensate for potential issues related to cholesterol metabolism. Notably, higher levels of HDL could potentially have negative effects on these individuals. Nonetheless, our findings warrant replication in other studies. With additional samples exhibiting high HDL levels, we might potentially observe a more pronounced correlation between elevated HDL levels and memory decline. This complexity suggests that a more in‐depth analysis of the interplay among HDL, sex, and cognitive function is warranted, considering both the potential risks and benefits.
While Aβ and tau have traditionally been associated with the pathogenesis of AD, 68 recent studies have shed light on the potential significance of cardiometabolic factors in influencing cognitive decline. 69 , 70 Midlife cardiometabolic risks, such as obesity, hypertension, and diabetes, have been implicated as crucial contributors to cognitive impairment and dementia later in life. 69 These risks, often rooted in modifiable lifestyle factors, have drawn increasing interest due to their potential impact on disease prevention and intervention strategies. Our research further supports the notion that cardiometabolic factors play a substantial role in cognitive health in middle‐aged adults. Through our study, we have observed significant associations between midlife cardiometabolic risks and memory decline, emphasizing the importance of addressing these factors in preserving cognitive function and reducing the burden of age‐related cognitive disorders. In addition, in this study, the causal dose–response analysis depicted the relationship between the blood biomarkers and the annualized memory change. By integrating cardiometabolic management strategies into midlife interventions, there is a potential for promising avenues in promoting healthy cognitive aging. These interventions may focus on lifestyle modifications, such as promoting healthy eating habits 71 and regular physical activity, 72 to mitigate the impact of cardiometabolic risks on cognitive decline. Our findings underscore the need for a comprehensive approach that considers not only the traditional markers of AD but also the influence of cardiometabolic factors on cognitive health. By recognizing the significance of these factors and incorporating them into midlife interventions, significant strides in preventing or delaying cognitive decline and promoting healthy cognitive aging can be made in the future.
The main strength of this study is the use of a group of community‐based middle‐aged adults from the FHS with comprehensive blood biomarker data and standardized NP examination, which enhances the robustness and generalizability of our findings. The findings of our study could be integrated into current practices for monitoring and managing dementia, with a particular focus on personalized approaches based on sex‐specific differences. For middle‐aged women, prioritizing metabolic health is especially crucial. It involves maintaining lower levels of blood sugar and minimizing insulin resistance. Additionally, health‐care management strategies should also be designed to address the effects of dysregulated glucose and insulin metabolism, as these can adversely affect women's memory function.
This study also has some limitations. First, it should be noted that the methods for blood biomarker analyses used in the FHS were optimal ones at the time of cohort inception. Further research is needed to confirm our findings using newer assays. While the short follow‐up may not lead to significant cognitive changes, the two consecutive NP examinations allow us to gather more data for analysis. Additionally, all participants in this study were of European ancestry, and thus the generalizability of our findings to other racial and ethnic groups may be limited and requires further investigation. Finally, while our study has identified significant associations between blood biomarkers and memory decline, it is important to note that observational studies cannot establish causality. Further research, such as randomized controlled trials, would be necessary to confirm causality and determine the potential for interventions to mitigate cognitive decline in middle‐aged adults. The sex differences in associations between biomarkers and memory change may be influenced by inherent sex differences in the levels of these biomarkers. These sex‐based variations in biomarker levels and their metabolic implications are crucial for understanding the differential impact of these biomarkers on cognitive health in men and women. Further research is necessary to deepen our understanding of the relationships and to explore the underlying mechanisms that drive these sex‐specific differences.
In summary, this study suggests that there are sex‐specific blood biomarkers for memory change in middle‐aged adults. Our findings highlight the importance of targeting cardiometabolic risks and the need to validate midlife‐specific biomarkers that can accelerate the development of primary preventive strategies.
CONFLICTS OF INTEREST STATEMENT
PMD has received research grants, advisory/board fees, and/or stock from several companies and is a co‐inventor on several patents related to the diagnosis and treatment of dementia. Other authors declare that they have no conflict of interests. Author disclosures are available in the supporting information.
CONSENT STATEMENT
All participants provided written informed consent.
Supporting information
Supporting Information
Supporting Information
ACKNOWLEDGMENTS
We would like to thank the Framingham participants for their support. This report was funded by the Cure Alzheimer's Fund. Data collection was supported by N01‐HC‐25195, HHSN268201500001, and by grants (R01AG059727, R01AG016495, R01AG008122, R01AG062109, U19 AG068753) from the National Institute on Aging.
Ding H, Liu C, Li Y, et al. Sex‐specific blood biomarkers linked to memory changes in middle‐aged adults: The Framingham Heart Study. Alzheimer's Dement. 2024;16:e12569. 10.1002/dad2.12569
Huitong Ding and Chunyu Liu share first authorship.
Contributor Information
Huitong Ding, Email: dinghfut@bu.edu.
Chunyu Liu, Email: liuc@bu.edu.
REFERENCES
- 1. Cipriani G, Danti S, Picchi L, Nuti A, Fiorino MD. Daily functioning and dementia. Dement Neuropsychol . 2020;14:93‐102. [DOI] [PMC free article] [PubMed] [Google Scholar]
- 2. Vijayan M, Reddy PH. Stroke, vascular dementia, and Alzheimer's disease: molecular links. J Alzheimer's Dis. 2016;54(2):427‐443. [DOI] [PMC free article] [PubMed] [Google Scholar]
- 3. Shively S, Scher AI, Perl DP, Diaz‐Arrastia R. Dementia resulting from traumatic brain injury: what is the pathology? Arch Neurol. 2012;69(10):1245‐1251. [DOI] [PMC free article] [PubMed] [Google Scholar]
- 4. Lin KA, Doraiswamy PM. When mars versus venus is not a cliche: gender differences in the neurobiology of Alzheimer's disease. Front Neurol. 2014;5:288. doi: 10.3389/fneur.2014.00288 [DOI] [PMC free article] [PubMed] [Google Scholar]
- 5. Snyder HM, Asthana S, Bain L, et al. Sex biology contributions to vulnerability to Alzheimer's disease: a think tank convened by the Women's Alzheimer's Research Initiative. Alzheimers Dement. 2016;12(11):1186‐1196. doi: 10.1016/j.jalz.2016.08.004 [DOI] [PMC free article] [PubMed] [Google Scholar]
- 6. Zhu D, Montagne A, Zhao Z. Alzheimer's pathogenic mechanisms and underlying sex difference. Cell Mol Life Sci. 2021;78:4907‐4920. [DOI] [PMC free article] [PubMed] [Google Scholar]
- 7. Ferretti MT, Iulita MF, Cavedo E, et al. Sex differences in Alzheimer disease—the gateway to precision medicine. Nat Rev Neurol. 2018;14(8):457‐469. [DOI] [PubMed] [Google Scholar]
- 8. Rahman A, Jackson H, Hristov H, et al. Sex and gender driven modifiers of Alzheimer's: the role for estrogenic control across age, race, medical, and lifestyle risks. Front Aging Neurosci. 2019;11:315. [DOI] [PMC free article] [PubMed] [Google Scholar]
- 9. Ding H, Li Y, Ang T, et al. Reproductive markers in Alzheimer's disease progression: the Framingham heart study. J Prev Alzheimers Dis. 2023;10:530‐535. [DOI] [PMC free article] [PubMed] [Google Scholar]
- 10. Liu C, Li Y, Nwosu A, et al. Sex‐specific biomarkers in Alzheimer's disease progression: Framingham Heart Study. Alzheimers Dement . 2022;14(1):e12369. [DOI] [PMC free article] [PubMed] [Google Scholar]
- 11. Younes L, Albert M, Moghekar A, Soldan A, Pettigrew C, Miller MI. Identifying changepoints in biomarkers during the preclinical phase of Alzheimer's disease. Front Aging Neurosci. 2019;11:74. doi: 10.3389/fnagi.2019.00074 [DOI] [PMC free article] [PubMed] [Google Scholar]
- 12. Lafortune L, Martin S, Kelly S, et al. Behavioural risk factors in mid‐life associated with successful ageing, disability, dementia and frailty in later life: a rapid systematic review. PLoS One. 2016;11(2):e0144405. [DOI] [PMC free article] [PubMed] [Google Scholar]
- 13. Li X‐Y, Zhang M, Xu W, et al. Midlife modifiable risk factors for dementia: a systematic review and meta‐analysis of 34 prospective cohort studies. Curr Alzheimer Res . 2019;16(14):1254‐1268. [DOI] [PubMed] [Google Scholar]
- 14. Whitmer RA, Sidney S, Selby J, Johnston SC, Yaffe K. Midlife cardiovascular risk factors and risk of dementia in late life. Neurology. 2005;64(2):277‐281. [DOI] [PubMed] [Google Scholar]
- 15. Li J, Joshi P, Ang TFA, et al. Mid‐to late‐life body mass index and dementia risk: 38 years of follow‐up of the Framingham Study. Am J Epidemiol. 2021;190(12):2503‐2510. [DOI] [PMC free article] [PubMed] [Google Scholar]
- 16. Kivipelto M, Ngandu T, Laatikainen T, Winblad B, Soininen H, Tuomilehto J. Risk score for the prediction of dementia risk in 20 years among middle aged people: a longitudinal, population‐based study. Lancet Neurol. 2006;5(9):735‐741. [DOI] [PubMed] [Google Scholar]
- 17. Liu L, Zhang C, Lv X, et al. Sex‐specific associations between lipids and cognitive decline in the middle‐aged and elderly: a cohort study of Chinese adults. Alzheimers Res Ther . 2020;12(1):1‐13. [DOI] [PMC free article] [PubMed] [Google Scholar]
- 18. Alzheimer's Association . 2021 Alzheimer's disease facts and figures. https://www.alz.org/media/documents/alzheimers‐facts‐and‐figures.pdf 2021. DOI: https://www.alz.org/media/documents/alzheimers‐facts‐and‐figures.pdf
- 19. Feinleib M, Kannel WB, Garrison RJ, McNamara PM, Castelli WP. The Framingham Offspring Study. Design and preliminary data. Prev Med. 1975;4(4):518‐525. https://www.ncbi.nlm.nih.gov/pubmed/1208363 [DOI] [PubMed] [Google Scholar]
- 20. Dawber TR, Meadors GF. Epidemiological approaches to heart disease: the Framingham Study. Am J Public Health Nations Health. 1951;41(3):279‐281. https://www.ncbi.nlm.nih.gov/pubmed/14819398 [DOI] [PMC free article] [PubMed] [Google Scholar]
- 21. Splansky GL, Corey D, Yang Q, et al. The third generation cohort of the national heart, lung, and blood institute's Framingham heart study: design, recruitment, and initial examination. Am J Epidemiol. 2007;165:1328‐1335. doi: 10.1093/aje/kwm021 [DOI] [PubMed] [Google Scholar]
- 22. Baruch L. Hypertension and the elderly: more than just blood pressure control. J Clin Hypertens . 2004;6(5):249‐255. [DOI] [PMC free article] [PubMed] [Google Scholar]
- 23. Hadaegh F, Mohebi R, Khalili D, Hasheminia M, Sheikholeslami F, Azizi F. High normal blood pressure is an independent risk factor for cardiovascular disease among middle‐aged but not in elderly populations: 9‐year results of a population‐based study. J Hum Hypertens. 2013;27(1):18‐23. [DOI] [PubMed] [Google Scholar]
- 24. Li J, Joshi P, Fang T, et al. Mid‐ to late‐ life body mass index and dementia risk: 38 years of follow‐up of the Framingham study. Am J Epidemiol. 2021;190:2503‐2510. doi: 10.1093/aje/kwab096 [DOI] [PMC free article] [PubMed] [Google Scholar]
- 25. Albanese E, Launer LJ, Egger M, et al. Body mass index in midlife and dementia: systematic review and meta‐regression analysis of 589,649 men and women followed in longitudinal studies. Alzheimers Dement (Amst). 2017;8:165‐178. doi: 10.1016/j.dadm.2017.05.007 [DOI] [PMC free article] [PubMed] [Google Scholar]
- 26. Kennelly SP, Lawlor BA, Kenny RA. Blood pressure and dementia—a comprehensive review. Ther Adv Neurol Disord. 2009;2(4):241‐260. doi: 10.1177/1756285609103483 [DOI] [PMC free article] [PubMed] [Google Scholar]
- 27. Cacciatore F, Testa G, Langellotto A, et al. Role of ventricular rate response on dementia in cognitively impaired elderly subjects with atrial fibrillation: a 10‐year study. Dement Geriatr Cogn Disord. 2012;34(3‐4):143‐148. doi: 10.1159/000342195 [DOI] [PubMed] [Google Scholar]
- 28. Akomolafe A, Beiser A, Meigs JB, et al. Diabetes mellitus and risk of developing Alzheimer disease: results from the Framingham Study. Arch Neurol. 2006;63(11):1551‐1555. doi: 10.1001/archneur.63.11.1551 [DOI] [PubMed] [Google Scholar]
- 29. Satizabal CL, Beiser AS, Chouraki V, Chene G, Dufouil C, Seshadri S. Incidence of dementia over three decades in the Framingham heart study. N Engl J Med. 2016;374(6):523‐532. doi: 10.1056/NEJMoa1504327 [DOI] [PMC free article] [PubMed] [Google Scholar]
- 30. Peloso GM, Beiser AS, Destefano AL, Seshadri S. Genetic interaction with plasma lipids on Alzheimer's disease in the Framingham Heart Study. J Alzheimers Dis. 2018;66(3):1275‐1282. doi: 10.3233/JAD-180751 [DOI] [PMC free article] [PubMed] [Google Scholar]
- 31. Tan ZS, Seshadri S, Beiser A, et al. Plasma total cholesterol level as a risk factor for Alzheimer disease: the Framingham Study. Arch Intern Med. 2003;163(9):1053‐1057. doi: 10.1001/archinte.163.9.1053 [DOI] [PubMed] [Google Scholar]
- 32. Chouraki V, Beiser A, Younkin L, et al. Plasma amyloid‐beta and risk of Alzheimer's disease in the Framingham Heart Study. Alzheimers Dement. 2015;11(3):249‐257 e1. doi: 10.1016/j.jalz.2014.07.001 [DOI] [PMC free article] [PubMed] [Google Scholar]
- 33. Jefferson AL, Massaro JM, Wolf PA, et al. Inflammatory biomarkers are associated with total brain volume: the Framingham Heart Study. Neurology. 2007;68(13):1032‐1038. doi: 10.1212/01.wnl.0000257815.20548.df [DOI] [PMC free article] [PubMed] [Google Scholar]
- 34. Wilson PW, Pencina M, Jacques P, Selhub J, D'Agostino R, O'Donnell CJ. C‐reactive protein and reclassification of cardiovascular risk in the Framingham Heart Study. Circ Cardiovasc Qual Outcomes. 2008;1(2):92‐97. doi: 10.1161/CIRCOUTCOMES.108.831198 [DOI] [PMC free article] [PubMed] [Google Scholar]
- 35. Ryu JK, McLarnon JG. A leaky blood‐brain barrier, fibrinogen infiltration and microglial reactivity in inflamed Alzheimer's disease brain. J Cell Mol Med. 2009;13(9A):2911‐2925. doi: 10.1111/j.1582-4934.2008.00434.x [DOI] [PMC free article] [PubMed] [Google Scholar]
- 36. Cortes‐Canteli M, Paul J, Norris EH, et al. Fibrinogen and beta‐amyloid association alters thrombosis and fibrinolysis: a possible contributing factor to Alzheimer's disease. Neuron. 2010;66(5):695‐709. doi: 10.1016/j.neuron.2010.05.014 [DOI] [PMC free article] [PubMed] [Google Scholar]
- 37. Lahoz C, Schaefer EJ, Cupples LA, et al. Apolipoprotein E genotype and cardiovascular disease in the Framingham Heart Study. Atherosclerosis. 2001;154(3):529‐537. doi: 10.1016/s0021-9150(00)00570-0 [DOI] [PubMed] [Google Scholar]
- 38. Farmer ME, White LR, Kittner SJ, et al. Neuropsychological test performance in Framingham: a descriptive study. Psychol Rep. 1987;60(3_part_2):1023‐1040. [DOI] [PubMed] [Google Scholar]
- 39. Au R, Seshadri S, Wolf PA, et al. New norms for a new generation: cognitive performance in the framingham offspring cohort. Exp Aging Res. 2004;30(4):333‐358. [DOI] [PubMed] [Google Scholar]
- 40. Wechsler D, Wechsler D. The Wechser‐Bellevue intelligence scale. The Psychological Corporation; 1946. [Google Scholar]
- 41. Galagate D. Causal inference with a continuous treatment and outcome: alternative estimators for parametric dose‐response functions with applications. 2016. [Google Scholar]
- 42. Kobrosly RW. Causal‐curve: a python causal inference package to estimate causal dose‐response curves. J Open Source Software. 2020;5(52):2523. [Google Scholar]
- 43. Benjamini Y, Hochberg Y. Controlling the false discovery rate: a practical and powerful approach to multiple testing. J R Stat Soc Series B Stat Methodol. 1995;57(1):289‐300. [Google Scholar]
- 44. Fantuzzi G. Adipose tissue, adipokines, and inflammation. J Allergy Clin Immunol. 2005;115(5):911‐919. [DOI] [PubMed] [Google Scholar]
- 45. Rizzo MR, Fasano R, Paolisso G. Adiponectin and cognitive decline. Int J Mol Sci. 2020;21(6):2010. [DOI] [PMC free article] [PubMed] [Google Scholar]
- 46. De Franciscis P, Barbieri M, Leo S, et al. Serum adiponectin levels are associated with worse cognitive function in postmenopausal women. PLoS One. 2017;12(12):e0186205. [DOI] [PMC free article] [PubMed] [Google Scholar]
- 47. Cezaretto A, Suemoto CK, Bensenor I, Lotufo PA, de Almeida‐Pititto B, Ferreira SR. Association of adiponectin with cognitive function precedes overt diabetes in the Brazilian Longitudinal Study of Adult Health: eLSA. Diabetol Metab Syndr . 2018;10(1):1‐8. [DOI] [PMC free article] [PubMed] [Google Scholar]
- 48. Wennberg A, Gustafson D, Hagen CE, et al. Serum adiponectin levels, neuroimaging, and cognition in the mayo clinic study of aging. J Alzheimer's Dis . 2016;53(2):573‐581. [DOI] [PMC free article] [PubMed] [Google Scholar]
- 49. Kim H, Jun S, Kim BS, Kim I‐J, AsDN Initiative. Serum adiponectin in Alzheimer's disease (AD): association with AD biomarkers and cognitive outcome. J Alzheimer's Dis . 2021;84(3):1163‐1172. [DOI] [PubMed] [Google Scholar]
- 50. Dewachter I, Reversé D, Caluwaerts N, et al. Neuronal deficiency of presenilin 1 inhibits amyloid plaque formation and corrects hippocampal long‐term potentiation but not a cognitive defect of amyloid precursor protein [V717I] transgenic mice. J Neurosci. 2002;22(9):3445‐3453. [DOI] [PMC free article] [PubMed] [Google Scholar]
- 51. Wheeler MJ, Dempsey PC, Grace MS, et al. Sedentary behavior as a risk factor for cognitive decline? A focus on the influence of glycemic control in brain health. Alzheimers Dement . 2017;3(3):291‐300. [DOI] [PMC free article] [PubMed] [Google Scholar]
- 52. Ethun K. Sex and gender differences in body composition, lipid metabolism, and glucose regulation. Sex differences in physiology. Elsevier; 2016:145‐165. [Google Scholar]
- 53. Goedecke JH, George C, Veras K, et al. Sex differences in insulin sensitivity and insulin response with increasing age in black South African men and women. Diabetes Res Clin Pract. 2016;122:207‐214. [DOI] [PubMed] [Google Scholar]
- 54. Crichton GE, Elias MF, Davey A, Sullivan KJ, Robbins MA. Higher HDL cholesterol is associated with better cognitive function: the Maine‐Syracuse study. J Int Neuropsychol Soc. 2014;20(10):961‐970. [DOI] [PMC free article] [PubMed] [Google Scholar]
- 55. Ferguson EL, Zimmerman SC, Jiang C, et al. Low‐and high‐density lipoprotein cholesterol and dementia risk over 17 years of follow‐up among members of a large health care plan. Neurology. 2023;101:e2172‐e2184. [DOI] [PMC free article] [PubMed] [Google Scholar]
- 56. Gong J, Harris K, Peters SA, Woodward M. Serum lipid traits and the risk of dementia: a cohort study of 254,575 women and 214,891 men in the UK Biobank. Eclinicalmedicine. 2022;54. [DOI] [PMC free article] [PubMed] [Google Scholar]
- 57. Zhong G‐C, Huang S‐Q, Peng Y, et al. HDL‐C is associated with mortality from all causes, cardiovascular disease and cancer in a J‐shaped dose‐response fashion: a pooled analysis of 37 prospective cohort studies. Eur J Prev Cardiol. 2020;27(11):1187‐1203. [DOI] [PubMed] [Google Scholar]
- 58. Liu C, Dhindsa D, Almuwaqqat Z, Sun YV, Quyyumi AA. Very high high‐density lipoprotein cholesterol levels and cardiovascular mortality. Am J Cardiol. 2022;167:43‐53. doi: 10.1016/j.amjcard.2021.11.041 (In eng) [DOI] [PubMed] [Google Scholar]
- 59. Liu C, Dhindsa D, Almuwaqqat Z, et al. Association between high‐density lipoprotein cholesterol levels and adverse cardiovascular outcomes in high‐risk populations. JAMA Cardiol. 2022;7(7):672‐680. doi: 10.1001/jamacardio.2022.0912 (In eng) [DOI] [PMC free article] [PubMed] [Google Scholar]
- 60. Welty FK. How do elevated triglycerides and low HDL‐cholesterol affect inflammation and atherothrombosis? Curr Cardiol Rep. 2013;15:1‐13. [DOI] [PMC free article] [PubMed] [Google Scholar]
- 61. Chalmers AD, Bursill CA, Myerscough MR. Nonlinear dynamics of early atherosclerotic plaque formation may determine the efficacy of high density lipoproteins (HDL) in plaque regression. PLoS One. 2017;12(11):e0187674. [DOI] [PMC free article] [PubMed] [Google Scholar]
- 62. Wolters FJ, Zonneveld HI, Hofman A, et al. Cerebral perfusion and the risk of dementia: a population‐based study. Circulation. 2017;136(8):719‐728. [DOI] [PubMed] [Google Scholar]
- 63. Chernick D, Zhong R, Li L. The role of HDL and HDL mimetic peptides as potential therapeutics for Alzheimer's disease. Biomolecules. 2020;10(9):1276. [DOI] [PMC free article] [PubMed] [Google Scholar]
- 64. Palmisano BT, Zhu L, Stafford JM. Role of estrogens in the regulation of liver lipid metabolism. Adv Exp Med Biol. 2017:1043:227‐256. [DOI] [PMC free article] [PubMed] [Google Scholar]
- 65. Bush TL, Barrett‐Connor E. Noncontraceptive estrogen use and cardiovascular disease. Epidemiol Rev. 1985;7:89‐104. [PubMed] [Google Scholar]
- 66. Alonso de Leciñana M, Egido JA. Estrogens as neuroprotectants against ischemic stroke. Cerebrovasc Dis. 2006;21(2):48‐53. [DOI] [PubMed] [Google Scholar]
- 67. de Oliveira FF, Chen ES, Smith MC, Bertolucci PHF. Longitudinal lipid profile variations and clinical change in Alzheimer's disease dementia. Neurosci Lett. 2017;646:36‐42. [DOI] [PubMed] [Google Scholar]
- 68. Marksteiner J, Hinterhuber H, Humpel C. Cerebrospinal fluid biomarkers for diagnosis of Alzheimer's disease: beta‐amyloid (1‐42), tau, phospho‐tau‐181 and total protein. Drugs Today (Barc). 2007;43(6):423‐431. [DOI] [PubMed] [Google Scholar]
- 69. Pasqualetti G, Thayanandan T, Edison P. Influence of genetic and cardiometabolic risk factors in Alzheimer's disease. Ageing Res Rev. 2022;81:101723. [DOI] [PubMed] [Google Scholar]
- 70. Fayosse A, Nguyen D‐P, Dugravot A, et al. Risk prediction models for dementia: role of age and cardiometabolic risk factors. BMC Med. 2020;18:1‐10. [DOI] [PMC free article] [PubMed] [Google Scholar]
- 71. Solfrizzi V, Panza F, Frisardi V, et al. Diet and Alzheimer's disease risk factors or prevention: the current evidence. Expert Rev Neurother. 2011;11(5):677‐708. [DOI] [PubMed] [Google Scholar]
- 72. Rolland Y, van Kan GA, Vellas B. Physical activity and Alzheimer's disease: from prevention to therapeutic perspectives. J Am Med Dir Assoc. 2008;9(6):390‐405. [DOI] [PubMed] [Google Scholar]
Associated Data
This section collects any data citations, data availability statements, or supplementary materials included in this article.
Supplementary Materials
Supporting Information
Supporting Information