

Abstract
Background
Life expectancy is a significant result indicator of public health and sustainable development. Therefore, one of the final objectives of all economic and social policies is to increase the life expectancy. In this context, a limited number of researchers have investigated the relationship between ICT penetration and life expectancy. However, multiple interaction channels exist between ICT penetration and life expectancy. Furthermore, the studies have usually focused on the effect of ICT penetration on life expectancy through regression and ignored the effect of life expectancy on ICT penetration to a large extent. Therefore, this study aims to contribute to the empirical literature by investigating the causal relationship between ICT indicators and life expectancy.
Methods
This study uses symmetric and asymmetric causality approaches to investigate the two-way interaction between ICT indicators and life expectancy in emerging market economies over the 1997–2020 period. Employment of the asymmetric causality test enables us to analyze the hidden relationships between ICT indicators and life expectancy, unlike the traditional causality test.
Results
The results of the symmetric causality test uncover a bidirectional causal interaction between mobile subscriptions and life expectancy but a one-way causal relationship from life expectancy to internet usage. However, the asymmetric causality test results uncover a unidirectional causal relationship between mobile subscriptions and life expectancy in China, Colombia, Czechia, Egypt, Greece, India, Kuwait and Turkiye due to positive shocks from mobile subscriptions. On the other hand, a bidirectional causal interaction exists between internet usage and life expectancy in all countries due to negative shocks from internet usage and life expectancy. Last, a unidirectional causal relationship exists between internet usage and life expectancy in all countries due to positive shocks from internet usage.
Conclusion
ICT indicators significantly influence life expectancy health in a sample of emerging market economies. Therefore, internet usage and mobile devices are significant tools to improve life expectancy.
Keywords: Mobile subscription, Internet usage, ICT penetration, Life expectancy, Public health, Sustainable development, Emerging market economies, Asymmetric causality analysis
Introduction
Life expectancy is a crucial result indicator of public health, well-being, and economic policies [1] and also one of the 17 Sustainable Development Goals (S.D.G.s) entitled “Ensure healthy lives and promote well-being for all at all ages” (SDG-3) [2]. In this regard, life expectancy is a significant indicator of human development and population health [3, 4]. Furthermore, the achievement of the other S.D.G.s is closely related to public health because human capital can contribute more to the economy through innovation, technological progress, and production as life expectancy increases [5]. The leading countries in terms of human development, such as Japan, the United States of America, Singapore, South Korea and Germany, have a high capacity to produce new technologies, and these countries are the pioneers of the digital world [6, 7]. Therefore, every country tries to experience improvements in public health through economic growth and development, education, and health policies.
The average life expectancy in the world was 30 years before industrialization but has reached 70 years in parallel with the developments in the health sector and technologies [8–10]. Improvements in medical and production technologies can contribute to life expectancy by diagnosing and treating diseases, sustainable economic growth, environmental sustainability, and green energy [11–14]. However, there has been remarkable heterogeneity in life expectancy among countries. For example, life expectancy at birth in Chad, Nigeria, and Lesotho were respectively 52.53, 52.68, and 53.06 in 2021, but life expectancy in Japan, Australia, and Switzerland were respectively 84.78, 84.53, and 83.99 in 2021 [15].
Therefore, identifying factors underlying heterogeneity in life expectancy is vital for optimal policy-making. In this context, the researchers have suggested improvements in the healthcare field and various socioeconomic factors such as income level, economic stability, unemployment, education, technological development, urbanization, forestry, and demographic factors [16–28]. Considering the limited empirical literature, this study investigates the interplay between information and communication technologies (ICT) and life expectancy.
In the literature, a limited number of research on the effect of ICT indicators, including Internet, mobile subscriptions, and fixed broadband subscriptions, on life expectancy in samples of different country groups, as seen in Table 1, and the studies have mainly discovered a positive effect of ICT indicators on life expectancy [29–39]. But Ilikkan Özgür et al. [40] uncovered a negative effect of mobile users and Internet subscribers on life expectancy in the short and long term in a sample of BRICS-T countries, Wang et al. [41] revealed a positive effect of mobile internet use and mobile cellular subscriptions on life expectancy and a negative effect of fixed telephone subscriptions on life expectancy in selected low-income states. Lastly, Vaidean and Achim [42] revealed an inverted U-shaped interaction between ICT indicators and life expectancy in a panel of 185 countries. In this context, the researchers have generally focused on the effect of ICT indicators on life expectancy through regression analysis and ignored the effect of life expectancy on ICT penetration. However, there can be feedback between ICT and life expectancy. Furthermore, the researchers have usually employed symmetric econometric methods to investigate the nexus between ICT and life expectancy.
Table 1.
Empirical literature summary on the nexus between ICT indicators and life expectancy
| Study | Sample; study period | Method | Main findings |
|---|---|---|---|
| Mithas et al. [29] | 61 countries; 2005 | Regression | A positive effect of information technology investments on male and female life expectancy |
| Mimbi and Bankole [30] | 27 African countries; | Data envelopment analysis, cluster analysis, and regression | A positive effect of ICT proxied by annual telecom investment, line capacity of exchanges, International internet bandwidth, and full-time telecoms staff on life expectancy |
| Lee and Kim [31] | 16 Asian countries; 2009–2014 | Regression | A positive effect of ICT indicators (broadband, mobile phone, and Internet security) on life expectancy |
| Majeed and Khan [32] | 184 countries; 1990–2014 | Regression | A positive effect of ICT indicators on life expectancy |
| Alzaid et al. [33] | 156 countries; 1999, 2005, and 2010 | Regression | A positive effect of the Internet on life expectancy |
| Shao et al. [34] | 141 countries; 2012–2016 | Regression | A positive effect of ICT indicators on public health |
| Ronaghi [35] | Middle Eastern countries; 2008–2018 | Regression | A positive effect of ICT on life expectancy |
| Mlambo et al. [36] | SADC states: 2000–2018 | Cointegration and regression analysis | A weak positive effect of mobile cellular telephone subscriptions on maternal health |
| Rahman and Alam [37] | Australia; 1990–2018 | ARDL approach | A positive effect of ICT on life expectancy and unidirectional causal relationship from ICT to life expectancy |
| Zhang et al. [38] | 12 Asian countries; 1991–2019 | Dynamic ordinary least square and fully modified least squares | A positive effect of the Internet on life expectancy |
| Byaro et al. [39] | 48 sub-Saharan Africa countries; 2000–2020 | Quantile regression | A positive effect of Internet use health outcomes |
| Ilikkan Özgür et al. [40] | BRICS-T countries; 1990–2018 | ARDL | A negative effect of mobile users and Internet subscribers on short- and long-term life expectancy. |
| Wang et al. [41] | 28 countries, 2000–2017 | Regression | A positive effect of mobile internet use and mobile cellular subscriptions on life expectancy and a negative effect of fixed telephone subscriptions on life expectancy |
| Vaidean and Achim [42] | 185 countries; 2005–2018 | Regression | An inverted U-shaped interaction between ICT indicators and population health |
In conclusion, this article aims to contribute to the empirical literature in three aspects. Unlike the related literature, the first empirical contribution of the study is to conduct a two-way analysis between ICT indicators and life expectancy. The second contribution of the study is to employ both asymmetric and traditional causality tests simultaneously to analyze the nexus between ICT and life expectancy. The third contribution of the paper is to analyze the nexus between ICT and life expectancy in the sample of emerging markets. Consequently, the findings of the study will be useful to arrange the policies toward improvements in public health.
The emerging markets are specified as the sample of the study because the emerging markets, including China, India, Indonesia, the Korean Republic, and Thailand, have been the drivers of global economic growth, global population, and ICT development and include the most innovative companies in the world [43]. All emerging economies except Mexico experienced varying degrees of improvements in life expectancy at birth. India, the Korean Republic, China, Thailand, and the United Arab Emirates obtained the most significant improvement in life expectancy at birth during the study period. But Kuwait, Greece, Indonesia, and the Philippines had the lowest improvement in life expectancy at birth [44]. However, all emerging countries experienced remarkable increases in internet usage and mobile cellular subscriptions during the study period [45, 46].
The next part of the article presents an extensive theoretical and empirical literature summary about the implications of ICT penetration; then, the dataset and econometric tests are described; econometric tests and discussion are introduced, and the article eventuates in the Conclusion.
Theoretical background and empirical literature review
ICT can affect life expectancy through different direct and indirect aspects. In this context, ICT can foster life expectancy through increasing access to information and sharing about health, healthy nutrition, and epidemics [32, 47–49]. Online health information can also enhance individuals’ health-related knowledge, improve doctor-patient communication, and, in turn, increase the early detection and treatment of diseases and lead individuals to make informed decisions about life quality [50–52]. Furthermore, ICT increases clinic time’s effective and efficient use [53].
ICT penetration can also negatively affect life expectancy through obesity, heart disease and musculoskeletal system problems as a result of reducing the physical movements of the individuals [42, 54, 55]. ICT penetration may also negatively affect life expectancy through health problems such as severe obesity, back pain and neck pain, orthopaedic/joint muscles, eye problems, hearing problems and physical inactivity [56]. On the other hand, ICT can impact life expectancy through economic growth, financial development, unemployment, green energy development, energy use, electronic waste, innovation, entrepreneurship, and production [34, 57–74]. Therefore, a significant impact of ICT on life expectancy is expected a priori. However, improvements in life expectancy can also foster ICT because people have more time to use and develop the ICT. Therefore, a mutual or one-way interaction between ICT and life expectancy is possible in theoretical terms based on countries’ characteristics.
The nexus between ICT indicators and life expectancy has begun to be questioned mainly since 2019 even though multiple theoretical interaction channels exist between ICT indicators and life expectancy. Most of the empirical studies in Table 1 usually analyzed the effect of ICT indicators on life expectancy. They uncovered a positive effect of ICT indicators on life expectancy in countries with different development levels [29–39]. However, Wang et al. [41] revealed both positive and negative effects of ICT indicators on life expectancy in 28 low-income countries. Furthermore, Ilikkan Özgür et al. [40] disclosed a negative effect of mobile users and internet subscribers on life expectancy in short and long-term BRICS-T countries. Last, Vaidean and Achim [42] uncovered an inverted U-shaped interaction between ICT indicators and population health in a panel of 185 countries.
In the related literature, only Rahman and Alam [37] investigated the causality between ICT indicators and life expectancy and disclosed a unidirectional causal relationship between ICT and life expectancy. However, most empirical studies have disregarded the possible effect of life expectancy on ICT development to a great extent until now. The researchers have usually applied regression to analyze the nexus between ICT indicators and life expectancy, and in turn, country-level analysis has been ignored. Furthermore, the researchers have generally employed symmetric econometric approaches in the empirical analyses. Therefore, this study investigates the causal interplay between ICT indicators and life expectancy through symmetric and asymmetric causality tests at panel and country levels.
In the literature, the nexus between ICT and human development, which also consists of life expectancy, has been investigated by relatively more researchers, and these studies generally uncovered a positive relationship between ICT indicators and human development [75–81]. However, the developed countries reached a significant saturation due to their high technology and ICT investments. In contrast, ICT investments in other country groups caused significant improvements in education and health and, in turn, contributed more to human development [75].
The following two hypotheses will be tested in the research article depending on the related theoretical and empirical literature:
H1. There is a significant association between internet usage and life expectancy.
H2. There is a significant association between mobile cellular subscriptions and life expectancy.
Methods
Data
Through symmetric and asymmetric causality tests, this study investigates the two-way interaction between ICT indicators and life expectancy in 23 emerging market economies. The variables employed in the econometric analyses are displayed in Table 2. Life expectancy (LIFEXP) is represented by life expectancy at birth because nearly all studies in Table 1 represented life expectancy by life expectancy at birth, and data on life expectancy at birth was obtained from UNDP [44]. On the other hand, ICT is represented by two indicators (internet usage and mobile cellular subscriptions) considering Lee and Kim [31], Zhang et al. [38], Byaro et al. [39], Ilikkan Özgür et al. [40], Wang et al. [41]. Internet usage (INTERNET) is proxied by individuals using the Internet (% of the population). Mobile cellular subscriptions (MOBIL) are represented by mobile cellular subscriptions (per 100 people), and both ICT indicators are respectively obtained from World Bank [45 & 46].
Table 2.
Data description
The study sample consists of 23 emerging markets (Brazil, Chile, China, Colombia, Czechia, Egypt, Greece, Hungary, India, Indonesia, Korea, Kuwait, Malaysia, Mexico, Peru, Philippines, Poland, Qatar, Saudi Arabia, South Africa, Thailand, Turkey, and the United Arab Emirates) and study term is 1997–2020 because sample size and period are optimized during this period considering the presence of ICT indicators. The Stata 17.0 and Gauss 12.0 are employed for econometric analyses.
The average life expectancy, internet usage as a per cent of the population, and mobile subscriptions per 100 people in emerging market economies are respectively 73.897 years, 37.361%, and 81.119. Still, both ICT penetration indicators show significant variation in the study sample as seen in Table 3.
Table 3.
Main characteristics of the series
| Variables | Obs | Mean | Std. Dev. | Min | Max |
|---|---|---|---|---|---|
| LIFEXP | 552 | 73.897 | 4.966 | 53.9797 | 83.6557 |
| INTERNET | 552 | 37.361 | 29.543 | 0.0323 | 100 |
| MOBIL | 552 | 81.119 | 51.981 | 0.0879 | 221.3088 |
Methodology
The causality between life expectancy and ICT indicators is respectively tested by Juodis-Karavias-Sarafidis (JKS) [82] causality test and Yılancı and Aydın [83] asymmetric causality test. The asymmetry refers to a variable with different responses to positive and negative shocks. Therefore, disregarding the asymmetric interaction between two variables can reduce the reliability of the empirical findings. In other words, the asymmetric causality test enables us to investigate the hidden relationship between two variables differently from the symmetric causality tests [83]. Consequently, employing the asymmetric causality test and the JKS (82) causality test would cause us to obtain more robust and reliable results.
JKS [82] causality test is developed for both homogenous and heterogeneous panels. Furthermore, the test employs the H.P.J. (Half-Panel Jacknife) technique by Dhaene and Jochmans [84] to decrease the pooled estimator’s Nickell bias. Last, the JKS [82] causality test generates relatively more reliable results in the case of T < N when compared with the Dumitrescu and Hurlin [85] causality test. The test is based on the following equation [82]:
| 1 |
for country i = 1,….N and years t = 1,…T.
In Eq. (1), is a scalar, ; I correspond to heterogeneous autoregressive effects and I heterogeneous Granger causality effects. JKS [82] accepts that indicates an autoregressive distributed lag process under the null hypothesis, for all I and q. This approach allows for a pooled estimator. To treat the bias problem of a pooled estimator, the test applies an H.P.J. estimator. When cross-sectional dependence occurs in panel data, the variance of the H.P.J. estimator can be obtained through bootstrapping. The obtained estimations are bias-corrected and give Wald statistics for the Granger non-causality test.
Yılancı and Aydın [83] improved the Kónya [86] bootstrap causality test regarding cross-sectional dependency and heterogeneity in a way that includes the asymmetric approach of Hatemi, J [87]. . Thus, Yılancı and Aydın [83] asymmetric causality test investigates how positive and negative shocks within the variables influence each other, unlike Kónya [86] bootstrap Granger symmetric causality test. As a result, Yılancı and Aydın [83] asymmetric causality test can uncover significant causal relationships that may be overlooked when a symmetric causality test is conducted. Therefore, this article performs an asymmetric causality test together with the JKS [82] symmetric causality test.
Results
In the applied part of the article, pre-tests of cross-sectional dependence and heterogeneity are performed in the first step. In line with this objective, L.M., LM CD, and LMadj. Tests respectively by [87–90] are implemented, and the results of these tests are introduced in Table 4. The null hypothesis (H0 = cross-sectional independence) is declined at a 5% significance level, and cross-sectional dependency among the series is unveiled.
Table 4.
Cross-sectional dependence tests’ results
| Test | Test Statistic | Prob. |
|---|---|---|
| LM | 1208 | 0.000 |
| LM CD | 17.22 | 0.0000 |
| LM adj | 104.8 | 0.0173 |
The homogeneity is investigated by Pesaran and Yamagata [91] in the second step, and the results of two homogeneity tests are introduced in Table 5. The null hypothesis in favour of homogeneity is declined at a 1% significance level, and heterogeneity is unveiled. In conclusion, unit root and causality tests that notice heterogeneity and cross-sectional dependence should be preferred for relatively more robust results.
Table 5.
Homogeneity tests’ results
| Test | Test Statistic | Prob. |
|---|---|---|
| 25.019 | 0.000 | |
| 27.407 | 0.000 |
The stationarity analysis of three variables under consideration (LIFEXP, INTERNET, and MOBIL) is conducted by Pesaran [92] CIPS unit root test and test results are introduced in Table 6. LIFEXPT, INTERNET, and MOBIL are nonstationary for their level values but become stationary for their first-differenced values.
Table 6.
CIPS panel unit root test results
| Variables | Constant | Constant + Trend |
|---|---|---|
| LIFEXP | -0.878 | 1.074 |
| d(LIFEXP) | -4.558a | -3.478a |
| INTERNET | 1.912 | 0.874 |
| d(INTERNET) | -2.606a | -5.785a |
| MOBIL | -0.201 | 0.592 |
| d(MOBIL) | -6.382a | -5.076a |
ait is significant at 1%
The causal interaction between ICT indicators and life expectancy in 23 emerging market economies over the 1997–2020 duration is first investigated by the JKS [82] causality test. First, we test whether the pair of internet usage and mobile subscription Granger causes life expectancy and the results of the causality analysis are reported in Table 7. The null hypothesis that internet usage and mobile subscriptions do not Granger-cause life expectancy is rejected at the 5% significance level. Therefore, both indicators have a significant effect on life expectancy. Furthermore, univariate causality analyses uncover a bidirectional causality between mobile subscriptions and life expectancy and unidirectional causality from life expectancy to internet usage (Fig. 1).
Table 7.
Results of JKS (2021) Granger non-causality test
| Null Hypothesis | H.P.J. Wald test | P values |
|---|---|---|
| Selected covariates ↛ LIFEXP | 12.8086 | 0.0017 |
| MOBIL ↛ LIFEXP | 5.3376 | 0.0209 |
| LIFEXP ↛ MOBIL | 67.9656 | 0.0000 |
| INTERNET ↛ LIFEXP | 0.5916 | 0.7439 |
| LIFEXP ↛ INTERNET | 172.4861 | 0.0000 |
Fig. 1.

Results of JKS (2021) Granger non-causality test
In the second stage, the causal interaction between ICT indicators and life expectancy is investigated through Yılancı and Aydın [83] asymmetric causality test and test results are introduced in Tables 8, 9, 10 and 11. First, the causality between MOBIL and LIFEXP with negative shocks is tested, and the results in indicate that there is not a significant causal interaction between two variables in case of negative shocks from both variables.
Table 8.
Results of asymmetric bootstrap Granger causality test
| Countries | MOBIL ↛ LIFEXP (-) | LIFEXP ↛ MOBIL (-) | ||||||
|---|---|---|---|---|---|---|---|---|
| Wald. Stat. | Bootstrap Critical Values | Wald. Stat. | Bootstrap Critical Values | |||||
| 1% | 5% | 10% | 1% | 5% | 10% | |||
| Brazil | 388.8971 | 2937.4151 | 787.4613 | 552.5777 | 563.5642 | 9486.2285 | 1660.7556 | 855.1336 |
| Chile | 388.9004 | 2655.0983 | 781.2009 | 550.2563 | 563.4352 | 10070.7565 | 1594.9264 | 862.3846 |
| China | 388.9049 | 2900.3285 | 778.3647 | 552.2556 | 563.5057 | 11986.3285 | 1682.6789 | 872.9949 |
| Colombia | 388.8796 | 2970.8222 | 789.5381 | 554.0158 | 563.5173 | 10252.4378 | 1690.2909 | 867.3679 |
| Czechia | 388.8792 | 2910.6685 | 786.4420 | 552.1317 | 563.5621 | 11851.9597 | 1727.7265 | 872.8187 |
| Egypt | 388.8878 | 2878.5091 | 793.1906 | 554.7188 | 563.5399 | 12777.6202 | 1660.0664 | 873.5820 |
| Greece | 388.8189 | 3102.6383 | 792.6803 | 553.9396 | 563.5668 | 11348.4541 | 1564.5671 | 873.3831 |
| Hungary | 388.8917 | 2761.5404 | 790.1609 | 554.0315 | 563.3726 | 12779.6594 | 1609.4294 | 836.0589 |
| India | 388.8619 | 3211.0305 | 787.8686 | 554.1767 | 563.5595 | 8907.3437 | 1675.7690 | 851.9747 |
| Indonesia | 388.7641 | 3066.6162 | 778.6839 | 554.4559 | 563.5556 | 9734.7872 | 1557.8606 | 861.5773 |
| Korea | 386.7365 | 2696.8575 | 781.9746 | 553.5933 | 563.4490 | 10862.2061 | 1612.1050 | 873.6177 |
| Kuwait | 388.6602 | 2890.2376 | 786.1060 | 552.7161 | 561.0216 | 10611.0512 | 1464.6705 | 858.3265 |
| Malaysia | 388.8791 | 2756.2314 | 784.7640 | 551.0671 | 529.2750 | 10405.8363 | 1682.4749 | 875.3577 |
| Mexico | 388.8436 | 2900.1807 | 778.6548 | 552.0594 | 563.5562 | 10297.8391 | 1657.6748 | 863.0830 |
| Peru | 388.9031 | 2808.1440 | 781.0338 | 552.7557 | 563.5679 | 12518.0953 | 1560.3053 | 854.9077 |
| Philippines | 388.9019 | 2653.7516 | 785.9607 | 555.7683 | 563.5556 | 12888.4247 | 1799.3115 | 891.4478 |
| Poland | 388.9033 | 2985.1986 | 795.1066 | 555.1616 | 562.8334 | 12598.8952 | 1754.3697 | 873.7802 |
| Qatar | 388.8933 | 3143.2487 | 790.6556 | 557.3084 | 563.5188 | 11893.8877 | 1690.6627 | 871.2358 |
| Saudi Arabia | 388.8954 | 2981.2147 | 786.8719 | 554.6219 | 563.5420 | 13081.0593 | 1660.7881 | 873.3847 |
| South Africa | 388.9012 | 3015.6914 | 797.9976 | 557.0983 | 563.5488 | 12551.0995 | 1684.1720 | 872.7918 |
| Thailand | 388.9033 | 2802.3853 | 783.2525 | 551.8219 | 563.5618 | 12576.2108 | 1515.0646 | 859.9611 |
| Turkiye | 388.7990 | 2886.9215 | 783.7597 | 554.7944 | 563.5677 | 11847.1994 | 1688.7809 | 863.1096 |
| United Arab Emirates | 388.7218 | 3161.2723 | 788.1452 | 555.5234 | 563.5679 | 7694.2533 | 1629.4062 | 859.9142 |
Bootstrap critical values are obtained from 10.000 iterations
Table 9.
Results of asymmetric bootstrap Granger causality test
| Countries | MOBIL ↛ LIFEXP (+) | LIFEXP ↛ MOBIL (+) | ||||||
|---|---|---|---|---|---|---|---|---|
| Wald. Stat. | Bootstrap Critical Values | Wald. Stat. | Bootstrap Critical Values | |||||
| 1% | 5% | 10% | 1% | 5% | 10% | |||
| Brazil | 565.4367 | 3812.3196 | 943.1240 | 604.3860 | 355.6662 | 51619.1036 | 1406.9773 | 843.8296 |
| Chile | 566.0207 | 3642.9238 | 947.0138 | 601.5231 | 355.6657 | 4313.4299 | 1164.7782 | 763.1566 |
| China | 598.9844* | 4841.8460 | 947.0978 | 595.3894 | 355.6657 | 4924.9710 | 1111.9786 | 806.4073 |
| Colombia | 565.9841* | 3722.0261 | 976.0668 | 597.1208 | 355.6657 | 1785.5940 | 1078.0439 | 807.7678 |
| Czechia | 565.9843* | 3492.5442 | 943.6050 | 579.6512 | 355.6656 | 14273.0168 | 1408.8308 | 810.2463 |
| Egypt | 595.9837* | 3667.1669 | 974.6546 | 580.3547 | 355.6656 | 4462.9528 | 1178.5203 | 778.3899 |
| Greece | 588.9837* | 3374.8667 | 948.9745 | 585.8479 | 355.6656 | 41818.2278 | 1386.3481 | 803.9952 |
| Hungary | 565.9839 | 3407.6420 | 944.8847 | 594.4351 | 355.6656 | 77456.9746 | 1392.4886 | 847.0749 |
| India | 595.9836* | 3453.5846 | 943.7163 | 585.6860 | 355.6657 | 4900.7274 | 1106.5492 | 806.6565 |
| Indonesia | 565.9838 | 3598.5045 | 946.9344 | 587.4744 | 355.6657 | 7597.8481 | 1215.3103 | 845.4528 |
| Korea | 565.9839 | 3872.8018 | 984.5980 | 603.1732 | 355.6656 | 87214.6315 | 1402.1667 | 855.8950 |
| Kuwait | 597.9837* | 3832.4529 | 949.3820 | 587.5247 | 355.6656 | 4924.3725 | 1162.5570 | 812.3944 |
| Malaysia | 565.9843 | 4224.3182 | 983.0466 | 604.5276 | 355.6657 | 1764.2725 | 1214.4106 | 773.7504 |
| Mexico | 900.9843* | 3375.2399 | 926.9907 | 603.4964 | 355.6656 | 11854.8331 | 1199.4316 | 772.8167 |
| Peru | 565.9830 | 3366.3168 | 936.7092 | 595.2261 | 355.6656 | 4820.8405 | 1123.1589 | 812.8708 |
| Philippines | 565.9833 | 4181.2511 | 967.3380 | 593.8415 | 355.6656 | 88655.9364 | 1409.1255 | 816.4420 |
| Poland | 565.9837 | 4852.9885 | 977.6153 | 587.1007 | 355.6656 | 78998.9626 | 1162.7511 | 807.4303 |
| Qatar | 565.9908 | 3486.4058 | 922.0948 | 602.0380 | 355.6654 | 1804.2154 | 1258.8576 | 813.3655 |
| Saudi Arabia | 565.9838 | 3485.0640 | 941.3370 | 599.9448 | 355.6656 | 4898.6249 | 1113.0103 | 812.7980 |
| South Africa | 565.9852 | 3848.3770 | 972.9072 | 604.9485 | 355.6656 | 19706.4951 | 1170.5992 | 829.9784 |
| Thailand | 565.9838 | 3891.7516 | 987.9217 | 601.9925 | 355.6656 | 4893.6159 | 1160.9646 | 812.9580 |
| Turkiye | 599.9841* | 3478.3367 | 942.8258 | 583.2738 | 355.6713 | 4959.8749 | 1159.0802 | 837.3508 |
| United Arab Emirates | 565.9838 | 3546.4875 | 943.0716 | 593.8109 | 355.6656 | 4956.4324 | 1162.0672 | 813.4123 |
Bootstrap critical values are obtained from 10.000 iterations
* significant at 10%
Table 10.
Results of asymmetric bootstrap Granger causality test
| Country | INTERNET ↛ LIFEXP (-) | LIFEXP ↛ INTERNET (-) | ||||||
|---|---|---|---|---|---|---|---|---|
| Wald. Stat. | Bootstrap Critical Values | Wald. Stat. | Bootstrap Critical Values | |||||
| 1% | 5% | 10% | 1% | 5% | 10% | |||
| Brazil | 601.8000* | 1885.5791 | 908.2627 | 511.3923 | 673.6025* | 2164.6313 | 1335.5862 | 647.3300 |
| Chile | 608.8014* | 1880.4118 | 908.3144 | 559.2154 | 659.6025* | 3413.0624 | 1336.2877 | 647.3560 |
| China | 602.7589* | 1846.5634 | 908.2799 | 511.2636 | 782.2867* | 2251.6898 | 1136.7039 | 624.0494 |
| Colombia | 701.4623* | 1877.3001 | 893.4974 | 511.2455 | 881.0000* | 2210.2730 | 1326.3740 | 646.9940 |
| Czechia | 600.2706* | 1879.7905 | 802.0624 | 511.1512 | 985.5107* | 1859.9582 | 1336.7869 | 644.1122 |
| Egypt | 503.5255* | 1883.4063 | 905.2983 | 484.1079 | 980.4717* | 1855.7709 | 1277.7051 | 632.6240 |
| Greece | 602.6743* | 3046.5859 | 921.1395 | 559.6518 | 657.4191* | 2165.7440 | 1343.0349 | 647.2314 |
| Hungary | 709.3765* | 1888.5431 | 799.2246 | 484.4059 | 886.8280* | 4263.0216 | 1677.2190 | 804.5299 |
| India | 705.7624* | 2053.5983 | 961.2498 | 559.6407 | 989.5906* | 13460.1502 | 1676.1072 | 821.5879 |
| Indonesia | 601.7881* | 1883.0376 | 907.9066 | 511.2717 | 689.5915* | 2227.9145 | 1229.7021 | 647.0472 |
| Korea | 501.7827* | 1842.9369 | 780.0236 | 484.0532 | 865.9756* | 2225.4575 | 1239.5612 | 646.9657 |
| Kuwait | 701.7699* | 1543.3128 | 896.8213 | 511.2010 | 687.9575* | 2222.3936 | 1325.2219 | 633.7524 |
| Malaysia | 600.9265* | 1885.4935 | 907.9935 | 511.1983 | 775.3794* | 2221.6877 | 1126.7975 | 623.2690 |
| Mexico | 682.7273* | 1877.3300 | 800.5795 | 511.2708 | 990.6249* | 19136.2496 | 1588.6225 | 819.7078 |
| Peru | 697.5982* | 1849.6077 | 906.4144 | 511.1488 | 720.5560* | 2284.1760 | 1220.0038 | 624.0953 |
| Philippines | 704.5323* | 1852.4743 | 706.3812 | 511.0007 | 700.4931* | 2280.3157 | 1340.3830 | 633.5815 |
| Poland | 508.7952* | 1867.4580 | 883.1288 | 480.1159 | 699.4213* | 2275.5458 | 1337.5934 | 646.4503 |
| Qatar | 604.6290* | 1853.7777 | 829.5298 | 511.3587 | 690.5805* | 2286.9815 | 1338.1316 | 647.0331 |
| Saudi Arabia | 601.7393* | 1849.6497 | 891.2299 | 483.7114 | 689.5090* | 2301.8433 | 1335.7199 | 647.0803 |
| South Africa | 708.5846* | 1887.3339 | 908.5727 | 511.3519 | 672.6127* | 2195.3396 | 1346.5409 | 632.6496 |
| Thailand | 794.8346* | 1544.8064 | 908.7169 | 511.3496 | 788.6187* | 2221.0260 | 1345.8264 | 646.9839 |
| Turkiye | 697.6750* | 1889.9811 | 802.8486 | 511.1471 | 981.1980* | 1965.5648 | 1330.7510 | 821.3027 |
| United Arab Emirates | 709.0836* | 1888.7375 | 852.9333 | 511.2591 | 688.4297* | 2226.6251 | 1334.7541 | 647.2732 |
* significant at 10%
Table 11.
Results of asymmetric bootstrap Granger causality test
| Countries | INTERNET ↛ LIFEXP (+) | INTERNET ↛ LIFEXP (+) | ||||||
|---|---|---|---|---|---|---|---|---|
| Wald. Stat. | Bootstrap Critical Values | Wald. Stat. | Bootstrap Critical Values | |||||
| 1% | 5% | 10% | 1% | 5% | 10% | |||
| Brazil | 1604.3982*** | 901.6496 | 712.5125 | 505.8883 | 360.2541 | 5227.3093 | 1374.3320 | 673.3605 |
| Chile | 1604.3798*** | 902.6157 | 712.1273 | 505.8564 | 360.2536 | 6423.5978 | 1527.7549 | 685.1035 |
| China | 1604.3977*** | 902.4996 | 581.5654 | 500.5946 | 360.2537 | 5230.1144 | 1355.4228 | 668.9929 |
| Colombia | 1604.3893*** | 901.4093 | 703.6941 | 501.2596 | 360.2541 | 9682.1689 | 1532.5747 | 684.8797 |
| Czechia | 1604.3916*** | 902.0091 | 710.4013 | 505.4409 | 360.2539 | 9840.3639 | 1533.3168 | 661.2260 |
| Egypt | 1604.4084*** | 902.6015 | 711.8036 | 505.5609 | 360.2535 | 7824.9889 | 1525.9040 | 685.3332 |
| Greece | 1604.3818*** | 869.3635 | 711.6893 | 505.6365 | 360.2540 | 10127.1222 | 1452.8678 | 674.8826 |
| Hungary | 1604.3933*** | 901.2638 | 712.0846 | 505.8536 | 360.2540 | 4991.4586 | 1365.8051 | 666.3999 |
| India | 1604.3942*** | 900.1705 | 711.9872 | 492.8784 | 360.2538 | 4616.2783 | 1415.1645 | 666.4301 |
| Indonesia | 1604.3875*** | 893.0953 | 712.5602 | 501.3657 | 360.2496 | 5283.9756 | 1427.0975 | 659.6398 |
| Korea | 1604.3596*** | 860.7035 | 709.6218 | 505.9109 | 360.2535 | 5303.8168 | 1420.3056 | 583.2947 |
| Kuwait | 1604.3942*** | 902.4183 | 703.7067 | 505.6608 | 360.2534 | 8968.4190 | 1519.5099 | 684.7390 |
| Malaysia | 1604.3963*** | 902.5492 | 712.0071 | 505.7807 | 360.2536 | 4477.4889 | 1406.8260 | 646.8198 |
| Mexico | 1604.0047*** | 837.5743 | 712.5611 | 505.8260 | 360.2536 | 5537.2579 | 1420.8017 | 673.9002 |
| Peru | 1604.3927*** | 900.5327 | 604.8136 | 501.4270 | 360.2535 | 5091.0023 | 1423.2597 | 686.4929 |
| Philippines | 1604.3999*** | 899.4409 | 562.5920 | 474.9731 | 360.2525 | 5514.0054 | 1366.4489 | 666.1510 |
| Poland | 1604.3902*** | 897.6414 | 712.5377 | 505.8737 | 360.2502 | 5090.5121 | 1322.0162 | 660.8177 |
| Qatar | 1604.3893*** | 902.3358 | 594.5828 | 505.7427 | 360.2499 | 5287.8752 | 1410.6584 | 596.1401 |
| Saudi Arabia | 1604.3956*** | 1095.9186 | 794.3599 | 516.0852 | 360.2533 | 4932.5356 | 1425.2956 | 670.1560 |
| South Africa | 1604.3960*** | 893.7262 | 704.3965 | 505.9311 | 360.2533 | 5308.3014 | 1381.9825 | 595.4400 |
| Thailand | 1604.3042*** | 1899.7406 | 779.2146 | 519.6091 | 360.2535 | 9337.6716 | 1522.5854 | 684.6008 |
| Turkiye | 1604.3938*** | 902.2169 | 712.6304 | 492.7523 | 360.2536 | 9956.0164 | 1523.0617 | 679.2175 |
| United Arab Emirates | 1604.3909*** | 902.5361 | 606.0280 | 505.4038 | 360.2535 | 9961.0716 | 1421.1065 | 685.9879 |
* significant at 10%
Secondly, the causality between MOBIL and LIFEXP with positive shocks is tested, and the results in Table 9 indicate a one-way significant causal relationship from MOBIL to LIFEXP in China, Colombia, Czechia, Egypt, Greece, India, Kuwait, and Turkiye in case positive shocks from MOBIL variable. In other words, a positive shock in MOBIL is a Granger cause of increases in LIFEXP (Fig. 2).
Fig. 2.
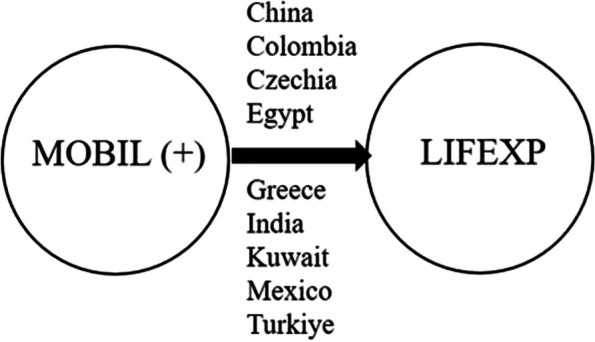
Results of asymmetric bootstrap Granger causality test between MOBIL and LIFEXP (+)
Thirdly, the causality between INTERNET and LIFEXP with negative shocks is tested, and the results in Table 10 indicate a bidirectional causal relationship between INTERNET and LIFEXP in all countries. In other words, a negative shock in INTERNET is a Granger cause of decreases in LIFEXP, and a negative shock in LIFEXP is a Granger cause of decreases in INTERNET (Fig. 3).
Fig. 3.
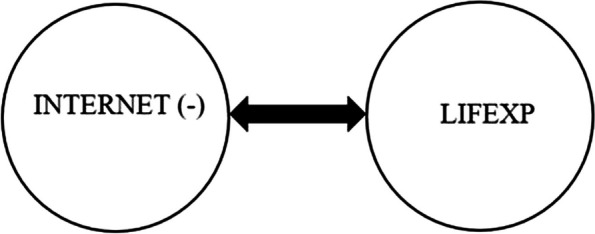
Results of asymmetric bootstrap Granger causality test between INTERNET and LIFEXP (-)
Last, the causality between INTERNET and LIFEXP with positive shocks is tested, and the results in Table 11 indicate a one-way causal relationship from INTERNET to LIFEXP in all countries. In other words, a positive shock in INTERNET is a Granger cause of increases in LIFEXP. However, positive shocks from LIFEXP do not significantly influence the INTERNET (Fig. 4).
Fig. 4.
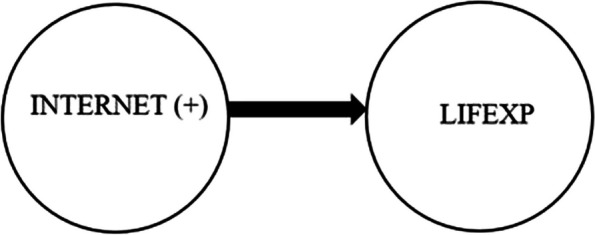
Results of asymmetric bootstrap Granger causality test between INTERNET and LIFEXP (+)
Discussion
ICT theoretically can influence life expectancy via various positive and negative channels such as access and sharing of information about health, preventative health care, healthy nutrition, epidemics, economic growth and development, unemployment, education, environment, green technological progress, energy use, insufficient physical activity, digital addiction, and cyber security problems in the light of related theoretical and empirical literature. Therefore, the net impact of ICT penetration on life expectancy can differ depending on which factors outweigh the others. On the other hand, life expectancy can also affect ICT penetration because people have more time to use and develop the ICT.
Our symmetric causality analysis uncovers a feedback interaction between mobile subscriptions and life expectancy. In other words, both mobile subscriptions and life expectancy affect each other. However, the asymmetric causality test results indicate that increases in mobile subscriptions significantly cause increases in life expectancy in China, Colombia, Czechia, Egypt, Greece, India, Kuwait, Mexico, and Turkiye. Therefore, our findings are compatible with the theoretical considerations and results of Lee and Kim [31], Majeed and Khan [32], Mlambo et al. [36], and Wang et al. [41]. In conclusion, mobile subscriptions are expected to influence life expectancy via multiple channels described in the theoretical and empirical literature.
Our symmetric causality analysis uncovers that internet usage does not significantly affect life expectancy, but life expectancy has a significant effect on internet usage. On the other hand, the results of the asymmetric causality test reveal that internet usage significantly influences life expectancy in the case of both positive and negative shocks in internet usage, which is compatible with theoretical considerations. This finding also verified the asymmetric causality test’s importance in uncovering the hidden interaction between two variables. Furthermore, most of the empirical studies, including Mimbi and Bankole [30], Lee and Kim [31], Alzaid et al. [33], Zhang et al. [38], Byaro et al. [39], and Wang et al. [41] have analyzed the interaction between ICT proxied by internet usage and life expectancy and discovered a significant influence of the Internet on life expectancy through disseminating of health-related information, easing the healthcare services, increasing the early detection and treatment of diseases, and improving the effective and efficient use of clinic time.
Conclusion
Life expectancy is a crucial result indicator of multiple sustainable development goals such as no poverty, zero hunger, good health and well-being, quality education, clean water and sanitation, decent work and economic growth. Therefore, improvements in life expectancy also mean that the relevant societies also progress in overall sustainable development. In this regard, detecting factors underlying sustainable development has become crucial. This study investigates the interaction between ICT indicators of mobile subscription and internet usage and life expectancy through symmetric and asymmetric causality tests.
In the related empirical literature, the researchers have usually represented the ICT by internet usage and mobile subscriptions. However, many social, cultural, demographic, and economic variables have the potential to impact life expectancy. This study centres upon the two-way interplay between ICT indicators and life expectancy by excluding the other possible variables in the analyses. Therefore, our findings are helpful for the nexus between ICT and life expectancy, but the ignored variables can influence the relationship between ICT indicators and life expectancy. Furthermore, the study accepts that all variables are endogenous because they are determined within the model through the causality test. Last, the presence of ICT indicators limits us to conduct the study for the 1997–2020 duration.
The findings of the symmetric causality test uncover that both ICT indicators significantly influence life expectancy when analyzing the causality between two ICT indicators and life expectancy, but mobile subscriptions are the driving factor. On the other hand, the causality test reveals a bidirectional causal relationship between mobile subscriptions and life expectancy and a unidirectional causal interaction between life expectancy and internet usage.
On the other side, the results of the asymmetric causality test uncover a unidirectional causal relationship between mobile subscriptions and life expectancy in China, Colombia, Czechia, Egypt, Greece, India, Kuwait, and Turkiye in case of positive shocks from both variables. Furthermore, a bidirectional causal relationship exists between internet usage and life expectancy in all countries in case of negative shocks from both variables. Lastly, a one-way causal relationship between internet usage and life expectancy in all countries is uncovered in case of positive shocks from internet usage.
Based on the empirical findings of this paper, three significant policy suggestions are made to improve life expectancy through ICT:
First, public and private sectors should encourage ICT infrastructure and ICT services, such as e-health, healthy nutrition, preventative health care, e-government, and e-learning, through financial and regulatory incentives such as tax deductions and cash support. Secondly, education and training programs should be designed to improve digital literacy and ICT adoption. Thirdly, financial incentives and regulations should encourage ICT technologies that support the efficient use of natural resources such as energy and water and sustainable cities.
This research focuses on the nexus between ICT indicators and life expectancy. However, economic, social, cultural, and demographic variables also can impact the nexus between ICT indicators and life expectancy. Therefore, future studies can investigate the impact of the ignored variables, such as educational attainment and cultural differences, on the nexus between ICT and life expectancy.
Abbreviations
- ARDL
Autoregressive Distributed Lag
- BRICS-T
Brazil, Russian Federation, India, China, South Africa, Turkiye
- CIPS
Cross-sectionally augmented Im-Pesaran-Shin
- HPJ
Half-panel jackknife
- ICT
Information and communication technologies
- JKS
Juodis-Karavias-Sarafidis
- LM
Lagrange Multiplier
- LM CD
Lagrange Multiplier Cross-sectional Dependence
- S.D.G.
Sustainable Development Goals
- UNDP
United Nations Development Programme
Authors' contributions
Conceptualization, Y.B., A.O., M.U.S, and M.D.; methodology, Y.B. and M.U.S.; formal analysis, Y.B., A.O., M.U.S, and M.D.; investigation, Y.B., A.O., M.U.S, and M.D.; writing—review and editing, Y.B., A.O., M.U.S, and M.D. All authors reviewed the manuscript.
Funding
This research received no external funding.
Availability of data and materials
The data used in the research is obtained from open-access databases of the UNDP and the World Bank, and further inquiries can be directed to the corresponding author/s.
Declarations
Ethics approval and consent to participate
Not applicable.
Consent for publication
Not applicable.
Competing interests
The authors declare no competing interests.
Footnotes
Publisher’s Note
Springer Nature remains neutral with regard to jurisdictional claims in published maps and institutional affiliations.
References
- 1.Sen A. The economics of life and death. Sci Am. 1993;268(5):40–47. doi: 10.1038/scientificamerican0593-40. [DOI] [PubMed] [Google Scholar]
- 2.UN. The 17 goals. 2023. https://sdgs.un.org/goals . (20 Apr 2023).
- 3.OECD. Life expectancy at birth. 2023. https://data.oecd.org/healthstat/life-expectancy-at-birth.htm . (20 Apr 2023).
- 4.Aburto JM, Villavicencio F, Basellini U, Kjærgaard S, Vaupel JW. Dynamics of life expectancy and life span equality. Proc Natl Acad Sci. 2020;117(10):5250–5259. doi: 10.1073/pnas.1915884117. [DOI] [PMC free article] [PubMed] [Google Scholar]
- 5.Suhrcke M, Rechel B, Michaud C. Development assistance for health in central and Eastern European Region. Bull World Health Organ. 2005;83(12):920–927. [PMC free article] [PubMed] [Google Scholar]
- 6.Archibugi D, Coco A. A new indicator of technological capabilities for developed and developing countries. World Dev. 2004;32(4):629–654. doi: 10.1016/j.worlddev.2003.10.008. [DOI] [Google Scholar]
- 7.UNDP. Human development insights. 2023.https://hdr.undp.org/data-center/country-insights#/ranks . (20 Apr 2023).
- 8.Roser M, Ortiz-Ospina E, Ritchie H. Expectancy L. https://ourworldindata.org/life-expectancy (20 Apr 2023).
- 9.Roser M, Ortiz-Ospina E, Ritchie H. Life expectancy. 2013. https://ourworldindata.org/life-expectancy . (20 Apr 2023).
- 10.Riley JC. Rising life expectancy a global history. USA: Cambridge University Press; 2001. [Google Scholar]
- 11.Wamble DE, Ciarametaro M, Dubois R. The effect of medical technology innovations on patient outcomes, 1990–2015: results of a physician survey. J Manag Care Spec Pharm. 2019;25(1):66–71. 10.18553/jmcp.2018.18083. [DOI] [PMC free article] [PubMed]
- 12.Shah SAR, Zhang Q, Abbas J, Balsalobre-Lorente D, Pila L. Technology, urbanization and natural gas supply matter for carbon neutrality: a new evidence of environmental sustainability under the prism of COP26. Resour Policy. 2023;82:103465. doi: 10.1016/j.resourpol.2023.103465. [DOI] [Google Scholar]
- 13.Zhang Q, Shah SAR, Yang L. An appreciated response of disaggregated energies consumption towards the sustainable growth: a debate on G-10 economies. Energy. 2022;254:124377. doi: 10.1016/j.energy.2022.124377. [DOI] [Google Scholar]
- 14.Zahra S, Shah SAR, Badeeb RA. A sustainable green–blue revolution in Pakistan: a new perspective from quantile regression analysis. Environ Dev Sustain. 2023;25:14975–15002. doi: 10.1007/s10668-022-02698-5. [DOI] [Google Scholar]
- 15.UNDP. Human Development Report 2021–2022, ISBN: 9789211264517, 2022, USA. 2023. https://hdr.undp.org/content/human-development-report-2021-22 . (20.04.2023).
- 16.Mondal MNI, Shitan M. Relative importance of demographic, socioeconomic and health factors on life expectancy in low-and lower-middle-income countries. J Epidemiol. 2014;24(2):117–124. doi: 10.2188/jea.JE20130059. [DOI] [PMC free article] [PubMed] [Google Scholar]
- 17.Khang YH, Yang S, cho hj, jung-choi k, yun sc. Decomposition of Socio-economic differences in Life Expectancy at Birth by Age and cause of death among 4 million South Korean public servants and their dependents. Int J Epidemiol. 2010;39:1656–1666. doi: 10.1093/ije/dyq117. [DOI] [PubMed] [Google Scholar]
- 18.Chen MM, Wagner DP. Gains in mortality from biomedical research 1930–1975: an initial assessment. Social Sci Med Part C: Med Econ. 1978;12(1–2):73–81. doi: 10.1016/0160-7995(78)90023-0. [DOI] [Google Scholar]
- 19.Chan MF, Devi MK. Factors affecting life expectancy: evidence from 1980–2009 data in Singapore, Malaysia, and Thailand. Asia Pasific J Public Health. 2012;27(2):136–146. doi: 10.1177/1010539512454163. [DOI] [PubMed] [Google Scholar]
- 20.Bulled NL, Sosis R. Examining the relationship between life expectancy, reproduction, and educational attainmen. Hum Nat. 2010;21:269–289. doi: 10.1007/s12110-010-9092-2. [DOI] [Google Scholar]
- 21.Lin CC, Rogot E, Johnson NJ, Sorlie PD, Arias E. A further study of life expectancy by socioeconomic factors in the national longitudinal mortality study. Ethn Dis. 2003;13(2):240–247. [PubMed] [Google Scholar]
- 22.Mirowsky J, Ross CE. Socioeconomic status and subjective life expectancy. Social Psychol Q. 2000;63(2):133–151. doi: 10.2307/2695888. [DOI] [Google Scholar]
- 23.Feinstein JS. The relationship between Socioeconomic Status and Health: a review of the literature. Milbank Q. 1993;71(2):279–322. doi: 10.2307/3350401. [DOI] [PubMed] [Google Scholar]
- 24.Bayın G. Doğuşta ve İleri Yaşta Beklenen Yaşam Sürelerine Etki Eden Faktörlerin Belirlenmesi. Türk Aile Hek Derg. 2016;20(3):93–103. doi: 10.15511/tahd.16.21693. [DOI] [Google Scholar]
- 25.Sing GK, Siahpush M. Widening Rural–Urban disparities in Life Expectancy, U.S., 1969–2009. Prev Med. 2014;46(2):19–29. doi: 10.1016/j.amepre.2013.10.017. [DOI] [PubMed] [Google Scholar]
- 26.Araki S, Katsuyuki M. Factors affecting the longevity of total Japanese population. Tohoku J Exp Med. 1987;151(1):15–24. doi: 10.1620/tjem.151.15. [DOI] [PubMed] [Google Scholar]
- 27.Pathirathne L, Sooriyarachchi R. Factors affecting life expectancy: a global perspective. J Environ Prot Sustainable Dev. 2019;5(1):14–21. [Google Scholar]
- 28.Taskaya S, Demirkiran M. Environmental determinants of life expectancy at birth in Turkey. Int J Res Med Sci. 2016;4(4):995–999. doi: 10.18203/2320-6012.ijrms20160673. [DOI] [Google Scholar]
- 29.Mithas S, Khuntia J, Aqarwal R. Information technology and life expectancy: a country-level analysis. ICIS 2009 Proceeding. 2009; 146. https://aisel.aisnet.org/icis2009/146/.
- 30.Mimbi L, Bankole FO. ICT and Health System Performance in Africa: a Multi-Method Approach, ACIS 2015 Proceedings 1. 2015. https://aisel.aisnet.org/acis2015/1/. (27.04.2023).
- 31.Lee CW, Kim MS. Relationship between internet environment and life expectancy in Asia. Rev Integr Bus Econ Res. 2019;8(2):70–80. [Google Scholar]
- 32.Majeed MT, Khan FN. Do Information and Communication Technologies (ICTs) contribute to health outcomes? An empirical analysis. Qual Quant. 2019;53(1):183–206. doi: 10.1007/s11135-018-0741-6. [DOI] [Google Scholar]
- 33.Alzaid A, Komal K, Al-Maraghi A, Alsulami M. Examining the relationship between the internet and life expectancy. In: 24Th International Business Information Management Association Conference-Crafting Global Competitive Economies. 2020. pp. 1142–1151.
- 34.Shao M, Jing F, Zishan H, Mingyang C. The Impact of Information and Communication Technologies (ICTs) on Health outcomes: a mediating effect analysis based on cross-national panel data. J Environ Public Health. 2022;10:2225723. doi: 10.1155/2022/2225723. [DOI] [PMC free article] [PubMed] [Google Scholar]
- 35.Ronaghi MH. The impact of information and communication technology on life expectancy in the Middle East. Depiction Health. 2022;13(1):59–69. doi: 10.34172/doh.2022.05. [DOI] [Google Scholar]
- 36.Mlambo C, Sibanda K, Ntshangase B, Mvuyana B. ICT and women’s health: an examination of the impact of ICT on maternal health in SADC States. In Healthcare. 2022;10(5):802. doi: 10.3390/healthcare10050802. [DOI] [PMC free article] [PubMed] [Google Scholar]
- 37.Rahman MM, Alam K. Effects of globalization, energy consumption and ICT on health status in Australia: the role of financial development and education. BMC Public Health. 2022 22:1565. 10.1186/s12889-022-13911-5. [DOI] [PMC free article] [PubMed]
- 38.Zhang X, Zhang X, Yue XG, Mustafa F. Assessing the effect of bilateral trade on health in the Asian region: does digitization matter? Front Public Health. 2022;9:802465. doi: 10.3389/fpubh.2021.802465. [DOI] [PMC free article] [PubMed] [Google Scholar]
- 39.Byaro M, Rwezaula A, Ngowi N. Does internet use and adoption matter for better health outcomes in sub-saharan African countries? New evidence from panel quantile regression. Technological Forecast Social Change. 2023;191:122445. doi: 10.1016/j.techfore.2023.122445. [DOI] [Google Scholar]
- 40.Ilikkan Özgür M, Demirtaş C, Örtlek Z. The Effect of Information Communication Technology (ICT) on health outcomes: evidence from BRICS-T countries. İktisadi İdari ve Siyasal Araştırmalar Dergisi (İKTİSAD) 2022;7:678–697. doi: 10.25204/iktisad.1023768. [DOI] [Google Scholar]
- 41.Wang W, Khelfaoui I, Ahmed D, Xie Y, Hafeez M, Meskher H. Exus between information and communication technologies and life expectancies of low-income countries: does technological advancement increase their life span? SSM Popul Health. 2024;25:101600. doi: 10.1016/j.ssmph.2023.101600. [DOI] [PMC free article] [PubMed] [Google Scholar]
- 42.Vaidean VL, Achim MV. When more is less: do information and Communication Technologies (ICTs) improve Health outcomes? An empirical investigation in a non-linear Framework. Socio-Economic Plann Sci. 2022;80:1–20. doi: 10.1016/j.seps.2021.101218. [DOI] [Google Scholar]
- 43.Rubaj P. Emerging markets as key drivers of the global economy. Eur Res Stud J. 2023;26(4):431–445. doi: 10.35808/ersj/3294. [DOI] [Google Scholar]
- 44.UNDP. Human development reports. 2023 https://hdr.undp.org/data-center/documentation-and-downloads (10 Apr 2023).
- 45.World Bank. Individuals using the internet (% of population). 2023. https://data.worldbank.org/indicator/IT.NET.USER.ZS . (10 Apr 2023).
- 46.World Bank. Mobile cellular subscriptions (per 100 people). 2023 https://data.worldbank.org/indicator/IT.CEL.SETS.P2 (10 Apr 03).
- 47.Coelho TR, Segatto AP, Frega JR. Analysing ICT and development from the perspective of the capabilities .pproach: a study in South Brazil. Electron J Inform Syst Developing Ctries (EJISDC) 2015;67:1–14. doi: 10.1002/j.1681-4835.2015.tb00480.x. [DOI] [Google Scholar]
- 48.Latif Z, Mengke Y, Danish; Latif S, Xiemi L, Pathan ZH, Salam S, Jianqiu Z. The dynamics of ICT, Foreign Direct Investment, globalization and economic growth: panel estimation robust to heterogeneity and cross-sectional dependence. Telemat Inf. 2018;35(2):318–328. doi: 10.1016/j.tele.2017.12.006. [DOI] [Google Scholar]
- 49.Summak MS, Baǧlibel M, Samancioǧlu M. Technology readiness of primary school teachers: a case study in Turkey. Procedia-Social Behav Sci. 2010;2:2671–2675. doi: 10.1016/j.sbspro.2010.03.393. [DOI] [Google Scholar]
- 50.Ferguson T. Online patient-helpers and physicians working together: a new partnership for high quality health care. BMJ. 2000;321(7269):1129. doi: 10.1136/bmj.321.7269.1129. [DOI] [PMC free article] [PubMed] [Google Scholar]
- 51.Broom A. Virtually healthy: the impact of internet use on disease experience and the doctor-patient relationship. Qual Health Res. 2005;15(3):325–345. doi: 10.1177/1049732304272916. [DOI] [PubMed] [Google Scholar]
- 52.Laing A, Hogg G, Winkelman D. Healthcare and the information revolution: re-configuring the healthcare service encounter. Health Serv Manag Res. 2004;17(3):188–199. doi: 10.1258/0951484041485584. [DOI] [PubMed] [Google Scholar]
- 53.Gerber BS, Eiser AR. The patient-physician relationship in the internet age: future prospects and the research agenda. J Med Internet Res. 2001;3(2):e15. doi: 10.2196/jmir.3.2.e15. [DOI] [PMC free article] [PubMed] [Google Scholar]
- 54.HealthHub. 9 Health hazards of electronic devices for kids. 2023. https://www.healthhub.sg/live-healthy/1099/9-health-hazards-of-electronic-devices-for-kids . (30 Apr 2023).
- 55.Zheng Y, Wei D, Li J, Zhu T, Ning H. Internet use and its impact on individual Physical Health. IEEE Access. 2016;4:5135–5142. doi: 10.1109/ACCESS.2016.2602301. [DOI] [Google Scholar]
- 56.Aziz N, Nordin MJ, Abdulkadir SJ, Salih MMM. Digital Addiction: systematic review of computer game addiction impact on adolescent physical health. Electronics. 2021;10:996. doi: 10.3390/electronics10090996. [DOI] [Google Scholar]
- 57.Adam IO, Alhassan MD. The Effect of Mobile phone penetration on the quality of life. Telecomm Policy. 2021;45:1–10. doi: 10.1016/j.telpol.2021.102109. [DOI] [Google Scholar]
- 58.Shah SAR, Naqvi SAA, Nasreen S, Abbas N. Associating drivers of economic development with environmental degradation: fresh evidence from Western Asia and North African region. Ecol Ind. 2021;126:107638. doi: 10.1016/j.ecolind.2021.107638. [DOI] [Google Scholar]
- 59.Naqvi SAA, Shah SAR, Anwar S, Raza H. Renewable energy, economic development, and ecological footprint nexus: fresh evidence of renewable energy environment Kuznets curve (RKC) from income groups. Environ Sci Pollut Res. 2021;28:2031–2051. doi: 10.1007/s11356-020-10485-w. [DOI] [PubMed] [Google Scholar]
- 60.Balsalobre-Lorente D, Abbas J, He C, Pilai L, Shah SAR. Tourism, urbanization and natural resources rents matter for environmental sustainability: the leading role of AI and ICT on sustainable development goals in the digital era. Resour Policy. 2023;82:103445. doi: 10.1016/j.resourpol.2023.103445. [DOI] [Google Scholar]
- 61.Magazzino C, Porrini D, Fusco G, Schneider N. Investigating the link among ICT, electricity consumption, air pollution, and economic growth in EU Countries. Energy Sources Part B: Econ Plann Policy. 2021;16(11–12):976–998. doi: 10.1080/15567249.2020.1868622. [DOI] [Google Scholar]
- 62.Osibanjo O, Nnorom IC. The challenge of electronic waste (e-waste) management in developing countries. Waste Manage Res. 2007;25(6):489–501. doi: 10.1177/0734242X07082028. [DOI] [PubMed] [Google Scholar]
- 63.Rogoff K. The impact of technology on employment. In: World Economic Forum, 2. 2012. https://www.weforum.org/agenda/2012/10/king-ludd-is-still-dead/?DAG=3&gclid=CjwKCAjwkLCkBhA9EiwAka9QRs9a_84hKyJ0elJrhihCMTJs_oWHhnZNPsvrf_OE3T3qx8BGOHgsCRoCcqAQAvD_BwE
- 64.Frey CB, Osborne MA. The future of employment: how susceptible are jobs to computerisation? Technol Forecast Soc Chang. 2017;114:254–280. doi: 10.1016/j.techfore.2016.08.019. [DOI] [Google Scholar]
- 65.Patra NK, Konyak S, Das S, Sashilila A, Gamlin M, Sahu AK. Assessing Socio-economic and modernization status of King Chilli (Capsicum spp.) growers: evidence from Nagaland, North East India. J Community Mobilization Sustainable Dev. 2018;14(1):97–103. [Google Scholar]
- 66.Sultana N, Rahman MM, Khanam R. The Effect of the informal sector on sustainable development: evidence from developing countries. Bus Strategy Dev. 2022;5(4):437–451. doi: 10.1002/bsd2.217. [DOI] [Google Scholar]
- 67.Benotsmane R, Kovács G, Dudás L. Economic, social impacts and operation of smart factories in industry 4.0 focusing on simulation and artificial intelligence of collaborating robots. Social Sci. 2019;8(5):143. doi: 10.3390/socsci8050143. [DOI] [Google Scholar]
- 68.Elisha MJ. The application of Information and Communication Technology (ICT) in Nigerian academic libraries prospects and problems. Inform Manager (the) 2006;6(1):35–39. [Google Scholar]
- 69.Ebaidalla EM. Effect of ICTs on youth unemployment in Sub Saharan Africa: A panel data analysis. African Economic Conference on “Knowledge and Innovation for Africa’s Transformation”, Abidjan, Cote d’Ivoire. 2014. https://www.afdb.org/fileadmin/uploads/afdb/Documents/Publications/AEC_-_2014_-_Effect_of_ICTs_on_Youth_Unemployment_in_Sub_Saharan_Africa.pdf.
- 70.Virgillito ME. Rise of the robots: technology and the threat of a jobless future. Labor Hist. 2017;58(2):240–242. doi: 10.1080/0023656X.2016.1242716. [DOI] [Google Scholar]
- 71.Acemoglu D, Restrepo P. Robots and Jobs: evidence from US labor markets. J Polit Econ. 2020;128(6):2188–2244. doi: 10.1086/705716. [DOI] [Google Scholar]
- 72.UKEssays. November. Is ICT Creating Unemployment. 2018. https://www.ukessays.com/essays/economics/is-ict-creating-unemployment-economics-essay.php?vref=1 . (30 Apr 2023).
- 73.Ahuru RR, Osabohien R, Al-Faryan MAS, Sowemimo EJ. Information and communication technology adoption and unemployment in West Africa monetary zone. Manag Decis Econ. 2023;44(1):388–398. doi: 10.1002/mde.3688. [DOI] [Google Scholar]
- 74.Bordot F. Artificial Intelligence, Robots and unemployment: evidence from OECD countries. J Innov Econ Manage. 2022;1:117–138. doi: 10.3917/jie.037.0117. [DOI] [Google Scholar]
- 75.Bankole FO, Shirazi F, Brown I. Investigating the impact of ICT investments on human development. Electron J Inform Syst Developing Ctries. 2011;48(8):1–19. [Google Scholar]
- 76.Badri AK, Badri PK, Cham M. ICT and human development in selected devolving countries. Int J Social Sci Perspect. 2019;5(2):30–35. [Google Scholar]
- 77.Ali MA, Alam K, Taylor B, Rafiq S. Does digital inclusion affect quality of life? Evidence from Australian household panel data. Telematics Inform. 2020;51:101405. doi: 10.1016/j.tele.2020.101405. [DOI] [Google Scholar]
- 78.Alderete MV. Examining the ICT access effect on socioeconomic development: the moderating role of ICT use and skills. Inform Technol Dev. 2017;23(1):42–58. doi: 10.1080/02681102.2016.1238807. [DOI] [Google Scholar]
- 79.Aksentijević NK, Ježić Z, Zaninović PA. The effects of information and communication technology (ICT) use on human development—a macroeconomic approach. Economies. 2021;9(3):1–12. [Google Scholar]
- 80.Adegboye A, Ojeka SA, Tolase O, Omoremi O, Jude-Okeke Y. Technology penetration and human development nexus in middle-income countries: the synergy effect of inclusive resources distribution. Inform Technol Dev. 2022;28(4):860–874. doi: 10.1080/02681102.2021.2008850. [DOI] [Google Scholar]
- 81.Jayaprakash, P., Radhakrishna Pillai, R. The role of ICT for sustainable development: a cross-country analysis. Eur J Dev Res. 2022;34:225–247. 10.1057/s41287-021-00369-1.
- 82.Juodis A, Karavias Y, Sarafidis V. A homogeneous approach to testing for granger non–causality in heterogeneous panels. Empirical Economics. 2021;60(1):93–112. doi: 10.1007/s00181-020-01970-9. [DOI] [Google Scholar]
- 83.Yılancı V, Aydın MO. Prices and stock prices: an asymmetric panel causality approach. J Appl Res Financ Econ. 2017;2:9–19. [Google Scholar]
- 84.Dhaene G, Jochmans K. Split-panel jackknife estimation of fixed-effect models. Rev Econ Stud. 2015;82(3):991–1030. doi: 10.1093/restud/rdv007. [DOI] [Google Scholar]
- 85.Dumitrescu E-I, Hurlin C. Testing for granger non-causality in heterogeneous panels. Econ Model. 2012;29(4):1450–1460. doi: 10.1016/j.econmod.2012.02.014. [DOI] [Google Scholar]
- 86.Kónya L. Exports and growth: granger causality analysis on OECD countries with a panel data approach. Econ Model. 2006;23:978–992. doi: 10.1016/j.econmod.2006.04.008. [DOI] [Google Scholar]
- 87.Hatemi JA. Asymmetric causality tests with an application. Empir Econ. 2012;43:447–456. doi: 10.1007/s00181-011-0484-x. [DOI] [Google Scholar]
- 88.Breusch TS, Pagan AR. The lagrange multiplier test and its applications to model specification tests in econometrics. Rev Econ Stud. 1980;47:239–253. doi: 10.2307/2297111. [DOI] [Google Scholar]
- 89.Pesaran MH. General diagnostic tests for cross section dependence in panels; working paper, CWPE 0435. Cambridge, UK: University of Cambridge; 2004. [Google Scholar]
- 90.Pesaran MH, Ullah A, Yamagata TA. A bias-adjusted LM test of error cross-section independence. Econom J. 2008;11:105–127. doi: 10.1111/j.1368-423X.2007.00227.x. [DOI] [Google Scholar]
- 91.Pesaran MH, Yamagata T. Testing slope homogeneity in large panels. J Econom. 2008;142:50–93. doi: 10.1016/j.jeconom.2007.05.010. [DOI] [Google Scholar]
- 92.Pesaran MH. A simple panel unit root test in the presence of cross-section dependence. J Appl Econom. 2007;22:265–312. doi: 10.1002/jae.951. [DOI] [Google Scholar]
Associated Data
This section collects any data citations, data availability statements, or supplementary materials included in this article.
Data Availability Statement
The data used in the research is obtained from open-access databases of the UNDP and the World Bank, and further inquiries can be directed to the corresponding author/s.