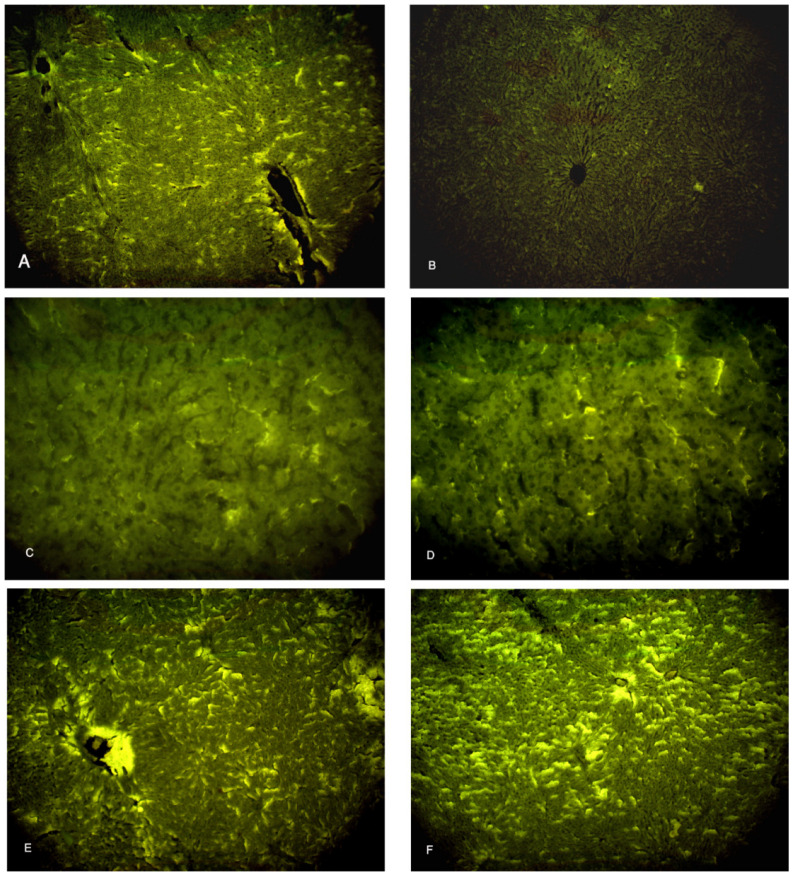
Figure 8.
Photomicrographs of the liver tissue. (A) Group I shows a moderate immunofluorescent yellow-green reaction. (B) Group II shows a minimal immunofluorescent yellow-green reaction. (C,D) Groups III and IV show moderate immunofluorescent yellow-green reactions. (E,F) Groups V and VI show increased immunofluorescent yellow-green reactions. Ki-67 ×100.

