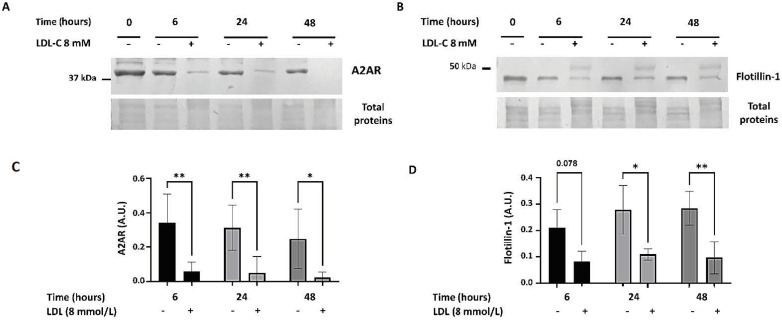
Figure 4.
A2AR and Flotillin-1 expression decreases in PBMCs after incubation with LDL-C enriched (8 mM) medium. PBMCs (T0) were incubated with (+) or without (−) LDL-C enriched (8 mM final concentration) medium for 6, 24 and 48 h. Representative image of the A2AR 45 kDa band (A) and the Flotillin-1 47 kDa band (B) visualized by Western blot. After Western blotting and Image J densitometry analysis, A2AR and Flotillin-1 expression is shown in arbitrary units (A.U.) as the ratio of the intensities between the A2AR or Flotillin-1 band and the stained total protein band. Data are represented as mean ± SD from five separate experiments (for A2AR) and three experiments (Flotillin-1). A 2-way ANOVA test was performed, p ≤ 0.05 *; p ≤ 0.001 ** (C,D).

